WO2016132931A1 - エリア単位太陽光発電発電量推定装置および方法 - Google Patents
エリア単位太陽光発電発電量推定装置および方法 Download PDFInfo
- Publication number
- WO2016132931A1 WO2016132931A1 PCT/JP2016/053450 JP2016053450W WO2016132931A1 WO 2016132931 A1 WO2016132931 A1 WO 2016132931A1 JP 2016053450 W JP2016053450 W JP 2016053450W WO 2016132931 A1 WO2016132931 A1 WO 2016132931A1
- Authority
- WO
- WIPO (PCT)
- Prior art keywords
- power generation
- power
- area
- active
- solar
- Prior art date
- Legal status (The legal status is an assumption and is not a legal conclusion. Google has not performed a legal analysis and makes no representation as to the accuracy of the status listed.)
- Ceased
Links
Images

Classifications
-
- G—PHYSICS
- G01—MEASURING; TESTING
- G01W—METEOROLOGY
- G01W1/00—Meteorology
- G01W1/12—Sunshine duration recorders
-
- H—ELECTRICITY
- H02—GENERATION; CONVERSION OR DISTRIBUTION OF ELECTRIC POWER
- H02J—CIRCUIT ARRANGEMENTS OR SYSTEMS FOR SUPPLYING OR DISTRIBUTING ELECTRIC POWER; SYSTEMS FOR STORING ELECTRIC ENERGY
- H02J3/00—Circuit arrangements for AC mains or AC distribution networks
-
- H—ELECTRICITY
- H02—GENERATION; CONVERSION OR DISTRIBUTION OF ELECTRIC POWER
- H02J—CIRCUIT ARRANGEMENTS OR SYSTEMS FOR SUPPLYING OR DISTRIBUTING ELECTRIC POWER; SYSTEMS FOR STORING ELECTRIC ENERGY
- H02J3/00—Circuit arrangements for AC mains or AC distribution networks
- H02J3/38—Arrangements for parallely feeding a single network by two or more generators, converters or transformers
-
- H—ELECTRICITY
- H02—GENERATION; CONVERSION OR DISTRIBUTION OF ELECTRIC POWER
- H02S—GENERATION OF ELECTRIC POWER BY CONVERSION OF INFRARED RADIATION, VISIBLE LIGHT OR ULTRAVIOLET LIGHT, e.g. USING PHOTOVOLTAIC [PV] MODULES
- H02S50/00—Monitoring or testing of PV systems, e.g. load balancing or fault identification
-
- Y—GENERAL TAGGING OF NEW TECHNOLOGICAL DEVELOPMENTS; GENERAL TAGGING OF CROSS-SECTIONAL TECHNOLOGIES SPANNING OVER SEVERAL SECTIONS OF THE IPC; TECHNICAL SUBJECTS COVERED BY FORMER USPC CROSS-REFERENCE ART COLLECTIONS [XRACs] AND DIGESTS
- Y02—TECHNOLOGIES OR APPLICATIONS FOR MITIGATION OR ADAPTATION AGAINST CLIMATE CHANGE
- Y02E—REDUCTION OF GREENHOUSE GAS [GHG] EMISSIONS, RELATED TO ENERGY GENERATION, TRANSMISSION OR DISTRIBUTION
- Y02E10/00—Energy generation through renewable energy sources
- Y02E10/50—Photovoltaic [PV] energy
- Y02E10/56—Power conversion systems, e.g. maximum power point trackers
-
- Y—GENERAL TAGGING OF NEW TECHNOLOGICAL DEVELOPMENTS; GENERAL TAGGING OF CROSS-SECTIONAL TECHNOLOGIES SPANNING OVER SEVERAL SECTIONS OF THE IPC; TECHNICAL SUBJECTS COVERED BY FORMER USPC CROSS-REFERENCE ART COLLECTIONS [XRACs] AND DIGESTS
- Y04—INFORMATION OR COMMUNICATION TECHNOLOGIES HAVING AN IMPACT ON OTHER TECHNOLOGY AREAS
- Y04S—SYSTEMS INTEGRATING TECHNOLOGIES RELATED TO POWER NETWORK OPERATION, COMMUNICATION OR INFORMATION TECHNOLOGIES FOR IMPROVING THE ELECTRICAL POWER GENERATION, TRANSMISSION, DISTRIBUTION, MANAGEMENT OR USAGE, i.e. SMART GRIDS
- Y04S10/00—Systems supporting electrical power generation, transmission or distribution
- Y04S10/50—Systems or methods supporting the power network operation or management, involving a certain degree of interaction with the load-side end user applications
Definitions
- the present invention relates to estimating the amount of power generated by a solar power generation device, and more particularly to an apparatus and method for estimating the amount of power generated by solar power generation in units of areas.
- Non-Patent Document 1 introduces a photovoltaic power generation output estimation method based on the power factor method.
- the power factor method is outlined below.
- a plurality of plots are printed according to Q, and load characteristics of the power system are specified in advance by, for example, linear approximation processing based on the plurality of plots.
- plots are plotted on the coordinate plane of the previous active power P and reactive power Q in accordance with real-time active power P and reactive power Q (measured at intervals of 10 seconds, for example) measured in bank units of the substation.
- the solar power generation outputs only active power P. Therefore, when the reactive power is Q1, if the active power obtained from the load characteristics specified in advance of the power system is P 0 and the measured value of the real-time active power P is P 1 , the photovoltaic power output is the load It can be obtained as the difference between the active power P 0 obtained from the characteristics and the real-time active power P.
- the merit of the power factor method is that every time the active power P or reactive power Q is measured in the bank unit of the substation, the solar power output at that time can be calculated, so the solar power output is estimated frequently. Is that you can.
- Patent Document 1 is another existing technology for estimating the photovoltaic power generation output.
- the photovoltaic power generation situation prediction device 10 includes a power generation capacity DB 31 that stores the identification information of an area that has been divided in advance and facility information related to solar power generation facilities in the area in association with each other, At predetermined time intervals, the solar radiation data in a pre-divided area is received, meteorological data is received from the weather server 103 that transmits meteorological data, and the received solar radiation data and the received weather data are used. Estimate the amount of solar radiation for a certain period of time for each pre-divided area, and calculate the amount of solar power generation for each pre-classified area based on the estimated power generation DB 31 based on the estimated amount of solar radiation. The amount of power generated is transmitted to the monitoring system 108 that monitors the power system. "
- Non-Patent Document 1 In order to accurately calculate the photovoltaic power generation output in the method described in Non-Patent Document 1, it is necessary to accurately generate the load characteristics of the power system. However, for that purpose, there is a problem that it is necessary to stop all the photovoltaic power generation apparatuses on the demand side.
- Patent Document 1 has a problem that the solar power generation output cannot be estimated in a short period such as several seconds because weather satellite image information can be acquired only in a long period (for example, every 30 minutes).
- Non-Patent Document 1 In order to accurately calculate the photovoltaic power output by the power factor method described in Non-Patent Document 1, there is a problem that it is necessary to stop all the photovoltaic power generation devices on the demand side.
- the load characteristics of substation banks differ depending on the bank in which the photovoltaic power generation equipment is installed, and also change depending on the number of consumers there. Therefore, the load characteristics of each bank can be accurately and accurately grasped. There is also a problem that it is difficult to do.
- Patent Document 1 describes a method for estimating solar power generation output based on weather satellite image information.
- the method described in Patent Document 1 can be estimated only at a long period (for example, every 30 minutes). There is a problem.
- an area unit for estimating the amount of photovoltaic power generation in the electrical downstream region of the information input point of the transmission and distribution system capable of obtaining active power and reactive power
- a solar power generation amount estimation device which is a short-period PQ measurement information acquisition function for acquiring active power and reactive power at an information input point in a short cycle, and a solar in an electrical downstream region of the information input point of a power transmission and distribution system Solar obtained by long-period area unit photovoltaic power generation output estimation function and long-period area unit photovoltaic power generation output estimation function to obtain the amount of active power and reactive power generated by photovoltaic power generation in the long period from the amount of solar radiation in the downstream area Calculate the active power and reactive power when solar power is stopped from the active power and reactive power generated by the multiple power and reactive power generated by photovoltaic power generation and the short-period PQ measurement information acquisition function.
- an area-unit photovoltaic power generation amount estimation method for estimating the amount of photovoltaic power generation in an electrical downstream region of an information input point of a transmission / distribution system capable of obtaining active power and reactive power
- the active power and reactive power at the information input point are acquired in a short cycle, and the amount of active power and reactive power generated by solar power generation in the electrical downstream area of the information input point of the transmission and distribution system is calculated on the downstream side.
- Active power at the time of photovoltaic power generation stoppage is obtained from the amount of active power and reactive power generated by solar power generation acquired in a long cycle from the amount of solar radiation in the region, and from active power and reactive power acquired in a short cycle.
- the reactive power is calculated, the load characteristics indicating the relationship between the active power and the reactive power when the photovoltaic power generation is stopped are derived, and the active power from the photovoltaic power generation is calculated from the active power and reactive power acquired in a short cycle. To estimate the power generation amount of reactive power.
- the photovoltaic power generation output can be estimated with high frequency.
- FIG. 1 The figure which shows the whole structure of the area unit photovoltaic power generation amount estimation apparatus which concerns on this invention.
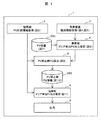
- the flowchart which shows the process of the long period area unit photovoltaic power generation output estimation function 4.
- FIG. The figure which shows the table definition of photovoltaic power generation capacity database DB1.
- FIG. 1 The flowchart which shows the process of the PQ calculation function 6 at the time of a solar power generation stop.
- the present inventors obtain load characteristics for each bank and solve this problem from the load characteristics and information on short-period active power P and reactive power Q that can be acquired in units of banks.
- the present inventors have developed a mechanism for estimating the amount of photovoltaic power generation that can be estimated only in a long cycle from meteorological satellite image information in a short cycle and for each bank unit.
- the area unit in this case means that the entire area that is electrically downstream from the information acquisition point is to be monitored.
- the method of estimating the photovoltaic power generation output in units of banks described above is not limited to units of banks, and information on active power P and reactive power Q is obtained for each distribution line unit or transmission line unit. Alternatively, it is possible to estimate the photovoltaic power generation output for each transmission line.
- the area unit of interest in the present invention is an area connected to one feeder (distribution line) when a narrow area is assumed, and from the voltage / current using the vicinity of the feeder circuit breaker as an information input point. Information on active power P and reactive power Q is obtained. When a wider area is assumed, it is an area connected to a plurality of feeders (distribution lines) connected to the bus in the substation. Reactive power Q information is obtained. In this format, a transformer is often installed upstream of the bus, so this case is the closest to a bank unit.
- FIG. 1 is a diagram showing an overall configuration of an area-unit photovoltaic power generation amount estimation apparatus according to the present invention.
- the overall configuration of the estimation apparatus will be described.
- area is defined as “area where power is supplied in bank units of distribution substations”
- reference numeral 1 denotes an area-unit photovoltaic power generation amount estimation device according to the present invention, which is realized by an electronic operation function such as a PC including a storage device and an input / output function (not shown).
- FIG. 1 shows various functions realized by an electronic calculation function and a database DB that holds various data used for executing the functions. Of these, 2 and 3 are input functions for acquiring data from the outside, and 9 is an output function for externally outputting internal calculation results. 4, 6, and 8 correspond to various calculation functions.
- 2 is a function for acquiring information by measuring active power P and reactive power Q in a short cycle (hereinafter simply referred to as a short cycle PQ measurement information acquisition function). This is a function of acquiring measured values of active power P and reactive power Q measured every short cycle (for example, 10 seconds).
- the active power P and the reactive power Q input here are passed to the PQ calculation function 6 at the time of the photovoltaic power generation stop and the short cycle area unit photovoltaic power generation output estimation function 8.
- a meteorological satellite observation information acquisition function which acquires the solar radiation amount information converted from the meteorological satellite image information photographed by the weather satellite into the solar radiation amount information in mesh units (for example, 1 km square mesh). This amount of solar radiation information is acquired in a long cycle (for example, every 30 minutes). The acquired amount of solar radiation information is passed to the long-period area unit photovoltaic power generation output estimation function 4 every time it is acquired.
- This function uses weather satellite observation information for the purpose of obtaining solar radiation information for a wide range of target areas, but if it is possible to obtain ground solar radiation measurement information over a wide range by other means, Substitution is possible.
- DB1 is a photovoltaic power generation capacity database DB1, and stores photovoltaic power generation installation capacity information for each mesh (for example, 1 km square mesh).
- DB2 is a PQ information database when the photovoltaic power generation is stopped, and the active power P and the reactive power Q when the photovoltaic power generation is stopped are recorded.
- the long-period area unit photovoltaic power generation output estimation function 4 has the solar radiation amount information acquired in mesh units acquired from the meteorological satellite observation information acquisition function 3, and the sun. From the photovoltaic power generation installed capacity information for each mesh recorded in the photovoltaic power generation capacity database DB1, the photovoltaic power generation amount of the entire area is calculated at intervals of 30 minutes. Information on the amount of power generated by solar power generation in the entire area is passed to the PQ calculation function 6 when solar power generation is stopped.
- the short period PQ measurement information acquisition function 2 is effective in a short period acquired at intervals of 10 seconds. From the measurement information of the power P and the reactive power Q and the photovoltaic power generation amount information of the entire area calculated by the long-period area unit photovoltaic power generation output estimation function 4 at 30-minute intervals, solar light in area units every 30 minutes The active power P and the reactive power Q corresponding to when the power generation is stopped are calculated.
- the short cycle area unit photovoltaic power generation output estimation function 8 is the solar light at 30-minute intervals recorded in the PQ information database DB2 when the photovoltaic power generation is stopped. Photovoltaic power generation at 10-second intervals from information on active power P and reactive power Q when power generation is stopped, and measurement information on active power P and reactive power Q at 10-second intervals acquired by the short cycle PQ measurement information acquisition function 2 Calculate the output estimate. This calculation result is externally output by the output function 9.
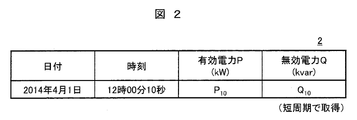
- FIG. 2 is a diagram illustrating an example of output data of the short cycle PQ measurement information acquisition function 2.
- This data is composed of active power P (kw) and reactive power Q (kvar) for each area, and date and time information when these pieces of information are measured.
- the acquisition cycle is a 10-second cycle (short cycle).
- the area unit means, for example, a bank unit of a distribution substation, and its image is shown in FIG.
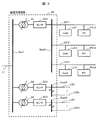
- FIG. 3 is a diagram showing an example of a distribution substation and distribution lines connected thereto. An example of information measurement points acquired by the short period PQ measurement information acquisition function 2 will be described with reference to FIG.
- a typical distribution substation SS is connected to the power transmission line L1 at the power receiving bus Bus1.
- Distribution buses Bus2 (Bus21, Bus22, Bus23) are connected to the receiving buses Bus1 via banks B (transformers: B1, B2, B3), respectively, and to the distribution buses Bus2 (Bus21, Bus22, Bus23).
- a plurality of distribution lines L2 are connected to each other.
- a plurality of customer loads Ld and a plurality of photovoltaic power generation PVs are connected to the distribution line L2.
- the area unit means, for example, a bank unit of a distribution substation. Therefore, when the distribution substation SS in the example of FIG. 3 is expressed in area units, there are three areas connected to the banks B1, B2, and B3.
- the areas connected to the bank B1 include the distribution bus Bus21, the distribution lines L21 (L211, L212, L213), the customer loads Ld1 (Ld11, Ld12, Ld13), and the photovoltaic power generation PV1. (PV11, PV12, PV13).
- the distribution bus Bus22 and the distribution line L22 (L221 to L22n) are described, but in addition to this, the load Ld of the consumer and the photovoltaic power generation PV are included. Further, in the area connected to the bank B3 in FIG. 3, the distribution bus Bus23 and the distribution line L23 (L231 to L23m) are described, but in addition to this, the load Ld of the consumer and the photovoltaic power generation PV are included. .
- the active power P and the reactive power Q used by the short cycle PQ measurement information acquisition function 2 of the area unit photovoltaic power generation amount estimation device 1 of FIG. 1 are amounts grasped in area units. For this reason, the measurement of the active power P and the reactive power Q is installed so that the effective power P and the reactive power Q in the total bank can be grasped.
- the sensors SC SC1, SC2, SC3 are preferably installed on the downstream side of the bank B.
- the information acquired by the meteorological satellite observation information acquisition function 3 is solar radiation amount information converted from meteorological satellite image information captured by the weather satellite into solar radiation amount information in mesh units (for example, 1 km square mesh).
- mesh units for example, 1 km square mesh.
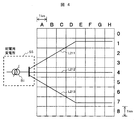
- FIG. 4 is a diagram showing an example of a mesh definition for the power system.
- bank B1 will be taken as an example and will be described as an example of mesh definition.
- the distribution substation SS, the bank B1, the distribution lines L211, L212, and L213 are the same as those described in FIG.
- These areas covered by the distribution lines correspond to the electrical downstream areas at the measurement points (bank positions) of the active power P and the reactive power Q.
- FIG. 5 is a diagram showing an example of information output by the meteorological satellite observation information acquisition function 3.
- the acquisition cycle is 30 minutes (long cycle).
- This information includes date, time, and solar radiation amount information (kW / m 2 ) of each cell whose cell position is A0 or A1.
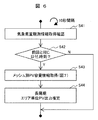
- FIG. 6 is a flowchart showing processing of the long cycle area unit photovoltaic power generation output estimation function 4. This flowchart is executed at intervals of 10 seconds.
- S41 which is the first processing step in the flowchart of FIG. 6, is a function for executing weather satellite observation information acquisition confirmation. This function obtains the latest meteorological satellite observation information (FIG. 5) at the time of processing.
- the date and time information of the meteorological satellite observation information acquired in the current processing step S41 is the same as that of the meteorological satellite observation information (FIG. 5) acquired in the previous processing step S41 10 seconds ago. Determine whether they are different.
- the process proceeds to processing step S43. If the date and time are the same between the current acquisition information and the previous acquisition information, the process ends (N).
- meteorological satellite observation information (FIG. 5) is acquired at intervals of 30 minutes
- the processing after processing step S43 is performed at a cycle of once every 30 minutes.
- processing step S43 which is a substantial process as the long cycle area unit photovoltaic power generation output estimation function 4
- mesh-specific photovoltaic power generation capacity information is acquired from the photovoltaic power generation capacity database DB1.
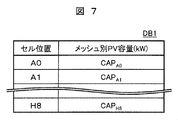
- An example of the table definition of the photovoltaic power generation capacity database B1 is shown in FIG.
- the photovoltaic power generation capacity (kW) for each cell position is recorded.
- the solar power generation capacity at the cell position A0 is CAP A0
- the long cycle area unit photovoltaic power generation output is estimated. This function is based on the solar radiation amount information (kW / m 2 ) for each cell position acquired in processing step S41 and the solar power generation capacity (kW) for each cell position acquired in processing step S43. Estimate power generation output. The solar power generation output for each area is calculated using the formulas (1) and (2).
- requires active power P 1800 as a photovoltaic power generation output of an area unit
- CAP (n) is the photovoltaic power generation capacity (kW) at the cell position n
- R is the sun.
- SR (n) is the solar radiation amount (kW / m 2 ) at the cell position n
- cos ⁇ is the power factor of photovoltaic power generation.
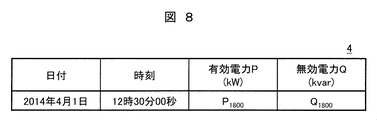
- FIG. 8 is a diagram showing an example of output information of the long-period area unit photovoltaic power generation output estimation function 4 of FIG. 1 whose processing flow is shown in FIG.
- An example of this output information is composed of date (April 1, 2014), time (12:30:30), active power P (kw) (P 1800 ), and reactive power Q (kvar) (Q 1800 ).
- the active power P 1800 corresponds to the calculation result of the formula (1)
- the reactive power Q 1800 corresponds to the calculation result of the formula (2).
- FIG. 9 is a flowchart showing the processing of the PQ calculation function 6 when the photovoltaic power generation is stopped in FIG. This flowchart is executed at intervals of 10 seconds as in the cycle in the processing flow of the long cycle area unit photovoltaic power generation output estimation function 4.
- S61 which is the first processing step in the flowchart of FIG. 9, the latest short period PQ measurement information is acquired.
- This function acquires the latest information shown in FIG. 2 at the time of execution of this process, from the measurement information of the short cycle active power P and reactive power Q acquired by the short cycle PQ measurement information acquisition function 2 at intervals of 10 seconds. .
- the latest long cycle area unit photovoltaic power generation output information is acquired.
- the latest information shown in FIG. 8 at the time of execution of this process is acquired from the area unit photovoltaic power generation output estimation information output by the long-period area unit photovoltaic power generation output estimation function 4 in FIG. 1 at intervals of 30 minutes. .
- processing step S63 the latest information acquired from the short cycle PQ measurement information acquisition function 2 (FIG. 2) and the latest information acquired from the long cycle area unit photovoltaic power generation output estimation function 4 are compared (FIG. 8). To do. If both time stamps are the same, the process proceeds to step S64.
- the latest information acquired from the short cycle PQ measurement information acquisition function 2 (FIG. 2) is updated at 10-second intervals, but the latest information acquired from the long cycle area unit photovoltaic power generation output estimation function 4 (FIG. 8). Is an update at intervals of 30 minutes, the time stamps of both coincide with each other every 30 minutes. For this reason, this flowchart is complete
- processing step S64 the active power P and the reactive power Q when the photovoltaic power generation is stopped are calculated.
- the active power P and reactive power Q in the solar power generation stop state corresponding to the measurement value in the area unit, that is, the position of the sensor SC in FIG. 3 in a state in which the solar power generation of all consumers is stopped. Values corresponding to the measured active power P and reactive power Q are calculated.
- Equation (3) seeking P YYYYMMDD_hhmmss is active power P PV stopping considerable area units
- a reactive power Q of the photovoltaic power generation stop corresponding area unit Q YYYYMMDD_hhmmss (4) is what is calculated.
- the symbol “YYYYMMDD” given to these represents a date (year / month / day), and “hhmmss” represents a time (hour / minute / second).
- P 10 is the active power P acquired from the short cycle PQ measurement information acquisition function 2
- P 1800 is the area unit solar power output estimation value (effective) estimated by the long cycle area unit solar power output estimation function 4.
- Power P is the reactive power Q acquired from the short cycle PQ measurement information acquisition function 2
- Q 1800 is the area unit solar power output estimation value (reactive power) estimated by the long cycle area unit solar power output estimation function 4.
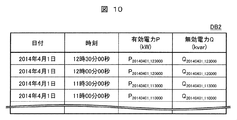
- FIG. 10 is an example of a table definition of the PQ information database DB2 when photovoltaic power generation is stopped.
- the active power P corresponding to the time when the solar power generation is stopped when measuring at the date, time, and the position of the sensor SC, and the reactive power Q corresponding to the time when the solar power generation is stopped when measuring at the position of the sensor SC (each 30) Record in minutes).
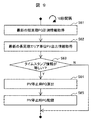
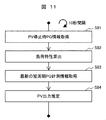
- FIG. 11 is a flowchart showing the processing of the short cycle area unit photovoltaic power generation output estimation function 8. This flowchart is executed at intervals of 10 seconds as in the flow showing the cycle in the processing flow of the long cycle area unit photovoltaic power generation output estimation function 4 or the processing of the PQ calculation function 6 at the time of photovoltaic power generation stop.
- S81 which is the first processing step in the flowchart of FIG. 11, is a function for acquiring PQ information when photovoltaic power generation is stopped.
- This function extracts data that matches the extraction rule from the data recorded in the PQ information database DB2 when the photovoltaic power generation is stopped.
- the extraction rule may be “data recorded within the past 24 hours from the present”.
- the next processing step S82 is a function for calculating load characteristics.
- the data extracted in the processing step S81 is plotted on the PQ coordinate plane with the horizontal axis active power P and the vertical axis reactive power Q, and these linear approximation lines are used as the load characteristics. It is possible.
- Processing step S83 is a function for acquiring the latest short cycle PQ measurement information.
- the short cycle PQ measurement information is information output by the short cycle PQ measurement information acquisition function 2 at intervals of 10 seconds, and has the contents shown in FIG.
- Process step S84 is a photovoltaic power generation output estimation function.
- Q 10 reactive power Q of the short period PQ measurement information
- P est10 photovoltaic power generation output estimated value P est10 at 10 second intervals
- P 10 means the effective power P of the short period PQ measurement information in the photovoltaic power generation output
- cos ⁇ is the power factor of the photovoltaic power generation
- P NoPV (Q) is the reactive power Q in the load characteristics. Represents the effective power P with respect to.
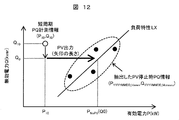
- FIG. 12 is a diagram illustrating an example for explaining a process image of the photovoltaic power generation output estimation process.
- the horizontal axis is a coordinate plane of the active power P and the vertical axis is the reactive power Q, which is the same coordinate plane as described in the power factor method.
- a black circle is a load position at each time point obtained by the processing of the long cycle area unit photovoltaic power generation output estimation function 4.
- the PV stop PQ information (Equation (3) and (4)) obtained by the processing of the photovoltaic power generation stop PQ calculation function 6 from the load position information by a plurality of black circles is a region indicated by a dotted line.
- the load characteristic obtained by, for example, linear approximation processing from the black circle plot at is LX.
- the load characteristic LX is a load characteristic when the photovoltaic power generation is stopped, but the aspect is different between nighttime and daytime. For example, at night when the factory stops, individual home loads and distribution line loads are mainly used, and in this case, the inclination of the load characteristics tends to be small. On the other hand, during the daytime when the factory is operating, the ratio of factory load is high, and the ratio of individual household load and distribution line load is low. In this case, the inclination of the load characteristic tends to increase.
- the load characteristic to be referred for estimating the photovoltaic power generation output is the load characteristic at the time of stopping the photovoltaic power generation, which is the load characteristic in the daytime, and the load characteristic at night when the photovoltaic power generation is stopped is adopted.
- this is not suitable as a load characteristic to be referred to for estimating the photovoltaic power generation output for the reason described above.
- the present invention defines the load characteristics from the long-period area unit photovoltaic power generation output in the daytime, it is suitable as a load characteristic to be referred to for estimating the photovoltaic power generation output, It can be said that it was reflected.
- the short-period PQ measurement information is displayed and plotted together with the load characteristic LX when the photovoltaic power generation is stopped.
- the short-period PQ measurement information is the coordinates (P 10, Q 10 ) in FIG.
- the distance (active power) in the horizontal axis direction between the coordinates (P 10, Q 10 ) and the load characteristic LX can be the photovoltaic power generation output (active power) at the current time point.
- the present invention instead of immediately adopting this difference, with respect to the short period PQ measurement information (coordinates (P 10, Q 10)) , to reflect the power factor of the solar power.
- the previous equation (5) is the result of reflecting the power factor, and the new coordinates (P 10 , Q 0 ) are obtained by subtracting the reflected amount from the coordinates (P 10, Q 10 ).
- the distance (active power) in the horizontal axis direction between the power factor reflection point (P 10 , Q 0 ) and the load characteristic LX is defined as the photovoltaic power generation output (active power).
- P NoPV (reactive power Q 0 ) is the active power on the load characteristic LX when the reactive power Q 0 is.
- the difference between P 10 and P NoPV (reactive power Q 0 ) is estimated as the photovoltaic power generation output.
- the load characteristics are determined from the long-period area unit photovoltaic power generation output in the daytime, and the photovoltaic power generation output is estimated by comparison with the short-period PQ measurement information. It is not necessary to stop the power generation device, and the solar power generation output can be estimated frequently.
- the output finally obtained by the present invention reflects the photovoltaic power generation output in the current power system area. Therefore, by using this value, it is possible to estimate the voltage rise at the end of the distribution line, and it is possible to control the distribution line voltage at the end by reflecting it in the tap operation in the substation bank (transformer).
- 1 Area unit photovoltaic power generation amount estimation device
- 2 Short period PQ measurement information acquisition function
- 3 Meteorological satellite observation information acquisition function
- 4 Long period area unit solar power output estimation function
- 6 Stop solar power generation Hour PQ calculation function
- 8 short period area unit photovoltaic power generation output estimation function
- 9 output function
- DB1 photovoltaic power generation capacity database
- DB2 PQ information database when photovoltaic power generation is stopped
Landscapes
- Engineering & Computer Science (AREA)
- Environmental & Geological Engineering (AREA)
- Life Sciences & Earth Sciences (AREA)
- Atmospheric Sciences (AREA)
- Biodiversity & Conservation Biology (AREA)
- Ecology (AREA)
- Environmental Sciences (AREA)
- Power Engineering (AREA)
- Supply And Distribution Of Alternating Current (AREA)
- Photovoltaic Devices (AREA)
Applications Claiming Priority (2)
| Application Number | Priority Date | Filing Date | Title |
|---|---|---|---|
| JP2015-030284 | 2015-02-19 | ||
| JP2015030284A JP6576648B2 (ja) | 2015-02-19 | 2015-02-19 | エリア単位太陽光発電発電量推定装置および方法 |
Publications (1)
| Publication Number | Publication Date |
|---|---|
| WO2016132931A1 true WO2016132931A1 (ja) | 2016-08-25 |
Family
ID=56692291
Family Applications (1)
| Application Number | Title | Priority Date | Filing Date |
|---|---|---|---|
| PCT/JP2016/053450 Ceased WO2016132931A1 (ja) | 2015-02-19 | 2016-02-05 | エリア単位太陽光発電発電量推定装置および方法 |
Country Status (2)
| Country | Link |
|---|---|
| JP (1) | JP6576648B2 (enExample) |
| WO (1) | WO2016132931A1 (enExample) |
Cited By (1)
| Publication number | Priority date | Publication date | Assignee | Title |
|---|---|---|---|---|
| CN105207615A (zh) * | 2014-06-27 | 2015-12-30 | 国家电网公司 | 一种光伏发电储能设备故障风险指数预测装置及预测方法 |
Families Citing this family (7)
| Publication number | Priority date | Publication date | Assignee | Title |
|---|---|---|---|---|
| JP6764772B2 (ja) * | 2016-11-29 | 2020-10-07 | 株式会社日立製作所 | 電力系統の力率推定装置および方法 |
| JP6782181B2 (ja) * | 2017-02-17 | 2020-11-11 | 株式会社日立製作所 | 太陽光発電量推定装置および方法 |
| JP7251888B2 (ja) * | 2019-08-15 | 2023-04-04 | 東芝エネルギーシステムズ株式会社 | 負荷力率推定方法及びその装置 |
| CN110601270A (zh) * | 2019-09-20 | 2019-12-20 | 重庆工商大学 | 可再生能源供电条件下的养殖装备优化调度策略 |
| JP7377118B2 (ja) * | 2020-02-03 | 2023-11-09 | 株式会社日立製作所 | 電力系統の実負荷算出装置、実負荷算出方法並びに物理量算出方法 |
| JP7652146B2 (ja) | 2022-07-26 | 2025-03-27 | トヨタ自動車株式会社 | 太陽光発電システム、制御方法及び、プログラム |
| KR20240160899A (ko) * | 2023-05-03 | 2024-11-12 | 국립한밭대학교 산학협력단 | 신재생에너지 제어관리시스템 및 그 방법 |
Citations (2)
| Publication number | Priority date | Publication date | Assignee | Title |
|---|---|---|---|---|
| JP2012191777A (ja) * | 2011-03-11 | 2012-10-04 | Nissin Electric Co Ltd | 太陽光発電システムの発電量推定方法 |
| JP2014200167A (ja) * | 2013-03-13 | 2014-10-23 | 富士電機株式会社 | 電力推定装置、電力推定方法、および、プログラム |
Family Cites Families (2)
| Publication number | Priority date | Publication date | Assignee | Title |
|---|---|---|---|---|
| JPWO2014199502A1 (ja) * | 2013-06-14 | 2017-02-23 | 株式会社日立製作所 | 電力系統制御装置、システム及び方法 |
| WO2014207848A1 (ja) * | 2013-06-26 | 2014-12-31 | 三菱電機株式会社 | 電圧監視制御装置および電圧監視制御方法 |
-
2015
- 2015-02-19 JP JP2015030284A patent/JP6576648B2/ja active Active
-
2016
- 2016-02-05 WO PCT/JP2016/053450 patent/WO2016132931A1/ja not_active Ceased
Patent Citations (2)
| Publication number | Priority date | Publication date | Assignee | Title |
|---|---|---|---|---|
| JP2012191777A (ja) * | 2011-03-11 | 2012-10-04 | Nissin Electric Co Ltd | 太陽光発電システムの発電量推定方法 |
| JP2014200167A (ja) * | 2013-03-13 | 2014-10-23 | 富士電機株式会社 | 電力推定装置、電力推定方法、および、プログラム |
Cited By (2)
| Publication number | Priority date | Publication date | Assignee | Title |
|---|---|---|---|---|
| CN105207615A (zh) * | 2014-06-27 | 2015-12-30 | 国家电网公司 | 一种光伏发电储能设备故障风险指数预测装置及预测方法 |
| CN105207615B (zh) * | 2014-06-27 | 2017-03-22 | 国家电网公司 | 一种光伏发电储能设备故障风险指数预测装置及预测方法 |
Also Published As
| Publication number | Publication date |
|---|---|
| JP6576648B2 (ja) | 2019-09-18 |
| JP2016152742A (ja) | 2016-08-22 |
Similar Documents
| Publication | Publication Date | Title |
|---|---|---|
| JP6576648B2 (ja) | エリア単位太陽光発電発電量推定装置および方法 | |
| US10554049B2 (en) | Real-time disaggregation of renewable energy generation on an electricity distribution system | |
| RU2741281C2 (ru) | Способ и система динамического обнаружения неисправностей в электрической сети | |
| Kato | Prediction of photovoltaic power generation output and network operation | |
| JP6077012B2 (ja) | 気象予測方法及び装置、並びに電力系統制御方法及び装置 | |
| JP5989754B2 (ja) | 予測装置 | |
| WO2019224539A1 (en) | Methods and apparatus for the sensing, collecting, transmission, storage, and dissemination of high-resolution power grid electrical measurement data | |
| JP6287306B2 (ja) | 電力推定装置、電力推定方法、および、プログラム | |
| US10344446B2 (en) | System and method of monitoring a utility structure | |
| Ringelband et al. | Potential of improved wind integration by dynamic thermal rating of overhead lines | |
| US20200287384A1 (en) | Solar generation estimation | |
| Laninga et al. | Monitoring technologies for HVDC transmission lines | |
| JP2017055566A (ja) | 分散電源発電量推定装置および方法 | |
| Kleissl et al. | Aggregate solar variability | |
| Ruf et al. | Quantifying residential PV feed-in power in low voltage grids based on satellite-derived irradiance data with application to power flow calculations | |
| Garcia et al. | Methodology to implement a microgrid in a university campus | |
| Addy et al. | How baseline model implementation choices affect demand response assessments | |
| JP6696235B2 (ja) | 配電制御システム、及び予測プログラム | |
| CN112761896A (zh) | 提高风力发电站发电量预测精度的计算方法、装置和计算机设备 | |
| US20250004030A1 (en) | A method and system for dynamic short circuit calculation | |
| JP6247955B2 (ja) | 日射量推定装置 | |
| JP2020004164A (ja) | 太陽光発電出力推定装置及び出力推定方法 | |
| US20230221362A1 (en) | Electrical grid discrepancy identification | |
| JP2016208606A (ja) | 異常監視装置、プログラム | |
| CN120359482A (zh) | 减轻由可再生能源的不稳定性引起的质量波动 |
Legal Events
| Date | Code | Title | Description |
|---|---|---|---|
| 121 | Ep: the epo has been informed by wipo that ep was designated in this application |
Ref document number: 16752318 Country of ref document: EP Kind code of ref document: A1 |
|
| NENP | Non-entry into the national phase |
Ref country code: DE |
|
| 122 | Ep: pct application non-entry in european phase |
Ref document number: 16752318 Country of ref document: EP Kind code of ref document: A1 |