WO2016088564A1 - 計測装置及び計測方法 - Google Patents
計測装置及び計測方法 Download PDFInfo
- Publication number
- WO2016088564A1 WO2016088564A1 PCT/JP2015/082549 JP2015082549W WO2016088564A1 WO 2016088564 A1 WO2016088564 A1 WO 2016088564A1 JP 2015082549 W JP2015082549 W JP 2015082549W WO 2016088564 A1 WO2016088564 A1 WO 2016088564A1
- Authority
- WO
- WIPO (PCT)
- Prior art keywords
- signal
- frequency
- measurement
- band
- body motion
- Prior art date
Links
- 238000005259 measurement Methods 0.000 title claims abstract description 375
- 238000000691 measurement method Methods 0.000 title abstract description 6
- 230000033001 locomotion Effects 0.000 claims abstract description 312
- 238000004364 calculation method Methods 0.000 claims abstract description 81
- 238000000034 method Methods 0.000 claims abstract description 42
- 238000000605 extraction Methods 0.000 claims abstract description 35
- 239000000284 extract Substances 0.000 claims abstract description 22
- 230000001678 irradiating effect Effects 0.000 claims abstract description 14
- 238000001514 detection method Methods 0.000 claims description 132
- 230000008859 change Effects 0.000 claims description 19
- 230000008933 bodily movement Effects 0.000 abstract 3
- 230000006870 function Effects 0.000 description 59
- 238000012545 processing Methods 0.000 description 53
- 238000009532 heart rate measurement Methods 0.000 description 39
- 230000008569 process Effects 0.000 description 21
- 238000005516 engineering process Methods 0.000 description 20
- 238000004458 analytical method Methods 0.000 description 19
- 238000004891 communication Methods 0.000 description 19
- 238000005070 sampling Methods 0.000 description 15
- 238000010521 absorption reaction Methods 0.000 description 8
- 238000010586 diagram Methods 0.000 description 8
- 238000012986 modification Methods 0.000 description 8
- 230000004048 modification Effects 0.000 description 8
- 230000003595 spectral effect Effects 0.000 description 8
- 238000001228 spectrum Methods 0.000 description 8
- 230000007423 decrease Effects 0.000 description 6
- 230000002238 attenuated effect Effects 0.000 description 5
- 238000006243 chemical reaction Methods 0.000 description 5
- 230000003287 optical effect Effects 0.000 description 5
- 125000002066 L-histidyl group Chemical group [H]N1C([H])=NC(C([H])([H])[C@](C(=O)[*])([H])N([H])[H])=C1[H] 0.000 description 3
- 238000000926 separation method Methods 0.000 description 3
- 239000000758 substrate Substances 0.000 description 3
- 102000001554 Hemoglobins Human genes 0.000 description 2
- 108010054147 Hemoglobins Proteins 0.000 description 2
- 230000005540 biological transmission Effects 0.000 description 2
- 239000003086 colorant Substances 0.000 description 2
- 239000002131 composite material Substances 0.000 description 2
- 230000000694 effects Effects 0.000 description 2
- 238000002474 experimental method Methods 0.000 description 2
- 230000004044 response Effects 0.000 description 2
- 238000012360 testing method Methods 0.000 description 2
- 230000001133 acceleration Effects 0.000 description 1
- 238000013459 approach Methods 0.000 description 1
- 230000008033 biological extinction Effects 0.000 description 1
- 239000008280 blood Substances 0.000 description 1
- 210000004369 blood Anatomy 0.000 description 1
- 210000000624 ear auricle Anatomy 0.000 description 1
- 210000003128 head Anatomy 0.000 description 1
- 239000004973 liquid crystal related substance Substances 0.000 description 1
- 238000010801 machine learning Methods 0.000 description 1
- 239000011159 matrix material Substances 0.000 description 1
- 230000001151 other effect Effects 0.000 description 1
- 230000000717 retained effect Effects 0.000 description 1
- 239000004065 semiconductor Substances 0.000 description 1
- 210000000707 wrist Anatomy 0.000 description 1
Images


Classifications
-
- A—HUMAN NECESSITIES
- A61—MEDICAL OR VETERINARY SCIENCE; HYGIENE
- A61B—DIAGNOSIS; SURGERY; IDENTIFICATION
- A61B5/00—Measuring for diagnostic purposes; Identification of persons
- A61B5/72—Signal processing specially adapted for physiological signals or for diagnostic purposes
- A61B5/7203—Signal processing specially adapted for physiological signals or for diagnostic purposes for noise prevention, reduction or removal
- A61B5/7207—Signal processing specially adapted for physiological signals or for diagnostic purposes for noise prevention, reduction or removal of noise induced by motion artifacts
- A61B5/721—Signal processing specially adapted for physiological signals or for diagnostic purposes for noise prevention, reduction or removal of noise induced by motion artifacts using a separate sensor to detect motion or using motion information derived from signals other than the physiological signal to be measured
-
- A—HUMAN NECESSITIES
- A61—MEDICAL OR VETERINARY SCIENCE; HYGIENE
- A61B—DIAGNOSIS; SURGERY; IDENTIFICATION
- A61B5/00—Measuring for diagnostic purposes; Identification of persons
- A61B5/0002—Remote monitoring of patients using telemetry, e.g. transmission of vital signals via a communication network
- A61B5/0015—Remote monitoring of patients using telemetry, e.g. transmission of vital signals via a communication network characterised by features of the telemetry system
- A61B5/0022—Monitoring a patient using a global network, e.g. telephone networks, internet
-
- A—HUMAN NECESSITIES
- A61—MEDICAL OR VETERINARY SCIENCE; HYGIENE
- A61B—DIAGNOSIS; SURGERY; IDENTIFICATION
- A61B5/00—Measuring for diagnostic purposes; Identification of persons
- A61B5/02—Detecting, measuring or recording pulse, heart rate, blood pressure or blood flow; Combined pulse/heart-rate/blood pressure determination; Evaluating a cardiovascular condition not otherwise provided for, e.g. using combinations of techniques provided for in this group with electrocardiography or electroauscultation; Heart catheters for measuring blood pressure
- A61B5/024—Detecting, measuring or recording pulse rate or heart rate
- A61B5/02416—Detecting, measuring or recording pulse rate or heart rate using photoplethysmograph signals, e.g. generated by infrared radiation
-
- A—HUMAN NECESSITIES
- A61—MEDICAL OR VETERINARY SCIENCE; HYGIENE
- A61B—DIAGNOSIS; SURGERY; IDENTIFICATION
- A61B5/00—Measuring for diagnostic purposes; Identification of persons
- A61B5/72—Signal processing specially adapted for physiological signals or for diagnostic purposes
- A61B5/7235—Details of waveform analysis
- A61B5/725—Details of waveform analysis using specific filters therefor, e.g. Kalman or adaptive filters
-
- A—HUMAN NECESSITIES
- A61—MEDICAL OR VETERINARY SCIENCE; HYGIENE
- A61B—DIAGNOSIS; SURGERY; IDENTIFICATION
- A61B5/00—Measuring for diagnostic purposes; Identification of persons
- A61B5/72—Signal processing specially adapted for physiological signals or for diagnostic purposes
- A61B5/7235—Details of waveform analysis
- A61B5/7253—Details of waveform analysis characterised by using transforms
- A61B5/7257—Details of waveform analysis characterised by using transforms using Fourier transforms
Definitions
- the present technology relates to a measurement device and a measurement method, and more particularly, to a measurement device and a measurement method suitable for use in measuring a pulse wave or a pulse.
- this technology is intended to improve the measurement accuracy of pulse waves and pulses.
- the measuring device of one side of this art is from the 1st zone signal containing the component of the 1st frequency band of the 1st measurement signal acquired by irradiating the part containing light with the light of the 1st wavelength.
- a body motion signal extraction unit that extracts a body motion signal including a component caused by body motion, and a difference between the second band signal including the component of the second frequency band of the first measurement signal and the body motion signal
- a calculation unit that generates a pulse wave signal as a signal.
- the body motion signal extraction unit can predict and extract the body motion signal using an autoregressive model.
- the body motion signal extraction unit can generate the autoregressive model within the range from the 5th order to the 12th order using the Yule-Walker method.
- the body motion signal extraction unit can set the order of the autoregressive model based on the level of the first band signal.
- a body motion detector that detects the body motion, and a measurement that measures a pulse wave frequency based on a signal selected from the pulse wave signal and the second band signal based on the detection result of the body motion Can be further provided.
- the body motion signal extraction unit extracts the body motion signal from a signal obtained by attenuating a frequency component of a band including a measurement value of a previous pulse wave frequency among frequency components of the first band signal. Can do.
- the measurement unit includes a frequency detection unit that detects a first peak frequency that is a peak frequency of the pulse wave signal and a second peak frequency that is a peak frequency of the second band signal, and the body motion And a selection unit that selects the pulse wave frequency from the first peak frequency and the second peak frequency based on at least one of the detection result of the above and the measurement value of the previous pulse wave frequency. it can.
- the frequency detection unit can limit the frequency band for detecting the first peak frequency and the second peak frequency based on the previous measurement value of the pulse wave frequency.
- the frequency detection unit is configured to detect the first peak frequency based on a result of Fourier transform of the pulse wave signal obtained by padding a sample having a value of 0, and to pad the sample having a value of 0.
- the second peak frequency can be detected based on the result of Fourier transform of the band signal.
- the measurement unit includes a selection unit that selects the pulse wave signal or the second band signal based on the detection result of the body movement, and the peak frequency of the signal selected by the selection unit is the pulse wave frequency. And a frequency detection unit for detecting as follows.
- the frequency detection unit can limit the frequency band for detecting the peak frequency based on the previous measurement value of the pulse wave frequency.
- the frequency detection unit can detect the peak frequency based on a result of Fourier transform of a signal obtained by padding a signal selected by the selection unit with a sample having a value of 0.
- the body motion detection unit can detect the body motion based on the frequency distribution of the body motion signal.
- the body motion detection unit includes a third band signal including a component of the first frequency band of the second measurement signal acquired by irradiating the portion including the pulse with light of the second wavelength; The body motion can be detected based on the distribution of the combined vector with the first band signal.
- the body movement can be detected.
- the measurement unit can calculate the pulse rate based on the pulse wave frequency.
- the range of the pulse wave frequency to be measured can be included, and the maximum value of the second frequency band can be made larger than the maximum value of the first frequency band.
- a filter for extracting the first band signal from the first measurement signal is further provided, the first frequency band is the same as the second frequency band, and includes a range of pulse wave frequencies to be measured.
- the first band signal and the second band signal can be the same signal.
- a measurement method includes a first band signal including a component of a first frequency band of a first measurement signal acquired by irradiating a portion including a pulse with light having a predetermined wavelength.
- a body motion signal extraction step for extracting a body motion signal including a component caused by body motion, and a difference signal between the second band signal including a component of the second frequency band of the first measurement signal and the body motion signal And generating a pulse wave signal.
- the body movement is performed from the first band signal including the component of the first frequency band of the first measurement signal acquired by irradiating the portion including the pulse with light having a predetermined wavelength. Is extracted, and a pulse wave signal, which is a difference signal between the second band signal including the component of the second frequency band of the first measurement signal and the body movement signal, is generated.
- the pulse wave component can be extracted from the measurement signal with high accuracy.
- the measurement accuracy of a pulse wave and a pulse can be improved.
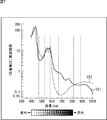
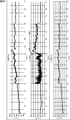
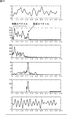
- Each graph of FIG. 1 shows an example of a result of frequency analysis of a signal obtained by measuring a pulse wave of a subject's arm with an optical measurement device by FFT (Fast Fourier Transform).
- the horizontal axis of each graph indicates the frequency, and the vertical axis indicates the spectrum intensity.
- the change in the frequency distribution of the measurement signal when the subject steps from a stationary state and then starts running is shown in order from the top graph.
- the top graph in FIG. 1 shows the frequency distribution of the measurement signal when the subject is stationary.
- the second to fourth graphs from the top show the frequency distribution of the measurement signal when the subject is stepping on.
- the fifth to eighth graphs from the top show the analysis results when the subject is running. Note that the pulse of the subject when measuring the measurement signal of each graph is 68 bpm (beats per minute), 89 bpm, 84 bpm, 86 bpm, 89 bpm, 94 bpm, 94 bpm, 102 bpm in order from the top.
- the peak of the frequency indicated by the arrow in each graph indicates the frequency of the subject's pulse wave (hereinafter referred to as pulse wave frequency), and the peak of the frequency indicated by the black circle indicates the frequency of the subject's body movement (hereinafter, (Referred to as body motion frequency).
- the fundamental frequency of the body motion component is generally slightly lower than the pulse wave frequency.
- the body motion component includes a harmonic component with high periodicity.
- the energy of the body motion component is very large compared to the energy of the pulse wave component.
- the frequency spectrum of the pulse wave component and the frequency spectrum of the body motion component approach as the momentum increases and the pulse becomes faster.
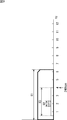
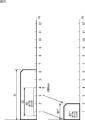
- First Embodiment> ⁇ Configuration example of measuring device 1 ⁇ 2 and 3 show a configuration example of the measurement apparatus 1 that is the first embodiment of the measurement apparatus to which the present technology is applied.
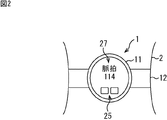
- FIG. 2 shows an external configuration example of the measuring apparatus 1.
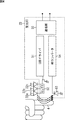
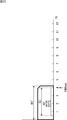
- FIG. 3 shows a configuration example of the main body 11 of the measuring apparatus 1.
- the measuring device 1 is a wristband type measuring device that measures a subject's pulse by an optical method. As shown in FIG. 2, the measuring device 1 includes a main body 11 and a band 12, and the band 12 is attached to the arm (wrist) 2 of the subject like a wristwatch. And the main-body part 11 irradiates the part containing the pulse of the test subject's arm 2 with the measurement light of a predetermined wavelength, and measures a test subject's pulse based on the intensity
- the main body 11 is configured to include a substrate 21, an LED 22, a light receiving IC 23, a light shield 24, an operation unit 25, an arithmetic processing unit 26, a display unit 27, and a wireless device 28.
- the LED 22, the light receiving IC 23, and the light shield 24 are provided on the substrate 21.
- the LED 22 irradiates the portion including the pulse of the arm 2 of the subject under the control of the light receiving IC 23.
- the light receiving IC 23 receives the light returned after the measurement light is irradiated on the arm 2.
- the light receiving IC 23 generates a digital measurement signal indicating the intensity of the returned light, and supplies the generated measurement signal to the arithmetic processing unit 26.
- the light shield 24 is provided between the LED 22 and the light receiving IC 23 on the substrate 21.
- the light shield 24 prevents the measurement light from the LED 22 from directly entering the light receiving IC 23.
- the operation unit 25 is composed of various operation members such as buttons and switches, and is provided on the surface of the main body unit 11.
- the operation unit 25 is used to operate the measuring device 1 and supplies a signal indicating the operation content to the arithmetic processing unit 26.
- the calculation processing unit 26 performs calculation processing for measuring the pulse of the subject based on the measurement signal supplied from the light receiving IC 23.
- the arithmetic processing unit 26 supplies the pulse measurement result to the display unit 27 and the wireless device 28.
- the display unit 27 is configured by a display device such as an LCD (Liquid Crystal Display), and is provided on the surface of the main body unit 11.
- the display unit 27 displays the measurement result of the subject's pulse.
- the wireless device 28 transmits the measurement result of the subject's pulse to an external device by wireless communication of a predetermined method. For example, as illustrated in FIG. 3, the wireless device 28 transmits the measurement result of the subject's pulse to the smartphone 3 and causes the screen 3 ⁇ / b> A of the smartphone 3 to display the measurement result. Note that any method can be adopted as the communication method of the wireless device 28.
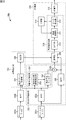
- FIG. 4 shows a configuration example of the light receiving IC 23.
- the LED 22 of the measuring device 1 includes three LEDs, LEDs 22a to 22c, is shown.
- the LEDs 22a to 22c emit measurement light having different wavelengths.
- the light receiving IC 23 is configured to include an LED driver 51, a selector 52, a light receiving element 53, an AD converter 54, and a communication unit 55.
- the LED driver 51 supplies drive signals to the LEDs 22a to 22c via the selector 52, and controls lighting, extinction, light emission amount, and the like of the LEDs 22a to 22c.
- the selector 52 selects the supply destination of the drive signal supplied from the LED driver 51 from the LEDs 22a to 22c, and supplies the drive signal to the selected LED.
- the light receiving element 53 receives light returning after the measurement light from the LEDs 22a to 22c is irradiated on the arm 2.
- the light receiving element 53 supplies a measurement signal, which is an analog electric signal indicating the intensity of the received light, to the AD converter 54.
- the AD converter 54 samples the measurement signal at a predetermined sampling frequency, and converts the analog measurement signal into a digital measurement signal.
- the AD converter 54 supplies a digital measurement signal to the communication unit 55.
- the sampling frequency of the AD converter 54 is, for example, 200 to 220 Hz.
- the sampling frequency of the AD converter 54 is 200 Hz.
- the communication unit 55 communicates with the arithmetic processing unit 26 by a predetermined type of wired communication, and transmits and receives measurement signals and various control signals. Note that an arbitrary method such as I2C can be adopted as a communication method of the communication unit 55.
- the light receiving IC 23 can also be used when measuring a pulse in a part other than the subject's arm 2 (for example, a finger 4, an earlobe (not shown), etc.).
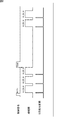
- FIG. 5 shows the timing of the control signal supplied from the arithmetic processing unit 26 to the communication unit 55 of the light receiving IC 23.
- the second row shows the operation period of the AD converter 54.
- the third row shows the light emission period of the LEDs 22a to 22c.
- the LED 22a is represented as LEDa
- the LED 22b is represented as LEDb
- the LED 22c is represented as LEDc.
- the light receiving IC 23 starts its operation when a write signal is supplied from the arithmetic processing unit 26 to the communication unit 55.
- the LED driver 51 supplies a drive signal to the LED 22a via the selector 52, and causes the LED 22a to emit pulsed measurement light.
- the light receiving element 53 receives the light returned after the measurement light from the LED 22a is irradiated on the arm 2.
- the light receiving element 53 supplies a measurement signal (hereinafter referred to as a measurement signal a), which is an analog electric signal indicating the intensity of received light, to the AD converter 54.
- the AD converter 54 samples the analog measurement signal a and performs AD conversion to the digital measurement signal a.
- the AD converter 54 supplies the digital measurement signal a to the communication unit 55.
- the LED driver 51 supplies a drive signal to the LED 22b via the selector 52 after the AD conversion of the measurement signal a is completed, and causes the LED 22b to emit pulsed measurement light.
- the light receiving element 53 receives the light returned after the measurement light from the LED 22b is applied to the arm 2.
- the light receiving element 53 supplies a measurement signal (hereinafter referred to as a measurement signal b) which is an analog electric signal indicating the intensity of the received light to the AD converter 54.
- the AD converter 54 samples the analog measurement signal b and performs AD conversion to the digital measurement signal b.
- the AD converter 54 supplies the digital measurement signal b to the communication unit 55.
- the LED driver 51 supplies a drive signal to the LED 22c via the selector 52 after AD conversion of the measurement signal b, and causes the LED 22c to emit pulsed measurement light.
- the light receiving element 53 receives the light returned after the measurement light from the LED 22c is irradiated on the arm 2.
- the light receiving element 53 supplies a measurement signal (hereinafter referred to as a measurement signal c) that is an analog electric signal indicating the intensity of the received light to the AD converter 54.
- the AD converter 54 samples the analog measurement signal c and performs AD conversion to the digital measurement signal c.
- the AD converter 54 supplies the digital measurement signal c to the communication unit 55.
- the communication unit 55 supplies the measurement signals a to c to the arithmetic processing unit 26 when the read signal is supplied from the arithmetic processing unit 26.
- the above processing is repeatedly executed, for example, until a predetermined period or number of times or a stop command is input from the arithmetic processing unit 26.
- FIGS. 4 and 5 show examples in which there are three types of wavelengths of measurement light, it is also possible to set the wavelength of measurement light to one type, two types, or four or more types.
- the wavelength of the measurement light is one type will be described as an example.
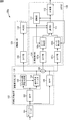
- FIG. 6 shows a configuration example of the arithmetic processing unit 26a which is the first embodiment of the arithmetic processing unit 26 of the measuring device 1.
- the arithmetic processing unit 26a includes a decimation filter 101, a BPF (bandpass filter) 102, an autocovariance function estimation unit 103, a linear prediction filter 104, a BPF (bandpass filter) 105, an arithmetic unit 106, and a DFT (discrete Fourier transform) unit. 107a and 107b, peak detection units 108a and 108b, DFT (Discrete Fourier Transform) unit 109, determination unit 110, selection unit 111, calculation unit 112, and storage unit 113.
- the body motion signal extraction unit 131 is configured by the self-covariance function estimation unit 103 and the linear prediction filter 104.
- the BPF 102, the BPF 105, the calculation unit 106, and the body motion signal extraction unit 331 constitute a pulse wave signal extraction unit 132.
- the DFT unit 109 and the determination unit 110 constitute a body motion detection unit 133.
- a frequency detection unit 134 is configured by the DFT units 107a and 107b and the peak detection units 108a and 108b.
- the selection unit 111, the calculation unit 112, the storage unit 113, and the frequency detection unit 134 constitute a measurement unit 135.
- the decimation filter 101 down-samples the measurement signal.
- the decimation filter 101 supplies the measurement signal after downsampling to the BPF 102 and the BPF 105.
- the BPF 102 is composed of, for example, a zero phase filter constituted by a two-stage third-order IIR (Infinite Impulse Response) filter.
- the BPF 102 passes components in a predetermined frequency band (hereinafter referred to as frequency band N) of the measurement signal and blocks components other than the frequency band N.
- frequency band N a predetermined frequency band
- the BPF 102 applies the third-order IIR filter of the first stage to the measurement signal, and then reverses the sample order to the second-order third-order IIR that is the same as the first stage.
- the phase distortion is canceled by a method such as applying a filter.
- the BPF 102 supplies a signal including the extracted component of the frequency band N (hereinafter referred to as band signal N) to the self-covariance function estimation unit 103 and the linear prediction filter 104.
- time axis information such as a body motion component is held in the extracted band signal N.
- the self-covariance function estimation unit 103 estimates the self-covariance function of the body motion signal included in the band signal N.
- the body motion signal is a signal including a body motion component generated by the body motion of the subject.
- the autocovariance function estimation unit 103 supplies the estimation result of the autocovariance function to the linear prediction filter 104.
- the linear prediction filter 104 is composed of, for example, a linear prediction filter created by a power spectral density estimation algorithm based on the Yule-Walker method.
- the linear prediction filter 104 obtains the parameters of the body motion signal AR model (autocorrelation model) by the Yule-Walker method using the autocovariance function estimated by the autocovariance function estimation unit 103. Thereby, an AR model of the body motion signal is generated.
- the linear prediction filter 104 predicts a body motion signal using the generated AR model, and when the body motion component is sufficiently larger than the pulse wave component, only the body motion component that does not include a low-level pulse wave component and a noise component. Is extracted from the band signal N.
- the linear prediction filter 104 supplies the extracted body motion signal to the calculation unit 106 and the DFT unit 109.
- the BPF 105 includes, for example, a zero-phase filter constituted by a two-stage third-order IIR (InfiniteInImpulse Response) filter, like the BPF 102.
- the BPF 105 passes components in a predetermined frequency band (hereinafter referred to as frequency band W) of the measurement signal and blocks components other than the frequency band W.
- the BPF 105 supplies a signal including the extracted component of the frequency band W (hereinafter referred to as a band signal W) to the arithmetic unit 106 and the DFT unit 107b.
- time axis information such as a pulse wave component is retained in the extracted band signal W.
- the calculation unit 106 adds the band signal W and the inverse signal of the body motion signal to obtain a difference between the band signal W and the body motion signal.
- the calculation unit 106 supplies a differential signal (hereinafter referred to as a pulse wave signal) generated by taking the difference between the band signal W and the body motion signal to the DFT unit 107a.
- the DFT unit 107a performs DFT of the pulse wave signal and supplies the analysis result of the frequency of the pulse wave signal to the peak detection unit 108a.
- the peak detector 108a detects the peak frequency of the pulse wave signal based on the frequency analysis result of the pulse wave signal. At this time, the peak detection unit 108a limits the frequency band in which the peak frequency is detected based on the previous detection value of the pulse wave frequency stored in the storage unit 113. The peak detection unit 108 a supplies the detection value of the peak frequency of the pulse wave signal to the selection unit 111.
- the DFT unit 107b performs DFT of the band signal W and supplies the frequency analysis result of the band signal W to the peak detection unit 108b.
- the peak detection unit 108b detects the peak frequency of the band signal W based on the frequency analysis result of the band signal W. At this time, the peak detection unit 108b limits the frequency band in which the peak frequency is detected based on the previous detection value of the pulse wave frequency stored in the storage unit 113. The peak detection unit 108 b supplies the detection value of the peak frequency of the band signal W to the selection unit 111.
- the DFT unit 109 performs DFT of the band signal N and supplies the analysis result of the frequency of the band signal N to the determination unit 110.
- the determination unit 110 determines the presence / absence of a body movement (hereinafter referred to as an obstacle body movement) that becomes an obstacle to pulse measurement.
- the determination unit 110 supplies the determination result of the presence or absence of obstacle body movement to the selection unit 111.
- the selection unit 111 selects the pulse wave frequency from the peak frequency of the pulse wave signal and the peak frequency of the band signal W based on the determination result of the presence or absence of obstacle body movement and the previous measurement value of the pulse wave frequency. .
- the selection unit 111 supplies information indicating the selected pulse wave frequency to the calculation unit 112 and causes the storage unit 113 to store the information.
- the calculation unit 112 calculates the pulse rate based on the pulse wave frequency.
- the calculation unit 112 outputs the calculated pulse rate to the outside as a measurement result.
- the storage unit 113 stores past pulse wave frequency measurement values.
- FIG. 7 shows absorption characteristics for light in each wavelength band of Hb (reduced hemoglobin) and HbO 2 (oxygenated hemoglobin) contained in blood.
- the horizontal axis indicates the wavelength, and the vertical axis indicates the absorption coefficient.
- a curve 151 indicates the absorption characteristic of Hb, and a curve 152 indicates the absorption characteristic of HbO 2 .
- light having a wavelength of 470 nm (hereinafter referred to as blue measurement light) or light having a wavelength of 660 nm (hereinafter referred to as red measurement light) having a large difference in absorption coefficient between Hb and HbO 2 in the visible light band is measured.
- the absorption coefficient of Hb and HbO 2 in the visible light band is substantially equal wavelength of 530nm light (hereinafter, referred to as green measurement light) and a wavelength 585nm of light (hereinafter, referred to as yellow measurement light) is measured Used for light.
- light having a wavelength of approximately 805 nm where the absorption coefficients of Hb and HbO 2 are approximately equal in the infrared light band, or light having a wavelength of 880 nm having a large difference between the absorption coefficients of Hb and HbO 2 is used as the measurement light.
- the pulse is measured at a predetermined interval (for example, every 8 to 15 seconds).
- a predetermined interval for example, every 8 to 15 seconds.
- step S1 the measuring device 1 starts acquiring measurement signals. That is, as described above with reference to FIG. 5, light emission by the LED 22 and light reception by the light receiving IC 23 are started. In addition, supply of the measurement signal from the light receiving IC 23 to the arithmetic processing unit 26 of the measurement signal indicating the intensity of the received light is started.
- step S2 the decimation filter 101 down-samples the measurement signal to a band necessary for analyzing the pulse wave signal. For example, the decimation filter 101 performs decimation processing on the measurement signal, and down-samples the number of samples of the measurement signal at a predetermined ratio. The decimation filter 101 supplies the downsampled measurement signal to the BPF 102 and the BPF 105.
- the sampling frequency of the measurement signal is 200 Hz and one measurement period is 8 seconds
- the number of samples of the measurement signal in one measurement period is 1600 samples.
- the downsampling ratio is 1/16, the number of measurement signal samples in one measurement period decreases from 1600 samples to 100 samples.
- the maximum value of the human pulse rate is about 220 bpm, and it is considered sufficient that the maximum value of the pulse rate that can be measured by the measuring apparatus 1 is 240 bpm.
- the pulse rate of 240 bpm is converted into a pulse wave frequency, 4.0 Hz is obtained. Therefore, if it is possible to detect a frequency component of 6.25 Hz from the measurement signal after downsampling, it is possible to sufficiently measure the human pulse wave frequency.
- the amount of subsequent calculations can be reduced by down-sampling the measurement signal.
- the pulse wave signal extraction unit 132 limits the frequency band of the measurement signal. Specifically, the BPF 102 extracts a component in the frequency band N of the measurement signal after downsampling. The BPF 102 supplies the band signal N including the extracted frequency band N component to the self-covariance function estimation unit 103 and the linear prediction filter 104.
- the BPF 105 extracts the frequency band W component of the measurement signal after downsampling.
- the BPF 105 supplies the band signal W including the extracted band signal W component to the calculation unit 106 and the DFT unit 107b.
- the frequency band N and the frequency band W are set according to the assumed ranges of the pulse wave frequency and the body motion frequency. That is, the frequency band N and the frequency band W are set according to the pulse wave frequency range to be measured and the body motion component frequency range to be extracted.
- the frequency band W is set so as to include at least the range of the pulse wave frequency to be measured.
- the frequency band N is set so as to include at least the frequency range of the body motion component assumed to be included in the frequency band W, for example.
- the measurable range of the pulse rate of the measuring apparatus 1 is 30 bpm to 240 bpm
- this range when this range is converted into a pulse wave frequency, it becomes 0.5 Hz to 4.0 Hz.
- the minimum value of the frequency band W is set to 0.5 Hz or less, and the maximum value is set to 4.0 Hz or more.
- the fundamental frequency of the body motion component tends to be slightly lower than the pulse wave frequency.
- the fundamental frequency range of the body motion component to be detected is 0.5 Hz to 2.5 Hz
- the minimum value of the frequency band N is set to 0.5 Hz or less
- the maximum value is set to 2.5 Hz or more. Is set.
- the frequency band W is set to 0.5 Hz to 4.0 Hz and the frequency band N is set to 0.5 Hz to 2.5 Hz. That is, in this case, the frequency band W is set to a band wider than the frequency band N. More specifically, the maximum value of the frequency band W is set to a value larger than the maximum value of the frequency band N, and the minimum value of the frequency band W is set to the same value as the minimum value of the frequency band N.
- the body motion signal extraction unit 131 extracts a body motion signal.
- the auto-covariance function estimation unit 103 includes a body included in the band signal N based on a predetermined number (for example, eight) of samples at the head of 100 samples within one measurement period of the band signal N. Estimate the autocovariance function of the dynamic signal. The autocovariance function estimation unit 103 supplies the estimation result of the autocovariance function to the linear prediction filter 104.
- the linear prediction filter 104 uses the estimated auto-covariance function to calculate the body based on a predetermined number (for example, 8) samples at the beginning of 100 samples within one measurement period of the band signal N.
- the parameters of the AR model of the dynamic signal are obtained by the Yule-Walker method. Thereby, an AR model of the body motion signal is generated.
- the linear prediction filter 104 predicts a body motion signal using the generated AR model.
- the linear prediction filter 104 removes the pulse wave component and the noise component from the remaining predetermined number (for example, 92) of samples in one measurement period of the band signal N based on the prediction result of the body motion signal, Extract body motion signals.
- the order of the AR model of the body motion signal will be described.
- the order of the AR model is desirable to set the order of the AR model to, for example, about 20th to 30th.
- the body motion component not only the body motion component but also the pulse wave component are extracted from the band signal N.
- the accuracy of removing the noise component of the linear prediction filter 104 decreases.
- the band signal N contains many body motion components, not only the noise component but also a pulse wave component that is very weak compared to the body motion component can be removed. As a result, there is an effect that only the body motion component can be extracted from the band signal N with a small amount of calculation.
- the order of the AR model is set to 8th order, for example.
- the order of the eighth order is a value obtained by experiments as an order capable of extracting the body motion component from the band signal N with high accuracy.
- the order of the AR model is not necessarily limited to the 8th order. For example, even when the order of the AR model is set within the range of the fifth order to the twelfth order, the body motion component can be extracted from the band signal N with high accuracy.
- the linear prediction filter 104 supplies the extracted body motion signal to the calculation unit 106 and the DFT unit 109.
- the pulse wave component is also extracted from the band signal N by the linear prediction filter 104 and is converted into the body motion signal. A pulse wave component is included.
- step S5 the calculation unit 106 extracts a pulse wave signal. Specifically, the operation unit 106 adds the band signal W and the inverse signal of the body motion signal to obtain a difference between the band signal W and the body motion signal, and generates a pulse wave signal that is a difference signal. The calculation unit 106 supplies the pulse wave signal to the DFT unit 107a.
- the top graph in FIG. 10 shows an example of the measurement result (solid line) of the frequency distribution of the band signal W and the prediction result (dotted line) of the frequency distribution of the body motion signal using the AR model.
- the horizontal axis of the graph indicates the frequency, and the vertical axis indicates the spectral intensity.
- the second graph from the top in FIG. 10 shows an example of the measurement result (solid line) of the waveform of the band signal W and the prediction result (dotted line) of the waveform of the body motion signal using the AR model.
- the horizontal axis of the graph indicates time, and the vertical axis indicates amplitude.
- the third graph from the top in FIG. 10 shows an example of a pulse wave signal that is a difference signal between the band signal W (solid line) and the body motion signal (dotted line) in the second graph from the top.
- the horizontal axis of the graph indicates time, and the vertical axis indicates amplitude.
- the fourth graph from the top in FIG. 10 shows an example of the frequency distribution of the band signal W (solid line) in the second graph from the top.
- the horizontal axis of the graph indicates the frequency, and the vertical axis indicates the spectral intensity.
- the bottom graph in FIG. 10 shows an example of the frequency distribution of the pulse wave signal in the third graph from the top.
- the horizontal axis of the graph indicates the frequency, and the vertical axis indicates the spectral intensity.
- the body motion component is removed from the band signal W, and the pulse wave signal including the pulse wave component is extracted. That is, the body motion component can be canceled efficiently.
- the body wave signal when the body motion component is not included in the band signal N or when the body motion component included in the band signal N is small, the body wave signal includes a pulse wave component. Therefore, the pulse wave component, which is the difference signal between the band signal W and the body motion signal, hardly contains the pulse wave component.
- the frequency detector 134 detects the peak frequency of the pulse wave signal. Specifically, the DFT unit 107a pads a predetermined number of samples of value 0 between each sample of 100 samples of pulse wave signals within one measurement period, and up-samples them to 1024 samples. Then, the DFT unit 107a performs DFT of the pulse wave signal after padding, and supplies the analysis result of the frequency of the pulse wave signal to the peak detection unit 108a.
- the resolution of the frequency analysis of the pulse wave signal can be increased by padding the zero value samples, setting the number of pulse wave signal samples to 1024 or 2048 samples, and increasing the sampling frequency. Also, by padding samples with a value of 0, DFT can be performed using a sparse matrix, and the computation processing can be speeded up.
- the peak detector 108a detects the peak frequency of the pulse wave signal based on the frequency analysis result of the pulse wave signal. At this time, the peak detection unit 108 a reads the previous measurement value of the pulse wave frequency from the storage unit 113. And the peak detection part 108a restrict
- the peak detection unit 108a detects a predetermined bandwidth centering on 2 Hz as a frequency band for detecting the peak frequency as shown in FIG. Limited to range R2.
- the detection range R2 is set to a range narrower than the bandwidth R3 of the frequency band W.
- the peak detector 108a detects the peak frequency of the pulse wave signal within the set detection range.
- the peak detection unit 108a supplies the detection value of the peak frequency to the selection unit 111.
- the calculation amount is reduced, and a peak frequency different from the pulse wave frequency may be detected. Is reduced.
- the frequency detector 134 detects the peak frequency of the measurement signal.
- the DFT unit 107b performs DFT of the band signal W after padding the band signal W with a sample of value 0 by the same processing as the DFT unit 107a in step S6.
- the peak detection unit 108b detects the peak frequency of the band signal W after limiting the detection range based on the previous measurement value of the pulse wave frequency by the same processing as the peak detection unit 108a in step S6. Thereby, the peak frequency in the detection range of the measurement signal is detected.
- the peak detection unit 108 b supplies the peak frequency detection value to the selection unit 111.
- step S8 the body motion detection unit 133 detects body motion. Specifically, the DFT unit 109 performs DFT of the body motion signal and supplies the analysis result of the frequency of the body motion signal to the determination unit 110.
- Determining unit 110 determines the presence / absence of obstacle body motion based on the frequency distribution of the body motion signal. For example, when the frequency range of the body motion signal is greater than or equal to a predetermined width, the determination unit 110 determines that there is a disabled body motion. On the other hand, when the frequency range of the body motion signal is less than a predetermined width, the determination unit 110 determines that there is no obstacle body motion.
- the range of the frequency of the body motion signal is obtained, for example, by the difference between the minimum frequency and the maximum frequency among the frequencies where the spectrum intensity of the body motion signal is equal to or higher than a predetermined threshold.
- the determination unit 110 determines the presence / absence of a disabled body motion based on the waveform of the frequency distribution of the body motion signal. For example, the determination unit 110 uses a discriminator obtained by prior machine learning, and the waveform of the frequency distribution of the body motion signal includes a disability body motion component (a body motion component that impedes pulse measurement). Or not. If the determination unit 110 determines that the obstruction body motion component is included in the body motion signal as a result of the identification, the determination unit 110 determines that there is an obstruction body motion. On the other hand, when the determination unit 110 determines that the obstacle body motion component is not included in the body motion signal as a result of the identification, it determines that there is no obstacle body motion.
- a disability body motion component a body motion component that impedes pulse measurement
- the determination part 110 supplies the determination result of the presence or absence of obstruction body movement to the selection part 111.
- the criterion for determining whether or not the subject's body motion is an obstacle body motion is set by, for example, prior learning or experiments. By appropriately setting this criterion, weak body movements that do not interfere with pulse measurement are ignored.
- the selection unit 111 selects a pulse wave frequency from the detected peak frequencies based on the detection result of the body movement and the previous measurement value of the pulse wave frequency. For example, the selection unit 111 reads the previous measurement value of the pulse wave frequency from the storage unit 113. Based on the measurement value of the previous pulse wave frequency, the selection unit 111 sets the maximum range in which the pulse wave frequency is assumed to be changeable between the previous measurement and the current measurement as the selection reference range. Set.
- the selection unit 111 selects the peak frequency included in the selection reference range as the pulse wave. Select frequency.
- the selection unit 111 is based on the determination result of the presence or absence of obstacle movement. To select the pulse wave frequency.
- the pulse wave component which is the difference signal between the band signal W and the body motion signal, includes a pulse wave component, but hardly includes the body motion component.
- the selection unit 111 selects the peak frequency of the pulse wave signal as the pulse wave frequency when it is determined that there is an obstacle movement. That is, the peak frequency of the pulse wave signal becomes the measured value of the current pulse wave frequency.
- the pulse wave component is hardly removed from the body motion signal. Accordingly, the pulse wave component, which is the difference signal between the band signal W and the body motion signal, contains almost no pulse wave component.
- the body signal is hardly included in the band signal W. Therefore, it is assumed that the peak frequency of the band signal W is substantially equal to the pulse wave frequency of the subject. Therefore, the selection unit 111 selects the peak frequency of the band signal W as the pulse wave frequency when it is determined that there is no obstacle movement. That is, the peak frequency of the band signal W is the measured value of the current pulse wave frequency.
- the selection unit 111 supplies information indicating the selected pulse wave frequency to the calculation unit 112. Further, the selection unit 111 causes the storage unit 113 to store information indicating the selected pulse wave frequency. Thereby, the measurement value of the current pulse frequency is stored in the storage unit 113.
- step S10 the calculation unit 112 calculates the pulse rate. For example, the calculation unit 112 obtains the pulse rate by multiplying the pulse wave frequency selected by the selection unit 111 by 60 times.
- step S11 the calculation unit 112 outputs a measurement result. That is, the calculation part 112 outputs the pulse rate calculated
- step S2 Thereafter, the process returns to step S2, and the processes after step S2 are repeatedly executed.
- the pulse wave and pulse of the subject can be accurately measured.
- the influence of the subject's body movement can be removed and the pulse wave and the pulse can be continuously measured accurately.
- the power consumption of the measuring device 1 can be reduced by reducing the amount of calculation.
- the measurement device 1 can be mounted on a subject for a long time without performing charging or battery replacement, and measurement can be performed.
- the downsampling ratio is set to 1/16.
- the sampling frequency of the measurement signal after downsampling is 8.0 Hz or more
- the pulse wave frequency for the pulse rate of 240 bpm is set. It is possible to measure. Therefore, when the sampling frequency of the measurement signal is 200 Hz, the downsampling ratio can be reduced to 1/25.
- FIG. 11 shows an example in which the downsampling ratio is set to 1/24.
- the downsampling ratio is set to 1/24.
- it is possible to detect up to a frequency component of 4.17 Hz ( 200 Hz ⁇ 1/24/2) using the measurement signal after downsampling, as indicated by a range R1 ′ in FIG.
- the second embodiment differs from the first embodiment in a body motion detection method and a pulse wave frequency measurement method.
- measurement light having two types of wavelengths, measurement light 1 and measurement light 2, is used.
- the measurement light for example, blue measurement light having a wavelength of 470 nm or green measurement light having a wavelength of 530 nm is used.
- a case where blue measurement light is used will be described as an example.
- the measurement signal 1 is measured using the measurement light 1.
- Measured light 2 is, for example, yellow measuring light having a wavelength of 585 nm.
- the measurement signal 2 is measured using the measurement light 2.
- the sampling frequency of the measurement signal 1 and the measurement signal 2 is, for example, 200 to 220 Hz.
- the case where the sampling frequency of the measurement signal 1 and the measurement signal 2 is 200 Hz will be described as an example.
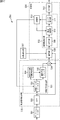
- an arithmetic processing unit 26b of FIG. 12 is used in the measurement apparatus 1 instead of the arithmetic processing unit 26a of FIG.
- the arithmetic processing unit 26b includes decimation filters 301a and 301b, BPFs (bandpass filters) 302a and 302b, an autocovariance function estimation unit 303, a linear prediction filter 304, a BPF (bandpass filter) 305, an arithmetic unit 306, and a combined vector calculation.
- DFT discrete Fourier transform
- the body motion signal extraction unit 331 is configured by the self-covariance function estimation unit 303 and the linear prediction filter 304.
- the BPF 302a, the BPF 305, the calculation unit 306, and the body motion signal extraction unit 331 constitute a pulse wave signal extraction unit 332.
- the combined vector calculation unit 307 and the determination unit 308 constitute a body motion detection unit 333.
- the DFT unit 310, the band limiting unit 311, and the peak detection unit 312 constitute a frequency detection unit 334.
- the selection unit 309, the calculation unit 313, the storage unit 314, and the frequency detection unit 334 constitute a measurement unit 335.
- the decimation filters 301a and 301b have the same function as the decimation filter 101 in FIG.
- the BPFs 302a and 302b have the same function as the BPF 102 in FIG.
- the autocovariance function estimation unit 303 has the same function as the autocovariance function estimation unit 103 of FIG.
- the linear prediction filter 304 has the same function as the linear prediction filter 104 in FIG.
- the BPF 305 has the same function as the BPF 105 in FIG.
- the calculation unit 306 has the same function as the calculation unit 106 of FIG.
- the DFT unit 310 has the same function as the DFT units 107a and 107b in FIG.
- the band limiter 311 and the peak detector 312 realize the same function as the peak detectors 108a and 108b in FIG.
- the calculation unit 313 has the same function as the calculation unit 112 in FIG.
- the decimation filter 301a performs downsampling of the measurement signal 1.
- the decimation filter 301a supplies the down-sampled measurement signal 1 to the BPF 302a and the BPF 305.
- the decimation filter 301b performs downsampling of the measurement signal 2.
- the decimation filter 301b supplies the measurement signal 2 after downsampling to the BPF 302b.
- the BPF 302a extracts the frequency band N component of the measurement signal 1, and uses the extracted measurement signal including the frequency band N component (hereinafter referred to as the band signal 1N) as the self-covariance function estimation unit 303 and the linear prediction filter 304. , And the combined vector calculation unit 307.
- the BPF 302b extracts a component of a predetermined frequency band N of the measurement signal 2, and supplies a measurement signal including the extracted component of the frequency band N (hereinafter referred to as a band signal 2N) to the combined vector calculation unit 307.
- the auto-covariance function estimation unit 303 estimates the self-covariance function of the body motion signal included in the band signal 1N and supplies the estimation result to the linear prediction filter 304. To do.
- the linear prediction filter 304 Similar to the linear prediction filter 104 in FIG. 6, the linear prediction filter 304 generates an AR model of a body motion signal using the estimated autocovariance function, and generates a band signal based on the prediction result of the body motion signal. A body motion signal is extracted from 1N. The linear prediction filter 304 supplies the extracted body motion signal to the calculation unit 306.
- the BPF 305 extracts a component of the frequency band W of the measurement signal 1 and supplies a signal including the extracted component of the frequency band W (hereinafter referred to as a band signal 1W) to the calculation unit 306 and the selection unit 309.
- the calculation unit 306 adds the band signal W1 and the inverse signal of the body motion signal to obtain a difference between the band signal W1 and the body motion signal.
- the calculation unit 306 supplies a pulse wave signal, which is a difference signal between the band signal W1 and the body motion signal, to the selection unit 309.
- the combined vector calculation unit 307 calculates a combined vector of the band signal 1N and the band signal 2N.
- the combined vector calculation unit 307 supplies the calculation result of the combined vector to the determination unit 308.
- the determination unit 308 determines the presence / absence of obstacle body movement based on the calculation result of the composite vector.
- the determination unit 308 supplies the determination result of the presence / absence of obstacle body movement to the selection unit 309.
- the selection unit 309 selects a signal used for pulse measurement (hereinafter referred to as a pulse measurement signal) from the pulse wave signal and the band signal 1W based on the determination result of the presence or absence of obstacle body movement.
- the selection unit 309 supplies the selected pulse measurement signal to the DFT unit 310.
- the DFT unit 310 performs DFT of the pulse measurement signal and supplies the analysis result of the frequency of the pulse measurement signal to the band limiting unit 311 in the same manner as the DFT units 107a and 107b in FIG.
- the band limiting unit 311 limits the frequency band for detecting the peak frequency based on the detection value of the previous pulse wave frequency stored in the storage unit 314.
- the band limiting unit 311 supplies the peak detection unit 312 with the analysis result of the frequency of the pulse measurement signal and information indicating the frequency band for detecting the peak frequency.
- the peak detection unit 312 detects the peak frequency of the pulse measurement signal, similarly to the peak detection units 108a and 108b in FIG. This peak frequency becomes a measured value of the pulse wave frequency.
- the peak detection unit 312 supplies the measurement value of the pulse wave frequency to the calculation unit 313 and stores it in the storage unit 314.
- Calculating unit 313 calculates the pulse rate based on the pulse wave frequency.
- the calculation unit 313 outputs the calculated pulse rate to the outside as a measurement result.
- the storage unit 314 stores past pulse wave frequency measurement values.
- step S101 measurement signal acquisition is started in the same manner as in step S1 of FIG.
- the decimation filters 301a and 301b down-sample the measurement signal. Specifically, the decimation filter 301a down-samples the measurement signal 1 at a predetermined ratio, and supplies the measurement signal 1 after down-sampling to the BPF 302a and the BPF 305. The decimation filter 301b downsamples the measurement signal 2 at a predetermined ratio, and supplies the measurement signal 2 after downsampling to the BPF 302b.
- the BPF 302a, 302b and the BPF 305 limit the frequency band of the measurement signal. Specifically, the BPF 302a extracts the frequency band N component of the measurement signal 1 after downsampling. The BPF 302a supplies the extracted band signal 1N including the component of the frequency band N to the self-covariance function estimation unit 303, the linear prediction filter 304, and the combined vector calculation unit 307.
- the BPF 302b extracts the component of the frequency band N of the measurement signal 2 after downsampling.
- the BPF 302b supplies the band signal 2N including the extracted frequency band N component to the synthesized vector calculation unit 307.
- the BPF 305 extracts a component of frequency band W of measurement signal 1 after downsampling.
- the BPF 305 supplies the band signal 1W including the extracted component of the frequency band W to the calculation unit 306 and the selection unit 309.
- step S104 a body motion signal is extracted from the band signal 1N by the same processing as in step S4 of FIG.
- the extracted body motion signal is supplied to the calculation unit 306.
- step S105 the difference between the band signal 1W and the body motion signal is obtained by the same processing as in step S5 of FIG. 8, and the pulse wave signal is extracted.
- the extracted pulse wave signal is supplied to the selection unit 309.
- step S106 the body motion detection unit 333 detects body motion.
- the combined vector calculation unit 307 calculates a combined vector of the band signal 1N and the band signal 2N.
- the combined vector is a vector having the sample value (amplitude value) of the band signal 1N and the sample value (amplitude value) of the band signal 2N at the same sampling time as components.
- the combined vector calculation unit 307 supplies the calculation result of the combined vector to the determination unit 308.
- the determination unit 308 determines the presence / absence of obstacle body movement based on the composite vector.
- the determination method of the presence or absence of an obstruction body motion is demonstrated.
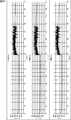
- 14 and 15 are graphs showing examples of time-series changes in the signal level of the measurement signal.
- the horizontal axis of each graph indicates time, and the vertical axis indicates the value of the measurement signal.
- FIG. 14 shows the time series of the signal level of the measurement signal when the subject moves only the arm finger wearing the measuring device 1 in the period from about 40 seconds to about 80 seconds and is stationary in the other period. It shows a change.
- the uppermost graph shows an example in which blue measurement light having a wavelength of 470 nm is used.
- the second graph from the top shows an example when yellow measurement light having a wavelength of 585 nm is used.
- the third graph shows an example where green measurement light having a wavelength of 530 nm is used.
- the measurement signal for the measurement light of all wavelengths does not change much and is stable.
- the vibration width of the measurement signal with respect to the yellow measurement light becomes very large.
- the values of the measurement signals for the measurement lights of other colors slightly increase, the vibration width does not change much.
- the vibration width of the measurement signal with respect to the yellow measurement light is reduced, but for a while, the vibration width of the measurement signal with respect to the yellow measurement light is the vibration of the measurement signal with respect to the measurement light of other colors.
- the state larger than the width continues.
- the measurement signal values for the measurement lights of all wavelengths continue to be larger than when stationary.
- the measurement signals for the measurement light of all wavelengths have returned to the stable state before moving the finger.
- FIG. 15 shows a time-series change in the signal level of the measurement signal when the subject moves the entire arm on which the measurement apparatus 1 is worn during a period from about 78 seconds to about 118 seconds and is stationary during the other period. Is shown.
- the uppermost graph shows an example in which red measurement light having a wavelength of 660 nm is used.
- the second graph from the top shows an example when blue measurement light having a wavelength of 470 nm is used.
- the third graph from the top shows an example when yellow measurement light having a wavelength of 585 nm is used.
- the measurement signals for the measurement lights of all wavelengths are not changed so much and are stable.
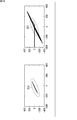
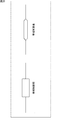
- FIG. 16 shows an example of the distribution of the combined vector within one measurement period.
- the graph on the left shows an example of the distribution of the combined vector when the subject is stationary, and the graph on the right shows an example of the distribution of the combined vector when the subject is moving.
- the horizontal axis of the left and right graphs shows the sample value of the measurement signal (band signal 1N) for the blue measurement light, and the vertical axis shows the sample value of the measurement signal (band signal 2N) for the yellow measurement light.
- the measurement signals for the measurement light of all wavelengths are not changed so much and are stable before the occurrence of body movement. Therefore, as shown in the graph on the left side of FIG. 16, it is assumed that the distribution of the combined vector when there is no obstacle movement is within a normal zone 351 that is a predetermined range surrounded by a dotted line.
- the value of the measurement signal increases and the vibration width increases.
- the change in the measurement signal differs depending on the wavelength of the measurement light as well as the type and size of the body movement. That is, as shown in the example of FIG. 14, depending on the type of body movement, there is a case where only the measurement signal with respect to the measurement light of a specific wavelength reacts greatly.
- the distribution of the combined vector in the case of obstacle movement is larger than the distribution of the combined vector at rest, and protrudes from the normal zone 351.
- the change in the measurement signal may vary depending on the wavelength of the measurement light, the combined vector may deviate significantly from the upward straight line passing through the origin.
- the determination unit 308 determines that there is no obstacle body movement. On the other hand, the determination unit 308 determines that there is an obstacle movement when the distribution of the combined vector does not fall within the normal zone 351. The determination unit 308 supplies the determination result to the selection unit 309.
- the selection unit 309 selects a signal (pulse measurement signal) used for pulse measurement based on the detection result of body movement. Specifically, when it is determined that there is an obstacle body motion, the selection unit 309 selects the pulse wave signal from the calculation unit 306 as a pulse measurement signal and supplies the pulse measurement signal to the DFT unit 310. On the other hand, if it is determined that there is no obstacle movement, the selection unit 309 selects the band signal 1W from the BPF 305 as a pulse measurement signal and supplies the pulse measurement signal to the DFT unit 310.
- step S108 the frequency detector 334 detects the pulse wave frequency.
- the DFT unit 310 performs frequency analysis of the pulse measurement signal by the same processing as step S6 in FIG. 8 and supplies the analysis result to the band limiting unit 311.
- the band limiting unit 311 limits the frequency band for detecting the peak frequency based on the previous detection value of the pulse wave frequency stored in the storage unit 314 by the same process as step S6 of FIG.
- the band limiting unit 311 supplies the peak detection unit 312 with the analysis result of the frequency of the pulse measurement signal and information indicating the frequency band for detecting the peak frequency.
- the peak detection unit 312 detects the peak frequency of the pulse measurement signal by the same process as step S6 of FIG. This peak frequency becomes a measured value of the pulse wave frequency.
- the peak frequency of the pulse wave signal is the measured value of the current pulse wave frequency.
- the peak frequency of the band signal 1W is the measured value of the current pulse wave frequency.
- the peak detection unit 312 supplies information indicating the pulse wave frequency to the calculation unit 112 and causes the storage unit 113 to store the information.
- step S109 the pulse rate is calculated in the same manner as in step S10 of FIG.
- step S110 the measurement result is output in the same manner as in step S11 of FIG.
- step S102 Thereafter, the process returns to step S102, and the processes after step S102 are repeatedly executed.
- the influence of body motion can be removed with a small amount of computation, and the pulse wave and pulse of the subject can be accurately measured.
- the second embodiment differs from the first embodiment and the second embodiment in the body motion signal extraction method and the body motion detection method.
- measurement light having one type of wavelength is used as in the first embodiment.
- an arithmetic processing unit 26c in FIG. 17 is used in the measurement apparatus 1 instead of the arithmetic processing unit 26a in FIG. 6 and the arithmetic processing unit 26b in FIG.
- the arithmetic processing unit 26c includes a decimation filter 501, a BPF (band pass filter) 502, a variable notch filter 503, an autocovariance function estimation unit 504, a linear prediction filter 505, a calculation unit 506, a body motion detection unit 507, a selection unit 508, A DFT (discrete Fourier transform) unit 509, a band limiting unit 510, a peak detection unit 511, a calculation unit 512, and a storage unit 513 are included.
- a decimation filter 501 a BPF (band pass filter) 502, a variable notch filter 503, an autocovariance function estimation unit 504, a linear prediction filter 505, a calculation unit 506, a body motion detection unit 507, a selection unit 508, A DFT (discrete Fourier transform) unit 509, a band limiting unit 510, a peak detection unit 511, a calculation unit 512, and a storage unit 513 are included.
- a DFT discrete Fourier transform
- the body motion signal extraction unit 531 is configured by the variable notch filter 503, the self-covariance function estimation unit 504, and the linear prediction filter 505.
- the BPF 502, the calculation unit 506, and the body motion signal extraction unit 531 constitute a pulse wave signal extraction unit 532.
- the DFT unit 509, the band limiting unit 510, and the peak detection unit 511 constitute a frequency detection unit 533.
- the selection unit 508, the calculation unit 512, the storage unit 513, and the frequency detection unit 533 constitute a measurement unit 534.
- the decimation filter 501 has the same function as the decimation filter 101 in FIG.
- the BPF 502 has the same function as the BPF 105 in FIG.
- the autocovariance function estimation unit 504 has the same function as the autocovariance function estimation unit 103 of FIG.
- the linear prediction filter 505 has the same function as the linear prediction filter 104 of FIG.
- the calculation unit 506 has the same function as the calculation unit 106 of FIG.
- the selection unit 508 has the same function as the selection unit 309 in FIG.
- the DFT unit 509 has the same function as the DFT units 107a and 107b in FIG.
- the band limiting unit 510 has the same function as the band limiting unit 311 in FIG.
- the peak detection unit 511 has the same function as the peak detection unit 312 in FIG.
- the calculation unit 512 has the same function as the calculation unit 112 in FIG.
- the decimation filter 501 performs downsampling of the measurement signal.
- the decimation filter 501 supplies the measurement signal after downsampling to the BPF 502.
- the BPF 502 extracts the frequency band W component of the measurement signal, and supplies the band signal W including the extracted frequency band W component to the variable notch filter 503, the calculation unit 506, and the selection unit 508.
- the variable notch filter 503 is a zero phase filter with a variable attenuation band.
- the variable notch filter 503 sets the attenuation band so as to include the previous measurement value of the pulse wave frequency stored in the storage unit 513, and attenuates the component of the attenuation band among the frequency components of the band signal W.
- the variable notch filter 503 supplies the attenuated signal (hereinafter referred to as a band signal W ′) to the self-covariance function estimation unit 504 and the linear prediction filter 505.
- variable notch filter 503 is a zero phase filter, the time axis information such as the body motion component is held as it is in the attenuated band signal W ′.
- the auto-covariance function estimation unit 504 estimates the self-covariance function of the body motion signal included in the band signal W ′ and sends the estimation result to the linear prediction filter 505. Supply.
- the linear prediction filter 505 Similar to the linear prediction filter 104 in FIG. 6, the linear prediction filter 505 generates an AR model of the body motion signal using the estimated autocovariance function, and generates a band signal based on the prediction result of the body motion signal. A body motion signal is extracted from W ′. The linear prediction filter 505 supplies the extracted body motion signal to the calculation unit 506.
- the calculation unit 506 adds the band signal W and the inverse signal of the body motion signal to obtain a difference between the band signal W and the body motion signal.
- the calculation unit 506 supplies a pulse wave signal, which is a difference signal between the band signal W and the body motion signal, to the selection unit 508.
- the body motion detection unit 507 detects body motion by a predetermined method, and determines the presence or absence of obstacle body motion. The body motion detection unit 507 supplies the determination result of the presence or absence of the obstacle body motion to the selection unit 508.
- the selection unit 508 selects a pulse measurement signal from the pulse wave signal and the band signal W based on the determination result of the presence or absence of obstacle body movement.
- the selection unit 508 supplies the selected pulse measurement signal to the DFT unit 509.
- the DFT unit 509 performs DFT of the pulse measurement signal and supplies the analysis result of the frequency of the pulse measurement signal to the band limiting unit 510, similarly to the DFT units 107a and 107b in FIG.
- the band limiting unit 510 limits the frequency band for detecting the peak frequency based on the previous detected pulse wave frequency value stored in the storage unit 513.
- the band limiting unit 510 supplies the peak detection unit 511 with the frequency analysis result of the pulse measurement signal and information indicating the frequency band for detecting the peak frequency.
- the peak detection unit 511 detects the peak frequency of the pulse measurement signal, similarly to the peak detection units 108a and 108b in FIG. This peak frequency becomes a measured value of the pulse wave frequency.
- the peak detection unit 511 supplies the measurement value of the pulse wave frequency to the calculation unit 512 and stores it in the storage unit 513.
- Calculating unit 512 calculates the pulse rate based on the pulse wave frequency.
- the calculation unit 512 outputs the calculated pulse rate to the outside as a measurement result.
- the storage unit 513 stores past pulse wave frequency measurement values.
- step S301 measurement signal acquisition is started in the same manner as in step S1 of FIG.
- the top graph in FIG. 19 shows an example of the waveform of the measurement signal.
- the horizontal axis of the graph indicates time, and the vertical axis indicates the amplitude value.
- step S302 the measurement signal is down-sampled in the same manner as in step S2 of FIG. Then, the measurement signal after downsampling is supplied to the BPF 502.
- the BPF 502 limits the frequency band of the measurement signal. Specifically, the BPF 502 extracts the frequency band W component of the measurement signal after downsampling. The BPF 502 supplies the band signal W including the extracted component of the frequency band W to the variable notch filter 503, the calculation unit 506, and the selection unit 508.
- the second graph from the top in FIG. 19 shows an example of the frequency distribution of the band signal W after limiting the frequency band of the measurement signal shown in the top graph.
- the horizontal axis of the graph indicates the frequency, and the vertical axis indicates the spectral intensity.
- a pulse wave spectrum appears near 1.6 Hz, and a body motion component spectrum appears at 1.5 Hz or lower. Further, there is almost no frequency component of 1.8 Hz or higher.
- the variable notch filter 503 attenuates the frequency component near the measurement value of the previous pulse wave frequency among the frequency components of the measurement signal (band signal W) after band limitation. Specifically, the variable notch filter 503 reads the measurement value of the previous pulse wave frequency from the storage unit 513.
- the variable notch filter 503 sets, for example, a predetermined band including a measurement value of the previous pulse wave frequency as an attenuation band. For example, a predetermined band centered on the previous measurement value of the pulse wave frequency is set as the attenuation band.
- variable notch filter 503 attenuates the component of the set attenuation band among the frequency components of the band signal W.
- the variable notch filter 503 supplies the attenuated band signal W ′ to the self-covariance function estimation unit 504 and the linear prediction filter 505.
- the pulse wave frequency does not change abruptly, it is assumed that most of the pulse wave component is included in the frequency component attenuated by the variable notch filter 503. Accordingly, the pulse signal component is hardly included in the band signal W ′.
- step S305 a body motion signal is extracted from the band signal W 'by the same processing as in step S4 of FIG.
- the extracted body motion signal is supplied to the calculation unit 506.
- the band signal W ′ contains almost no pulse wave component. Therefore, unlike the embodiment described above, the pulse signal component is hardly included in the body motion signal regardless of the amount of the body motion component included in the measurement signal.
- the third graph from the top in FIG. 19 shows an example of the frequency distribution of the body motion signal extracted from the band signal W shown in the second graph.
- the horizontal axis of the graph indicates the frequency, and the vertical axis indicates the spectral intensity.
- the spectrum of the pulse wave included in the band signal W disappears in the body motion signal.
- step S306 the difference between the band signal W and the body motion signal is obtained by the same processing as in step S5 in FIG. 8, and the pulse wave signal is extracted.
- the extracted pulse wave signal is supplied to the selection unit 508.
- the pulse wave component is hardly included in the body motion signal, the pulse wave component is surely included in the pulse wave signal.
- the fourth graph from the top in FIG. 19 shows an example of the frequency component of the pulse wave signal obtained by taking the difference between the band signal W shown in the second graph from the top and the body motion signal in the third graph. ing.
- the horizontal axis of the graph indicates the frequency, and the vertical axis indicates the spectral intensity.
- a pulse wave component is extracted from the band signal W, and other components are attenuated in number. Therefore, the pulse wave component is very large compared to the body motion component.
- the body motion detection unit 507 detects body motion. For example, the body motion detection unit 507 detects body motion based on a detection signal from a sensor (not shown) such as a triaxial acceleration sensor or a gyro sensor included in the measurement device 1. Then, the body motion detection unit 507 determines the presence or absence of the obstacle body motion based on the detection result of the body motion. The body motion detection unit 507 supplies the determination result of the presence or absence of the obstacle body motion to the selection unit 508.
- a sensor not shown
- the body motion detection unit 507 determines the presence or absence of the obstacle body motion based on the detection result of the body motion.
- the body motion detection unit 507 supplies the determination result of the presence or absence of the obstacle body motion to the selection unit 508.
- step S308 as in the process of step S107 in FIG. 13, a signal (pulse measurement signal) used for pulse measurement is selected based on the detection result of body movement.
- step S309 the pulse wave frequency is detected in the same manner as in step S108 of FIG.
- the fifth graph from the top in FIG. 19 shows the frequency of the pulse wave signal after the detection range is limited in step S309 when the pulse wave signal in the fourth graph from the top is selected as the pulse measurement signal.
- the distribution is shown.
- the horizontal axis of the graph indicates the frequency, and the vertical axis indicates the spectral distribution.
- the bottom graph in FIG. 19 shows the waveform of the pulse wave signal after subtracting the body motion signal having the frequency distribution of the third graph from the measurement signal of the first graph from the top.
- the horizontal axis of the graph indicates time, and the vertical axis indicates the amplitude value.
- step S310 the pulse rate is calculated in the same manner as in step S109 of FIG.
- step S311 the measurement result is output in the same manner as in step S110 of FIG.
- step S302 Thereafter, the process returns to step S302, and the processes after step S302 are repeatedly executed.
- the influence of body movement can be removed with a small amount of computation, and the pulse wave and pulse of the subject can be accurately measured. .
- one BPF can be reduced as compared with the first embodiment and the second embodiment. Furthermore, in the third embodiment, a pulse wave signal obtained by extracting a pulse wave component with high accuracy can be generated.
- the body motion detection method described above is an example, and other methods may be employed.
- the body motion detection unit may detect body motion based on a change in the signal level (for example, amplitude value, amplitude width, etc.) of the measurement signal.
- the body motion detection unit 133 or the body motion detection unit 333 may determine that there is an obstacle body motion when the amount of change in the signal level of the measurement signal is equal to or greater than a predetermined threshold.
- the tendency of the measurement signal to vary greatly differs depending on the wavelength of the measurement light and the type of body movement. Therefore, for example, when measuring light having two or more types of wavelengths is used, the body motion detection unit determines that obstacle body motion has occurred if at least one of a plurality of measurement signals for each measurement light satisfies a predetermined condition. You may make it do.
- FIG. 20 schematically shows the measurement signal before limiting the frequency band and the envelope of the measurement signal after limiting.
- the body motion detection unit may detect the body motion based on the measurement signal before removing the DC component and before limiting the frequency band or performing downsampling.
- body movement may be detected by combining a plurality of body movement detection methods.
- the frequency corresponding to that peak is pulsed. You may make it measure as a wave frequency.
- the pulse wave component is surely included in the pulse wave signal. Therefore, for example, it is possible to omit the body motion detection process and always measure the peak frequency of the pulse wave signal as the pulse wave frequency.
- the order of the AR model of the linear prediction filter may be changed based on the level (for example, amplitude value) of the measurement signal (band signal W or band signal 1W).
- the separation accuracy of the body motion component and the pulse wave component of the linear prediction filter does not decrease much even if the order of the AR model of the linear prediction filter is increased. Also, by increasing the order of the AR model of the linear prediction filter, the noise separation accuracy of the linear prediction filter is improved.
- the ratio of the body motion component to the pulse wave component is low, the accuracy of separation of the body motion component and the pulse wave component of the linear prediction filter decreases when the order of the AR model of the linear prediction filter is increased.
- the linear prediction filter may increase the order of the AR model as the level of the measurement signal increases, and decrease the order of the AR model as the level of the measurement signal decreases.
- an AR model of a body motion signal may be generated by a method other than the Yule-Walker method.
- ⁇ Modifications related to downsampling For example, by extracting a component of a predetermined band (for example, 1 to 2 octaves) centered on the previous pulse wave frequency by BPF and shifting the frequency of the extracted signal, the ratio of down-sampling the measurement signal is further increased. It is possible to lower.
- a component of a predetermined band for example, 1 to 2 octaves
- the component of the frequency band of the detection range R2 is extracted from the measurement signal by the BPF.
- the frequency band of the extracted signal is shifted to the frequency band R2 ′′ in the lower diagram.
- the detectable frequency component of the measurement signal after downsampling is not less than the range R1 ′′ that is narrower than the range R1. If it can be ensured, the pulse wave frequency can be detected. Therefore, the downsampling ratio of the measurement signal can be further reduced.
- the sampling frequency of the measurement signal may be lowered within a range in which the pulse wave frequency can be measured without downsampling.
- a pulse wave signal can be output as a measurement result.
- one of the pulse wave signal and the band signal W (or band signal 1W) is selected based on the result of body motion detection, and the selected signal is output as a pulse wave measurement result. Also good. In any case, it is desirable to output the signal after removing the noise.
- pulse rate pulse wave frequency
- pulse wave signal or band signal W or band signal 1W
- a body motion signal may be included in the measurement result.
- the measurement unit 335 shown in FIG. 12 or the measurement unit 534 shown in FIG. 17 may be used.
- the measurement unit 335 in FIG. 12 or the measurement unit 534 in FIG. 17 may be used.
- the change in the waveform of the measurement signal differs depending on the wavelength of the measurement light and the type of body movement.
- the type of body movement may be classified based on the difference in waveform change.
- the measuring device 1 can be configured by a system composed of a plurality of devices.
- a part or all of the arithmetic processing unit 26 may be provided in a device different from the device worn on the subject, and measurement signals may be transmitted between the devices by wireless communication or wired communication.
- the measurement device is attached to a person's arm
- the present technology can also be applied to a measurement device attached to a portion other than the arm.
- the shape of the measuring device can be a shape other than the wristband type described above.
- the present technology can be applied to the case of measuring the pulse wave and pulse of a living organism other than a human being.
- the series of processes described above can be executed by hardware or can be executed by software.
- a program constituting the software is installed in the computer.
- the computer includes, for example, a general-purpose personal computer capable of executing various functions by installing various programs by installing a computer incorporated in dedicated hardware.
- FIG. 22 is a block diagram showing an example of the hardware configuration of a computer that executes the above-described series of processing by a program.
- a CPU Central Processing Unit
- ROM Read Only Memory
- RAM Random Access Memory
- An input / output interface 705 is further connected to the bus 704.
- An input unit 706, an output unit 707, a storage unit 708, a communication unit 709, and a drive 710 are connected to the input / output interface 705.
- the input unit 706 includes a keyboard, a mouse, a microphone, and the like.
- the output unit 707 includes a display, a speaker, and the like.
- the storage unit 708 includes a hard disk, a nonvolatile memory, and the like.
- the communication unit 709 includes a network interface.
- the drive 710 drives a removable medium 711 such as a magnetic disk, an optical disk, a magneto-optical disk, or a semiconductor memory.
- the CPU 701 loads the program stored in the storage unit 708 to the RAM 703 via the input / output interface 705 and the bus 704 and executes the program, for example. Is performed.
- the program executed by the computer (CPU 701) can be provided by being recorded in, for example, a removable medium 711 as a package medium or the like.
- the program can be provided via a wired or wireless transmission medium such as a local area network, the Internet, or digital satellite broadcasting.
- the program can be installed in the storage unit 708 via the input / output interface 705 by attaching the removable medium 711 to the drive 710. Further, the program can be received by the communication unit 709 via a wired or wireless transmission medium and installed in the storage unit 708. In addition, the program can be installed in advance in the ROM 702 or the storage unit 708.
- the program executed by the computer may be a program that is processed in time series in the order described in this specification, or in parallel or at a necessary timing such as when a call is made. It may be a program for processing.
- the system means a set of a plurality of components (devices, modules (parts), etc.), and it does not matter whether all the components are in the same housing. Accordingly, a plurality of devices housed in separate housings and connected via a network and a single device housing a plurality of modules in one housing are all systems. .
- the present technology can take a cloud computing configuration in which one function is shared by a plurality of devices via a network and is jointly processed.
- each step described in the above flowchart can be executed by one device or can be shared by a plurality of devices.
- the plurality of processes included in the one step can be executed by being shared by a plurality of apparatuses in addition to being executed by one apparatus.
- the present technology can take the following configurations.
- Body motion including a component caused by body motion from a first band signal including a component of a first frequency band of a first measurement signal acquired by irradiating a portion including a pulse with light of a first wavelength
- a body motion signal extraction unit for extracting a signal A measuring device comprising: an arithmetic unit that generates a pulse wave signal that is a difference signal between a second band signal including a second frequency band component of the first measurement signal and the body motion signal.
- the measuring apparatus in any one of.
- the body motion signal extraction unit extracts the body motion signal from a signal obtained by attenuating a frequency component of a band including a measurement value of a previous pulse wave frequency among frequency components of the first band signal.
- the measuring device according to 5).
- the measuring unit is A frequency detector that detects a first peak frequency that is a peak frequency of the pulse wave signal and a second peak frequency that is a peak frequency of the second band signal; A selection unit that selects the pulse wave frequency from the first peak frequency and the second peak frequency based on at least one of the detection result of the body motion and the previous measurement value of the pulse wave frequency;
- the measuring apparatus according to (5), provided.
- the measurement device wherein the frequency detection unit limits a frequency band in which the first peak frequency and the second peak frequency are detected based on a measurement value of a previous pulse wave frequency.
- the frequency detection unit detects the first peak frequency based on a result of Fourier transform of the pulse wave signal obtained by padding a sample having a value of 0, and the second band in which the sample having a value of 0 is padded.
- the measurement device according to (7) or (8), wherein the second peak frequency is detected based on a result of Fourier transform of the signal.
- the measuring unit is A selection unit that selects the pulse wave signal or the second band signal based on the detection result of the body movement;
- the measurement device according to (5) further comprising: a frequency detection unit that detects a peak frequency of the signal selected by the selection unit as the pulse wave frequency.
- the measurement device according to (10) wherein the frequency detection unit limits a frequency band in which the peak frequency is detected based on a measurement value of a previous pulse wave frequency.
- the frequency detection unit detects the peak frequency based on a result obtained by performing Fourier transform on a signal obtained by padding a signal with a value of 0 to the signal selected by the selection unit. (10) or (11) Measuring device.
- the measurement device according to any one of (5) to (12), wherein the body motion detection unit detects the body motion based on a frequency distribution of the body motion signal.
- the body motion detection unit includes a third band signal including a component of the first frequency band of a second measurement signal acquired by irradiating a portion including the pulse with light of a second wavelength, and the The measurement device according to any one of (5) to (13), wherein the body motion is detected based on a distribution of a combined vector with the first band signal.
- the body motion detection unit is based on the change in the first measurement signal and the change in the second measurement signal acquired by irradiating the portion including the pulse with the light having the second wavelength.
- the measurement device according to any one of (5) to (14), wherein body movement is detected.
- the measurement device calculates a pulse rate based on the pulse wave frequency.
- the second frequency band includes a pulse wave frequency range to be measured, and the maximum value of the second frequency band is larger than the maximum value of the first frequency band.
- a filter for extracting the first band signal from the first measurement signal The first frequency band is the same as the second frequency band, and includes a range of pulse wave frequencies to be measured, The measurement device according to any one of (1) to (16), wherein the first band signal and the second band signal are the same signal.
- a body motion signal extraction step for extracting A calculation method including: a calculation step of generating a pulse wave signal that is a difference signal between a second band signal including a component of a second frequency band of the first measurement signal and the body motion signal.
- 1 measurement device 11 main body, 22, 22a to 22c LED, 23 light receiving IC, 26, 26a to 26c arithmetic processing unit, 51 LED driver, 53 light receiving element, 54 AD converter, 101 decimation filter, 102 BPF, 103 self-shared Variance function estimation unit, 104 linear prediction filter, 105 BPF, 106 operation unit, 107a, 107b DFT unit, 108a, 108b peak detection unit, 109 DFT unit, 110 determination unit, 111 selection unit, 112 calculation unit, 131 body motion signal Extraction unit, 132 pulse wave signal extraction unit, 133 body motion detection unit, 134 frequency detection unit, 135 measurement unit, 301a, 301b decimation filter, 302a, 302b BP , 303 self-covariance function estimation unit, 304 linear prediction filter, 305 BPF, 306 operation unit, 307 synthesized vector generation unit, 308 determination unit, 309 selection unit, 310 DFT unit, 311 band limiting unit, 312 peak detection unit, 313
Abstract
本技術は、脈波や脈拍の計測精度を向上させることができるようにする計測装置及び計測方法に関する。 体動信号抽出部は、所定の波長の光を脈を含む部分に照射することにより取得された第1の計測信号の第1の周波数帯域の成分を含む第1の帯域信号から、体動により生じる成分を含む体動信号を抽出する。演算部は、第1の計測信号の第2の周波数帯域の成分を含む第2の帯域信号と体動信号との差分信号である脈波信号を生成する。本技術は、例えば、脈波や脈拍を計測する装置に適用することができる。
Description
本技術は、計測装置及び計測方法に関し、特に、脈波や脈拍の計測を行う場合に用いて好適な計測装置及び計測方法に関する。
近年、脈波や脈拍を計測する光学方式の計測装置が普及している(例えば、特許文献1参照)。
しかし、光学方式の計測装置では、計測対象となる被験者の体動により生じる体動成分を計測信号から除去するのは非常に困難である。特に、腕の表面等の動きが大きい部位で計測する場合、脈波により生じる脈波成分より体動成分が大きくなることも多く、体動成分の除去がより困難になる。その結果、脈波や脈拍の計測精度が低下する。
そこで、本技術は、脈波や脈拍の計測精度を向上させるようにするものである。
本技術の一側面の計測装置は、第1の波長の光を脈を含む部分に照射することにより取得された第1の計測信号の第1の周波数帯域の成分を含む第1の帯域信号から、体動により生じる成分を含む体動信号を抽出する体動信号抽出部と、前記第1の計測信号の第2の周波数帯域の成分を含む第2の帯域信号と前記体動信号との差分信号である脈波信号を生成する演算部とを備える。
前記体動信号抽出部には、自己回帰モデルを用いて前記体動信号を予測して抽出させることができる。
前記体動信号抽出部には、ユール-ウォーカー法を用いて、次数が5次から12次までの範囲内の前記自己回帰モデルを生成させることができる。
前記体動信号抽出部には、前記第1の帯域信号のレベルに基づいて、前記自己回帰モデルの次数を設定させることができる。
前記体動の検出を行う体動検出部と、前記脈波信号及び前記第2の帯域信号の中から前記体動の検出結果に基づいて選択した信号に基づいて、脈波周波数を計測する計測部とをさらに設けることができる。
前記体動信号抽出部には、前記第1の帯域信号の周波数成分のうち、前回の脈波周波数の計測値を含む帯域の周波数成分を減衰させた信号から、前記体動信号を抽出させることができる。
前記計測部には、前記脈波信号のピーク周波数である第1のピーク周波数、及び、前記第2の帯域信号のピーク周波数である第2のピーク周波数を検出する周波数検出部と、前記体動の検出結果、及び、前回の脈波周波数の計測値のうち少なくとも一方に基づいて、前記第1のピーク周波数及び前記第2のピーク周波数から前記脈波周波数を選択する選択部とを設けることができる。
前記周波数検出部には、前回の脈波周波数の計測値に基づいて、前記第1のピーク周波数及び前記第2のピーク周波数を検出する周波数帯域を制限させることができる。
前記周波数検出部には、値が0のサンプルをパディングした前記脈波信号をフーリエ変換した結果に基づいて、前記第1のピーク周波数を検出させ、値が0のサンプルをパディングした前記第2の帯域信号をフーリエ変換した結果に基づいて、前記第2のピーク周波数を検出させることができる。
前記計測部には、前記体動の検出結果に基づいて、前記脈波信号又は前記第2の帯域信号を選択する選択部と、前記選択部により選択された信号のピーク周波数を前記脈波周波数として検出する周波数検出部とを設けることができる。
前記周波数検出部には、前回の脈波周波数の計測値に基づいて、前記ピーク周波数を検出する周波数帯域を制限させることができる。
前記周波数検出部には、前記選択部により選択された信号に値が0のサンプルをパディングした信号をフーリエ変換した結果に基づいて、前記ピーク周波数を検出させることができる。
前記体動検出部には、前記体動信号の周波数分布に基づいて、前記体動の検出を行わせることができる。
前記体動検出部には、第2の波長の光を前記脈を含む部分に照射することにより取得された第2の計測信号の前記第1の周波数帯域の成分を含む第3の帯域信号と前記第1の帯域信号との合成ベクトルの分布に基づいて、前記体動の検出を行わせることができる。
前記体動検出部には、前記第1の計測信号の変化、及び、第2の波長の光を前記脈を含む部分に照射することにより取得された第2の計測信号の変化に基づいて、前記体動の検出を行わせることができる。
前記計測部には、前記脈波周波数に基づいて、脈拍数を計算させることができる。
前記第1の計測信号から前記第1の帯域信号を抽出する第1のフィルタと、前記第1の計測信号から前記第2の帯域信号を抽出する第2のフィルタとをさらに設け、前記第2の周波数帯域に、計測対象とする脈波周波数の範囲を含ませ、前記第2の周波数帯域の最大値を、前記第1の周波数帯域の最大値より大きくすることができる。
前記第1の計測信号から前記第1の帯域信号を抽出するフィルタをさらに設け、前記第1の周波数帯域を、前記第2の周波数帯域と同じにし、計測対象とする脈波周波数の範囲を含むようにし、前記第1の帯域信号と前記第2の帯域信号を同じ信号にすることができる。
本技術の一側面の計測方法は、所定の波長の光を脈を含む部分に照射することにより取得された第1の計測信号の第1の周波数帯域の成分を含む第1の帯域信号から、体動により生じる成分を含む体動信号を抽出する体動信号抽出ステップと、前記第1の計測信号の第2の周波数帯域の成分を含む第2の帯域信号と前記体動信号との差分信号である脈波信号を生成する演算ステップとを含む。
本技術の一側面においては、所定の波長の光を脈を含む部分に照射することにより取得された第1の計測信号の第1の周波数帯域の成分を含む第1の帯域信号から、体動により生じる成分を含む体動信号が抽出され、前記第1の計測信号の第2の周波数帯域の成分を含む第2の帯域信号と前記体動信号との差分信号である脈波信号が生成される。
本技術の一側面によれば、計測信号から脈波成分を高精度に抽出することができる。また、本技術の一側面によれば、脈波や脈拍の計測精度を向上させることができる。
以下、本技術を実施するための形態(以下、実施の形態という)について説明する。なお、説明は以下の順序で行う。
1.脈波と体動の関係
2.第1の実施の形態
3.第2の実施の形態
4.第3の実施の形態
5.変形例
1.脈波と体動の関係
2.第1の実施の形態
3.第2の実施の形態
4.第3の実施の形態
5.変形例
<1.脈波と体動の関係>
図1の各グラフは、光学式の計測装置により被験者の腕の脈波を計測した信号をFFT(高速フーリエ変換)により周波数解析した結果の例を示している。各グラフの横軸は周波数を示し、縦軸はスペクトル強度を示している。また、被験者が静止した状態から、足踏みし、その後駆け足をした場合の計測信号の周波数分布の変化が、いちばん上のグラフから順に示されている。
図1の各グラフは、光学式の計測装置により被験者の腕の脈波を計測した信号をFFT(高速フーリエ変換)により周波数解析した結果の例を示している。各グラフの横軸は周波数を示し、縦軸はスペクトル強度を示している。また、被験者が静止した状態から、足踏みし、その後駆け足をした場合の計測信号の周波数分布の変化が、いちばん上のグラフから順に示されている。
図1のいちばん上のグラフは、被験者が静止している場合の計測信号の周波数分布を示している。上から2番目から4番目のグラフは、被験者が足踏みしている場合の計測信号の周波数分布を示している。上から5番目から8番目のグラフは、被験者が駆け足をしている場合の解析結果を示している。なお、各グラフの計測信号の計測時の被験者の脈拍は、上から順に、68bpm(beats per minute)、89bpm、84bpm、86bpm、89bpm、94bpm、94bpm、102bpmとなっている。
また、各グラフの矢印で示される周波数のピークは、被験者の脈波の周波数(以下、脈波周波数と称する)を示し、黒丸で示される周波数のピークは、被験者の体動の周波数(以下、体動周波数と称する)を示している。
この例に示されるように、体動成分の基本周波数は、一般的に脈波周波数よりやや低くなる。また、体動成分は、周期性の高い倍音成分を含む。さらに、体動成分のエネルギーは、脈波成分のエネルギーと比較して非常に大きくなる。また、脈波成分の周波数スペクトルと体動成分の周波数スペクトルは、運動量が大きくなり、脈拍が速くなるにつれて接近する。
従って、櫛形フィルタやBPF(バンドパスフィルタ)では、脈波成分と体動成分とを精度よく分離するのは非常に困難である。また、体動成分のエネルギーが脈波成分のエネルギーと比較して非常に大きいため、静止時の脈波を学習し、体動時の計測信号から抽出するのは非常に困難である。また、より高精度に計測信号から脈波成分を抽出するためには、膨大な演算量が必要になる。そのため、CPU(Central Processing Unit)やメモリ等のリソースや消費電力が増大したり、処理時間が長くなりリアルタイムでの処理が困難になったりする。
以下に述べる本技術の各実施の形態では、このような性質を有する体動成分の影響を除去して、脈波及び脈拍を高精度に計測することが可能になる。
<2.第1の実施の形態>
{計測装置1の構成例}
図2及び図3は、本技術を適用した計測装置の第1の実施の形態である計測装置1の構成例を示している。図2は、計測装置1の外観の構成例を示している。図3は、計測装置1の本体部11の構成例を示している。
{計測装置1の構成例}
図2及び図3は、本技術を適用した計測装置の第1の実施の形態である計測装置1の構成例を示している。図2は、計測装置1の外観の構成例を示している。図3は、計測装置1の本体部11の構成例を示している。
計測装置1は、光学方式により被験者の脈拍を計測するリストバンド型の計測装置である。図2に示されるように、計測装置1は、本体部11とバンド12により構成され、腕時計のようにバンド12が被験者の腕(手首)2に装着される。そして、本体部11が、所定の波長の計測光を被験者の腕2の脈を含む部分に照射し、戻ってきた光の強度に基づいて、被験者の脈拍の計測を行う。
本体部11は、基板21、LED22、受光IC23、遮光体24、操作部25、演算処理部26、表示部27、及び、無線装置28を含むように構成される。LED22、受光IC23、及び、遮光体24は、基板21上に設けられている。
LED22は、受光IC23の制御の下に、所定の波長の計測光を被験者の腕2の脈を含む部分に照射する。
受光IC23は、計測光が腕2に照射された後に戻ってきた光を受光する。受光IC23は、戻ってきた光の強度を示すデジタルの計測信号を生成し、生成した計測信号を演算処理部26に供給する。
遮光体24は、基板21上においてLED22と受光IC23の間に設けられている。遮光体24は、LED22からの計測光が、受光IC23に直接入射されることを防止する。
操作部25は、例えば、ボタン、スイッチ等の各種の操作部材により構成され、本体部11の表面等に設けられる。操作部25は、計測装置1の操作に用いられ、操作内容を示す信号を演算処理部26に供給する。
演算処理部26は、受光IC23から供給される計測信号に基づいて、被験者の脈拍を計測するための演算処理を行う。演算処理部26は、脈拍の計測結果を表示部27及び無線装置28に供給する。
表示部27は、例えば、LCD(Liquid Crystal Display)等の表示装置により構成され、本体部11の表面に設けられる。表示部27は、被験者の脈拍の計測結果等を表示する。
無線装置28は、所定の方式の無線通信により、被験者の脈拍の計測結果を外部の装置に送信する。例えば、図3に示されるように、無線装置28は、被験者の脈拍の計測結果をスマートフォン3に送信し、スマートフォン3の画面3Aに計測結果を表示させる。なお、無線装置28の通信方式には、任意の方式を採用することができる。
{受光IC23の構成例}
図4は、受光IC23の構成例を示している。なお、この例では、計測装置1のLED22が、LED22a乃至22cの3つのLEDにより構成される場合の例を示している。LED22a乃至22cは、それぞれ異なる波長の計測光を発する。
図4は、受光IC23の構成例を示している。なお、この例では、計測装置1のLED22が、LED22a乃至22cの3つのLEDにより構成される場合の例を示している。LED22a乃至22cは、それぞれ異なる波長の計測光を発する。
受光IC23は、LEDドライバ51、セレクタ52、受光素子53、ADコンバータ54、及び、通信部55を含むように構成される。
LEDドライバ51は、セレクタ52を介して、LED22a乃至22cに駆動信号を供給し、LED22a乃至22cの点灯、消灯、発光量等を制御する。
セレクタ52は、LEDドライバ51から供給される駆動信号の供給先をLED22a乃至22cの中から選択し、選択したLEDに駆動信号を供給する。
受光素子53は、LED22a乃至22cからの計測光が腕2に照射された後に戻ってくる光を受光する。受光素子53は、受光した光の強度を示すアナログの電気信号である計測信号をADコンバータ54に供給する。
ADコンバータ54は、所定のサンプリング周波数で、計測信号のサンプリングを行い、アナログの計測信号をデジタルの計測信号に変換する。ADコンバータ54は、デジタルの計測信号を通信部55に供給する。なお、ADコンバータ54のサンプリング周波数は、例えば、200~220Hzとされる。以下、ADコンバータ54のサンプリング周波数が200Hzの場合を例に挙げて説明する。
通信部55は、所定の方式の有線通信により演算処理部26と通信を行い、計測信号や各種の制御信号等の送受信を行う。なお、通信部55の通信方式には、I2C等の任意の方式を採用することができる。
なお、図4に示されるように、受光IC23は、被験者の腕2以外の部位(例えば、指4、耳たぶ(不図示)等)において脈拍の計測を行う場合にも用いることができる。
{受光IC23の動作例}
ここで、図5のタイミングチャートを参照して、受光IC23の動作例について説明する。図5の1段目は、演算処理部26から受光IC23の通信部55に供給される制御信号のタイミングを示している。2段目は、ADコンバータ54の動作期間を示している。3段目は、LED22a乃至22cの発光期間を示している。なお、この図では、LED22aをLEDaと表し、LED22bをLEDbと表し、LED22cをLEDcと表している。
ここで、図5のタイミングチャートを参照して、受光IC23の動作例について説明する。図5の1段目は、演算処理部26から受光IC23の通信部55に供給される制御信号のタイミングを示している。2段目は、ADコンバータ54の動作期間を示している。3段目は、LED22a乃至22cの発光期間を示している。なお、この図では、LED22aをLEDaと表し、LED22bをLEDbと表し、LED22cをLEDcと表している。
受光IC23は、演算処理部26から通信部55にWrite信号が供給されたとき動作を開始する。
具体的には、まず、LEDドライバ51は、セレクタ52を介してLED22aに駆動信号を供給し、LED22aにパルス状の計測光を発光させる。受光素子53は、LED22aからの計測光が腕2に照射された後に戻ってきた光を受光する。受光素子53は、受光した光の強度を示すアナログの電気信号である計測信号(以下、計測信号aと称する)をADコンバータ54に供給する。ADコンバータ54は、アナログの計測信号aのサンプリングを行い、デジタルの計測信号aにAD変換する。ADコンバータ54は、デジタルの計測信号aを通信部55に供給する。
LEDドライバ51は、計測信号aのAD変換の終了後、セレクタ52を介してLED22bに駆動信号を供給し、LED22bにパルス状の計測光を発光させる。受光素子53は、LED22bからの計測光が腕2に照射された後に戻ってきた光を受光する。受光素子53は、受光した光の強度を示すアナログの電気信号である計測信号(以下、計測信号bと称する)をADコンバータ54に供給する。ADコンバータ54は、アナログの計測信号bのサンプリングを行い、デジタルの計測信号bにAD変換する。ADコンバータ54は、デジタルの計測信号bを通信部55に供給する。
LEDドライバ51は、計測信号bのAD変換の終了後、セレクタ52を介してLED22cに駆動信号を供給し、LED22cにパルス状の計測光を発光させる。受光素子53は、LED22cからの計測光が腕2に照射された後に戻ってきた光を受光する。受光素子53は、受光した光の強度を示すアナログの電気信号である計測信号(以下、計測信号cと称する)をADコンバータ54に供給する。ADコンバータ54は、アナログの計測信号cのサンプリングを行い、デジタルの計測信号cにAD変換する。ADコンバータ54は、デジタルの計測信号cを通信部55に供給する。
通信部55は、演算処理部26からRead信号が供給されたとき、計測信号a乃至cを演算処理部26に供給する。
その後、所定の時間のアイドル期間の経過後に、上述したLED22aの発光から計測信号a乃至cを演算処理部26への供給までの一連の処理が実行される。
以上の処理が、例えば、所定の期間或いは回数、又は、演算処理部26から停止の指令が入力されるまで、繰り返し実行される。
なお、図4及び図5では、計測光の波長が3種類の場合の例を示したが、計測光の波長を1種類、2種類、又は、4種類以上に設定することも可能である。なお、以下、第1の実施の形態において、計測光の波長が1種類の場合を例に挙げて説明する。
{演算処理部26aの構成例}
図6は、計測装置1の演算処理部26の第1の実施の形態である演算処理部26aの構成例を示している。演算処理部26aは、デシメーションフィルタ101、BPF(バンドパスフィルタ)102、自己共分散関数推定部103、線形予測フィルタ104、BPF(バンドパスフィルタ)105、演算部106、DFT(離散フーリエ変換)部107a,107b、ピーク検出部108a,108b、DFT(離散フーリエ変換)部109、判定部110、選択部111、計算部112、及び、記憶部113を含むように構成される。
図6は、計測装置1の演算処理部26の第1の実施の形態である演算処理部26aの構成例を示している。演算処理部26aは、デシメーションフィルタ101、BPF(バンドパスフィルタ)102、自己共分散関数推定部103、線形予測フィルタ104、BPF(バンドパスフィルタ)105、演算部106、DFT(離散フーリエ変換)部107a,107b、ピーク検出部108a,108b、DFT(離散フーリエ変換)部109、判定部110、選択部111、計算部112、及び、記憶部113を含むように構成される。
また、自己共分散関数推定部103及び線形予測フィルタ104により、体動信号抽出部131が構成される。BPF102、BPF105、演算部106、及び、体動信号抽出部331により、脈波信号抽出部132が構成される。DFT部109及び判定部110により、体動検出部133が構成される。DFT部107a,107b及びピーク検出部108a,108bにより、周波数検出部134が構成される。選択部111、計算部112、記憶部113、及び、周波数検出部134により、計測部135が構成される。
デシメーションフィルタ101は、計測信号のダウンサンプリングを行う。デシメーションフィルタ101は、ダウンサンプリング後の計測信号をBPF102及びBPF105に供給する。
BPF102は、例えば、2段の3次のIIR(Infinite Impulse Response)フィルタにより構成されるゼロ位相フィルタからなる。BPF102は、計測信号の所定の周波数帯域(以下、周波数帯域Nと称する)の成分を通過させ、周波数帯域N以外の成分を遮断する。また、BPF102は、例えば、計測信号に対して、1段目の3次のIIRフィルタを掛けた後に、サンプルの順番を逆方向にして、1段目と同一の2段目の3次のIIRフィルタを掛ける等の方法で位相歪みを相殺する。BPF102は、抽出した周波数帯域Nの成分を含む信号(以下、帯域信号Nと称する)を、自己共分散関数推定部103及び線形予測フィルタ104に供給する。
なお、BPF102はゼロ位相フィルタなので、抽出した帯域信号Nにおいて体動成分等の時間軸情報が保持される。
自己共分散関数推定部103は、帯域信号Nに含まれる体動信号の自己共分散関数を推定する。体動信号は、被験者の体動により生じる体動成分を含む信号である。自己共分散関数推定部103は、自己共分散関数の推定結果を線形予測フィルタ104に供給する。
線形予測フィルタ104は、例えば、ユール-ウォーカー法によるパワースペクトル密度推定アルゴリズムによって作られる線形予測フィルタからなる。例えば、線形予測フィルタ104は、自己共分散関数推定部103により推定された自己共分散関数を用いて、体動信号のARモデル(自己相関モデル)のパラメータをユール-ウォーカー法により求める。これにより、体動信号のARモデルが生成される。線形予測フィルタ104は、生成したARモデルを用いて体動信号を予測し、体動成分が脈波成分に対して十分大きい場合、レベルの低い脈波成分及びノイズ成分を含まない体動成分だけからなる体動信号を帯域信号Nから抽出する。線形予測フィルタ104は、抽出した体動信号を演算部106及びDFT部109に供給する。
BPF105は、例えば、BPF102と同様に、2段の3次のIIR(Infinite Impulse Response)フィルタにより構成されるゼロ位相フィルタからなる。BPF105は、計測信号の所定の周波数帯域(以下、周波数帯域Wと称する)の成分を通過させ、周波数帯域W以外の成分を遮断する。BPF105は、抽出した周波数帯域Wの成分を含む信号(以下、帯域信号Wと称する)を、演算部106及びDFT部107bに供給する。
なお、BPF105はゼロ位相フィルタなので、抽出した帯域信号Wにおいて脈波成分等の時間軸情報が保持される。
演算部106は、帯域信号Wと体動信号の逆信号とを加算することにより、帯域信号Wと体動信号の差分をとる。演算部106は、帯域信号Wと体動信号の差分をとることにより生成される差分信号(以下、脈波信号と称する)をDFT部107aに供給する。
DFT部107aは、脈波信号のDFTを行い、脈波信号の周波数の解析結果をピーク検出部108aに供給する。
ピーク検出部108aは、脈波信号の周波数解析結果に基づいて、脈波信号のピーク周波数を検出する。このとき、ピーク検出部108aは、記憶部113に記憶されている前回の脈波周波数の検出値に基づいて、ピーク周波数を検出する周波数帯域を制限する。ピーク検出部108aは、脈波信号のピーク周波数の検出値を選択部111に供給する。
DFT部107bは、帯域信号WのDFTを行い、帯域信号Wの周波数の解析結果をピーク検出部108bに供給する。
ピーク検出部108bは、帯域信号Wの周波数解析結果に基づいて、帯域信号Wのピーク周波数を検出する。このとき、ピーク検出部108bは、記憶部113に記憶されている前回の脈波周波数の検出値に基づいて、ピーク周波数を検出する周波数帯域を制限する。ピーク検出部108bは、帯域信号Wのピーク周波数の検出値を選択部111に供給する。
DFT部109は、帯域信号NのDFTを行い、帯域信号Nの周波数の解析結果を判定部110に供給する。
判定部110は、帯域信号Nの周波数解析結果に基づいて、脈拍の計測の障害となる体動(以下、障害体動と称する)の有無を判定する。判定部110は、障害体動の有無の判定結果を選択部111に供給する。
選択部111は、障害体動の有無の判定結果、及び、前回の脈波周波数の計測値に基づいて、脈波信号のピーク周波数及び帯域信号Wのピーク周波数の中から脈波周波数を選択する。選択部111は、選択した脈波周波数を示す情報を計算部112に供給するとともに、記憶部113に記憶させる。
計算部112は、脈波周波数に基づいて、脈拍数を計算する。計算部112は、計算した脈拍数を計測結果として外部に出力する。
記憶部113は、過去の脈波周波数の計測値を記憶する。
{計測光の波長}
図7は、血液に含まれるHb(還元ヘモグロビン)とHbO2(酸化ヘモグロビン)の各波長帯の光に対する吸収特性を示している。横軸は波長を示し、縦軸は吸収係数を示している。曲線151は、Hbの吸収特性を示し、曲線152は、HbO2の吸収特性を示している。
図7は、血液に含まれるHb(還元ヘモグロビン)とHbO2(酸化ヘモグロビン)の各波長帯の光に対する吸収特性を示している。横軸は波長を示し、縦軸は吸収係数を示している。曲線151は、Hbの吸収特性を示し、曲線152は、HbO2の吸収特性を示している。
例えば、可視光帯域においてHbとHbO2の吸収係数の差が大きい波長が470nmの光(以下、青色計測光と称する)や、波長が660nmの光(以下、赤色計測光と称する)が、計測光に用いられる。また、例えば、可視光帯域においてHbとHbO2の吸収係数がほぼ等しい波長が530nmの光(以下、緑色計測光と称する)や、波長が585nmの光(以下、黄色計測光と称する)が計測光に用いられる。また、例えば、赤外光帯域においてHbとHbO2の吸収係数がほぼ等しい波長が805nmの光や、HbとHbO2の吸収係数の差が大きい波長が880nmの光が、計測光に用いられる。
{脈拍計測処理の第1の実施の形態}
次に、図8のフローチャートを参照して、計測装置1により実行される脈拍計測処理の第1の実施の形態について説明する。
次に、図8のフローチャートを参照して、計測装置1により実行される脈拍計測処理の第1の実施の形態について説明する。
なお、脈拍の計測は、所定の間隔(例えば、8~15秒毎)で行われる。以下、脈拍の計測が8秒間隔で行われる場合を例に挙げて説明する。
ステップS1において、計測装置1は、計測信号の取得を開始する。すなわち、図5を参照して上述したように、LED22による発光、及び、受光IC23による受光が開始される。また、受光した光の強度を示す計測信号の受光IC23から演算処理部26への計測信号の供給が開始される。
ステップS2において、デシメーションフィルタ101は、脈波信号の解析に必要な帯域に計測信号のダウンサンプリングを行う。例えば、デシメーションフィルタ101は、計測信号に対してデシメーション処理を行い、計測信号のサンプル数を所定の比率でダウンサンプリングする。デシメーションフィルタ101は、ダウンサンプリングした計測信号をBPF102及びBPF105に供給する。
現在の例では、計測信号のサンプリング周波数が200Hz、かつ、1回の計測期間が8秒なので、1回の計測期間における計測信号のサンプル数は1600サンプルとなる。例えば、ダウンサンプリングの比率を1/16とした場合、1回の計測期間における計測信号のサンプル数は、1600サンプルから100サンプルに減少する。
この場合、ダウンサンプリング後の計測信号のサンプリング周波数は、12.5Hz(=200Hz×1/16)となる。従って、ダウンサンプリング後の計測信号を用いて、図9の範囲R1で示されるように、6.25Hzの周波数成分まで検出可能となる。
一方、人間の脈拍数の最大値は220bpm程度であり、計測装置1で計測可能な脈拍数の最大値は、240bpmもあれば十分であると考えられる。脈拍数240bpmを脈波周波数に換算すると、4.0Hzとなる。従って、ダウンサンプリング後の計測信号により6.25Hzの周波数成分まで検出可能であれば、人間の脈波周波数を十分に計測することができる。
また、計測信号のダウンサンプリングを行うことにより、以降の演算量を削減することができる。
なお、以下、ダウンサンプリングの比率を1/16に設定した場合について説明する。
ステップS3において、脈波信号抽出部132は、計測信号の周波数帯域を制限する。具体的には、BPF102は、ダウンサンプリング後の計測信号の周波数帯域Nの成分を抽出する。BPF102は、抽出した周波数帯域Nの成分を含む帯域信号Nを、自己共分散関数推定部103及び線形予測フィルタ104に供給する。
BPF105は、ダウンサンプリング後の計測信号の周波数帯域Wの成分を抽出する。BPF105は、抽出した帯域信号Wの成分を含む帯域信号Wを、演算部106及びDFT部107bに供給する。
ここで、周波数帯域N及び周波数帯域Wは、脈波周波数及び体動周波数の想定範囲に応じて設定される。すなわち、周波数帯域N及び周波数帯域Wは、計測対象とする脈波周波数の範囲、及び、抽出対象とする体動成分の周波数の範囲に応じて設定される。
例えば、周波数帯域Wは、計測対象とする脈波周波数の範囲を少なくとも含むように設定される。一方、周波数帯域Nは、例えば、周波数帯域Wに含まれると想定される体動成分の周波数の範囲を少なくとも含むように設定される。
例えば、計測装置1の脈拍数の計測可能範囲を30bpm~240bpmとした場合、この範囲を脈波周波数に換算すると、0.5Hz~4.0Hzとなる。この場合、周波数帯域Wの最小値は0.5Hz以下に設定され、最大値は4.0Hz以上に設定される。
一方、図1を参照して上述したように、体動成分の基本周波数は、脈波周波数よりやや低くなる傾向にある。この場合、検出すべき体動成分の基本周波数の範囲を、0.5Hz~2.5Hzと想定すると、周波数帯域Nの最小値は0.5Hz以下に設定され、最大値は2.5Hz以上に設定される。
なお、以下、周波数帯域Wを0.5Hz~4.0Hzに設定し、周波数帯域Nを0.5Hz~2.5Hzに設定する場合について説明する。すなわち、この場合、周波数帯域Wは、周波数帯域Nより広い帯域に設定される。より具体的には、周波数帯域Wの最大値は、周波数帯域Nの最大値より大きい値に設定され、周波数帯域Wの最小値は、周波数帯域Nの最小値と同じ値に設定される。
ステップS4において、体動信号抽出部131は、体動信号を抽出する。例えば、自己共分散関数推定部103は、帯域信号Nの1回の計測期間内の100個のサンプルの先頭の所定数(例えば、8個)のサンプルに基づいて、帯域信号Nに含まれる体動信号の自己共分散関数を推定する。自己共分散関数推定部103は、自己共分散関数の推定結果を線形予測フィルタ104に供給する。
線形予測フィルタ104は、推定された自己共分散関数を用いて、帯域信号Nの1回の計測期間内の100個のサンプルの先頭の所定数(例えば、8個)のサンプルに基づいて、体動信号のARモデルのパラメータをユール-ウォーカー法により求める。これにより、体動信号のARモデルが生成される。線形予測フィルタ104は、生成したARモデルを用いて体動信号を予測する。線形予測フィルタ104は、体動信号の予測結果に基づいて、帯域信号Nの1回の計測期間における残りの所定数(例えば、92個)のサンプルから、脈波成分及びノイズ成分を除去し、体動信号を抽出する。
ここで、体動信号のARモデルの次数について説明する。帯域信号Nからノイズ成分のみを精度よく除去しようとした場合、ARモデルの次数は、例えば、20次~30次程度に設定することが望ましい。しかし、この場合、帯域信号Nから、体動成分だけでなく、脈波成分も抽出されてしまう。
これに対して、ARモデルの次数を低く抑えると、線形予測フィルタ104のノイズ成分を除去する精度は低下する。しかし、一方で、帯域信号Nに体動成分が多く含まれる場合、ノイズ成分だけでなく、体動成分と比べて非常に弱い脈波成分も除去することができる。その結果、少ない演算量で、帯域信号Nから体動成分のみを抽出することができるという効果が生じる。
そこで、ARモデルの次数は、例えば、8次に設定される。この8次という次数は、帯域信号Nから体動成分を高精度に抽出可能な次数として、実験により求められた値である。しかし、ARモデルの次数は、必ずしも8次に限定されるものではない。例えば、ARモデルの次数を5次~12次の範囲内に設定しても、帯域信号Nから体動成分を高精度に抽出することが可能である。
線形予測フィルタ104は、抽出した体動信号を、演算部106及びDFT部109に供給する。
なお、帯域信号Nに体動成分が含まれない場合、又は、帯域信号Nに含まれる体動成分が小さい場合、線形予測フィルタ104により帯域信号Nから脈波成分も抽出され、体動信号に脈波成分が含まれるようになる。
ステップS5において、演算部106は、脈波信号を抽出する。具体的には、演算部106は、帯域信号Wと体動信号の逆信号とを加算することにより、帯域信号Wと体動信号の差分をとり、差分信号である脈波信号を生成する。演算部106は、脈波信号をDFT部107aに供給する。
図10のいちばん上のグラフは、帯域信号Wの周波数分布の計測結果(実線)と、ARモデルを用いた体動信号の周波数分布の予測結果(点線)の例を示している。グラフの横軸は周波数を示し、縦軸はスペクトル強度を示す。
図10の上から2番目のグラフは、帯域信号Wの波形の計測結果(実線)と、ARモデルを用いた体動信号の波形の予測結果(点線)の例を示している。グラフの横軸は時間を示し、縦軸は振幅を示している。
図10の上から3番目のグラフは、上から2番目のグラフの帯域信号W(実線)と体動信号(点線)の差分信号である脈波信号の例を示している。グラフの横軸は時間を示し、縦軸は振幅を示している。
図10の上から4番目のグラフは、上から2番目のグラフの帯域信号W(実線)の周波数分布の例を示している。グラフの横軸は周波数を示し、縦軸はスペクトル強度を示している。
図10のいちばん下のグラフは、上から3番目のグラフの脈波信号の周波数分布の例を示している。グラフの横軸は周波数を示し、縦軸はスペクトル強度を示している。
この例に示されるように、帯域信号Wと体動信号の差分をとることにより、帯域信号Wから体動成分が除去され、脈波成分を含む脈波信号が抽出される。すなわち、効率的に体動成分をキャンセルすることができる。
なお、上述したように、帯域信号Nに体動成分が含まれない場合、又は、帯域信号Nに含まれる体動成分が小さい場合、体動信号に脈波成分が含まれる。そのため、帯域信号Wと体動信号の差分信号である脈波信号に、脈波成分がほとんど含まれなくなる。
ステップS6において、周波数検出部134は、脈波信号のピーク周波数を検出する。具体的には、DFT部107aは、1回の計測期間内の100サンプルの脈波信号の各サンプル間に所定数の値0のサンプルをパディングして、1024サンプルの信号にアップサンプリングする。そして、DFT部107aは、パディング後の脈波信号のDFTを行い、脈波信号の周波数の解析結果をピーク検出部108aに供給する。
なお、値0のサンプルをパディングし、脈波信号のサンプル数を1024や2048サンプルにして、サンプリング周波数を上げることにより、脈波信号の周波数解析の分解能を上げることができる。また、値0のサンプルをパディングすることにより、スパース行列を用いてDFTを行うことができ、演算処理を高速化することができる。
ピーク検出部108aは、脈波信号の周波数解析結果に基づいて、脈波信号のピーク周波数を検出する。このとき、ピーク検出部108aは、前回の脈波周波数の計測値を記憶部113から読み出す。そして、ピーク検出部108aは、前回の脈波周波数の計測値に基づいて、ピーク周波数を検出する周波数帯域を制限する。
例えば、ピーク検出部108aは、前回の脈波周波数の計測値が2Hzである場合、図9に示されるように、ピーク周波数を検出する周波数帯域を、2Hzを中心とする所定の帯域幅の検出範囲R2に制限する。なお、検出範囲R2は、周波数帯域Wの帯域幅R3より狭い範囲に設定される。
ピーク検出部108aは、設定した検出範囲内において、脈波信号のピーク周波数を検出する。ピーク検出部108aは、ピーク周波数の検出値を選択部111に供給する。
このように、前回の脈波周波数の計測値に基づいて検出範囲を制限してピーク周波数を検出することにより、演算量が削減されるとともに、脈波周波数と異なるピーク周波数が検出される可能性が低減される。
ステップS7において、周波数検出部134は、計測信号のピーク周波数を検出する。具体的には、DFT部107bは、ステップS6のDFT部107aと同様の処理により、帯域信号Wに値0のサンプルをパディングした上で、帯域信号WのDFTを行う。また、ピーク検出部108bは、ステップS6のピーク検出部108aと同様の処理により、前回の脈波周波数の計測値に基づいて検出範囲を制限した上で、帯域信号Wのピーク周波数を検出する。これにより、計測信号の検出範囲におけるピーク周波数が検出される。ピーク検出部108bは、ピーク周波数の検出値を選択部111に供給する。
ステップS8において、体動検出部133は、体動の検出を行う。具体的には、DFT部109は、体動信号のDFTを行い、体動信号の周波数の解析結果を判定部110に供給する。
判定部110は、体動信号の周波数分布に基づいて、障害体動の有無を判定する。例えば、判定部110は、体動信号の周波数の範囲が所定の広さ以上である場合、障害体動があったと判定する。一方、判定部110は、体動信号の周波数の範囲が所定の広さ未満である場合、障害体動がなかったと判定する。
ここで、体動信号の周波数の範囲は、例えば、体動信号のスペクトル強度が所定の閾値以上の周波数のうち、最小の周波数と最大の周波数の差により求められる。
或いは、例えば、判定部110は、体動信号の周波数分布の波形に基づいて、障害体動の有無を判定する。例えば、判定部110は、事前の機械学習により得られた識別器を用いて、体動信号の周波数分布の波形が、障害体動成分(脈拍の計測の障害となる体動成分)を含む波形か否かを識別する。判定部110は、識別の結果、障害体動成分が体動信号に含まれると判定した場合、障害体動があったと判定する。一方、判定部110は、識別の結果、障害体動成分が体動信号に含まれないと判定した場合、障害体動がなかったと判定する。
そして、判定部110は、障害体動の有無の判定結果を選択部111に供給する。
なお、被験者の体動が障害体動であるか否かの判定基準は、例えば、事前の学習や実験等により設定される。この判定基準を適切に設定することにより、脈拍の計測の障害とならない弱い体動が無視されるようになる。
ステップS9において、選択部111は、体動の検出結果及び前回の脈波周波数の計測値に基づいて、検出されたピーク周波数の中から脈波周波数を選択する。例えば、選択部111は、前回の脈波周波数の計測値を記憶部113から読み出す。選択部111は、前回の脈波周波数の計測値に基づいて、前回の計測時から今回の計測時までの間に脈波周波数が変化可能であると想定される最大の範囲を選択基準範囲に設定する。
そして、選択部111は、脈波信号のピーク周波数及び帯域信号Wのピーク周波数のうちいずれか一方のみが選択基準範囲内に含まれる場合、選択基準範囲内に含まれる方のピーク周波数を脈波周波数に選択する。
一方、選択部111は、両方のピーク周波数がともに選択基準範囲内に含まれる場合、或いは、両方のピーク周波数がともに選択基準範囲内に含まれない場合、障害体動の有無の判定結果に基づいて脈波周波数を選択する。
具体的には、上述したように、障害体動があり、計測信号に体動成分が多く含まれる場合、体動信号に脈波成分がほとんど残らない。従って、帯域信号Wと体動信号の差分信号である脈波信号に脈波成分が含まれる一方、体動成分はほとんど含まれない。その結果、脈波信号のピーク周波数が、被験者の脈波周波数とほぼ等しくなることが想定される。そこで、選択部111は、障害体動があったと判定された場合、脈波信号のピーク周波数を脈波周波数に選択する。すなわち、脈波信号のピーク周波数が、今回の脈波周波数の計測値となる。
一方、上述したように、障害体動がなく、計測信号に体動成分があまり含まれない場合、体動信号に脈波成分がほとんど除去されずに残る。従って、帯域信号Wと体動信号の差分信号である脈波信号に脈波成分がほとんど含まれない。一方、帯域信号Wには、体動成分はほとんど含まれない。従って、帯域信号Wのピーク周波数が、被験者の脈波周波数とほぼ等しくなることが想定される。そこで、選択部111は、障害体動がなかったと判定された場合、帯域信号Wのピーク周波数を脈波周波数に選択する。すなわち、帯域信号Wのピーク周波数が、今回の脈波周波数の計測値となる。
選択部111は、選択した脈波周波数を示す情報を計算部112に供給する。また、選択部111は、選択した脈波周波数を示す情報を記憶部113に記憶させる。これにより、今回の脈拍周波数の計測値が記憶部113に記憶される。
ステップS10において、計算部112は、脈拍数を計算する。例えば、計算部112は、選択部111により選択された脈波周波数を60倍することにより脈拍数を求める。
ステップS11において、計算部112は、計測結果を出力する。すなわち、計算部112は、ステップS10の処理で求めた脈拍数を計測結果として外部に出力する。
その後、処理はステップS2に戻り、ステップS2以降の処理が繰り返し実行される。
このようにして、少ない演算量で、体動の影響を除去して、正確に被験者の脈波及び脈拍を計測することができる。例えば、被験者がランニング等の激しい運動を行っても、正確に被験者の脈波及び脈拍を計測することができる。また、例えば、被験者が計測装置1を長時間装着して計測を行う場合にも、被験者の体動の影響を除去して、正確に脈波及び脈拍を計測し続けることができる。
また、演算量を削減することにより、計測装置1の消費電力を下げることができる。その結果、例えば、充電や電池の交換を行わずに、計測装置1を被験者に長時間装着して、計測を行うことが可能になる。
なお、以上の説明では、ダウンサンプリングの比率を1/16に設定した場合について説明したが、ダウンサンプリング後の計測信号のサンプリング周波数が8.0Hz以上であれば、脈拍数240bpmに対する脈波周波数を計測することが可能である。従って、計測信号のサンプリング周波数が200Hzの場合、ダウンサンプリングの比率を1/25まで下げることが可能である。
例えば、図11は、ダウンサンプリングの比率を1/24に設定した場合の例を示している。この場合、ダウンサンプリング後の計測信号を用いて、図11の範囲R1’で示されるように、4.17Hz(=200Hz×1/24÷2)の周波数成分まで検出可能となる。
<3.第2の実施の形態>
次に、図12乃至図16を参照して、本技術の第2の実施の形態について説明する。第2の実施の形態は、第1の実施の形態と比較して、体動の検出方法、及び、脈波周波数の計測方法が異なる。また、第2の実施の形態では、計測光1及び計測光2の2種類の波長の計測光が用いられる。
次に、図12乃至図16を参照して、本技術の第2の実施の形態について説明する。第2の実施の形態は、第1の実施の形態と比較して、体動の検出方法、及び、脈波周波数の計測方法が異なる。また、第2の実施の形態では、計測光1及び計測光2の2種類の波長の計測光が用いられる。
計測光1には、例えば、波長が470nmの波長の青色計測光、又は、波長が530nmの緑色計測光が用いられる。なお、以下、青色計測光を用いる場合を例に挙げて説明する。そして、計測信号1は、計測光1を用いて計測される。
計測光2には、例えば、波長が585nmの黄色計測光を用いられる。そして、計測信号2は、計測光2を用いて計測される。
また、計測信号1及び計測信号2のサンプリング周波数は、例えば、200~220Hzとされる。以下、計測信号1及び計測信号2のサンプリング周波数が200Hzの場合を例に挙げて説明する。
{演算処理部26bの構成例}
第2の実施の形態では、図6の演算処理部26aの代わりに、図12の演算処理部26bが計測装置1に用いられる。演算処理部26bは、デシメーションフィルタ301a,301b、BPF(バンドパスフィルタ)302a,302b、自己共分散関数推定部303、線形予測フィルタ304、BPF(バンドパスフィルタ)305、演算部306、合成ベクトル計算部307、判定部308、選択部309、DFT(離散フーリエ変換)部310、帯域制限部311、ピーク検出部312、計算部313、及び、記憶部314を含むように構成される。
第2の実施の形態では、図6の演算処理部26aの代わりに、図12の演算処理部26bが計測装置1に用いられる。演算処理部26bは、デシメーションフィルタ301a,301b、BPF(バンドパスフィルタ)302a,302b、自己共分散関数推定部303、線形予測フィルタ304、BPF(バンドパスフィルタ)305、演算部306、合成ベクトル計算部307、判定部308、選択部309、DFT(離散フーリエ変換)部310、帯域制限部311、ピーク検出部312、計算部313、及び、記憶部314を含むように構成される。
また、自己共分散関数推定部303及び線形予測フィルタ304により、体動信号抽出部331が構成される。BPF302a、BPF305、演算部306、及び、体動信号抽出部331により、脈波信号抽出部332が構成される。合成ベクトル計算部307及び判定部308により、体動検出部333が構成される。DFT部310、帯域制限部311、及び、ピーク検出部312により、周波数検出部334が構成される。選択部309、計算部313、記憶部314、及び、周波数検出部334により、計測部335が構成される。
なお、デシメーションフィルタ301a,301bは、図6のデシメーションフィルタ101と同様の機能を有している。BPF302a,302bは、図6のBPF102と同様の機能を有している。自己共分散関数推定部303は、図6の自己共分散関数推定部103と同様の機能を有している。線形予測フィルタ304は、図6の線形予測フィルタ104と同様の機能を有している。BPF305は、図6のBPF105と同様の機能を有している。演算部306は、図6の演算部106と同様の機能を有している。DFT部310は、図6のDFT部107a及び107bと同様の機能を有している。帯域制限部311及びピーク検出部312により、図6のピーク検出部108a及び108bと同様の機能が実現される。計算部313は、図6の計算部112と同様の機能を有している。
デシメーションフィルタ301aは、計測信号1のダウンサンプリングを行う。デシメーションフィルタ301aは、ダウンサンプリング後の計測信号1をBPF302a及びBPF305に供給する。
デシメーションフィルタ301bは、計測信号2のダウンサンプリングを行う。デシメーションフィルタ301bは、ダウンサンプリング後の計測信号2をBPF302bに供給する。
BPF302aは、計測信号1の周波数帯域Nの成分を抽出し、抽出した周波数帯域Nの成分を含む計測信号(以下、帯域信号1Nと称する)を、自己共分散関数推定部303、線形予測フィルタ304、及び、合成ベクトル計算部307に供給する。
BPF302bは、計測信号2の所定の周波数帯域Nの成分を抽出し、抽出した周波数帯域Nの成分を含む計測信号(以下、帯域信号2Nと称する)を、合成ベクトル計算部307に供給する。
自己共分散関数推定部303は、図6の自己共分散関数推定部103と同様に、帯域信号1Nに含まれる体動信号の自己共分散関数を推定し、推定結果を線形予測フィルタ304に供給する。
線形予測フィルタ304は、図6の線形予測フィルタ104と同様に、推定された自己共分散関数を用いて、体動信号のARモデルを生成し、体動信号の予測結果に基づいて、帯域信号1Nから体動信号を抽出する。線形予測フィルタ304は、抽出した体動信号を演算部306に供給する。
BPF305は、計測信号1の周波数帯域Wの成分を抽出し、抽出した周波数帯域Wの成分を含む信号(以下、帯域信号1Wと称する)を、演算部306及び選択部309に供給する。
演算部306は、帯域信号W1と体動信号の逆信号とを加算することにより、帯域信号W1と体動信号の差分をとる。演算部306は、帯域信号W1と体動信号との差分信号である脈波信号を選択部309に供給する。
合成ベクトル計算部307は、帯域信号1Nと帯域信号2Nの合成ベクトルを計算する。合成ベクトル計算部307は、合成ベクトルの計算結果を判定部308に供給する。
判定部308は、合成ベクトルの計算結果に基づいて、障害体動の有無を判定する。判定部308は、障害体動の有無の判定結果を選択部309に供給する。
選択部309は、障害体動の有無の判定結果に基づいて、脈波信号及び帯域信号1Wの中から脈拍の計測に用いる信号(以下、脈拍計測信号と称する)を選択する。選択部309は、選択した脈拍計測信号をDFT部310に供給する。
DFT部310は、図6のDFT部107a及び107bと同様に、脈拍計測信号のDFTを行い、脈拍計測信号の周波数の解析結果を帯域制限部311に供給する。
帯域制限部311は、記憶部314に記憶されている前回の脈波周波数の検出値に基づいて、ピーク周波数を検出する周波数帯域を制限する。帯域制限部311は、脈拍計測信号の周波数の解析結果、及び、ピーク周波数を検出する周波数帯域を示す情報をピーク検出部312に供給する。
ピーク検出部312は、図6のピーク検出部108a及び108bと同様に、脈拍計測信号のピーク周波数を検出する。このピーク周波数が、脈波周波数の計測値となる。ピーク検出部312は、脈波周波数の計測値を計算部313に供給するとともに、記憶部314に記憶させる。
計算部313は、脈波周波数に基づいて、脈拍数を計算する。計算部313は、計算した脈拍数を計測結果として外部に出力する。
記憶部314は、過去の脈波周波数の計測値を記憶する。
{脈拍計測処理の第2の実施の形態}
次に、図13のフローチャートを参照して、計測装置1により実行される脈拍計測処理の第2の実施の形態について説明する。
次に、図13のフローチャートを参照して、計測装置1により実行される脈拍計測処理の第2の実施の形態について説明する。
ステップS101において、図8のステップS1の処理と同様に、計測信号の取得が開始される。
ステップS102において、デシメーションフィルタ301a及び301bは、計測信号のダウンサンプリングを行う。具体的には、デシメーションフィルタ301aは、所定の比率で計測信号1をダウンサンプリングし、ダウンサンプリング後の計測信号1をBPF302a及びBPF305に供給する。デシメーションフィルタ301bは、所定の比率で計測信号2をダウンサンプリングし、ダウンサンプリング後の計測信号2をBPF302bに供給する。
ステップS103において、BPF302a,302b及びBPF305は、計測信号の周波数帯域を制限する。具体的には、BPF302aは、ダウンサンプリング後の計測信号1の周波数帯域Nの成分を抽出する。BPF302aは、抽出した周波数帯域Nの成分を含む帯域信号1Nを、自己共分散関数推定部303、線形予測フィルタ304、及び、合成ベクトル計算部307に供給する。
BPF302bは、ダウンサンプリング後の計測信号2の周波数帯域Nの成分を抽出する。BPF302bは、抽出した周波数帯域Nの成分を含む帯域信号2Nを、合成ベクトル計算部307に供給する。
BPF305は、ダウンサンプリング後の計測信号1の周波数帯域Wの成分を抽出する。BPF305は、抽出した周波数帯域Wの成分を含む帯域信号1Wを、演算部306及び選択部309に供給する。
ステップS104において、図8のステップS4と同様の処理により、帯域信号1Nから体動信号が抽出される。抽出された体動信号は、演算部306に供給される。
ステップS105において、図8のステップS5と同様の処理により、帯域信号1Wと体動信号の差分がとられ、脈波信号が抽出される。抽出された脈波信号は、選択部309に供給される。
ステップS106において、体動検出部333は、体動の検出を行う。まず、合成ベクトル計算部307は、帯域信号1Nと帯域信号2Nの合成ベクトルを計算する。合成ベクトルは、同じサンプリング時刻の帯域信号1Nのサンプル値(振幅値)と帯域信号2Nのサンプル値(振幅値)を成分とするベクトルである。合成ベクトル計算部307は、合成ベクトルの計算結果を判定部308に供給する。
判定部308は、合成ベクトルに基づいて、障害体動の有無を判定する。ここで、図14乃至図16を参照して、障害体動の有無の判定方法について説明する。
図14及び図15は、計測信号の信号レベルの時系列の変化の例を示すグラフである。各グラフの横軸は時間を示し、縦軸は計測信号の値を示している。
図14は、被験者が、40秒付近から80秒付近までの期間において計測装置1を装着した腕の指のみを動かし、その他の期間において静止している場合の計測信号の信号レベルの時系列の変化を示している。いちばん上のグラフは、波長が470nmの青色計測光を用いた場合の例を示している。上から2番目のグラフは、波長が585nmの黄色計測光を用いた場合の例を示している。3番目のグラフは、波長が530nmの緑色計測光を用いた場合の例を示している。
被験者が指を動かす前は、全ての波長の計測光に対する計測信号が、あまり変化せず安定している。
その後、被験者が指を動かすと、黄色計測光に対する計測信号の振動幅が非常に大きくなっている。しかし、他の色の計測光に対する計測信号は、少し値が上昇するものの、振動幅はあまり変化していない。
被験者が指の動きを止めた後も、黄色計測光に対する計測信号の振動幅は小さくなるものの、しばらくの間、黄色計測光に対する計測信号の振動幅が他の色の計測光に対する計測信号の振動幅より大きい状態が継続している。また、しばらくの間、全ての波長の計測光に対する計測信号の値が、静止時より大きい状態が継続している。
その後、全ての波長の計測光に対する計測信号が、指を動かす前の安定した状態に戻っている。
図15は、被験者が、78秒付近から118秒付近までの期間において、計測装置1を装着した腕全体を動かし、その他の期間において静止している場合の計測信号の信号レベルの時系列の変化を示している。いちばん上のグラフは、波長が660nmの赤色計測光を用いた場合の例を示している。上から2番目のグラフは、波長が470nmの青色計測光を用いた場合の例を示している。上から3番目のグラフは、波長が585nmの黄色計測光を用いた場合の例を示している。
図14の例と同様に、被験者が腕を動かす前は、全ての波長の計測光に対する計測信号が、あまり変化せず安定している。
その後、被験者が腕を動かすと、全ての波長の計測光に対する計測信号の値が上昇し、振動幅が大きくなっている。
被験者が腕の動きを止めた後も、振動幅は小さくなるものの、全ての波長の計測光に対する計測信号の値が高い状態が継続している。
図16は、1回の計測期間内における合成ベクトルの分布の例を示している。左側のグラフは、被験者が静止している場合の合成ベクトルの分布の例を示し、右側のグラフは、被験者が動いている場合の合成ベクトルの分布の例を示している。左右のグラフの横軸は、青色計測光に対する計測信号(帯域信号1N)のサンプル値を示し、縦軸は、黄色計測光に対する計測信号(帯域信号2N)のサンプル値を示している。
図14及び図15を参照して上述したように、体動の発生前は、全ての波長の計測光に対する計測信号が、あまり変化せず安定する。従って、図16の左側のグラフに示されるように、障害体動がない場合の合成ベクトルの分布は、点線で囲まれた所定の範囲である正常ゾーン351内に収まることが想定される。
一方、体動が発生すると、計測信号の値が上昇するとともに、振動幅が大きくなる。ただし、計測信号の変化は、体動の種類や大きさ以外に、計測光の波長によっても異なる。すなわち、図14の例に示されるように、体動の種類によっては、特定の波長の計測光に対する計測信号のみ大きく反応する場合が存在する。
従って、図16の右側のグラフに示されるように、障害体動がある場合の合成ベクトルの分布は、静止時の合成ベクトルの分布より、バラつきが大きくなり、正常ゾーン351からはみ出る。また、計測光の波長により計測信号の変化が異なる場合があるため、合成ベクトルが、原点を通る右上がりの直線上から大きく外れる場合がある。
そこで、例えば、判定部308は、合成ベクトルの分布が正常ゾーン351内に収まる場合、障害体動がないと判定する。一方、判定部308は、合成ベクトルの分布が正常ゾーン351内に収まらない場合、障害体動があると判定する。判定部308は、判定結果を選択部309に供給する。
ステップS107において、選択部309は、体動の検出結果に基づいて、脈拍の計測に用いる信号(脈拍計測信号)を選択する。具体的には、選択部309は、障害体動があると判定された場合、演算部306からの脈波信号を脈拍計測信号に選択して、DFT部310に供給する。一方、選択部309は、障害体動がないと判定された場合、BPF305からの帯域信号1Wを脈拍計測信号に選択して、DFT部310に供給する。
ステップS108において、周波数検出部334は、脈波周波数を検出する。具体的には、DFT部310は、図8のステップS6と同様の処理により、脈拍計測信号の周波数解析を行い、解析結果を帯域制限部311に供給する。
帯域制限部311は、図8のステップS6と同様の処理により、記憶部314に記憶されている前回の脈波周波数の検出値に基づいて、ピーク周波数を検出する周波数帯域を制限する。帯域制限部311は、脈拍計測信号の周波数の解析結果、及び、ピーク周波数を検出する周波数帯域を示す情報をピーク検出部312に供給する。
ピーク検出部312は、図8のステップS6と同様の処理により、脈拍計測信号のピーク周波数を検出する。このピーク周波数が、脈波周波数の計測値となる。
従って、障害体動があると判定された場合、脈波信号のピーク周波数が、今回の脈波周波数の計測値となる。一方、障害体動がないと判定された場合、帯域信号1Wのピーク周波数が、今回の脈波周波数の計測値となる。
ピーク検出部312は、脈波周波数を示す情報を計算部112に供給するとともに、記憶部113に記憶させる。
ステップS109において、図8のステップS10の処理と同様に、脈拍数が計算される。
ステップS110において、図8のステップS11の処理と同様に、計測結果が出力される。
その後、処理はステップS102に戻り、ステップS102以降の処理が繰り返し実行される。
このようにして、第1の実施の形態と同様に、少ない演算量で、体動の影響を除去して、正確に被験者の脈波及び脈拍を計測することができる。
<4.第3の実施の形態>
次に、図17乃至図19を参照して、本技術の第3の実施の形態について説明する。第2の実施の形態は、第1の実施の形態及び第2の実施の形態と比較して、体動信号の抽出方法、及び、体動の検出方法が異なる。また、第3の実施の形態では、例えば、第1の実施の形態と同様に1種類の波長の計測光が用いられる。
次に、図17乃至図19を参照して、本技術の第3の実施の形態について説明する。第2の実施の形態は、第1の実施の形態及び第2の実施の形態と比較して、体動信号の抽出方法、及び、体動の検出方法が異なる。また、第3の実施の形態では、例えば、第1の実施の形態と同様に1種類の波長の計測光が用いられる。
{演算処理部26cの構成例}
第3の実施の形態では、図6の演算処理部26a及び図12の演算処理部26bの代わりに、図17の演算処理部26cが計測装置1に用いられる。演算処理部26cは、デシメーションフィルタ501、BPF(バンドパスフィルタ)502、可変ノッチフィルタ503、自己共分散関数推定部504、線形予測フィルタ505、演算部506、体動検出部507、選択部508、DFT(離散フーリエ変換)部509、帯域制限部510、ピーク検出部511、計算部512、及び、記憶部513を含むように構成される。
第3の実施の形態では、図6の演算処理部26a及び図12の演算処理部26bの代わりに、図17の演算処理部26cが計測装置1に用いられる。演算処理部26cは、デシメーションフィルタ501、BPF(バンドパスフィルタ)502、可変ノッチフィルタ503、自己共分散関数推定部504、線形予測フィルタ505、演算部506、体動検出部507、選択部508、DFT(離散フーリエ変換)部509、帯域制限部510、ピーク検出部511、計算部512、及び、記憶部513を含むように構成される。
また、可変ノッチフィルタ503、自己共分散関数推定部504、及び、線形予測フィルタ505により、体動信号抽出部531が構成される。BPF502、演算部506、及び、体動信号抽出部531により、脈波信号抽出部532が構成される。DFT部509、帯域制限部510、及び、ピーク検出部511により、周波数検出部533が構成される。選択部508、計算部512、記憶部513、及び、周波数検出部533により、計測部534が構成される。
なお、デシメーションフィルタ501は、図6のデシメーションフィルタ101と同様の機能を有している。BPF502は、図6のBPF105と同様の機能を有している。自己共分散関数推定部504は、図6の自己共分散関数推定部103と同様の機能を有している。線形予測フィルタ505は、図6の線形予測フィルタ104と同様の機能を有している。演算部506は、図6の演算部106と同様の機能を有している。選択部508は、図12の選択部309と同様の機能を有している。DFT部509は、図6のDFT部107a及び107bと同様の機能を有している。帯域制限部510は、図12の帯域制限部311と同様に機能を有している。ピーク検出部511は、図12のピーク検出部312と同様の機能を有している。計算部512は、図6の計算部112と同様の機能を有している。
デシメーションフィルタ501は、計測信号のダウンサンプリングを行う。デシメーションフィルタ501は、ダウンサンプリング後の計測信号をBPF502に供給する。
BPF502は、計測信号の周波数帯域Wの成分を抽出し、抽出した周波数帯域Wの成分を含む帯域信号Wを、可変ノッチフィルタ503、演算部506、及び、選択部508に供給する。
可変ノッチフィルタ503は、減衰帯域が可変のゼロ位相フィルタである。可変ノッチフィルタ503は、記憶部513に記憶されている前回の脈波周波数の計測値を含むように減衰帯域に設定し、帯域信号Wの周波数成分のうち減衰帯域の成分を減衰させる。可変ノッチフィルタ503は、減衰後の信号(以下、帯域信号W’と称する)を、自己共分散関数推定部504及び線形予測フィルタ505に供給する。
なお、可変ノッチフィルタ503はゼロ位相フィルタなので、減衰後の帯域信号W’において、体動成分等の時間軸情報がそのまま保持される。
自己共分散関数推定部504は、図6の自己共分散関数推定部103と同様に、帯域信号W’に含まれる体動信号の自己共分散関数を推定し、推定結果を線形予測フィルタ505に供給する。
線形予測フィルタ505は、図6の線形予測フィルタ104と同様に、推定された自己共分散関数を用いて、体動信号のARモデルを生成し、体動信号の予測結果に基づいて、帯域信号W’から体動信号を抽出する。線形予測フィルタ505は、抽出した体動信号を演算部506に供給する。
演算部506は、帯域信号Wと体動信号の逆信号とを加算することにより、帯域信号Wと体動信号の差分をとる。演算部506は、帯域信号Wと体動信号との差分信号である脈波信号を選択部508に供給する。
体動検出部507は、所定の方法により体動の検出を行い、障害体動の有無を判定する。体動検出部507は、障害体動の有無の判定結果を選択部508に供給する。
選択部508は、障害体動の有無の判定結果に基づいて、脈波信号及び帯域信号Wの中から脈拍計測信号を選択する。選択部508は、選択した脈拍計測信号をDFT部509に供給する。
DFT部509は、図6のDFT部107a及び107bと同様に、脈拍計測信号のDFTを行い、脈拍計測信号の周波数の解析結果を帯域制限部510に供給する。
帯域制限部510は、記憶部513に記憶されている前回の脈波周波数の検出値に基づいて、ピーク周波数を検出する周波数帯域を制限する。帯域制限部510は、脈拍計測信号の周波数の解析結果、及び、ピーク周波数を検出する周波数帯域を示す情報をピーク検出部511に供給する。
ピーク検出部511は、図6のピーク検出部108a及び108bと同様に、脈拍計測信号のピーク周波数を検出する。このピーク周波数が、脈波周波数の計測値となる。ピーク検出部511は、脈波周波数の計測値を計算部512に供給するとともに、記憶部513に記憶させる。
計算部512は、脈波周波数に基づいて、脈拍数を計算する。計算部512は、計算した脈拍数を計測結果として外部に出力する。
記憶部513は、過去の脈波周波数の計測値を記憶する。
{脈拍計測処理の第3の実施の形態}
次に、図18のフローチャートを参照して、計測装置1により実行される脈拍計測処理の第3の実施の形態について説明する。
次に、図18のフローチャートを参照して、計測装置1により実行される脈拍計測処理の第3の実施の形態について説明する。
ステップS301において、図8のステップS1の処理と同様に、計測信号の取得が開始される。
図19のいちばん上のグラフは、計測信号の波形の例を示している。グラフの横軸は時間を示し、縦軸は振幅値を示している。
ステップS302において、図8のステップS2の処理と同様に、計測信号のダウンサンプリングが行われる。そして、ダウンサンプリング後の計測信号が、BPF502に供給する。
ステップS303において、BPF502は、計測信号の周波数帯域を制限する。具体的には、BPF502は、ダウンサンプリング後の計測信号の周波数帯域Wの成分を抽出する。BPF502は、抽出した周波数帯域Wの成分を含む帯域信号Wを、可変ノッチフィルタ503、演算部506、及び、選択部508に供給する。
図19の上から2番目のグラフは、いちばん上のグラフに示される計測信号の周波数帯域を制限した後の帯域信号Wの周波数分布の例を示している。グラフの横軸は周波数を示し、縦軸はスペクトル強度を示している。この例では、1.6Hz付近に脈波のスペクトルが現れ、1.5Hz以下において体動成分のスペクトルが現れている。また、1.8Hz以上の周波数成分が、ほとんど存在していない。
ステップS304において、可変ノッチフィルタ503は、帯域制限後の計測信号(帯域信号W)の周波数成分のうち、前回の脈波周波数の計測値付近の周波数成分を減衰する。具体的には、可変ノッチフィルタ503は、前回の脈波周波数の計測値を記憶部513から読み出す。可変ノッチフィルタ503は、例えば、前回の脈波周波数の計測値を含む所定の帯域を減衰帯域に設定する。例えば、前回の脈波周波数の計測値を中心とする所定の帯域が、減衰帯域に設定される。
可変ノッチフィルタ503は、帯域信号Wの周波数成分のうち、設定した減衰帯域の成分を減衰させる。可変ノッチフィルタ503は、減衰後の帯域信号W’を自己共分散関数推定部504及び線形予測フィルタ505に供給する。
なお、脈波周波数は急激には変化しないため、可変ノッチフィルタ503により減衰された周波数成分に、ほとんどの脈波成分が含まれることが想定される。従って、帯域信号W’には、脈波成分がほとんど含まれなくなる。
ステップS305において、図8のステップS4と同様の処理により、帯域信号W’から体動信号が抽出される。抽出された体動信号は、演算部506に供給される。
上述したように、帯域信号W’は、脈波成分をほとんど含まない。従って、上述した実施の形態と異なり、計測信号に含まれる体動成分の量に関わらず、体動信号に脈波成分がほとんど含まれなくなる。
図19の上から3番目のグラフは、2番目のグラフに示される帯域信号Wから抽出された体動信号の周波数分布の例を示している。グラフの横軸は周波数を示し、縦軸はスペクトル強度を示している。このグラフに示されるように、帯域信号Wに含まれる脈波のスペクトルが、体動信号において消えている。
ステップS306において、図8のステップS5と同様の処理により、帯域信号Wと体動信号の差分がとられ、脈波信号が抽出される。抽出された脈波信号は、選択部508に供給される。
なお、上述したように、体動信号に脈波成分がほとんど含まれないため、脈波信号に確実に脈波成分が含まれるようになる。
図19の上から4番目のグラフは、上から2番目のグラフに示される帯域信号Wと3番目のグラフの体動信号の差分をとることにより得られる脈波信号の周波数成分の例を示している。グラフの横軸は周波数を示し、縦軸はスペクトル強度を示している。このグラフに示されるように、帯域信号Wから脈波成分が抽出され、その他の数は数の成分が減衰されている。従って、脈波成分が、体動成分と比べて非常に大きくなっている。
ステップS307において、体動検出部507は、体動の検出を行う。例えば、体動検出部507は、計測装置1が備える3軸の加速度センサ又はジャイロセンサ等のセンサ(不図示)からの検出信号に基づいて、体動の検出を行う。そして、体動検出部507は、体動の検出結果に基づいて、障害体動の有無を判定する。体動検出部507は、障害体動の有無の判定結果を選択部508に供給する。
ステップS308において、図13のステップS107の処理と同様に、体動の検出結果に基づいて、脈拍の計測に用いる信号(脈拍計測信号)が選択される。
ステップS309において、図13のステップS108の処理と同様に、脈波周波数が検出される。
図19の上から5番目のグラフは、上から4番目のグラフの脈波信号が脈拍計測信号に選択された場合に、ステップS309の処理で検出範囲が制限された後の脈波信号の周波数分布を示している。グラフの横軸は周波数を示し、縦軸はスペクトル分布を示している。
図19のいちばん下のグラフは、上から1番目のグラフの計測信号から、3番目のグラフの周波数分布を有する体動信号を引いた後の脈波信号の波形を示している。グラフの横軸は時間を示し、縦軸は振幅値を示している。
ステップS310において、図13のステップS109の処理と同様に、脈拍数が計算される。
ステップS311において、図13のステップS110の処理と同様に、計測結果が出力される。
その後、処理はステップS302に戻り、ステップS302以降の処理が繰り返し実行される。
このようにして、第1の実施の形態及び第2の実施の形態と同様に、少ない演算量で、体動の影響を除去して、正確に被験者の脈波及び脈拍を計測することができる。
また、第3の実施の形態では、第1の実施の形態及び第2の実施の形態と比較して、BPFを1つ削減することができる。さらに、第3の実施の形態においては、脈波成分を高精度に抽出した脈波信号を生成することができる。
<5.変形例>
以下、上述した本技術の実施の形態の変形例について説明する。
以下、上述した本技術の実施の形態の変形例について説明する。
{体動検出方法に関する変形例}
上述した体動検出方法は、その一例であり、他の方法を採用してもよい。
上述した体動検出方法は、その一例であり、他の方法を採用してもよい。
例えば、図14及び図15を参照して上述したように、体動が発生した場合、計測信号の信号レベルが大きく変化する。そこで、例えば、体動検出部は、計測信号の信号レベル(例えば、振幅値、振幅幅等)の変化に基づいて、体動の検出を行うようにしてもよい。例えば、体動検出部133又は体動検出部333が、計測信号の信号レベルの変化量が所定の閾値以上になった場合、障害体動があると判定するようにしてもよい。
また、図14及び図15を参照して上述したように、計測光の波長及び体動の種類により、計測信号の変化の傾向が大きく異なる。そこで、例えば、2種類以上の波長の計測光を用いる場合、体動検出部は、各計測光に対する複数の計測信号のうち少なくとも1つが所定の条件を満たせば、障害体動が発生したと判定するようにしてもよい。
さらに、図20は、周波数帯域を制限する前の計測信号と制限した後の計測信号のエンベロープを模式的に示している。この図に示されるように、帯域制限をすると、計測信号の変化の立ち上がり及び立ち下がりが鈍くなる。そのため、体動の検出の遅れや、体動の誤検出が発生するおそれがある。そこで、例えば、体動検出部は、直流成分を除去した後、周波数帯域の制限やダウンサンプリングを行う前の計測信号に基づいて、体動の検出を行うようにしてもよい。
また、複数の体動検出方法を組み合わせて、体動の検出を行うようにしてもよい。
{脈波周波数の検出方法に関する変形例}
以上の説明では、体動の検出結果等に基づいて、脈波信号及び帯域信号W(又は、帯域信号1W)のいずれか一方のピーク周波数を脈波周波数に選択する例を示したが、他の方法により脈波周波数を計測するようにしてもよい。
以上の説明では、体動の検出結果等に基づいて、脈波信号及び帯域信号W(又は、帯域信号1W)のいずれか一方のピーク周波数を脈波周波数に選択する例を示したが、他の方法により脈波周波数を計測するようにしてもよい。
例えば、計測信号の周波数分布において、前回の脈波周波数の計測値を中心とする所定の帯域内において、スペクトル強度が所定の閾値以上となるピークが存在する場合、そのピークに対応する周波数を脈波周波数として計測するようにしてもよい。
また、第3の実施の形態では、脈波成分が確実に脈波信号に含まれる。従って、例えば、体動検出処理を省略して、常に脈波信号のピーク周波数を脈波周波数として計測することも可能である。
{体動信号のARモデルに関する変形例}
例えば、計測信号(帯域信号W又は帯域信号1W)のレベル(例えば、振幅値等)に基づいて、線形予測フィルタのARモデルの次数を変更するようにしてもよい。
例えば、計測信号(帯域信号W又は帯域信号1W)のレベル(例えば、振幅値等)に基づいて、線形予測フィルタのARモデルの次数を変更するようにしてもよい。
具体的には、脈波成分に対する体動成分の比率が高い場合、線形予測フィルタのARモデルの次数を上げても、線形予測フィルタの体動成分と脈波成分の分離精度はあまり低下しない。また、線形予測フィルタのARモデルの次数を上げることにより、線形予測フィルタのノイズの分離精度が向上する。一方、脈波成分に対する体動成分の比率が低い場合、線形予測フィルタのARモデルの次数を上げると、線形予測フィルタの体動成分と脈波成分の分離精度が低下する。
また、計測信号のレベルが高くなるほど、計測信号に含まれる体動成分が大きく、脈波成分に対する体動成分の比率が高くなると想定される。
そこで、例えば、線形予測フィルタが、計測信号のレベルが高くなるほど、ARモデルの次数を高くし、計測信号のレベルが低くなるほど、ARモデルの次数を低くするようにしてもよい。
また、ユール-ウォーカー法以外の方法により、体動信号のARモデルを生成するようにしてもよい。
{ダウンサンプリングに関する変形例}
例えば、前回の脈波周波数を中心とする所定の帯域(例えば、1~2オクターブ)の成分をBPFにより抽出し、抽出した信号の周波数をシフトすることにより、計測信号をダウンサンプリングする比率をさらに下げることが可能である。この具体例について、図21を参照して説明する。なお、図21の上の図は、図9と同じ図である。
例えば、前回の脈波周波数を中心とする所定の帯域(例えば、1~2オクターブ)の成分をBPFにより抽出し、抽出した信号の周波数をシフトすることにより、計測信号をダウンサンプリングする比率をさらに下げることが可能である。この具体例について、図21を参照して説明する。なお、図21の上の図は、図9と同じ図である。
例えば、まず、計測信号から検出範囲R2の周波数帯域の成分がBPFにより抽出される。次に、抽出された信号の周波数帯域が、下の図の周波数帯域R2”にシフトされる。これにより、ダウンサンプリング後の計測信号の検出可能な周波数成分が、範囲R1より狭い範囲R1”以上確保できれば、脈波周波数の検出が可能になる。従って、計測信号のダウンサンプリングの比率をさらに下げることが可能になる。
また、例えば、ダウンサンプリングを行わずに、計測信号のサンプリング周波数を、脈波周波数を計測可能な範囲内で下げるようにしてもよい。
{計測結果に関する変形例}
以上の説明では、脈拍数を計測結果として出力する例を示したが、例えば、脈波周波数を計測結果として出力することも可能である。
以上の説明では、脈拍数を計測結果として出力する例を示したが、例えば、脈波周波数を計測結果として出力することも可能である。
また、例えば、脈波信号を計測結果として出力することも可能である。或いは、体動検出の結果に基づいて、脈波信号、及び、帯域信号W(又は、帯域信号1W)のうち一方を選択し、選択した信号を、脈波の計測結果として出力するようにしてもよい。なお、いずれの場合も、ノイズを除去してから信号を出力するようにすることが望ましい。
さらに、脈拍数、脈波周波数、及び、脈波信号(又は、帯域信号W若しくは帯域信号1W)のうち2種類以上を計測結果として出力するようにしてもよい。
また、例えば、計測結果に体動信号を含めるようにしてもよい。
{その他の変形例}
以上の説明で示した各種の数値(例えば、各種の周波数や波長、サンプル数、ダウンサンプリングの比率等)は、その一例であり、上に挙げた以外の数値を採用することも可能である。
以上の説明で示した各種の数値(例えば、各種の周波数や波長、サンプル数、ダウンサンプリングの比率等)は、その一例であり、上に挙げた以外の数値を採用することも可能である。
また、図6の計測部135の代わりに、図12の計測部335や図17の計測部534を用いることも可能である。逆に、図12の計測部335や図17の計測部534の代わりに、図6の計測部135を用いることも可能である。
また、図14及び図15を参照して上述したように、計測光の波長及び体動の種類により、計測信号の波形の変化が異なる。この波形の変化の違いに基づいて、例えば、体動の種類を分類するようにしてもよい。
さらに、図8、図13、及び、図18のフローチャートの各ステップの処理は、適宜順番を変更したり、並列に実行したりすることも可能である。
また、計測装置1を複数の装置からなるシステムにより構成することも可能である。例えば、演算処理部26の一部又は全部を、被験者に装着する装置とは異なる装置に設け、無線通信又は有線通信により、装置間の計測信号の伝送を行うようにしてもよい。
さらに、以上の説明では、計測装置を人の腕に装着する例を示したが、本技術は、腕以外の部分に装着する計測装置にも適用することができる。また、計測装置の形状を、上述したリストバンド型以外の形状にすることも可能である。
また、本技術は、人以外の生物の脈波及び脈拍を計測する場合にも適用することができる。
{コンピュータの構成例}
上述した一連の処理は、ハードウエアにより実行することもできるし、ソフトウエアにより実行することもできる。一連の処理をソフトウエアにより実行する場合には、そのソフトウエアを構成するプログラムが、コンピュータにインストールされる。ここで、コンピュータには、専用のハードウエアに組み込まれているコンピュータや、各種のプログラムをインストールすることで、各種の機能を実行することが可能な、例えば汎用のパーソナルコンピュータなどが含まれる。
上述した一連の処理は、ハードウエアにより実行することもできるし、ソフトウエアにより実行することもできる。一連の処理をソフトウエアにより実行する場合には、そのソフトウエアを構成するプログラムが、コンピュータにインストールされる。ここで、コンピュータには、専用のハードウエアに組み込まれているコンピュータや、各種のプログラムをインストールすることで、各種の機能を実行することが可能な、例えば汎用のパーソナルコンピュータなどが含まれる。
図22は、上述した一連の処理をプログラムにより実行するコンピュータのハードウエアの構成例を示すブロック図である。
コンピュータにおいて、CPU(Central Processing Unit)701,ROM(Read Only Memory)702,RAM(Random Access Memory)703は、バス704により相互に接続されている。
バス704には、さらに、入出力インタフェース705が接続されている。入出力インタフェース705には、入力部706、出力部707、記憶部708、通信部709、及びドライブ710が接続されている。
入力部706は、キーボード、マウス、マイクロフォンなどよりなる。出力部707は、ディスプレイ、スピーカなどよりなる。記憶部708は、ハードディスクや不揮発性のメモリなどよりなる。通信部709は、ネットワークインタフェースなどよりなる。ドライブ710は、磁気ディスク、光ディスク、光磁気ディスク、又は半導体メモリなどのリムーバブルメディア711を駆動する。
以上のように構成されるコンピュータでは、CPU701が、例えば、記憶部708に記憶されているプログラムを、入出力インタフェース705及びバス704を介して、RAM703にロードして実行することにより、上述した一連の処理が行われる。
コンピュータ(CPU701)が実行するプログラムは、例えば、パッケージメディア等としてのリムーバブルメディア711に記録して提供することができる。また、プログラムは、ローカルエリアネットワーク、インターネット、デジタル衛星放送といった、有線または無線の伝送媒体を介して提供することができる。
コンピュータでは、プログラムは、リムーバブルメディア711をドライブ710に装着することにより、入出力インタフェース705を介して、記憶部708にインストールすることができる。また、プログラムは、有線または無線の伝送媒体を介して、通信部709で受信し、記憶部708にインストールすることができる。その他、プログラムは、ROM702や記憶部708に、あらかじめインストールしておくことができる。
なお、コンピュータが実行するプログラムは、本明細書で説明する順序に沿って時系列に処理が行われるプログラムであっても良いし、並列に、あるいは呼び出しが行われたとき等の必要なタイミングで処理が行われるプログラムであっても良い。
また、本明細書において、システムとは、複数の構成要素(装置、モジュール(部品)等)の集合を意味し、すべての構成要素が同一筐体中にあるか否かは問わない。したがって、別個の筐体に収納され、ネットワークを介して接続されている複数の装置、及び、1つの筐体の中に複数のモジュールが収納されている1つの装置は、いずれも、システムである。
さらに、本技術の実施の形態は、上述した実施の形態に限定されるものではなく、本技術の要旨を逸脱しない範囲において種々の変更が可能である。
例えば、本技術は、1つの機能をネットワークを介して複数の装置で分担、共同して処理するクラウドコンピューティングの構成をとることができる。
また、上述のフローチャートで説明した各ステップは、1つの装置で実行する他、複数の装置で分担して実行することができる。
さらに、1つのステップに複数の処理が含まれる場合には、その1つのステップに含まれる複数の処理は、1つの装置で実行する他、複数の装置で分担して実行することができる。
また、本明細書に記載された効果はあくまで例示であって限定されるものではなく、他の効果があってもよい。
さらに、本技術の実施の形態は、上述した実施の形態に限定されるものではなく、本技術の要旨を逸脱しない範囲において種々の変更が可能である。
また、例えば、本技術は以下のような構成も取ることができる。
(1)
第1の波長の光を脈を含む部分に照射することにより取得された第1の計測信号の第1の周波数帯域の成分を含む第1の帯域信号から、体動により生じる成分を含む体動信号を抽出する体動信号抽出部と、
前記第1の計測信号の第2の周波数帯域の成分を含む第2の帯域信号と前記体動信号との差分信号である脈波信号を生成する演算部と
を備える計測装置。
(2)
前記体動信号抽出部は、自己回帰モデルを用いて前記体動信号を予測して抽出する
前記(1)に記載の計測装置。
(3)
前記体動信号抽出部は、ユール-ウォーカー法を用いて、次数が5次から12次までの範囲内の前記自己回帰モデルを生成する
前記(2)に記載の計測装置。
(4)
前記体動信号抽出部は、前記第1の帯域信号のレベルに基づいて、前記自己回帰モデルの次数を設定する
前記(3)に記載の計測装置。
(5)
前記体動の検出を行う体動検出部と、
前記脈波信号及び前記第2の帯域信号の中から前記体動の検出結果に基づいて選択した信号に基づいて、脈波周波数を計測する計測部と
をさらに備える前記(1)乃至(4)のいずれかに記載の計測装置。
(6)
前記体動信号抽出部は、前記第1の帯域信号の周波数成分のうち、前回の脈波周波数の計測値を含む帯域の周波数成分を減衰させた信号から、前記体動信号を抽出する
前記(5)に記載の計測装置。
(7)
前記計測部は、
前記脈波信号のピーク周波数である第1のピーク周波数、及び、前記第2の帯域信号のピーク周波数である第2のピーク周波数を検出する周波数検出部と、
前記体動の検出結果、及び、前回の脈波周波数の計測値のうち少なくとも一方に基づいて、前記第1のピーク周波数及び前記第2のピーク周波数から前記脈波周波数を選択する選択部と
を備える前記(5)に記載の計測装置。
(8)
前記周波数検出部は、前回の脈波周波数の計測値に基づいて、前記第1のピーク周波数及び前記第2のピーク周波数を検出する周波数帯域を制限する
前記(7)に記載の計測装置。
(9)
前記周波数検出部は、値が0のサンプルをパディングした前記脈波信号をフーリエ変換した結果に基づいて、前記第1のピーク周波数を検出し、値が0のサンプルをパディングした前記第2の帯域信号をフーリエ変換した結果に基づいて、前記第2のピーク周波数を検出する
前記(7)又は(8)に記載の計測装置。
(10)
前記計測部は、
前記体動の検出結果に基づいて、前記脈波信号又は前記第2の帯域信号を選択する選択部と、
前記選択部により選択された信号のピーク周波数を前記脈波周波数として検出する周波数検出部と
を備える前記(5)に記載の計測装置。
(11)
前記周波数検出部は、前回の脈波周波数の計測値に基づいて、前記ピーク周波数を検出する周波数帯域を制限する
前記(10)に記載の計測装置。
(12)
前記周波数検出部は、前記選択部により選択された信号に値が0のサンプルをパディングした信号をフーリエ変換した結果に基づいて、前記ピーク周波数を検出する
前記(10)又は(11)に記載の計測装置。
(13)
前記体動検出部は、前記体動信号の周波数分布に基づいて、前記体動の検出を行う
前記(5)乃至(12)のいずれかに記載の計測装置。
(14)
前記体動検出部は、第2の波長の光を前記脈を含む部分に照射することにより取得された第2の計測信号の前記第1の周波数帯域の成分を含む第3の帯域信号と前記第1の帯域信号との合成ベクトルの分布に基づいて、前記体動の検出を行う
前記(5)乃至(13)のいずれかに記載の計測装置。
(15)
前記体動検出部は、前記第1の計測信号の変化、及び、第2の波長の光を前記脈を含む部分に照射することにより取得された第2の計測信号の変化に基づいて、前記体動の検出を行う
前記(5)乃至(14)のいずれかに記載の計測装置。
(16)
前記計測部は、前記脈波周波数に基づいて、脈拍数を計算する
前記(5)乃至(15)のいずれかに記載の計測装置。
(17)
前記第1の計測信号から前記第1の帯域信号を抽出する第1のフィルタと、
前記第1の計測信号から前記第2の帯域信号を抽出する第2のフィルタと
をさらに備え、
前記第2の周波数帯域は、計測対象とする脈波周波数の範囲を含み、前記第2の周波数帯域の最大値は、前記第1の周波数帯域の最大値より大きい
前記(1)乃至(16)のいずれかに記載の計測装置。
(18)
前記第1の計測信号から前記第1の帯域信号を抽出するフィルタを
さらに備え、
前記第1の周波数帯域は、前記第2の周波数帯域と同じであり、計測対象とする脈波周波数の範囲を含み、
前記第1の帯域信号と前記第2の帯域信号は同じ信号である
前記(1)乃至(16)のいずれかに記載の計測装置。
(19)
所定の波長の光を脈を含む部分に照射することにより取得された第1の計測信号の第1の周波数帯域の成分を含む第1の帯域信号から、体動により生じる成分を含む体動信号を抽出する体動信号抽出ステップと、
前記第1の計測信号の第2の周波数帯域の成分を含む第2の帯域信号と前記体動信号との差分信号である脈波信号を生成する演算ステップと
を含む計測方法。
1 計測装置, 11 本体部, 22,22a乃至22c LED, 23 受光IC, 26,26a乃至26c 演算処理部, 51 LEDドライバ, 53 受光素子, 54 ADコンバータ, 101 デシメーションフィルタ, 102 BPF, 103 自己共分散関数推定部, 104 線形予測フィルタ, 105 BPF, 106 演算部, 107a,107b DFT部, 108a,108b ピーク検出部, 109 DFT部, 110 判定部, 111 選択部, 112 計算部, 131 体動信号抽出部, 132 脈波信号抽出部, 133 体動検出部, 134 周波数検出部, 135 計測部, 301a,301b デシメーションフィルタ, 302a,302b BPF, 303 自己共分散関数推定部, 304 線形予測フィルタ, 305 BPF, 306 演算部, 307 合成ベクトル生成部, 308 判定部, 309 選択部, 310 DFT部, 311 帯域制限部, 312 ピーク検出部, 313 計算部, 331 体動信号抽出部, 332 脈波信号抽出部, 333 体動検出部, 334 周波数検出部, 335 計測部, 501 デシメーションフィルタ, 502 BPF, 503 可変ノッチフィルタ, 504 自己共分散関数推定部, 505 線形予測フィルタ, 506 演算部, 507 体動検出部, 508 判定部, 509 DFT部, 510 帯域制限部, 511 ピーク検出部, 512 計算部, 531 体動信号抽出部, 532 脈波信号抽出部, 533 周波数検出部, 534 計測部
Claims (19)
- 第1の波長の光を脈を含む部分に照射することにより取得された第1の計測信号の第1の周波数帯域の成分を含む第1の帯域信号から、体動により生じる成分を含む体動信号を抽出する体動信号抽出部と、
前記第1の計測信号の第2の周波数帯域の成分を含む第2の帯域信号と前記体動信号との差分信号である脈波信号を生成する演算部と
を備える計測装置。 - 前記体動信号抽出部は、自己回帰モデルを用いて前記体動信号を予測して抽出する
請求項1に記載の計測装置。 - 前記体動信号抽出部は、ユール-ウォーカー法を用いて、次数が5次から12次までの範囲内の前記自己回帰モデルを生成する
請求項2に記載の計測装置。 - 前記体動信号抽出部は、前記第1の帯域信号のレベルに基づいて、前記自己回帰モデルの次数を設定する
請求項3に記載の計測装置。 - 前記体動の検出を行う体動検出部と、
前記脈波信号及び前記第2の帯域信号の中から前記体動の検出結果に基づいて選択した信号に基づいて、脈波周波数を計測する計測部と
をさらに備える請求項1に記載の計測装置。 - 前記体動信号抽出部は、前記第1の帯域信号の周波数成分のうち、前回の脈波周波数の計測値を含む帯域の周波数成分を減衰させた信号から、前記体動信号を抽出する
請求項5に記載の計測装置。 - 前記計測部は、
前記脈波信号のピーク周波数である第1のピーク周波数、及び、前記第2の帯域信号のピーク周波数である第2のピーク周波数を検出する周波数検出部と、
前記体動の検出結果、及び、前回の脈波周波数の計測値のうち少なくとも一方に基づいて、前記第1のピーク周波数及び前記第2のピーク周波数から前記脈波周波数を選択する選択部と
を備える請求項5に記載の計測装置。 - 前記周波数検出部は、前回の脈波周波数の計測値に基づいて、前記第1のピーク周波数及び前記第2のピーク周波数を検出する周波数帯域を制限する
請求項7に記載の計測装置。 - 前記周波数検出部は、値が0のサンプルをパディングした前記脈波信号をフーリエ変換した結果に基づいて、前記第1のピーク周波数を検出し、値が0のサンプルをパディングした前記第2の帯域信号をフーリエ変換した結果に基づいて、前記第2のピーク周波数を検出する
請求項7に記載の計測装置。 - 前記計測部は、
前記体動の検出結果に基づいて、前記脈波信号又は前記第2の帯域信号を選択する選択部と、
前記選択部により選択された信号のピーク周波数を前記脈波周波数として検出する周波数検出部と
を備える請求項5に記載の計測装置。 - 前記周波数検出部は、前回の脈波周波数の計測値に基づいて、前記ピーク周波数を検出する周波数帯域を制限する
請求項10に記載の計測装置。 - 前記周波数検出部は、前記選択部により選択された信号に値が0のサンプルをパディングした信号をフーリエ変換した結果に基づいて、前記ピーク周波数を検出する
請求項10に記載の計測装置。 - 前記体動検出部は、前記体動信号の周波数分布に基づいて、前記体動の検出を行う
請求項5に記載の計測装置。 - 前記体動検出部は、第2の波長の光を前記脈を含む部分に照射することにより取得された第2の計測信号の前記第1の周波数帯域の成分を含む第3の帯域信号と前記第1の帯域信号との合成ベクトルの分布に基づいて、前記体動の検出を行う
請求項5に記載の計測装置。 - 前記体動検出部は、前記第1の計測信号の変化、及び、第2の波長の光を前記脈を含む部分に照射することにより取得された第2の計測信号の変化に基づいて、前記体動の検出を行う
請求項5に記載の計測装置。 - 前記計測部は、前記脈波周波数に基づいて、脈拍数を計算する
請求項5に記載の計測装置。 - 前記第1の計測信号から前記第1の帯域信号を抽出する第1のフィルタと、
前記第1の計測信号から前記第2の帯域信号を抽出する第2のフィルタと
をさらに備え、
前記第2の周波数帯域は、計測対象とする脈波周波数の範囲を含み、前記第2の周波数帯域の最大値は、前記第1の周波数帯域の最大値より大きい
請求項1に記載の計測装置。 - 前記第1の計測信号から前記第1の帯域信号を抽出するフィルタを
さらに備え、
前記第1の周波数帯域は、前記第2の周波数帯域と同じであり、計測対象とする脈波周波数の範囲を含み、
前記第1の帯域信号と前記第2の帯域信号は同じ信号である
請求項1に記載の計測装置。 - 所定の波長の光を脈を含む部分に照射することにより取得された第1の計測信号の第1の周波数帯域の成分を含む第1の帯域信号から、体動により生じる成分を含む体動信号を抽出する体動信号抽出ステップと、
前記第1の計測信号の第2の周波数帯域の成分を含む第2の帯域信号と前記体動信号との差分信号である脈波信号を生成する演算ステップと
を含む計測方法。
Priority Applications (1)
| Application Number | Priority Date | Filing Date | Title |
|---|---|---|---|
| US15/113,144 US20170258405A1 (en) | 2014-12-01 | 2015-11-19 | Measurement device and measurement method |
Applications Claiming Priority (2)
| Application Number | Priority Date | Filing Date | Title |
|---|---|---|---|
| JP2014243198A JP6300026B2 (ja) | 2014-12-01 | 2014-12-01 | 計測装置及び計測方法 |
| JP2014-243198 | 2014-12-01 |
Publications (1)
| Publication Number | Publication Date |
|---|---|
| WO2016088564A1 true WO2016088564A1 (ja) | 2016-06-09 |
Family
ID=56091514
Family Applications (1)
| Application Number | Title | Priority Date | Filing Date |
|---|---|---|---|
| PCT/JP2015/082549 WO2016088564A1 (ja) | 2014-12-01 | 2015-11-19 | 計測装置及び計測方法 |
Country Status (3)
| Country | Link |
|---|---|
| US (1) | US20170258405A1 (ja) |
| JP (1) | JP6300026B2 (ja) |
| WO (1) | WO2016088564A1 (ja) |
Cited By (2)
| Publication number | Priority date | Publication date | Assignee | Title |
|---|---|---|---|---|
| CN109864720A (zh) * | 2017-12-04 | 2019-06-11 | 现代自动车株式会社 | 脉搏测量装置和方法及其车辆系统 |
| WO2022049700A1 (ja) * | 2020-09-03 | 2022-03-10 | 日本電信電話株式会社 | 動作評価方法、コンピュータプログラム及び動作評価システム |
Families Citing this family (2)
| Publication number | Priority date | Publication date | Assignee | Title |
|---|---|---|---|---|
| WO2017189612A1 (en) * | 2016-04-25 | 2017-11-02 | Performance Athlytics | Method and device for tissue monitoring and heart rate detection |
| EP3406189A1 (en) * | 2017-05-25 | 2018-11-28 | Tata Consultancy Services Limited | System and method for heart rate estimation |
Citations (4)
| Publication number | Priority date | Publication date | Assignee | Title |
|---|---|---|---|---|
| JP2001212090A (ja) * | 2000-02-04 | 2001-08-07 | Nippon Telegr & Teleph Corp <Ntt> | 脈波データに対する信号処理方法とその装置およびその信号処理プログラムを記録した記憶媒体 |
| JP2005160640A (ja) * | 2003-12-01 | 2005-06-23 | Denso Corp | 生体状態検出装置 |
| JP2010535047A (ja) * | 2007-07-30 | 2010-11-18 | オックスフォード バイオシグナルズ リミテッド | 呼吸数を測定するための方法および装置 |
| JP2014057622A (ja) * | 2012-09-14 | 2014-04-03 | Casio Comput Co Ltd | 波形データ処理装置、波形データ処理方法及びプログラム |
Family Cites Families (2)
| Publication number | Priority date | Publication date | Assignee | Title |
|---|---|---|---|---|
| US20130007965A1 (en) * | 2011-07-08 | 2013-01-10 | Robert Leap | Golfing distance measuring device |
| US9533873B2 (en) * | 2013-02-05 | 2017-01-03 | Butterfly Network, Inc. | CMOS ultrasonic transducers and related apparatus and methods |
-
2014
- 2014-12-01 JP JP2014243198A patent/JP6300026B2/ja active Active
-
2015
- 2015-11-19 US US15/113,144 patent/US20170258405A1/en not_active Abandoned
- 2015-11-19 WO PCT/JP2015/082549 patent/WO2016088564A1/ja active Application Filing
Patent Citations (4)
| Publication number | Priority date | Publication date | Assignee | Title |
|---|---|---|---|---|
| JP2001212090A (ja) * | 2000-02-04 | 2001-08-07 | Nippon Telegr & Teleph Corp <Ntt> | 脈波データに対する信号処理方法とその装置およびその信号処理プログラムを記録した記憶媒体 |
| JP2005160640A (ja) * | 2003-12-01 | 2005-06-23 | Denso Corp | 生体状態検出装置 |
| JP2010535047A (ja) * | 2007-07-30 | 2010-11-18 | オックスフォード バイオシグナルズ リミテッド | 呼吸数を測定するための方法および装置 |
| JP2014057622A (ja) * | 2012-09-14 | 2014-04-03 | Casio Comput Co Ltd | 波形データ処理装置、波形データ処理方法及びプログラム |
Cited By (3)
| Publication number | Priority date | Publication date | Assignee | Title |
|---|---|---|---|---|
| CN109864720A (zh) * | 2017-12-04 | 2019-06-11 | 现代自动车株式会社 | 脉搏测量装置和方法及其车辆系统 |
| CN109864720B (zh) * | 2017-12-04 | 2022-06-24 | 现代自动车株式会社 | 脉搏测量装置和方法及其车辆系统 |
| WO2022049700A1 (ja) * | 2020-09-03 | 2022-03-10 | 日本電信電話株式会社 | 動作評価方法、コンピュータプログラム及び動作評価システム |
Also Published As
| Publication number | Publication date |
|---|---|
| US20170258405A1 (en) | 2017-09-14 |
| JP6300026B2 (ja) | 2018-03-28 |
| JP2016104086A (ja) | 2016-06-09 |
Similar Documents
| Publication | Publication Date | Title |
|---|---|---|
| US20200359919A1 (en) | Motion Artifact Removal by Time Domain Projection | |
| CN105816163B (zh) | 检测心率的方法、装置及可穿戴设备 | |
| TWI538660B (zh) | 心跳偵測模組及其偵測、去噪方法 | |
| WO2016088564A1 (ja) | 計測装置及び計測方法 | |
| JP6201469B2 (ja) | 生体情報処理装置、生体情報処理方法 | |
| JP2007054471A (ja) | 脈拍数測定装置及び脈拍数測定方法 | |
| WO2017199597A1 (ja) | 生体情報処理装置、生体情報処理方法、及び情報処理装置 | |
| US10750982B2 (en) | Oxygen saturation measuring apparatus and oxygen saturation measuring method thereof | |
| KR20180086546A (ko) | 스트레스 측정을 위한 이어 헤드셋 장치 및 이를 이용한 스트레스 측정 방법 | |
| JP2012095940A (ja) | 脈拍数測定方法及び血中酸素飽和度測定方法 | |
| CN110292372B (zh) | 检测装置 | |
| CN103340613A (zh) | 基于无线通信的信号采集与分析实时交互式系统及方法 | |
| JP5582051B2 (ja) | 脈波計測装置、およびプログラム | |
| US10980485B2 (en) | Measuring apparatus, measuring method and non-transitory computer readable medium | |
| US20180338728A1 (en) | Wearable device, method and apparatus for eliminating motion interference | |
| JP2013106837A (ja) | 心拍検知方法、心拍検知装置および精神ストレス計測装置 | |
| JP6152728B2 (ja) | 生体情報検出装置 | |
| TW201332512A (zh) | 量測心率方法及裝置 | |
| JPWO2016056479A1 (ja) | 脈拍数計測装置 | |
| JP2013183845A (ja) | 拍動検出装置、電子機器及びプログラム | |
| US20140288885A1 (en) | Signal processing device, pulse wave measuring apparatus, and signal processing method | |
| CN104622478A (zh) | 血氧仪抖动判定方法和智能抗抖动血氧测量设备 | |
| JP2017164537A (ja) | 生体情報検出装置 | |
| JP5998563B2 (ja) | 拍動検出装置、電子機器及びプログラム | |
| TWI823500B (zh) | 心率監測方法 |
Legal Events
| Date | Code | Title | Description |
|---|---|---|---|
| 121 | Ep: the epo has been informed by wipo that ep was designated in this application |
Ref document number: 15865273 Country of ref document: EP Kind code of ref document: A1 |
|
| WWE | Wipo information: entry into national phase |
Ref document number: 15113144 Country of ref document: US |
|
| NENP | Non-entry into the national phase |
Ref country code: DE |
|
| 122 | Ep: pct application non-entry in european phase |
Ref document number: 15865273 Country of ref document: EP Kind code of ref document: A1 |