WO2015136642A1 - 電力予測装置、電力予測プログラムおよび電力予測方法 - Google Patents
電力予測装置、電力予測プログラムおよび電力予測方法 Download PDFInfo
- Publication number
- WO2015136642A1 WO2015136642A1 PCT/JP2014/056508 JP2014056508W WO2015136642A1 WO 2015136642 A1 WO2015136642 A1 WO 2015136642A1 JP 2014056508 W JP2014056508 W JP 2014056508W WO 2015136642 A1 WO2015136642 A1 WO 2015136642A1
- Authority
- WO
- WIPO (PCT)
- Prior art keywords
- power
- input
- output
- prediction
- current time
- Prior art date
- Legal status (The legal status is an assumption and is not a legal conclusion. Google has not performed a legal analysis and makes no representation as to the accuracy of the status listed.)
- Ceased
Links
Images



Classifications
-
- G—PHYSICS
- G01—MEASURING; TESTING
- G01R—MEASURING ELECTRIC VARIABLES; MEASURING MAGNETIC VARIABLES
- G01R21/00—Arrangements for measuring electric power or power factor
- G01R21/133—Arrangements for measuring electric power or power factor by using digital technique
Definitions
- the present invention relates to a power prediction device, a power prediction program, and a power prediction method, and to a power prediction device that predicts output power of a natural energy power generation device.
- Patent Documents 1 and 2 disclose a method for predicting the generated power of natural energy power generation based on weather prediction such as climate, temperature, wind speed, and wind direction.
- the generated power is predicted based on information input from the outside such as weather forecast. Since this method depends on external information, the generated power cannot be predicted at a place or time when external information cannot be obtained.
- the present invention has been made in view of the above problems, and an object thereof is to perform power prediction without depending on information from the outside.
- the power information representing the input / output power that is input to or output from the node by one or more power devices including the natural energy power generation device is time-sequentially divided from a plurality of sections divided by a certain period, immediately before
- An extraction unit that extracts a section similar to the power information of the first and a prediction unit that predicts the input / output power after the current time based on the power information after the time corresponding to the current time in the similar section;
- a power predicting apparatus comprising:
- the power device includes a load
- the power prediction device is configured to perform the current time based on the natural energy power generation device predicted by the prediction unit and the input / output power after the current time of the load. It can be set as the structure which comprises the determination part which determines the subsequent electric power supply-demand balance.
- the power device includes a power storage device, and the prediction unit predicts a stored power amount of the power storage device based on the predicted natural energy power generation device and the input / output power after the current time of the load.
- the said determination part can be set as the structure which determines the electric power supply-and-demand balance after the said current time based on the stored electric energy after the said current time.
- the value related to the input / output power may be a summary statistic of the input / output power for each period shorter than the predetermined period.
- the value related to the input / output power may be a summary statistic of the input / output power for each period and a summary statistic of the fluctuation amount of the input / output power for each period.
- the extraction unit extracts a plurality of the similar sections, and the prediction unit calculates a similarity between the plurality of power information corresponding to the plurality of similar sections and the immediately preceding power information. Based on the above, the input / output power after the current time can be predicted.
- the power device includes a storage device that stores the power information, and when the power device is connected to the node, the extraction unit extracts the storage device from the storage device of the connected power device. It can be set as the structure which reads electric power information.
- the node may not be connected to an external power supply system.
- the natural energy power generation device may be a power generation device using sunlight, and the fixed period may be 24 hours.
- the present invention provides a processor or a computer with a plurality of sections in which power information that represents in time series values related to input / output power input or output to or from a node by one or more power devices including a natural energy power generation device
- the present invention is a power prediction method that is executed by a processor or a computer, and includes power information that represents in time series values related to input / output power that one or more power devices including a natural energy power generation device inputs or outputs to a node. Extracting a section similar to the immediately preceding power information from a plurality of sections divided at a fixed period, and the input after the current time from the power information after the time corresponding to the current time in the similar section. And a step of predicting output power.
- power prediction can be performed without depending on information from the outside.
- FIG. 1 is a block diagram illustrating a system in which the power prediction apparatus according to the first embodiment is used.
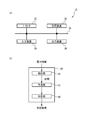
- FIG. 2A is a block diagram of the control unit in the first embodiment
- FIG. 2B is a functional block diagram of the power prediction apparatus.
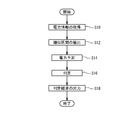
- FIG. 3 is a flowchart illustrating the operation of the power prediction apparatus according to the first embodiment.
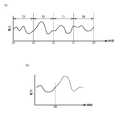
- FIG. 4A and FIG. 4B are diagrams illustrating power with respect to time for explaining power prediction in the first embodiment.
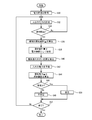
- FIG. 5 is a flowchart illustrating the operation of the power prediction apparatus according to the second embodiment.
- FIG. 6 is a diagram illustrating power information in one section of each power device in the second embodiment.
- FIG. 7A is a diagram illustrating an example of the average C (t) of the calculated stored power amount with respect to time t
- FIG. 7B is a standard deviation ⁇ C (t) of the calculated stored power amount with respect to time
- FIG. 7C is a diagram showing an example of C (t) ⁇ ⁇ C (t).
- FIG. 8 is a flowchart illustrating an example of the operation of the determination unit according to the second embodiment.
- FIG. 9A is a diagram illustrating an example of a screen of a PMS display device
- FIG. 9B is a diagram illustrating an example of a load outlet.
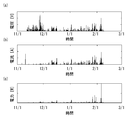
- FIG. 10A to FIG. 10C are diagrams showing the generated voltage, current, and power of the solar cell, respectively.
- FIG. 11C are diagrams showing the generated voltage, current, and power of the wind turbine generator, respectively.
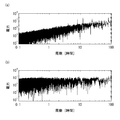
- FIG. 12A and FIG. 12B are diagrams showing the output power of the solar cell and wind power generation, respectively, subjected to Fourier transform and shown with respect to the period.
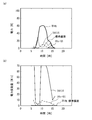
- 13 (a) and 13 (b) are diagrams showing the power of the solar cell and the amount of power fluctuation with respect to time in a certain day, respectively, and
- FIG. 13 (c) is a diagram for explaining each symbol in FIG. 13 (a). It is.
- FIG. 14A and FIG. 14B are diagrams showing the average value, standard deviation, skewness, and kurtosis of power and power fluctuation amount with respect to time in a certain day, respectively.
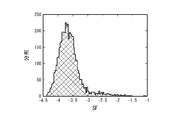
- FIG. 15 is a diagram showing the distribution of the calculated similarity factor SF.
- FIG. 1 is a block diagram illustrating a system in which the power prediction apparatus according to the first embodiment is used.
- a power system 100 includes a plurality of PMS (power management systems) 10 and 25 connected in a network.
- the node 16 of each PMS 10 and 25 is set to a constant voltage.
- the voltage of the node 16 is, for example, a DC voltage and is 48V.
- the nodes 16 of each PMS 10 and 25 are set to substantially the same voltage.
- the node 16 may be set to an alternating voltage. When the node 16 is an alternating voltage, the voltage, frequency, phase, etc. of the nodes 16 of the PMSs 10 and 25 are substantially the same.
- the power devices 21 to 25 are connected to the PMS 10.
- Power devices 21 to 25 are a solar cell, a wind power generator, a load, a power storage device, and other PMS, respectively.
- the load is a device that consumes power, such as a home appliance or an information device.
- the power storage device is a device that stores electric power, such as a secondary battery or an electric double layer capacitor.
- the power devices 21 to 24 may include a storage device 26.
- the storage device 26 is, for example, a hard disk or a semiconductor memory. Between the power devices 21 to 25, a converter for converting a voltage and / or a DC-AC converter and the like are provided.
- the PMS 10 includes measuring units 11 to 15 and a control unit 18.
- the measuring units 11 to 15 measure the power output from or input to the node 16 by the power devices 21 to 25.
- the control unit 18 controls the measurement units 11 to 15 and the power devices 21 to 24.
- the node 16 may be connected to an external power supply system through another PMS or directly. Further, the node 16 may be independent without being connected to an external power supply system.
- FIG. 2A is a block diagram of the control unit in the first embodiment
- FIG. 2B is a functional block diagram of the power prediction apparatus.
- the control unit 18 includes a processor 32, a storage device 34, an input device 36, an output device 38, and a bus 35.
- the processor 32 is, for example, a CPU (Central Processing Unit).
- the storage device 34 is, for example, a hard disk or a semiconductor memory.
- the input device 36 is an input circuit for inputting information from, for example, the measuring units 11 to 15.
- the output device 38 is, for example, a display device or an output circuit that outputs information.
- the bus 35 transmits data between the processor 32, the storage device 34, the input device 36 and the output device 38.
- the control unit 18 is, for example, a computer, a microprocessor, or a dedicated circuit.
- the control unit 18 or the processor 32 executes a power prediction program and a power prediction method.
- a portable storage medium can be used as a storage medium for storing the power prediction program.
- a CD-ROM (Compact Disc Read Only Memory) disc, a DVD (Digital Video Disc) disc, a Blu-ray disc, or a USB (Universal Serial Bus) memory can be used as the portable storage medium.
- a CD-ROM Compact Disc Read Only Memory
- DVD Digital Video Disc
- Blu-ray disc Blu-ray disc
- USB Universal Serial Bus
- a flash memory or HDD may be used as the storage medium.
- the power prediction apparatus 30 includes an extraction unit 42, a prediction unit 44, and a determination unit 46.
- the control unit 18 or the processor 32 functions as the extraction unit 42, the prediction unit 44, and the determination unit 46 in cooperation with the software.
- FIG. 3 is a flowchart illustrating the operation of the power prediction apparatus according to the first embodiment.
- the extraction unit 42 acquires past power information and immediately preceding power information (step S ⁇ b> 10).
- the power information is information represented in a time series of values related to input / output power measured by the measurement units 11 to 15.
- the power information may be information representing input / output power in time series or information obtained by processing input / output power.
- the input / output power is the power output from power devices 21 and 22 to node 16.
- input / output power is power input from the node 16 to the power device 23.
- the input / output power is the power output or input from node 16 to power devices 24 and 25.
- the stored power amount of the power device 24 can be calculated by integrating input / output power with respect to time. Further, the stored power amount of the power device 24 can be calculated from the SOC (State of Charge) of the power storage device.
- the input / output power is obtained by measuring input / output power or input / output current between the power devices 21 to 25 and the node 16.
- the input / output power may be obtained by measuring power, voltage, current, or the like in the power devices 21 to 25.
- the past power information and the immediately preceding power information are stored in, for example, the storage device 34 or the storage device 26 included in the power devices 21 to 24.
- the extraction unit 42 extracts a section similar to the immediately preceding power information from a plurality of sections obtained by dividing past power information at a constant period (step S12).
- the fixed period is an arbitrary preset period such as 1 hour, 24 hours, 4 days, or 7 days.
- the prediction unit 44 predicts input / output power after the current time from the power information of the section extracted by the extraction unit 42 (step S14).
- the determination unit 46 determines the power supply / demand balance after the current time based on the prediction of the prediction unit 44 (step S16). For example, the determination unit 46 determines to warn when the future power supply falls below the power demand.
- the determination unit 46 outputs the determination result (step S18). For example, the determination unit 46 outputs the determination result to the output device 38. For example, the user can suppress power consumption of the load by displaying the output device 38. Further, the control unit 18 may control the load based on the determination result.
- FIG. 4A and FIG. 4B are diagrams illustrating power with respect to time for explaining power prediction in the first embodiment.
- electric power shows the electric power input / output in either of the electric power apparatuses 21-25.
- Time t0 is the current time.
- Sections T0 to T3 have a constant period, for example, 24 hours. The time is traced backward from the time t0 and divided into fixed sections, which are defined as sections T0 to T3, respectively. If the time t0 is 11:00 am, the start time t1 of the section T0 is 11:00 am one day ago. Similarly, the start times t2 to t4 of the sections T1 to T3 are 11:00 am two to four days ago, respectively.
- the extraction unit 42 extracts a section similar to the section T0 from the sections T1 to T3.
- the section for determining the similarity may be a part of the sections T0 to T3.
- the similarity between the section T0 and the sections T1 to T3 may be determined in the period from 6:00 am to 11:00 am.
- the sections T0 to T3 may be sections that start from a predetermined start time. For example, it is possible to set a predetermined section from midnight to midnight the next day, and extract the section from the similarity between 6:00 am and 11 am in the section.
- the solid line indicates the past power
- the broken line indicates the predicted power.
- the prediction unit 44 predicts the power after the time t0 from the power after the time t3 in FIG.
- the predicted power is the power after time t3.
- one section T3 is extracted. However, a plurality of similar sections may be extracted, and power may be predicted from the plurality of sections.
- power devices 21 to 24 including at least a natural energy power generation device (solar cell or wind power generation device) are connected to the node 16.
- a natural energy power generation device a solar power generation device, a solar thermal power generation device, a tidal power generation device, a wave power generation device, an ocean current power generation device, or a temperature difference power generation device can be used in addition to a solar battery and a wind power generation device.
- the natural energy power generation device may be any device that converts natural energy into electric energy.
- the output power of the natural energy power generator fluctuates at a constant cycle. For example, the output power of the power generation device using sunlight is a 24-hour cycle. Other power generations fluctuate with a period of 24 hours, shorter than 24 hours, or longer than 24 hours.
- the extraction unit 42 extracts a section T3 similar to the immediately preceding power information from a plurality of sections obtained by dividing past power information at a constant period.
- the prediction unit 44 predicts input / output power after the current time t0 based on the power information after the time t3 corresponding to the current time t0 in the similar section T3. Thereby, input / output information can be predicted regardless of external information.
- a plurality of natural energy power generation devices may be provided. For example, the solar cell and the wind power generator may have different fixed periods for dividing the section.
- a load is connected to the node 16.
- the power consumed by the load is affected by human activity and / or the natural environment. Therefore, the input power of the load fluctuates at a constant cycle such as 24 hours and / or 7 days. For example, the life pattern of a worker in a cycle of three days night shift, one day vacation, three days lunch, and two days vacation is a nine day cycle. In this case, 9 days is a fixed period.
- the determination unit 46 determines the power supply / demand balance after the current time based on the input / output power after the current time of the natural energy power generation apparatus and the load predicted by the prediction unit 44. Thereby, it is possible to determine the power supply / demand balance without depending on external information.
- the node 16 is connected to a power storage device.
- the predicting unit 44 predicts the stored power amount of the power storage device based on the predicted natural energy power generation device and the input / output power after the current time of the load.
- the determination unit 46 determines the power supply / demand balance after the current time based on the accumulated power amount after the current time.
- the future power supply / demand balance can be determined from the amount of power stored in the power storage device.
- the stored power amount of the power storage device can be calculated, for example, by integrating the difference between the predicted output power of the natural energy power generation device and the predicted input power of the load. Further, the stored power amount may be calculated from the integral of the predicted input / output power between the node 16 and the power storage device.
- the node 16 may not be connected to an external power supply system.
- the PMS 10 is a self-supporting system, and power is not supplied from the outside.
- the power consumed by the load is covered by the natural energy power generation apparatus. If the power supply / demand balance is not sufficiently predicted, the power cannot be used when necessary. sell. Therefore, it is preferable to use a power prediction device.
- the first embodiment can be applied even if the node 16 is connected to an external power source.
- Example 2 is a specific example of Example 1.
- the block diagram of the system of the second embodiment and the functional block diagram of the power prediction apparatus are the same as those of the first embodiment, and a description thereof will be omitted.
- FIG. 5 is a flowchart illustrating the operation of the power prediction apparatus according to the second embodiment. As shown in FIG. 5, when each of the power devices 21 to 24 includes a storage device 26, past power information may be stored in the storage device 26. In this case, when the power devices 21 to 24 are connected to the node 16, the control unit 18 acquires power information from the storage device 26 (step S50). If the storage device 34 of the control unit 18 stores the power information, this step may be omitted.
- the control unit 18 causes the measurement units 11 to 15 to measure the input / output power between each power device 25 and the node 16 (step S32).
- the sampling time for measurement is, for example, 10 seconds.
- the control unit 18 determines whether a certain period has elapsed (step S34). The certain period is a period shorter than the section, for example, one hour. If No in step S34, the process returns to step S32.
- step S34 summary statistics of input / output power within a certain period are calculated (step S36). A summary statistic of the fluctuation amount of the input / output power may be calculated. Summary statistics are the mean and / or standard deviation.
- the summary statistic for example, at least one of average value, variance, standard deviation, median value, quartile, maximum value, minimum value, kurtosis (kurtosis), and skewness (skewness) can be used. . Since the median and quartile can be easily calculated from the mean and standard deviation, the median and / or quartile may be used as summary statistics.
- the control unit 18 stores the summary statistics for the period in the storage device 34 or 26 as part of the power information.
- FIG. 6 is a diagram illustrating power information in one section of each power device in the second embodiment.
- the power information in one section includes information from period 1 to period 24.
- One section is, for example, 24 hours, and each period 1 to 24 is 1 hour.
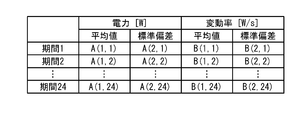
- the power information for one section includes average values A (1,1) to A (1,24) of input / output power, standard deviations A (2,1) to A (2,24) of input / output power, and power fluctuation amount.
- Is a 24-row ⁇ 4-column matrix of B (1,1) to B (1,24) and standard deviation B (2,1) to B (2,24) of the power fluctuation amount. Rows correspond to periods 1 to 24 and are arranged in time series.
- the average value and standard deviation are the average value and standard deviation within the period.
- the power fluctuation amount is a fluctuation rate of power per unit time.
- the storage device 34 or 26 stores power information of a plurality of past sections.
- the extraction unit 42 calculates the similarity between the power information of a plurality of sections and the power information of the immediately preceding section.
- the extraction unit 42 extracts a section having a high similarity from the similarities of the plurality of sections (step S40). For example, the extraction unit 42 extracts n sections having a high degree of similarity.
- Equation 1 is also expressed as Equation 2.
- W is a weight coefficient of the power fluctuation rate and can be set as appropriate. Compared with power, the power fluctuation rate is considered less likely to affect the similarity. Therefore, W is set to 1 or less. For example, W is set to 0.2.
- the similarity factor SF is expressed by Equation 3.
- SF ⁇ log (diff) Equation 3
- a similarity factor can be calculated as the similarity between two sections.
- the prediction unit 44 predicts the input / output power from the current time from the input / output power of the extracted section (step S42).
- the input / output power P (t) is predicted from n Ak (1, t).
- t corresponds to periods 1 to 24 (ie, time).
- the predicted input / output power P (t) is a linear combination of Ak (1, t), and is given by Equation 4.
- P (t) ⁇ k ( ak ⁇ Ak (1, t)) Equation 4
- k is an integer from 1 to n.
- P (t) is a simple average of Ak (1, t). A weighted average is obtained when the coefficients ak are different.
- the coefficient a k can be calculated as follows. It is assumed that the similarity factor SF k of the section having the highest similarity is k. The relative position within the overall similarity factor SF k can be evaluated. In this case, it is kth from the highest. When the relative position of the similarity factor SF k is high (similarity is high), it is preferable to increase the coefficient a k . Therefore, for example, the coefficient ak is expressed by Equation 5.
- a k cdf (SF k ) / ⁇ k cdf (SF k ) Equation 5
- cdf is a cumulative distribution function of SF. In this way, the predicted input / output power P (t) of each power device is calculated.
- the prediction unit 44 calculates the stored power amount of the power storage device and its standard deviation (step S44).
- the predicted input power of the load is P D (t)
- the predicted output power of the solar cell is P PV (t)
- the predicted output power of the wind turbine generator is P WP (t)
- the predicted input / output power of the power storage device is P B ( Assuming that t) and the amount of stored power C B (t) of the power storage device, these relationships are expressed by Equation 6.
- C B (t) P PV (t) + P WP (t) + dC B (t) / dt Equation 6 Therefore, C B (t) can be predicted from P PV (t), P WP (t), and P D (t). Note that the current stored power amount of the power storage device is used as the integration constant.
- the calculated C B (t) corresponds to the average value of the stored electric energy.
- the predicted input / output power P (t) corresponds to a weighted average of a plurality of Al (1, t).
- a weighted standard deviation ⁇ P (t) can be obtained.
- P (t) and ⁇ P (t) may be a simple average and a simple standard deviation.
- the standard deviation ⁇ C (t) of the stored electric energy can be calculated from ⁇ P (t).
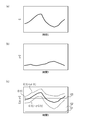
- FIG. 7A is a diagram illustrating an example of the average C (t) of the calculated stored power amount with respect to time t
- FIG. 7B is a standard deviation ⁇ C (t) of the calculated stored power amount with respect to time
- FIG. 7C is a diagram showing an example of C (t) ⁇ ⁇ C (t).
- C (t) changes with time.
- ⁇ C (t) also changes with time.
- FIG. 7C the range of C (t) ⁇ ⁇ C (t) with respect to time is shown.
- the determination unit 46 determines whether or not the future supply-demand balance is stable by using the average C (t) and the standard deviation ⁇ C (t) of the stored electric energy (step S46). In the case of Yes, the determination part 46 determines with being stable (step S50). In the case of No, the determination unit 46 determines that it is unstable (step S48). The control part 18 determines whether it is complete
- FIG. 8 is a flowchart illustrating an example of the operation of the determination unit according to the second embodiment.
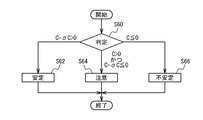
- the determination unit 46 makes a determination based on C (t) and ⁇ C (t) (step S60).
- the determination unit 46 determines that the supply-demand balance is stable when C (t) ⁇ C (t)> 0 (step S62). This corresponds to the case where the straight line C1 is 0 in FIG.
- the determination unit 46 determines that the power supply / demand balance is caution (step S64). This corresponds to the case where the straight line C2 is 0 in FIG.
- the determination unit 46 determines that the supply and demand balance is unstable when C (t) ⁇ 0 (step S66). This corresponds to the case where the straight line C3 is 0 in FIG. Then exit.
- the determination criterion of the determination unit 46 can be arbitrarily set.
- the determination unit 46 can determine the power supply / demand balance stability using C (t) + S ⁇ ⁇ C (t) as a determination criterion.
- S is an arbitrarily set real number.
- FIG. 9A is a diagram showing an example of a screen of a PMS display device
- FIG. 9B is a diagram showing an example of a load outlet.
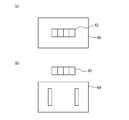
- the display device 60 is provided with a plurality of display areas 62.
- the determination unit 46 determines that the display unit is stable, the display device 60 lights the display area 62 in blue.
- the determination unit 46 determines that it is attention, the display device 60 lights up the display area 62 in yellow.
- the determination unit 46 determines that the display unit is unstable, the display device 60 lights the display area 62 in red.
- the determination by the determination unit 46 may be performed in a plurality of periods, and the stability of each period may be displayed in the plurality of display areas 62.
- the display area 62 may display a color corresponding to the power supply / demand balance for the next 1 hour, 24 hours, 4 days, 7 days. By displaying the instability in color in this way, the power supply / demand balance can be visually recognized.
- the display device 60 may display a time when the power supply / demand balance is predicted to be unstable.
- the display area 62 can be arranged near the outlet 64 to which the load is connected. Further, when a plurality of loads are connected to the node 16, the display area 62 can be arranged for each outlet.
- FIG. 10A to FIG. 10C are diagrams showing the generated voltage, current, and power of the solar cell, respectively.
- 11/1 on the horizontal axis indicates November 1st.
- FIG. 11A to FIG. 11C are diagrams showing the generated voltage, current, and power of the wind turbine generator, respectively.
- the generated voltage, current and power of the solar cell have periodicity.
- the generated voltage, the electric current, and electric power of the solar cell of a wind power generator have little periodicity.
- FIG. 12 (a) and 12 (b) are diagrams showing the output power of the solar cell and the wind power generation, respectively, subjected to Fourier transform and shown with respect to the period.
- Fig.12 (a) in a solar cell, a peak appears when a period is 24 hours. There are times when peaks appear in other periods. In the wind turbine generator, no peak is observed.
- solar cells have periodicity. Although no periodicity was observed in the wind power generator, it is considered that there is a 24-hour period in the coastal region, for example. In addition, the cycle of output power may appear depending on the climate cycle.
- FIG. 13 (a) and 13 (b) are diagrams showing the power of the solar cell and the amount of power fluctuation with respect to time in a certain day, respectively, and FIG. 13 (c) is a diagram for explaining each symbol in FIG. 13 (a). It is. As shown in FIG. 13 (c), the left and right center lines 70 of the rectangle are the median value within one hour, the rectangular upper and lower lines 72 are the quartiles, the small +74 is the maximum value, and the small ⁇ 76 is the minimum value. The large +78 is an outlier.
- 14 (a) and 14 (b) are diagrams showing the average value, standard deviation, skewness and kurtosis of power and power fluctuation amount with respect to time in a certain day, respectively.
- FIG. 15 is a diagram showing the distribution of the calculated similarity factor SF. As shown in FIG. 15, it can be seen that the similarity factor SF is close to a normal distribution.
- the output power prediction in Example 2 can be applied at least for the solar cell. It is considered that there is a periodicity peculiar to the place where the wind turbine generator is installed. It is considered that there is a periodicity peculiar to the place of installation and the user to be used in the input power of the load.
- values related to input / output power are used as summary statistics for input / output power for a certain period.
- the storage capacity of the storage device 34 or 26 can be reduced and the processing load on the processor 32 can be reduced.
- Summary statistics can be the mean and standard deviation.
- the input / output power within the period can be represented more.
- one or more of the other summary statistics may be used to represent input / output power during the period.
- the values related to the input / output power are the summary statistics of the input / output power for each fixed period and the summary statistics of the fluctuation of the input / output power for each fixed period.
- step S40 of FIG. 5 by calculating the similarity including the fluctuation amount, a section with higher similarity can be extracted.
- the similarity can be calculated based on the square error.
- the similarity is used as the similarity factor. Thereby, the precision of similarity can be improved more. Similarity can also be calculated by other methods.
- the prediction unit 44 predicts input / output power after the current time based on the similarity between the power information corresponding to a plurality of similar sections and the immediately preceding power information. Thereby, the accuracy of prediction can be improved.
- the input / output power is predicted as a linear combination of a plurality of pieces of power information. Thereby, the accuracy of prediction can be further increased.
- the storage devices 26 of the power devices 21 to 24 store power information.
- the extraction unit 42 reads power information from the connected power devices. Thereby, even when the power device is connected to a different PMS 10, the power information can be continuously used.
Landscapes
- Engineering & Computer Science (AREA)
- Power Engineering (AREA)
- Physics & Mathematics (AREA)
- General Physics & Mathematics (AREA)
- Supply And Distribution Of Alternating Current (AREA)
- Remote Monitoring And Control Of Power-Distribution Networks (AREA)
Abstract
自然エネルギー発電装置を含む1または複数の電力装置21-25がノード16に入力または出力する入出力電力に関する値を時系列に表した電力情報を一定周期で区切った複数の区間の中から、直前の電力情報に類似する区間を抽出する抽出部と、前記類似する区間における現在の時刻に対応する時刻以降の前記電力情報に基づき、前記現在の時刻以降の前記入出力電力を予測する予測部と、を具備する電力予測装置。
Description
本発明は、電力予測装置、電力予測プログラムおよび電力予測方法に関し、自然エネルギー発電装置の出力電力を予測する電力予測装置に関する。
太陽電池や風力発電等の自然エネルギー発電は、再生可能エネルギーの一つとして注目されている。しかしながら、自然エネルギー発電の発電電力は、自然に大きく影響されるため、その予測が重要である。特許文献1、2には、気候、気温、風速や風向き等の気象予測に基づき、自然エネルギー発電の発電電力を予測する方法が開示されている。
しかしながら、特許文献1、2の方法では、気象予測等の外部から入力される情報に基づき発電電力を予測する。この方法では、外部情報に依存しているため、外部情報が得られない場所や時間においては、発電電力を予測できない。
本発明は、上記課題に鑑みなされたものであり、外部からの情報に依存せず電力予測を行なうことを目的とする。
本発明は、自然エネルギー発電装置を含む1または複数の電力装置がノードに入力または出力する入出力電力に関する値を時系列に表した電力情報を一定周期で区切った複数の区間の中から、直前の電力情報に類似する区間を抽出する抽出部と、前記類似する区間における現在の時刻に対応する時刻以降の前記電力情報に基づき、前記現在の時刻以降の前記入出力電力を予測する予測部と、を具備することを特徴とする電力予測装置である。
上記構成において、前記電力装置は負荷を含み、前記電力予測装置は、前記予測部が予測した前記自然エネルギー発電装置および前記負荷の前記現在の時刻以降の前記入出力電力に基づき、前記現在の時刻以降の電力需給バランスを判定する判定部を具備する構成とすることができる。
上記構成において前記電力装置は蓄電装置を含み、前記予測部は、予測した前記自然エネルギー発電装置および前記負荷の前記現在の時刻以降の前記入出力電力に基づき、前記蓄電装置の蓄積電力量を予測し、前記判定部は、前記現在の時刻以降の蓄積電力量に基づき、前記現在の時刻以降の電力需給バランスを判定する構成とすることができる。
上記構成において、前記入出力電力に関する値は、前記一定周期より短い期間毎の前記入出力電力の要約統計量である構成とすることができる。
上記構成において、前記入出力電力に関する値は、前記期間毎の前記入出力電力の要約統計量、および前記期間毎の前記入出力電力の変動量の要約統計量である構成とすることができる。
上記構成において、前記抽出部は、複数の前記類似する区間を抽出し、前記予測部は、前記複数の類似する区間に対応する複数の前記電力情報と、直前の前記電力情報と、の類似度に基づき、前記現在の時刻以降の前記入出力電力を予測する構成とすることができる。
上記構成において、前記電力装置は、前記電力情報を記憶する記憶装置を備え、前記電力装置が前記ノードに接続されたときに、前記抽出部は、接続された前記電力装置の前記記憶装置から前記電力情報を読み出す構成とすることができる。
上記構成において、前記ノードは外部の電源系統に接続されていない構成とすることができる。
上記構成において、前記自然エネルギー発電装置は太陽光を用いた発電装置であり、前記一定周期は24時間である構成とすることができる。
本発明は、プロセッサまたはコンピュータに、自然エネルギー発電装置を含む1または複数の電力装置がノードに入力または出力する入出力電力に関する値を時系列に表した電力情報を一定周期で区切った複数の区間から、直前の電力情報に類似する区間を抽出するステップと、前記類似する区間における現在の時刻に対応する時刻以降の前記電力情報から前記現在の時刻以降の前記入出力電力を予測するステップと、を実行させることを特徴とする電力予測プログラムである。
本発明は、プロセッサまたはコンピュータが実行する電力予測方法であって、自然エネルギー発電装置を含む1または複数の電力装置がノードに入力または出力する入出力電力に関する値を時系列に表した電力情報を一定周期で区切った複数の区間から、直前の電力情報に類似する区間を抽出するステップと、前記類似する区間における現在の時刻に対応する時刻以降の前記電力情報から前記現在の時刻以降の前記入出力電力を予測するステップと、を含むことを特徴とする電力予測方法である。
本発明によれば、外部からの情報に依存せず電力予測を行なうことができる。
以下、図面を参照し本発明の実施例について説明する。
図1は、実施例1に係る電力予測装置が用いられるシステムを示すブロック図である。図1に示すように、電力システム100は、複数のPMS(パワーマネージメントシステム)10および25がネットワーク状に接続されている。各PMS10および25のノード16は、一定の電圧に設定されている。ノード16の電圧は例えば直流電圧であり48Vである。各PMS10および25のノード16は、ほぼ同じ電圧に設定されている。ノード16は、交流電圧に設定されていてもよい。ノード16が交流電圧の場合、各PMS10および25のノード16の電圧、周波数、位相等をほぼ同じとする。
PMS10には、電力装置21から25が接続されている。電力装置21から25は、それぞれ太陽電池、風力発電装置、負荷、蓄電装置および他のPMSである。負荷は、例えば家電機器、情報機器等の電力を消費する機器である。蓄電装置は、例えば二次電池または電気二重層キャパシタ等の電力を蓄積する機器である。電力装置21から24は、記憶装置26を備えていてもよい。記憶装置26は、例えばハードディスクまたは半導体メモリである。電力装置21から25との間には、電圧を変換するコンバータおよび/または直流-交流コンバータ等が設けられている。PMS10は、計測部11から15、および制御部18を備えている、計測部11から15は、電力装置21から25がノード16に出力または入力される電力を計測する。制御部18は、各計測部11から15、電力装置21から24を制御する。ノード16は、他のPMSを介し、または直接外部の電源系統に接続されていてもよい。また、ノード16は、外部の電源系統に接続されておらず、自立していてもよい。
図2(a)は、実施例1における制御部のブロック図、図2(b)は、電力予測装置の機能ブロック図である。図2(a)に示すように、制御部18は、プロセッサ32、記憶装置34、入力装置36、出力装置38およびバス35を備えている。プロセッサ32は、例えばCPU(Central Processing Unit)である。記憶装置34は、例えばハードディスクまたは半導体メモリである。入力装置36は、例えば計測部11から15等から情報が入力する入力回路である。出力装置38は、例えば表示装置または情報を出力する出力回路等である。バス35は、プロセッサ32、記憶装置34、入力装置36および出力装置38間のデータを伝送する。制御部18は、例えば、コンピュータ、マイクロプロセッサ、または専用回路である。制御部18またはプロセッサ32は、電力予測プログラムおよび電力予測方法を実行する。電力予測プログラムを格納する記憶媒体として可搬型記憶媒体を用いることができる。可搬型記憶媒体としては、例えば、CD-ROM(Compact Disc Read Only Memory)ディスク、DVD(Digital Video Disc)ディスク、ブルーレイディスクまたはUSB(Universal Serial Bus)メモリ等を用いることができる。記憶媒体として、フラッシュメモリまたはHDD等を用いてもよい。
図2(b)に示すように、電力予測装置30は、抽出部42、予測部44および判定部46を備えている。制御部18またはプロセッサ32がソフトウェアと協働して、抽出部42、予測部44および判定部46として機能する。
図3は、実施例1における電力予測装置の動作を示すフローチャートである。図2(b)および図3に示すように、抽出部42は、過去の電力情報および直前の電力情報を取得する(ステップS10)。電力情報は、計測部11から15が計測する入出力電力に関する値の時系列に表した情報である。電力情報は、入出力電力を時系列に表した情報でもよいし、入出力電力を加工した情報でもよい。電力装置21および22(太陽電池および風力発電装置)では、入出力電力は、電力装置21および22からノード16に出力される電力である。電力装置23(負荷)では、入出力電力は、電力装置23にノード16から入力される電力である。電力装置24(蓄電装置)および25(他のPMS)では、入出力電力は、電力装置24および25にノード16から出力または入力される電力である。電力装置24の蓄積電力量は、入出力電力を時間に対し積分することにより算出することができる。また、電力装置24の蓄積電力量は、蓄電装置のSOC(State of Charge)から算出することもできる。入出力電力は、電力装置21から25とノード16との間の入出力電力または入出力電流を測定することにより得られる。また、入出力電力は、電力装置21から25内での電力、電圧もしくは電流等を測定することにより求めてもよい。過去の電力情報および直前の電力情報は、例えば記憶装置34、または電力装置21から24が備える記憶装置26に記憶されている。抽出部42は、過去の電力情報を一定周期で区切った複数の区間から直前の電力情報に類似する区間を抽出する(ステップS12)。ここで、一定周期は、1時間、24時間、4日または7日等の任意の予め設定された周期である。
予測部44は、抽出部42が抽出した区間の電力情報から現在の時刻以降の入出力電力を予測する(ステップS14)。判定部46は、予測部44の予測に基づき現在の時刻以降の電力需給バランスを判定する(ステップS16)。例えば、判定部46は、今後の電力供給が電力需要を下回る場合、警告するように判定する。判定部46は、判定結果を出力する(ステップS18)。判定部46は、例えば判定結果を出力装置38に出力する。例えば、ユーザは、出力装置38の表示により負荷の電力消費を抑制することができる。また、制御部18は、判定結果に基づき、負荷を制御してもよい。
図4(a)および図4(b)は、実施例1における電力予測を説明するための時間に対する電力を示す図である。図4(a)を参照し、電力は、電力装置21から25のいずれかに入出力する電力を示す。時刻t0は現在の時刻である。区間T0からT3は一定周期であり、例えば24時間である。時刻t0を起点に時間を遡り一定区間で区切り、それぞれ区間T0からT3とする。時刻t0が午前11時とすると、区間T0の開始時刻t1は1日前の午前11時である。同様に、区間T1から3の開始時刻t2からt4は、それぞれ2から4日前の午前11時である。
抽出部42は、区間T1からT3から区間T0に類似する区間を抽出する。類似性を判断する区間は、区間T0からT3の一部でもよい。例えば、午前6時から午前11時の期間において区間T0と区間T1からT3との類似性を判断してもよい。区間T0からT3は、予め定めた開始時刻から開始される区間でもよい。例えば、午前0時から翌日の午前0時を予め定めた1区間とし、区間内の午前6時から午前11の類似性から区間を抽出することもできる。
図4(b)を参照し、実線は過去の電力、破線は予測した電力である。例えば、区間T3が類似する区間の場合、予測部44は、時刻t0以降の電力を図4(a)の時刻t3以降の電力から予測する。例えば予測電力を時刻t3以降の電力とする。図4(a)および図4(b)では、1つの区間T3を抽出しているが、類似する区間を複数抽出し、複数の区間から電力を予測してもよい。
実施例1によれば、図1のように、ノード16には、少なくとも自然エネルギー発電装置(太陽電池またはを風力発電装置)を含む電力装置21から24が接続されている。自然エネルギー発電装置としては、太陽電池および風力発電装置以外にも、太陽光発電装置、太陽熱発電装置、潮汐発電装置、波力発電装置、海流発電装置または温度差発電装置を用いることができる。このように、自然エネルギー発電装置は、自然エネルギーを電気エネルギーに変換するものであればよい。自然エネルギー発電装置の出力電力は一定周期で変動する。例えば、太陽光を用いた発電装置の出力電力は、24時間周期となる。その他の発電でも、24時間、24時間より短い、または24時間より長い周期で変動する。
そこで、図4(a)のように、抽出部42は、過去の電力情報を一定周期で区切った複数の区間の中から、直前の電力情報に類似する区間T3を抽出する。図4(b)のように、予測部44は、類似する区間T3における現在の時刻t0に対応する時刻t3以降の電力情報に基づき、現在の時刻t0以降の入出力電力を予測する。これにより、外部情報によらず、入出力情報を予測できる。自然エネルギー発電装置は複数設けられていてもよい。例えば、太陽電池と風力発電装置とでは、区間を区切る一定周期を異ならせてもよい。
さらに、ノード16には、負荷が接続されている。負荷が消費する電力は、人間の活動および/または自然環境に影響される。よって、負荷の入力電力は、24時間およびまたは7日等の一定周期で変動する。例えば、3日夜勤、1日休暇、3日昼勤、2日休暇のサイクルの勤労者の生活パターンは9日周期である。この場合、9日を一定周期とする。このように、判定部46は、予測部44が予測した自然エネルギー発電装置および負荷の現在の時刻以降の入出力電力に基づき、現在の時刻以降の電力需給バランスを判定する。これにより、外部情報に依存せず、電力需給バランスを判定できる。
さらに、ノード16は、蓄電装置に接続されている。予測部44は、予測した自然エネルギー発電装置および負荷の現在の時刻以降の入出力電力に基づき、蓄電装置の蓄積電力量を予測する。判定部46は、現在の時刻以降の蓄積電力量に基づき、現在の時刻以降の電力需給バランスを判定する。このように、蓄電装置の蓄積電力量から今後の電力需給バランスを判定することができる。蓄電装置の蓄積電力量は、例えば、自然エネルギー発電装置の予測出力電力と負荷の予測入力電力の差の積分により算出することができる。また、ノード16と蓄電装置との間の予測入出力電力の積分から蓄積電力量を算出してもよい。
さらに、ノード16は外部の電源系統に接続されていないことがある。例えば、PMS10は、自立したシステムであり、外部から電力が供給されない。このように、オフグリッドのPMS10の場合、自然エネルギー発電装置で負荷が消費する電力をまかなうことになり、電力の需給バランスの予測が十分でないと、必要なときに電力を使用できないということが起こりうる。そこで、電力予測装置を用いることが好ましい。なお、ノード16が外部電力源に接続されていても実施例1を適用することもできる。
実施例2は、実施例1の具体例である。実施例2のシステムのブロック図および電力予測装置の機能ブロック図は、実施例1と同じであり説明を省略する。図5は、実施例2に係る電力予測装置の動作を示すフローチャートである。図5に示すように、各電力装置21から24が記憶装置26を備えている場合、過去の電力情報は記憶装置26に記憶させてもよい。この場合、電力装置21から24がノード16に接続されたときに、制御部18は、記憶装置26から電力情報を取得する(ステップS50)。電力情報を制御部18の記憶装置34が記憶する場合、このステップはなくてもよい。
制御部18は、計測部11から15に各電力装置25とノード16との間の入出力電力を計測させる(ステップS32)。計測のサンプリング時間は例えば10秒である。制御部18は、一定期間経過したか判定する(ステップS34)。一定期間は、区間より短い期間であり、例えば1時間である。ステップS34においてNoの場合、ステップS32に戻る。ステップS34において、Yesの場合、一定期間内の入出力電力の要約統計量を算出する(ステップS36)。入出力電力の変動量の要約統計量を算出してもよい。要約統計量は、平均値および/または標準偏差である。要約統計量としては、例えば平均値、分散、標準偏差、中央値、四分位点、最大値、最小値、尖度(クルトシス)、および歪度(スキューネス)の少なくとも1つを用いることができる。中央値および四分位点は平均値および標準偏差より簡単に算出できるため、要約統計量として、中央値および/または四分位点を用いてもよい。制御部18は、期間の要約統計量を電力情報の一部として記憶装置34または26に記憶させる。
図6は、実施例2における各電力装置の1つの区間内の電力情報を示す図である。図6に示すように、1つの区間内の電力情報には、期間1から期間24までの情報が含まれる。1つの区間は例えば24時間であり、各期間1から24はそれぞれ1時間である。1区間の電力情報は、入出力電力の平均値A(1,1)からA(1,24)、入出力電力の標準偏差A(2,1)からA(2,24)、電力変動量の平均値B(1,1)からB(1,24)、電力変動量の標準偏差B(2,1)からB(2,24)の24行×4列行列である。行は期間1から24に対応し、時系列に配列されている。平均値および標準偏差は、期間内の平均値および標準偏差である。電力変動量は単位時間当たりの電力の変動率である。記憶装置34または26には、過去の複数区間の電力情報が記憶されている。
図5に戻り、抽出部42は、複数の区間の電力情報と直前の区間の電力情報との類似度を算出する。抽出部42は、複数の区間の類似度から類似度の大きい区間を抽出する(ステップS40)。例えば、抽出部42は、類似度の大きい区間をn個抽出する。
類似度の算出方法の例を説明する。ある区間1の電力情報を図6のようにA1(i,t)、B1(i,t)、別の区間2の電力情報をA2(i,t)、B2(i,t)とする。このとき、区間1と区間2との自乗誤差diffを式1とする。
diff=Σit(A1(i,t)-A2(i,t))2+W×Σit(B1(i,t)-B2(i,t))2 式1
式1は式2でも表される。
diff=sum(sum((A1-A2)*(A1-A2))+W*sum(sum((B1-B2)*(B1-B2)) 式2
ここで、Wは、電力変動率の重み係数で、適宜設定できる。電力に比べ、電力変動率は、類似性に影響しにくいと考えられる。そこで、Wを1以下とする。例えばWを0.2とする。
diff=Σit(A1(i,t)-A2(i,t))2+W×Σit(B1(i,t)-B2(i,t))2 式1
式1は式2でも表される。
diff=sum(sum((A1-A2)*(A1-A2))+W*sum(sum((B1-B2)*(B1-B2)) 式2
ここで、Wは、電力変動率の重み係数で、適宜設定できる。電力に比べ、電力変動率は、類似性に影響しにくいと考えられる。そこで、Wを1以下とする。例えばWを0.2とする。
類似性因子SFを式3で表す。
SF=-log(diff) 式3
このように、2つの区間の類似度として類似性因子を算出できる。
SF=-log(diff) 式3
このように、2つの区間の類似度として類似性因子を算出できる。
次に、予測部44は、抽出された区間の入出力電力から現在の時刻からの入出力電力を予測する(ステップS42)。例えば、n個のAk(1,t)から入出力電力P(t)を予測する。tは期間1から24(つまり時間)に対応する。t=1は現在の時刻直後の期間に対応する。例えば現在の時刻が午前11の場合、期間1は午前11から午前12の期間である。
入出力電力P(t)の予測の例を説明する。予測入出力電力P(t)を、Ak(1,t)の線形結合とし、式4とする。
P(t)=Σk(ak×Ak(1、t)) 式4
ここで、kは1からnの整数である。係数akはΣkak=1のように全ての係数akの和は1である。係数akが全て1/nのとき、P(t)は、Ak(1,t)の単純平均となる。係数akが異なるとき加重平均となる。
P(t)=Σk(ak×Ak(1、t)) 式4
ここで、kは1からnの整数である。係数akはΣkak=1のように全ての係数akの和は1である。係数akが全て1/nのとき、P(t)は、Ak(1,t)の単純平均となる。係数akが異なるとき加重平均となる。
例えば、類似性因子SFが正規分布である場合、係数akは以下のように算出できる。類似度がk番目に高い区間の類似性因子SFkとする。類似性因子SFkの全体の中の相対的位置は評価できる。この場合、高いほうからk番目である。類似性因子SFkの相対的位置が高い(類似度が高い)場合係数akを高くすることが好ましい。そこで、例えば係数akを式5とする。
ak=cdf(SFk)/Σkcdf(SFk) 式5
ここで、cdfはSFの累積分布関数である。
このようにして、各電力装置の予測入出力電力P(t)が算出される。
ak=cdf(SFk)/Σkcdf(SFk) 式5
ここで、cdfはSFの累積分布関数である。
このようにして、各電力装置の予測入出力電力P(t)が算出される。
予測部44は、蓄電装置の蓄積電力量とその標準偏差を算出する(ステップS44)。負荷の予測入力電力をPD(t)、太陽電池の予測出力電力をPPV(t)、風力発電装置の予測出力電力をPWP(t)、蓄電装置の予測入出力電力をPB(t)および蓄電装置の蓄電電力量CB(t)とすると、これらの関係は式6で表される。
PD(t)=PPV(t)+PWP(t)+PB(t)
=PPV(t)+PWP(t)+dCB(t)/dt 式6
よって、PPV(t)、PWP(t)およびPD(t)から、CB(t)を予測できる。なお、積分定数として、現在の蓄電装置の蓄積電力量を用いる。
PD(t)=PPV(t)+PWP(t)+PB(t)
=PPV(t)+PWP(t)+dCB(t)/dt 式6
よって、PPV(t)、PWP(t)およびPD(t)から、CB(t)を予測できる。なお、積分定数として、現在の蓄電装置の蓄積電力量を用いる。
算出されるCB(t)は蓄積電力量の平均値に相当する。ここで、予測入出力電力P(t)は複数のAl(1,t)の加重平均に相当する。同様に、加重した標準偏差σP(t)を求めることができる。なお、P(t)およびσP(t)は単純平均および単純な標準偏差でもよい。σP(t)から蓄積電力量の標準偏差σC(t)を算出することができる。
図7(a)は、時間tに対する算出された蓄積電力量の平均C(t)の例を示す図、図7(b)は、時間に対する算出された蓄積電力量の標準偏差σC(t)の例を示す図、図7(c)は、C(t)±σC(t)の例を示す図である。図7(a)に示すように、この例では、時間に対し、C(t)が変化する。図7(b)に示すように、この例では、時間に対し、σC(t)も変化する。図7(c)に示すように、時間に対するC(t)±σC(t)の範囲を示す。
図5に戻り、判定部46は、蓄積電力量の平均C(t)と標準偏差σC(t)を用い、今後の需給バランスが安定か否かを判定する(ステップS46)。Yesの場合、判定部46は、安定と判定する(ステップS50)。Noの場合、判定部46は不安定と判断する(ステップS48)。制御部18は、終了か否かを判定する(ステップS52)。例えば、電力装置をノード16に接続または離脱する場合、制御部18はYesと判定し、電力装置をノード16に接続または離脱した後、ステップS30から開始する。ステップS46において、Yesの場合終了する。Noの場合、ステップS32に戻る。
図8は、実施例2における判定部の動作の例を示すフローチャートである。図8に示すように、判定部46は、C(t)およびσC(t)に基づき判定する(ステップS60)。判定部46は、C(t)-σC(t)>0の場合、需給バランスは安定と判定する(ステップS62)。この場合、図7(c)において、直線C1が0の場合に相当する。判定部46は、C(t)>0かつC(t)-σC(t)≦0の場合、電力需給バランスは注意と判定する(ステップS64)。この場合、図7(c)において、直線C2が0の場合に相当する。判定部46は、C(t)≦0の場合、需給バランスは不安定と判定する(ステップS66)。この場合、図7(c)において、直線C3が0の場合に相当する。その後終了する。なお、判定部46の判定基準は任意に設定できる。例えば判定部46は、C(t)+S×σC(t)を判定基準に電力需給バランス安定性を判定できる。ここで、Sは任意に設定した実数である。
図9(a)は、PMSの表示装置の画面の例を示す図、図9(b)は、負荷のコンセントの例を示す図である。図9(a)に示すように、表示装置60に複数の表示領域62が設けられている。判定部46が安定と判断した場合、表示装置60は、表示領域62に青色を点灯する。判定部46が注意と判定した場合、表示装置60は、表示領域62に黄色を点灯する。判定部46が不安定と判定した場合、表示装置60は、表示領域62に赤色を点灯する。判定部46の判定は、複数の期間において行い、複数の表示領域62にそれぞれの期間の安定性を表示してもよい。例えば、表示領域62は、今後1時間の間、24時間の間、4日の間、7日の間の電力需給バランスに対応した色を表示してもよい。このように色で不安定性を表示することにより、電力需給バランスを視覚的に認識することができる。表示装置60は、電力需給バランスが不安定になると予測される時刻を表示してもよい。
図9(b)に示すように、負荷が接続されるコンセント64の近くに表示領域62を配置することもできる。さらに、複数の負荷がノード16に接続される場合、コンセント毎に表示領域62を配置することもできる。
太陽電池および風力発電装置の出力電力について、測定を行なった。太陽電池および風力発電装置は、宮城県仙台市に設置した。測定は、2013年11月6日から2014年2月8日まで行なった。図10(a)から図10(c)は、太陽電池のそれぞれ発電電圧、電流および電力を示す図である。例えば横軸の11/1は11月1日を示している。図11(a)から図11(c)は、風力発電装置のそれぞれ発電電圧、電流および電力を示す図である。図10(a)から図10(c)に示すように、太陽電池の発電電圧、電流および電力は周期性がある。図11(a)および図11(c)に示すように、風力発電装置の太陽電池の発電電圧、電流および電力は周期性があまりない。
図12(a)および図12(b)は、それぞれ太陽電池および風力発電の出力電力をフーリエ変換し、周期に対し示した図である。図12(a)に示すように、太陽電池では、周期が24時間のときにピークが現れる。その他の周期においてもピークが現れる時間がある。風力発電装置では、ピークは観察されない。
このように、太陽電池には周期性がある。風力発電装置には周期性は認められなかったが、例えば沿岸地域では24時間周期があると考えられる。また、気候周期により出力電力の周期が現れる場合もあると考えられる。
図13(a)および図13(b)は、ある一日における時間に対するそれぞれ太陽電池の電力および電力変動量を示す図、図13(c)は図13(a)の各記号を説明する図である。図13(c)に示すように、長方形の左右の中心線70が1時間の期間内の中央値、長方形の上下線72が四分位点、小さい+74が最大値、小さい-76が最小値、大きい+78は外れ値である。
図14(a)および図14(b)は、ある一日における時間に対するそれぞれ電力および電力変動量の平均値、標準偏差、スキューネスおよびクルトシスを示す図である。
図13(a)および図13(b)と、図14(a)および図14(b)を比較すると、平均値と標準偏差を用い、各期間の電力および電力変動量をほぼ代表できることがわかる。
太陽電池について、午前0時から翌日の午前0時までの24時間を区間として、図6のような区間毎の電力情報を作成した。各区間の間の類似性因子SFを算出した。重み係数Wを0.2とした。算出方法は前述のとおりである。図15は、算出した類似性因子SFの分布を示す図である。図15に示すように、類似性因子SFは正規分布に近いことがわかる。
このように、少なくとも太陽電池については、実施例2における出力電力の予測が適用できることがわかる。風力発電装置においても設置される場所特有な周期性があると考えられる。負荷の入力電力においても設置される場所および使用するユーザ特有の周期性があると考えられる。
実施例2によれば、図6のように、入出力電力に関する値を、一定期間毎の入出力電力の要約統計量とする。このように、要約統計量で期間の入出力電力を代表させることにより、記憶装置34または26の記憶容量の削減、プロセッサ32の処理負担の軽減ができる。要約統計量は平均値と標準偏差とすることができる。これにより、図14(a)および図14(b)のように、より期間内の入出力電力を代表できる。電力装置の種類および/または設置場所により、その他の要約統計量の1つまたは複数で期間内の入出力電力を代表させることもできる。
また、図6のように、入出力電力に関する値を、一定期間毎の入出力電力の要約統計量、および一定期間毎の入出力電力の変動量の要約統計量とする。このように、図5のステップS40において、類似度を変動量も含め算出することで、より類似性の高い区間を抽出できる。
式1から式3のように、類似度は自乗誤差に基づき算出することができる。例えば類似度を類似性因子とする。これにより、類似度の精度をより向上できる。類似度は、その他の方法で算出することもできる。
さらに、予測部44は、複数の類似する区間に対応する電力情報と、直前の電力情報と、の類似度に基づき、現在の時刻以降の入出力電力を予測する。これにより、予測の精度を向上させることができる。式4および式5のように、入出力電力を複数の電力情報の線形結合として予測する。これにより、予測の精度をより高めることができる。
さらに、電力装置21から24の記憶装置26が、電力情報を記憶する。図5のステップS30のように、電力装置21から24がノード16に接続されたときに、抽出部42は、接続された電力装置から電力情報を読み出す。これにより、電力装置を異なるPMS10に接続した場合も電力情報を継続して用いることができる。
以上、発明の好ましい実施例について詳述したが、本発明は係る特定の実施例に限定されるものではなく、特許請求の範囲に記載された本発明の要旨の範囲内において、種々の変形・変更が可能である。
10 PMS
11-15 計測部
16 ノード
18 制御部
21-25 電力装置
26 記憶装置
30 電力予測装置
42 抽出部
44 予測部
46 判定部
11-15 計測部
16 ノード
18 制御部
21-25 電力装置
26 記憶装置
30 電力予測装置
42 抽出部
44 予測部
46 判定部
Claims (11)
- 自然エネルギー発電装置を含む1または複数の電力装置がノードに入力または出力する入出力電力に関する値を時系列に表した電力情報を一定周期で区切った複数の区間の中から、直前の電力情報に類似する区間を抽出する抽出部と、
前記類似する区間における現在の時刻に対応する時刻以降の前記電力情報に基づき、前記現在の時刻以降の前記入出力電力を予測する予測部と、
を具備することを特徴とする電力予測装置。 - 前記電力装置は負荷を含み、
前記電力予測装置は、前記予測部が予測した前記自然エネルギー発電装置および前記負荷の前記現在の時刻以降の前記入出力電力に基づき、前記現在の時刻以降の電力需給バランスを判定する判定部を具備することを特徴とする請求項1記載の電力予測装置。 - 前記電力装置は蓄電装置を含み、
前記予測部は、予測した前記自然エネルギー発電装置および前記負荷の前記現在の時刻以降の前記入出力電力に基づき、前記蓄電装置の蓄積電力量を予測し、
前記判定部は、前記現在の時刻以降の蓄積電力量に基づき、前記現在の時刻以降の電力需給バランスを判定することを特徴とする請求項2記載の電力予測装置。 - 前記入出力電力に関する値は、前記一定周期より短い期間毎の前記入出力電力の要約統計量であることを特徴とする請求項1から3のいずれか一項記載の電力予測装置。
- 前記入出力電力に関する値は、前記期間毎の前記入出力電力の要約統計量、および前記期間毎の前記入出力電力の変動量の要約統計量であることを特徴とする請求項4記載の電力予測装置。
- 前記抽出部は、複数の前記類似する区間を抽出し、
前記予測部は、前記複数の類似する区間に対応する複数の前記電力情報と、直前の前記電力情報と、の類似度に基づき、前記現在の時刻以降の前記入出力電力を予測することを特徴とする請求項1から5のいずれか一項記載の電力予測装置。 - 前記電力装置は、前記電力情報を記憶する記憶装置を備え、
前記電力装置が前記ノードに接続されたときに、前記抽出部は、接続された前記電力装置の前記記憶装置から前記電力情報を読み出すことを特徴とする請求項1から6のいずれか一項記載の電力予測装置。 - 前記ノードは外部の電源系統に接続されていないことを特徴とする請求項1から7のいずれか一項記載の電力予測装置。
- 前記自然エネルギー発電装置は太陽光を用いた発電装置であり、前記一定周期は24時間であることを特徴とする請求項1記載の電力予測装置。
- プロセッサまたはコンピュータに、
自然エネルギー発電装置を含む1または複数の電力装置がノードに入力または出力する入出力電力に関する値を時系列に表した電力情報を一定周期で区切った複数の区間の中から、直前の電力情報に類似する区間を抽出するステップと、
前記類似する区間における現在の時刻に対応する時刻以降の前記電力情報に基づき、前記現在の時刻以降の前記入出力電力を予測するステップと、
を実行させることを特徴とする電力予測プログラム。 - プロセッサまたはコンピュータが実行する電力予測方法であって、
自然エネルギー発電装置を含む1または複数の電力装置がノードに入力または出力する入出力電力に関する値を時系列に表した電力情報を一定周期で区切った複数の区間の中から、直前の電力情報に類似する区間を抽出するステップと、
前記類似する区間における現在の時刻に対応する時刻以降の前記電力情報に基づき、前記現在の時刻以降の前記入出力電力を予測するステップと、
を含むことを特徴とする電力予測方法。
Priority Applications (2)
| Application Number | Priority Date | Filing Date | Title |
|---|---|---|---|
| PCT/JP2014/056508 WO2015136642A1 (ja) | 2014-03-12 | 2014-03-12 | 電力予測装置、電力予測プログラムおよび電力予測方法 |
| JP2016507181A JPWO2015136642A1 (ja) | 2014-03-12 | 2014-03-12 | 電力予測装置、電力予測プログラムおよび電力予測方法 |
Applications Claiming Priority (1)
| Application Number | Priority Date | Filing Date | Title |
|---|---|---|---|
| PCT/JP2014/056508 WO2015136642A1 (ja) | 2014-03-12 | 2014-03-12 | 電力予測装置、電力予測プログラムおよび電力予測方法 |
Publications (1)
| Publication Number | Publication Date |
|---|---|
| WO2015136642A1 true WO2015136642A1 (ja) | 2015-09-17 |
Family
ID=54071120
Family Applications (1)
| Application Number | Title | Priority Date | Filing Date |
|---|---|---|---|
| PCT/JP2014/056508 Ceased WO2015136642A1 (ja) | 2014-03-12 | 2014-03-12 | 電力予測装置、電力予測プログラムおよび電力予測方法 |
Country Status (2)
| Country | Link |
|---|---|
| JP (1) | JPWO2015136642A1 (ja) |
| WO (1) | WO2015136642A1 (ja) |
Cited By (2)
| Publication number | Priority date | Publication date | Assignee | Title |
|---|---|---|---|---|
| WO2020202716A1 (ja) * | 2019-03-29 | 2020-10-08 | パナソニックIpマネジメント株式会社 | 計測システム、計測方法及びプログラム |
| JP2024170379A (ja) * | 2023-05-11 | 2024-12-10 | トタルエナジーズ ワンテク | 断続的な負荷を受ける装置の性能変化予測 |
Citations (6)
| Publication number | Priority date | Publication date | Assignee | Title |
|---|---|---|---|---|
| JP2009217873A (ja) * | 2008-03-07 | 2009-09-24 | Sony Corp | コンテンツ選定装置、コンテンツ再生装置、コンテンツ選定方法、コンテンツ再生方法、コンテンツ選定プログラム、コンテンツ再生プログラム及び連携再生システム |
| JP2012152081A (ja) * | 2011-01-21 | 2012-08-09 | Shimizu Corp | 需要電力制御装置 |
| JP2012157132A (ja) * | 2011-01-25 | 2012-08-16 | Chugoku Electric Power Co Inc:The | 電力供給システムの制御方法、及び電力供給システム |
| JP2013114630A (ja) * | 2011-11-30 | 2013-06-10 | Fujitsu Ltd | 算出装置、算出プログラムおよび算出方法 |
| JP2013143901A (ja) * | 2012-01-12 | 2013-07-22 | Chugoku Electric Power Co Inc:The | 分散電源制御装置、分散電源制御システム及び分散電源制御方法 |
| JP2013143838A (ja) * | 2012-01-11 | 2013-07-22 | Sanyo Electric Co Ltd | 充放電制御装置 |
Family Cites Families (1)
| Publication number | Priority date | Publication date | Assignee | Title |
|---|---|---|---|---|
| JP2003032890A (ja) * | 2001-07-19 | 2003-01-31 | Senaa Kk | 負荷電力制御装置 |
-
2014
- 2014-03-12 JP JP2016507181A patent/JPWO2015136642A1/ja active Pending
- 2014-03-12 WO PCT/JP2014/056508 patent/WO2015136642A1/ja not_active Ceased
Patent Citations (6)
| Publication number | Priority date | Publication date | Assignee | Title |
|---|---|---|---|---|
| JP2009217873A (ja) * | 2008-03-07 | 2009-09-24 | Sony Corp | コンテンツ選定装置、コンテンツ再生装置、コンテンツ選定方法、コンテンツ再生方法、コンテンツ選定プログラム、コンテンツ再生プログラム及び連携再生システム |
| JP2012152081A (ja) * | 2011-01-21 | 2012-08-09 | Shimizu Corp | 需要電力制御装置 |
| JP2012157132A (ja) * | 2011-01-25 | 2012-08-16 | Chugoku Electric Power Co Inc:The | 電力供給システムの制御方法、及び電力供給システム |
| JP2013114630A (ja) * | 2011-11-30 | 2013-06-10 | Fujitsu Ltd | 算出装置、算出プログラムおよび算出方法 |
| JP2013143838A (ja) * | 2012-01-11 | 2013-07-22 | Sanyo Electric Co Ltd | 充放電制御装置 |
| JP2013143901A (ja) * | 2012-01-12 | 2013-07-22 | Chugoku Electric Power Co Inc:The | 分散電源制御装置、分散電源制御システム及び分散電源制御方法 |
Cited By (6)
| Publication number | Priority date | Publication date | Assignee | Title |
|---|---|---|---|---|
| WO2020202716A1 (ja) * | 2019-03-29 | 2020-10-08 | パナソニックIpマネジメント株式会社 | 計測システム、計測方法及びプログラム |
| JP2020165929A (ja) * | 2019-03-29 | 2020-10-08 | パナソニックIpマネジメント株式会社 | 計測システム、計測方法及びプログラム |
| JP7129662B2 (ja) | 2019-03-29 | 2022-09-02 | パナソニックIpマネジメント株式会社 | 計測システム、計測方法、プログラム及び連携システム |
| JP2024170379A (ja) * | 2023-05-11 | 2024-12-10 | トタルエナジーズ ワンテク | 断続的な負荷を受ける装置の性能変化予測 |
| KR102928863B1 (ko) * | 2023-05-11 | 2026-02-20 | 토탈에너지스 원테크 | 간헐적 부하를 받는 장치를 위한 성능 변화 예측 |
| JP7902218B2 (ja) | 2023-05-11 | 2026-08-07 | トタルエナジーズ ワンテク | 断続的な負荷を受ける装置の性能変化予測 |
Also Published As
| Publication number | Publication date |
|---|---|
| JPWO2015136642A1 (ja) | 2017-04-06 |
Similar Documents
| Publication | Publication Date | Title |
|---|---|---|
| Constantinescu et al. | A computational framework for uncertainty quantification and stochastic optimization in unit commitment with wind power generation | |
| JP7664708B2 (ja) | 太陽光発電出力予測装置、電力系統制御システム、需給制御システム、日射強度予測装置、学習装置、太陽光発電出力予測方法および太陽光発電出力予測プログラム | |
| US20140358307A1 (en) | Operation plan creating method, computer product, and operation plan creating apparatus | |
| CN106796577A (zh) | 使用回归模型的能量基础设施传感器数据校正 | |
| JP6582758B2 (ja) | 発電計画作成装置、発電計画作成プログラム及び発電計画作成方法 | |
| US20160043548A1 (en) | Rolling stochastic optimization based operation of distributed energy systems with energy storage systems and renewable energy resources | |
| JP5989754B2 (ja) | 予測装置 | |
| US11329602B2 (en) | Device and method for simulating power consumption by power load | |
| Katara et al. | A time series analysis of electricity demand in Tamale, Ghana | |
| CN113689057A (zh) | 一种光伏发电功率的预测方法及装置 | |
| JP2017169289A (ja) | 電力予測システム、電力予測方法及びプログラム | |
| JP2018185609A (ja) | 運転計画算出装置、運転計画算出方法およびコンピュータプログラム | |
| Montano-Martinez et al. | Detailed primary and secondary distribution system feeder modeling based on AMI data | |
| Koh et al. | Reliability evaluation of electric power systems with solar photovoltaic & energy storage | |
| Hartmann et al. | Forecasting of wind farm power output based on dynamic loading of power transformer at the substation | |
| CN117650516A (zh) | 一种考虑高温天气的高比例新能源电网运行风险评估方法 | |
| Padhee et al. | Analyzing effects of seasonal variations in wind generation and load on voltage profiles | |
| JP2014085914A (ja) | 予測装置、予測方法、および、予測プログラム | |
| JPWO2015136642A1 (ja) | 電力予測装置、電力予測プログラムおよび電力予測方法 | |
| JP2015042052A (ja) | 電力需給量予測装置、予測システムおよび予測方法 | |
| JP2017016206A (ja) | エネルギー消費量用途分解装置及び省エネルギー支援装置 | |
| JP2019201505A (ja) | 電力系統監視システム、電力系統監視方法、およびプログラム | |
| WO2023281565A1 (ja) | 設備構築計画・運用支援システム、及び設備構築計画・運用支援方法 | |
| JP6818658B2 (ja) | 電力系統監視システム、電力系統監視方法、及びプログラム | |
| JP7767938B2 (ja) | 情報処理装置、情報処理方法及び情報処理プログラム |
Legal Events
| Date | Code | Title | Description |
|---|---|---|---|
| 121 | Ep: the epo has been informed by wipo that ep was designated in this application |
Ref document number: 14885663 Country of ref document: EP Kind code of ref document: A1 |
|
| ENP | Entry into the national phase |
Ref document number: 2016507181 Country of ref document: JP Kind code of ref document: A |
|
| NENP | Non-entry into the national phase |
Ref country code: DE |
|
| 122 | Ep: pct application non-entry in european phase |
Ref document number: 14885663 Country of ref document: EP Kind code of ref document: A1 |