WO2015099116A1 - 粒子計数方法および粒子計数装置 - Google Patents
粒子計数方法および粒子計数装置 Download PDFInfo
- Publication number
- WO2015099116A1 WO2015099116A1 PCT/JP2014/084488 JP2014084488W WO2015099116A1 WO 2015099116 A1 WO2015099116 A1 WO 2015099116A1 JP 2014084488 W JP2014084488 W JP 2014084488W WO 2015099116 A1 WO2015099116 A1 WO 2015099116A1
- Authority
- WO
- WIPO (PCT)
- Prior art keywords
- pulse waveform
- particle
- counting
- pulse
- waveform
- Prior art date
- Legal status (The legal status is an assumption and is not a legal conclusion. Google has not performed a legal analysis and makes no representation as to the accuracy of the status listed.)
- Ceased
Links
Images






Classifications
-
- G—PHYSICS
- G01—MEASURING; TESTING
- G01N—INVESTIGATING OR ANALYSING MATERIALS BY DETERMINING THEIR CHEMICAL OR PHYSICAL PROPERTIES
- G01N15/00—Investigating characteristics of particles; Investigating permeability, pore-volume or surface-area of porous materials
- G01N15/02—Investigating particle size or size distribution
- G01N15/0266—Investigating particle size or size distribution with electrical classification
-
- G—PHYSICS
- G01—MEASURING; TESTING
- G01N—INVESTIGATING OR ANALYSING MATERIALS BY DETERMINING THEIR CHEMICAL OR PHYSICAL PROPERTIES
- G01N15/00—Investigating characteristics of particles; Investigating permeability, pore-volume or surface-area of porous materials
- G01N15/10—Investigating individual particles
- G01N15/1031—Investigating individual particles by measuring electrical or magnetic effects
- G01N15/12—Investigating individual particles by measuring electrical or magnetic effects by observing changes in resistance or impedance across apertures when traversed by individual particles, e.g. by using the Coulter principle
-
- G—PHYSICS
- G01—MEASURING; TESTING
- G01N—INVESTIGATING OR ANALYSING MATERIALS BY DETERMINING THEIR CHEMICAL OR PHYSICAL PROPERTIES
- G01N15/00—Investigating characteristics of particles; Investigating permeability, pore-volume or surface-area of porous materials
- G01N15/01—Investigating characteristics of particles; Investigating permeability, pore-volume or surface-area of porous materials specially adapted for biological cells, e.g. blood cells
- G01N2015/012—Red blood cells
-
- G—PHYSICS
- G01—MEASURING; TESTING
- G01N—INVESTIGATING OR ANALYSING MATERIALS BY DETERMINING THEIR CHEMICAL OR PHYSICAL PROPERTIES
- G01N15/00—Investigating characteristics of particles; Investigating permeability, pore-volume or surface-area of porous materials
- G01N15/01—Investigating characteristics of particles; Investigating permeability, pore-volume or surface-area of porous materials specially adapted for biological cells, e.g. blood cells
- G01N2015/016—White blood cells
-
- G—PHYSICS
- G01—MEASURING; TESTING
- G01N—INVESTIGATING OR ANALYSING MATERIALS BY DETERMINING THEIR CHEMICAL OR PHYSICAL PROPERTIES
- G01N15/00—Investigating characteristics of particles; Investigating permeability, pore-volume or surface-area of porous materials
- G01N15/01—Investigating characteristics of particles; Investigating permeability, pore-volume or surface-area of porous materials specially adapted for biological cells, e.g. blood cells
- G01N2015/018—Platelets
-
- G—PHYSICS
- G01—MEASURING; TESTING
- G01N—INVESTIGATING OR ANALYSING MATERIALS BY DETERMINING THEIR CHEMICAL OR PHYSICAL PROPERTIES
- G01N15/00—Investigating characteristics of particles; Investigating permeability, pore-volume or surface-area of porous materials
- G01N15/10—Investigating individual particles
- G01N2015/1006—Investigating individual particles for cytology
-
- G—PHYSICS
- G01—MEASURING; TESTING
- G01N—INVESTIGATING OR ANALYSING MATERIALS BY DETERMINING THEIR CHEMICAL OR PHYSICAL PROPERTIES
- G01N15/00—Investigating characteristics of particles; Investigating permeability, pore-volume or surface-area of porous materials
- G01N15/10—Investigating individual particles
- G01N15/1031—Investigating individual particles by measuring electrical or magnetic effects
- G01N15/12—Investigating individual particles by measuring electrical or magnetic effects by observing changes in resistance or impedance across apertures when traversed by individual particles, e.g. by using the Coulter principle
- G01N2015/135—Electrodes
- G01N2015/136—Scanning electrodes
Definitions
- the present invention relates to a method for counting particles such as blood cells based on an electric resistance method or an optical method and a counting device therefor, and in particular, an individual obtained based on the electric resistance method or an optical method. It is related with the technique which determines whether the pulse waveform of particle
- a particle counting device for counting particles (for example, blood cells such as red blood cells, white blood cells, and platelets) in a sample liquid
- particles for example, blood cells such as red blood cells, white blood cells, and platelets
- an electric resistance method also called an impedance method
- a device configured to measure a voltage between the electrodes and obtain a pulsed electric signal (usually a pulse voltage) corresponding to the size of each particle is known.
- a pulsed electric signal usually a pulse voltage
- a sample liquid for example, a predetermined sample blood dispersed in a diluent
- An aperture (small hole) 200 in which the cross-sectional area of the flow path becomes small like an orifice is provided, and electrodes 300 and 310 are provided on the upstream side and the downstream side of the aperture 200, respectively, so that particles passing through the aperture 200 (blood cells) ) Is measured based on a change in electrical characteristics between the electrodes.
- the electrical resistance or impedance between the electrodes changes in a pulse shape. Therefore, when a voltage is applied from the constant current power source 400 to the pair of electrodes 300 and 310, the voltage also changes in accordance with the impedance change as described above, as shown in FIG. As an electrical signal).
- the number of particles can be known by counting the number of pulse-like electric signals by, for example, the arithmetic unit 500 connected to a constant current power source.
- the peak height (usually, the maximum voltage value of the pulse voltage) Vp of the pulse waveform of the pulsed electric signal when the particle passes through the aperture is proportional to the size of the particle.
- the size of the particle volume can be determined.
- the width W of the pulse waveform increases in proportion to the size of the particle, so that the size of the particle volume can be determined to some extent also by the width of the pulse waveform. Therefore, when counting particles by the electric resistance method, not only knowing the number of particles, but also how many blood cells are present in the sample solution based on the obtained pulse waveform.
- the volume frequency distribution for can also be obtained.
- an average red blood cell volume (Mean Corpuscular Volume) is used as one of indices for pathological diagnosis such as anemia.
- the average red blood cell volume is an average value of the red blood cell volume obtained by creating a frequency distribution from the height information (volume information) of the pulse waveform of each red blood cell measured by the electric resistance method.
- Patent Documents 1 to 3 describe in detail the configuration of the apparatus such as a flow path, aperture, and electrode arrangement for counting blood cells based on the electrical resistance method.
- the flow path on the downstream side of the aperture is branched into two by an original configuration, and in the device of Patent Document 3, a pair of electrodes is provided on the downstream side of the aperture by the unique configuration.
- the basic principle of the electrical resistance method for determining the size of blood cells is the same as described above.
- FIG. 12 a particle counter based on an optical technique is also known.
- a photoelectric sensor in the example shown, a light projecting element E1
- a pair of light receiving elements E2 When each particle X10 in the sample solution flowing through the pipe 201 crosses the light L1, the amount of received light changes (decrease from 100% received amount to cut off to return to 100% received amount).
- a pulsed electric signal corresponding to the size of each particle is obtained.
- Vp is the height of the pulse.
- the time required for the particle to cross the light L1 becomes long, so that the width W of the obtained signal pulse becomes large. Therefore, in the case of such an optical method, as in the electrical resistance method described above, based on the obtained pulse waveform, how many blood cells are present in the sample solution at what frequency. The volume frequency distribution for can be obtained.
- the pulse waveform schematically shown as the pulse voltage in FIG. 11B is a waveform in an ideal passing state in which one particle passes through the center of the aperture linearly at a constant speed (hereinafter referred to as “normal waveform”). ").
- normal waveform a waveform in which one particle passes through the center of the aperture linearly at a constant speed
- FIG. 13 (b) shows various passing states and disturbances in which a plurality of blood cells pass through the aperture while being close to each other, and the pulse voltage waveform in such a case is greatly increased from the normal waveform.
- a deformed waveform hereinafter referred to as “illegal waveform” is obtained.
- the electric field formed between the electrodes is locally strong near the edges around the opening at the entrance and exit of the aperture. Since it is distributed, the detection sensitivity is higher than the central portion. Therefore, as shown in the passage state shown in the left diagram of FIG. 13A, when a blood cell travels along a path deviating from the center and approaching the edge around the opening, the graph in the right graph of FIG. Thus, the voltage waveform tends to be an incorrect waveform having two protruding peaks.
- the phenomenon that the above-mentioned incorrect waveform is generated occurs not only in the electric resistance method but also in the optical method shown in FIG.
- two pulse waveforms overlap like one waveform, and have two peaks as in FIG. Waveform and a wide waveform with a bump on the slope, it is counted as one blood cell that is larger than the true size of each blood cell has passed.
- the volume-frequency distribution graph that includes the incorrect waveform in the count is a distribution graph in which the frequency is added on the larger volume side compared to the graph when only the normal waveform is counted, which hinders correct diagnosis.
- Such a problem exists not only in blood cells but also in general particle counting using an electrical resistance method or an optical method.
- An object of the present invention is to provide a new method for eliminating an irregular waveform from a pulse waveform obtained by an electrical resistance method or an optical technique, and adopting only a pulse waveform that is a normal waveform for counting, and the method It is an object of the present invention to provide a particle counter configured to be able to implement the following.
- the pulse waveform to be determined is associated with a Gaussian curve defined by a Gaussian function V (t) of the following equation (I) that approximates the pulse waveform;
- V (t) Vp * exp ( ⁇ t 2 / (2 * c 2 ))
- Formula (I) (In the above formula (I), t is a time variable, Vp is the maximum value of the pulse waveform to be determined, and c 2 is determined to have a width equal to the pulse width W of the pulse waveform associated with the Gaussian curve.
- the method further includes a second determination step, and the second determination step is positioned before or after or in parallel with the first determination step.
- the second determination step calculates a difference between the time Tm at the center of the width W of the pulse waveform to be determined and the time Tp at the maximum value Vp of the pulse waveform, and the difference is a predetermined threshold value.
- a step of determining that the pulse waveform can be used for counting For the same pulse waveform, the first determination step and the second determination step are both configured to employ the pulse waveform for counting only when it is determined that both can be employed for counting.
- the particle counting method according to [1] above. [3]
- the method further includes a first preliminary selection step of pre-selecting the pulse waveform with respect to the pulse width W,
- the first preliminary selection step is a step for excluding a pulse waveform having a pulse width W outside a predetermined allowable range, which is located before all the determination steps.
- the particle counting method as described.
- the method further includes a second pre-selection step of pre-selecting the pulse waveform with respect to the maximum value Vp,
- the second preliminary selection step is positioned before all the determination steps and is positioned after the first preliminary selection step, and a pulse waveform having a maximum value Vp equal to or higher than a predetermined lower limit value is described above.
- a step to send to the decision step A pulse waveform having a maximum value Vp less than the lower limit value is adopted for counting.
- the particle counting method according to [3] above.
- a particle counter configured to obtain a pulse waveform corresponding to each particle in the sample liquid according to the particle counting method of (A) or (B) below and to count the particles based on the pulse waveform.
- the particle counter has a calculation unit for counting particles,
- the calculation unit has at least a first determination unit that determines whether or not the pulse waveform of each particle can be used for counting,
- the calculation unit further includes a second determination unit, The second determination unit is positioned before or after the first determination unit or in parallel, If the difference between the center time Tm of the width W of the pulse waveform to be determined and the time Tp at the maximum value Vp of the pulse waveform is calculated and the difference is within a predetermined threshold range, It is configured to determine that the pulse waveform can be used for counting, The calculation unit is configured to adopt the pulse waveform for counting only when the first determination unit and the second determination unit determine that both can be used for counting with respect to the same pulse waveform. Being The particle counter according to [5] above.
- the calculation unit further includes a first preliminary selection unit that pre-selects the pulse waveform with respect to the pulse width W,
- the first preliminary selection unit is positioned so as to perform data processing before all the determination units, and is configured to exclude a pulse waveform having a pulse width W outside a predetermined allowable range.
- the particle counter according to [5] or [6] above.
- the calculation unit further includes a second preliminary selection unit that pre-selects the pulse waveform with respect to the maximum value Vp,
- the second preliminary sorting unit is positioned so as to perform the sorting process before all the determination units, and is positioned so as to sort the pulse waveforms that are not excluded by the first preliminary sorting unit,
- a pulse waveform having a maximum value Vp equal to or greater than a predetermined lower limit value is configured to be sent to the determination unit.
- the calculation unit is configured to employ a pulse waveform having a maximum value Vp less than the lower limit value for counting, The particle counter according to [7] above.
- an upper limit and a lower limit are set as threshold values for determination in the dispersion value that determines the width of the Gaussian curve, and the dispersion value of the Gaussian curve associated with the pulse waveform of each particle. Is within the range of the upper and lower thresholds.
- the upper and lower thresholds are fixedly set for the pulse waveform height (pulse height) and the pulse waveform width (pulse width), respectively, and the fixed upper and lower limits are fixed. Whether the pulse waveform is good or bad is determined only by whether or not it is within the threshold range.
- a method of discriminating an incorrect waveform by checking the symmetry of a voltage waveform, or (ii) a voltage value at an intermediate point in time (t1, t2) at half the maximum peak value of one waveform has also been proposed.
- the pulse waveform obtained for each particle is converted into a Gaussian curve based on the pulse height and pulse width, and the upper and lower thresholds of each pulse width are set to each waveform. It fluctuates according to the pulse height. That is, in the present invention, the threshold value for waveform determination is not a fixed value.
- the manner in which the upper and lower thresholds of the pulse width of the Gaussian curve change according to the change in the pulse height of the Gaussian curve is as shown in the graph of FIG.
- the present invention replaces the determination of the pulse waveform with the determination of a Gaussian curve, and uses the high processing capability of a digital arithmetic device such as a computer or an FPGA (Field Programmable Gate Array), so that the pulse height and pulse width input as the determination conditions are used. It is determined whether it falls within the range of the two-dimensional threshold (that is, the upper and lower thresholds of the pulse width that varies according to the change in the pulse height). Therefore, the determination method of the present invention is a determination method based on a new technical idea that has not existed in the past, and eliminates incorrect waveforms without reducing the processing speed while suppressing erroneous determination. Is possible. The present invention is also a method that can eliminate the drawbacks of the conventional methods (i) and (ii).
- FIG. 1 is a graph illustrating the principle of determination in the first determination step (or the first determination unit in the apparatus of the present invention) in the method of the present invention.
- FIG. 1A shows a Gaussian curve (thick solid line) associated with a pulse waveform (pulse voltage) to be determined, a Gaussian curve having an upper limit dispersion value (dashed line), and a lower limit dispersion value. It is the graph which superimposed the Gaussian curve (dashed line).
- the horizontal axis represents time t, and the vertical axis represents a voltage value as an example.
- FIG. 1B is a graph showing how the threshold value of the width W of the Gaussian curve changes in correspondence with the height Vp of the Gaussian curve associated with the maximum value of the pulse waveform.
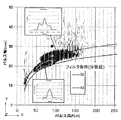
- FIG. 2 is a graph in which the pulse waveform of each particle actually measured according to the first determination step in the method of the present invention (or the first determination unit in the apparatus of the present invention) is associated with a Gaussian curve and plotted. It is. In the graph, the vertical axis represents the pulse width, and the horizontal axis represents the pulse height.
- FIG. 3 is a graph illustrating the principle of determination in the second determination step (or the second determination unit in the apparatus of the present invention) in the method of the present invention.
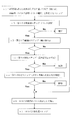
- FIG. 4 is a flowchart showing a preferred example of the method of the present invention, and shows an example of the flow from step s1 for acquiring the pulse waveform to step s7 for performing the counting process.
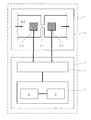
- FIG. 5 is a block diagram schematically showing an example of the configuration of the apparatus of the present invention.
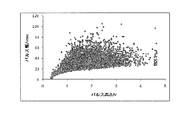
- FIG. 6 is a scattergram showing the relationship between the maximum value (maximum voltage value) Vp and the pulse width W of the pulse waveform (pulse voltage) of each particle actually measured in the example of the present invention. .
- FIG. 7 shows the relationship between the maximum value (maximum voltage value) Vp and the pulse width W of the pulse waveform (pulse voltage) determined to be employable for counting in the second determination step in the embodiment of the present invention.
- FIG. 8 shows the maximum value (maximum voltage value) Vp of the pulse waveform (pulse voltage) determined to be employable for counting in both the first determination step and the second determination step in the embodiment of the present invention.
- 6 is a scattergram showing a relationship with a pulse width W.
- FIG. 9 shows an example of a data set of a pulse waveform (pulse voltage) as it is measured and a data set of a pulse waveform (pulse voltage) determined to be employable for counting in the embodiment of the present invention.
- FIG. 10 is a graph showing the determination performance in the method of the present invention.
- FIG. 11 is a diagram for explaining the basic principle and apparatus configuration of the electrical resistance method.
- FIG. 11A shows an arrangement example of apertures and electrodes
- FIG. 11B schematically shows voltage fluctuations between electrodes that appear when blood cells as particles pass through the apertures.
- FIG. 12 is a diagram for explaining the basic principle of the particle coefficient and the device configuration based on the optical method.
- FIG. 12A shows an arrangement example of the flow path and the photoelectric sensor
- FIG. 12B shows a pulse-like signal (in the example shown in the figure) obtained when blood cells as particles cross the optical axis of the sensor. (Pulse voltage) is schematically shown.
- FIG. 13 is a diagram illustrating an illegal waveform appearing in voltage measurement by the electric resistance method and its cause.
- the particle counting method of the present invention is a method of obtaining a pulse waveform corresponding to each particle in a sample solution according to an electric resistance method or an optical technique, and counting particles based on the waveform.
- the electrical resistance method is taken as an example of the measurement method for obtaining the pulse waveform, and the case where the pulse waveform is obtained as the pulse voltage is taken as an example, but the measurement method for obtaining the pulse waveform is appropriately replaced with an optical method.
- the obtained pulse voltage may be any signal that changes in a pulse shape.
- various processing such as pulse waveform determination, preliminary selection, and subsequent counting are automatically performed by an arithmetic unit described later.
- the pulse waveform to be determined is associated with a Gaussian curve defined by a Gaussian function V (t) of the following equation (I) that approximates the pulse waveform.
- V (t) Vp * exp ( ⁇ t 2 / (2 * c 2 ))
- Formula (I) the maximum value (maximum voltage value) of t is the time variable, Vp is to be determined pulse waveform (pulse voltage), c 2 is a variance value, a base of the Gaussian curve of the spread This parameter determines the degree.
- the c 2 is determined so that the Gaussian curve of the above formula (I) has a width corresponding to the pulse width W of the pulse waveform of the original signal.
- “*” means an operator that means multiplication
- “/” means an operator that means division
- “exp ()” means an exponential function e () in the base e of natural logarithm. Operator.
- a Gaussian curve (thick solid line graph) to be determined is a Gaussian curve having an upper limit variance (dashed line) and a Gaussian curve having a lower limit variance (dashed line). Between the two, it is determined that the original pulse waveform corresponding to the Gaussian curve can be used for counting.
- the threshold voltage Vs for the pulse waveform and the Gaussian curve of each particle it is preferable to set the threshold voltage Vs for the pulse waveform and the Gaussian curve of each particle and handle only the portion above the threshold voltage Vs. Then, by defining the width of each of the pulse waveform and the Gaussian curve associated therewith as the width W at the threshold voltage Vs as shown in the graph of FIG. 1A, the width value becomes clear. More accurate calculation processing can be performed. In the following description, the width of each of the pulse waveform and the Gaussian curve is the width W at the threshold voltage Vs.
- the Gaussian curve defined by the above formula (I) has the same height Vp as the maximum value (maximum voltage value) Vp of the pulse waveform corresponding to the particle to be determined.
- the maximum value Vp of the pulse waveform is a maximum value of the entire pulse including a voltage value of an irregular protrusion due to a disturbance or the like.
- the height Vp of the Gaussian curve is the height of the central peak.
- the Gaussian curve defined by the above formula (I) has a width (for example, the same width) W corresponding to the pulse width W of the pulse voltage of the particle to be determined.
- a Gaussian function with x as a variable is generally expressed as in the following equation (a).
- f (x) a * exp ( ⁇ (x ⁇ b) 2 / (2 * c 2 ))
- Formula (a) In the above equation (a), a is a coefficient that determines the height of the waveform, and b is the peak position (time).
- the waveform of the pulse voltage that appears when the particle passes through the aperture in the optical method, the waveform of the pulsed signal obtained when the particle crosses the optical axis
- c 2 W 2 / ( ⁇ 8 * ln (Vs / Vp))
- Formula (d) “ln ()” is an operator that means a natural logarithm.
- the variance value c 2 of the Gaussian function associated with the pulse waveform of each particle is the maximum value of the pulse waveform (maximum voltage value of the pulse voltage) Vp, pulse width W, threshold voltage. Determined by Vs.
- the total range that the dispersion value c 2 can take with respect to each height Vp (the range including the irregular waveform) will correspond to the type of particles and the flow rate of the sample liquid.
- the dispersion value c 2 is about 20 to 60.
- the dispersion value c from the above equation (d) depends on the average diameter of the target particles, the voltage between electrodes by the electric resistance method, the beam diameter by the optical method, the respective flow velocity, etc.
- the upper and lower thresholds of 2 may be determined based on actual measurement values using beads having a single particle size. As an example, in the red blood cell count, the range from the upper limit threshold value to the lower limit threshold value to be set as the variance value c 2 is about 30-50.
- FIG. 1B is a graph showing the principle of determination in the first determination step more easily. Gauss to be determined within an area between an upper limit curve (indicated by a one-dot chain line) indicating a change in the upper threshold value of the dispersion value and a lower limit curve (indicated by a broken line) indicating a change in the lower threshold value of the dispersion value If the variance value c 2 of the curve is included, it can be determined that the pulse waveform can be used for counting.
- FIG. 2 is a graph in which the pulse waveform of each particle actually measured is associated with a Gaussian curve and the (dispersion value, height) of each Gaussian curve is plotted. In the graph of FIG.
- the pulse width is determined by the time that the particle passes through the aperture at a constant flow rate, but the aperture thickness (electric field strength) is more dominant than the particle size. It is.
- the particles to be determined by the present invention are not particularly limited, but the present invention is useful for counting blood cells such as red blood cells, white blood cells, and platelets (blood cell counting).
- blood cells such as red blood cells, white blood cells, and platelets (blood cell counting).
- erythrocytes have a higher concentration than other blood cells, and double passage tends to occur during counting. Therefore, the usefulness of the present invention becomes more remarkable in counting red blood cells.
- erythrocytes are important particles to be judged for the present invention because the mean red blood cell volume (MCV) is clinically important.
- MCV mean red blood cell volume
- the aperture shape of the aperture for carrying out the electrical resistance method and the cross-sectional shape of the flow path for carrying out the optical method are not particularly limited, but a circular shape is usually preferred.
- the diameter may vary depending on the particles to be counted, but may be appropriately selected from the range of about 0.01 mm to 1 mm for erythrocytes.
- the maximum value (maximum voltage value) Vp of the pulse waveform is the volume of the particle to be measured, the cross-sectional area of the aperture corresponding thereto, the voltage applied between the electrodes, the passage of the particle It depends on the route.
- the maximum voltage value Vp of the waveform of the pulse voltage of red blood cells is about 0.1 to 10 V including an incorrect waveform.
- the threshold voltage Vs may be appropriately determined according to the maximum value (maximum voltage value) Vp of the pulse waveform so that only noise around the voltage 0V can be effectively eliminated.
- the threshold voltage Vs is about 0.1 to 1V. is there.
- the pulse width W of red blood cells determined by the threshold voltage Vs varies greatly depending on the flow velocity, but is, for example, about 5 to 30 ⁇ sec including an irregular waveform. In this case, for example, by setting the upper limit threshold value of the variance value c 2 to 40 and setting the lower limit threshold value of the variance value to 30, two curves shown in FIG. 1B are obtained.
- a second determination step described below may be provided.
- the second determination step may be before or after the first determination step, or may be located in parallel.
- the time Tm at the center of the width W of the pulse waveform to be determined (the position of the center line indicated by the alternate long and short dash line) Tm and the maximum value Vp of the pulse waveform
- the difference ⁇ T with respect to the time Tp (that is, the position shift at the maximum value from the center position of the width) is calculated. If the difference ⁇ T is within a predetermined threshold range, it is determined that the pulse waveform of the particle can be used for counting.
- the difference ⁇ T is a relative value with respect to one pulse width, and may be a value having a positive or negative sign, and a threshold range and a calculation method may be determined according to them.
- the threshold range of ⁇ T is about ⁇ 50% of each pulse width.
- both the determination result in the first determination step and the determination result in the second determination step can be used for counting with respect to the same one particle pulse waveform Only the pulse waveform of that particle is adopted for counting.
- the second determination step s4 is positioned before the first determination step s5, and only the waveform determined by the second determination step s4 as being employable for counting is used. The determination is made in the first determination step s5.
- the selection and determination processing of a set (data set) of pulse waveform data (pulse voltage data and the like) obtained by measurement is performed in series, but in the data set A procedure may be used in which an identification number is provided for each data, processing is performed separately in parallel, and comprehensive determination is finally performed on each data.
- first and second preliminary selection steps described below are further provided prior to all determination steps (first and second determination steps).
- the pulse waveform obtained by the measurement may include an incorrect waveform that does not need to be determined and has a clearly unspecified height or width. It is preferable to preliminarily filter out such an incorrect waveform in the first and second preliminary selection steps so as not to perform useless determination processing or erroneous determination processing. Only one of the first and second preliminary sorting steps may be provided.
- the first preliminary selection step s2 is located before the first and second determination steps, and has a pulse waveform having a pulse width outside a predetermined allowable range. This is a step to eliminate this with a simple filter.
- the allowable range related to the pulse width set in the first preliminary sorting step may be set to an appropriate value according to each blood cell counter with reference to a conventionally known blood cell counting method.
- the pulse waveform data whose pulse width was within the allowable range in the first preliminary sorting step s2 is sent to the second preliminary sorting step s3.
- the second preliminary sorting step is also located before the first and second determination steps.
- the second preliminary sorting step s3 is provided after the first preliminary sorting step s2.
- a lower limit value for the maximum value of the pulse waveform is set, and a pulse waveform having a maximum value Vp equal to or greater than this lower limit value is simply sent to the first and second determination steps. It is done.
- a pulse waveform having a maximum value Vp less than this lower limit value is used for counting rather than being excluded (in the flow chart example of FIG. Is sent to step s6).
- the reason is that, for example, even particles having a small pulse waveform less than the lower limit, such as crushed erythrocytes present in a sample of a patient who has been burned, may be counted.
- a small pulse waveform less than the lower limit value has a shape that differs greatly from a Gaussian curve, such as a trapezoidal shape that is wide with respect to the height, and may be excluded in the first determination step. Such an incorrect waveform to be counted is preferably used for counting according to the result of the preliminary selection step.
- FIG. 5 is a diagram schematically illustrating an example of the configuration of the apparatus.
- the device configuration for carrying out the electric resistance method is shown, but it may be replaced with an optical method.
- the apparatus 1 is configured to perform the particle counting method according to the present invention, and generally includes a measurement structure unit 2 and a control unit 3.
- the measurement structure unit 2 includes a flow path 20 for flowing a sample solution, an aperture 21 provided in the flow path, and a pair of electrodes 22 and 23 disposed on both sides (upstream side and downstream side) of the aperture. It is comprised so that the pulse voltage (pulse waveform) of particle
- the measurement structure unit 2 such as a tank, a pump, and a detailed form of the flow path and ancillary devices, the related art may be referred to.
- the control unit 3 is a control device for causing the measurement structure unit 2 to perform the electrical resistance method (or measurement by an optical technique), and controls the flow of the sample solution and controls the voltage application to the electrode pair. (In the case of an optical method, drive control of a photoelectric sensor), measurement data of a pulse waveform of each particle is obtained, and the data is processed and counted.
- the control unit 3 includes at least a constant current power supply unit 4 and a calculation unit 5.
- the constant current power supply unit is configured to apply a voltage to the electrode pairs 22 and 23 and output the waveform data of the pulse voltage when each particle passes through the aperture to the calculation unit 5.
- the calculation unit 5 is a calculation device configured to execute the above-described method of the present invention and count the pulse waveform finally determined to be employable for counting.
- the arithmetic device include a computer that executes a program created so as to implement the method of the present invention. Not only all arithmetic processing is performed by a program, but arithmetic processing such as the above-described FPGA is performed by an electronic circuit. A mode in which a digital arithmetic element constructed so as to be able to be partially used is preferable in that the circuit can be easily adjusted after speeding up the processing and checking the data. For the data communication technology between the computer and the digital arithmetic element, the conventional technology may be referred to. Further, in the aspect of FIG. 5, the configuration for converting the obtained pulse waveform into digital data may be included in either the constant current power supply unit 4 or the calculation unit 5.
- the calculation unit 5 has at least a first determination unit 6 configured to execute the first determination step in the method of the present invention described above.
- the determination principle in the first determination unit, the set value for the determination, and the detailed processing content are as described above.
- the calculating part 5 further has the 2nd determination part 7 comprised so that the 2nd determination step in the method of this invention mentioned above might be performed.
- the determination principle in the second determination unit, the set value for the determination, and the detailed processing content are as described above.
- the calculation unit counts the pulse waveform only when the first determination unit 6 and the second determination unit 7 determine that both can be employed for counting with respect to the same pulse waveform. Configured to be adopted.
- the calculation unit 5 further includes a first preliminary sorting unit configured to execute the first preliminary sorting step in the above-described method of the present invention (not shown in FIG. 5).
- the first preliminary sorting unit is positioned so as to perform data processing before the first and second determination units.
- the selection contents in the first preliminary selection section, the set values for the selection contents, and the detailed processing contents are as described above.
- the calculation unit 5 further includes a second preliminary sorting unit configured to perform the second preliminary sorting step in the method of the present invention (not shown in FIG. 5).
- the second preliminary sorting unit is positioned so as to perform data processing prior to the first and second determination units, and sorts the pulse waveforms that are not excluded by the first preliminary sorting unit. To position.
- the selection contents in the second preliminary selection section, the set values for the selection contents, and the detailed processing contents are as described above.
- the calculation unit 5 is configured to employ, in the counting, the pulse waveform determined by the second preliminary selection unit as having a maximum value (maximum voltage value) Vp less than the lower limit value. ing. The reason is as described above.
- the computer that is the main device of the calculation unit 5 performs all steps from the acquisition of the pulse waveform in step s1 to the counting process step in step s7 shown in the flowchart of FIG. FPGA).
- the computer that is the main device of the calculation unit 5 performs all steps from the acquisition of the pulse waveform in step s1 to the counting process step in step s7 shown in the flowchart of FIG. FPGA).
- FIG. 6 is a scattergram (dispersion diagram) showing the relationship between the maximum pulse voltage Vp and the pulse width W of individual particles obtained by measurement using blood as the sample liquid.
- 7 to 10 are also scattergrams or graphs showing measurement results when blood is used as the sample solution.
- a scattergram was determined using an experimental sample solution containing polystyrene beads having three kinds of average particle diameters.
- the test sample solution is a solution in which three types of monodisperse polystyrene monodisperse particles (average particle diameters of 5 ⁇ m, 6 ⁇ m, and 7 ⁇ m) are mixed in substantially the same ratio in physiological saline. The performance of was verified. As a result, since the distribution of beads entered between the upper and lower thresholds, the threshold was judged to be appropriate.
- the determination processing in the first determination step was performed by the computer on the pulse waveform data set determined to be employable in the counting in the second determination step.
- the pulse waveform whose variance value c 2 exceeds the predetermined threshold range is excluded.
- Upper and lower limits of the threshold variance value c 2 at this time is the pulse shape of the time of the blood or polystyrene monodisperse particles as a sample, the upper limit 30 and the lower limit is set to 43.
- FIG. 8 is a scattergram showing the relationship between the maximum voltage value Vp of the pulse voltage determined to be employable for counting in the first determination step and the pulse width W. Compared with FIG. 6 and FIG. 7, it can be seen that a pulse waveform having a wide pulse width is effectively eliminated and only a pulse waveform having a normal waveform remains.
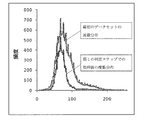
- FIG. 9 also shows the volume frequency distribution of the first data set before processing. As is clear from the graph of FIG. 9, it can be seen that only the frequency on the side with the larger volume is effectively scraped off by the determination processing in the second determination step to the first determination step.
- FIG. 10 is a graph plotted with the hematocrit value of each sample solution obtained in each of the above experiments as the horizontal axis and the hematocrit value obtained by calculation of each sample solution as the vertical axis.
- the value of the decision count R 2 representing the degree of correlation between the two is 0.97, indicating a strong correlation, indicating that the determination method according to the present invention is correct.
- the actual hematocrit value of each sample liquid obtained in each experiment is all higher than the hematocrit value of each sample liquid obtained by calculation. It is estimated that this is because a small amount of gaps are included.
- the present invention it is possible to effectively exclude an irregular waveform from a pulse waveform obtained by an electric resistance method or an optical technique, and to adopt only a normal pulse waveform for counting. Thereby, in the blood cell count, a volume frequency distribution graph that does not include an incorrect waveform in the count is obtained, and a more accurate diagnosis can be performed.
Landscapes
- Chemical & Material Sciences (AREA)
- Dispersion Chemistry (AREA)
- Physics & Mathematics (AREA)
- Health & Medical Sciences (AREA)
- Life Sciences & Earth Sciences (AREA)
- Analytical Chemistry (AREA)
- Biochemistry (AREA)
- General Health & Medical Sciences (AREA)
- General Physics & Mathematics (AREA)
- Immunology (AREA)
- Pathology (AREA)
- Investigating Or Analysing Biological Materials (AREA)
Abstract
電気抵抗法または光学的手法に従って試料液中の各粒子のパルス波形を得、その波形に基いて粒子を計数する粒子計数方法と装置である。判定すべきパルス波形を、それに近似するガウス曲線に対応付け、そのガウス曲線の分散値が、そのガウス曲線の高さに対応して予め定められた上限と下限の閾値の範囲以内にあるならば、そのパルス電圧の波形を計数に採用可能であると判定する。本発明によって、測定されたパルス波形から不正波形が適切に排除される。
Description
本発明は、血液細胞などの粒子を電気抵抗法または光学的手法に基いて計数する方法とそのための計数装置に関するものであり、とりわけ、該電気抵抗法または光学的手法に基いて得られた個々の粒子のパルス波形が、計数に採用可能なものであるかどうかを判定する技術に関するものである。
試料液中の粒子(例えば、赤血球、白血球、血小板などの血液細胞)を計数するための粒子計数装置として、試料液の流路にアパーチャと電極対とを設け、電気抵抗法(インピーダンス法とも呼ばれる)に従って電極間の電圧を計測し、各粒子の大きさに対応したパルス状の電気信号(通常、パルス電圧)を得るよう構成された装置が知られている。
電気抵抗法は、図11(a)に示すように、試料液(例えば、所定の検体血液を希釈液中に分散させたもの)を流路100に導入し、該流路100の途中に、オリフィスのごとく流路の断面積が小さくなったアパーチャ(小孔)200を設け、該アパーチャ200の上流側と下流側にそれぞれ電極300、310を設けることによって、該アパーチャ200を通過する粒子(血球)の容積を、電極間の電気的な特性の変化に基いて測定する手法である。
電気抵抗法は、図11(a)に示すように、試料液(例えば、所定の検体血液を希釈液中に分散させたもの)を流路100に導入し、該流路100の途中に、オリフィスのごとく流路の断面積が小さくなったアパーチャ(小孔)200を設け、該アパーチャ200の上流側と下流側にそれぞれ電極300、310を設けることによって、該アパーチャ200を通過する粒子(血球)の容積を、電極間の電気的な特性の変化に基いて測定する手法である。
試料液中の1つの粒子X10がアパーチャ200を通過するとき、電極間の電気抵抗またはインピーダンスはパルス状に変化する。よって、一対の電極300、310に定電流電源400から電圧を印加しておくと、前記のようなインピーダンスの変化に応じて該電圧も図11(b)に示すようにパルス電圧(パルス状の電気信号)として変化する。このパルス状の電気信号の数を、例えば定電流電源に接続した演算部500などによって計数することによって、粒子の数を知ることができる。
電気抵抗法において粒子がアパーチャを通過するときのパルス状の電気信号のパルス波形のピークの高さ(通常、パルス電圧の最大電圧値)Vpは、その粒子の大きさに比例するので、その高さによって粒子の容積の大小を判定することができる。また、流速が一定の場合には、その粒子の大きさに比例してパルス波形の幅Wも大きくなることから、該パルス波形の幅によっても粒子の容積の大小をある程度判定することができる。
よって、電気抵抗法による粒子の計数では、単に粒子の数を知るだけではなく、得られるパルス波形に基いて、試料液中に何程の容積の血液細胞が何程の度数で存在しているかについての容積度数分布を得ることもできる。
例えば、貧血などの病理診断の指標の1つとして、平均赤血球容積(Mean Corpuscular Volume)が用いられている。該平均赤血球容積は、電気抵抗法によって測定された個々の赤血球のパルス波形の高さの情報(容積情報)から度数分布を作成し、求められる赤血球容積の平均値である。
よって、電気抵抗法による粒子の計数では、単に粒子の数を知るだけではなく、得られるパルス波形に基いて、試料液中に何程の容積の血液細胞が何程の度数で存在しているかについての容積度数分布を得ることもできる。
例えば、貧血などの病理診断の指標の1つとして、平均赤血球容積(Mean Corpuscular Volume)が用いられている。該平均赤血球容積は、電気抵抗法によって測定された個々の赤血球のパルス波形の高さの情報(容積情報)から度数分布を作成し、求められる赤血球容積の平均値である。
電気抵抗法に基いて血液細胞の計数を行なうための流路、アパーチャ、電極配置等の装置の構成については、例えば特許文献1~3などに詳細に記載されている。尚、特許文献2の装置では、独自の構成によってアパーチャの下流側の流路が2つに分岐し、また、特許文献3の装置では、独自の構成によってアパーチャの下流側に一対の電極が設けられているが、いずれも、血液細胞の大きさを判定する電気抵抗法の基本的な原理は上記と同様である。
一方、図12に示すように、光学的手法に基づいた粒子計数装置も知られている。このような装置では、図12(a)に示すように、粒子X10が1つずつ通過し得る細い管路201に、光軸が直交するように光電センサー(図の例では、投光素子E1と受光素子E2のペア)が配置される。該管路201を流れる試料液中の各粒子X10が光L1を横切ると受光量が変化するので(100%の受光量からの減少~遮断~100%の受光量への復帰)、図12(b)に示すように、各粒子の大きさに応じたパルス状の電気信号が得られる。図12(b)は出力信号の一例であって、受光量の変化に応じて出力電圧が変化するように構成されている。Vpはパルスの高さである。例えば、粒子が大きい場合、該粒子が光L1を横切るのに要する時間が長くなるので、得られる信号のパルスの幅Wが大きくなる。
よって、このような光学的手法の場合にも、上記した電気抵抗法と同様、得られるパルス波形に基いて、試料液中に何程の容積の血液細胞が何程の度数で存在しているかについての容積度数分布を得ることができる。
よって、このような光学的手法の場合にも、上記した電気抵抗法と同様、得られるパルス波形に基いて、試料液中に何程の容積の血液細胞が何程の度数で存在しているかについての容積度数分布を得ることができる。
図11(b)にパルス電圧として模式的に示したパルス波形は、1つの粒子がアパーチャの中央を等速直線的に通過するといった理想的な通過状態での波形である(以下、「正常波形」と呼ぶ)。
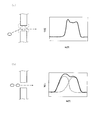
しかし、実際の血球計数では、前記のような理想的な通過状態のみならず、図13(a)のように、血球がアパーチャの中心からずれて内壁に接近した経路をたどる通過状態や、図13(b)のように、複数の血球が互いに接近した状態のままでアパーチャを通過するといったような種々の通過状態や外乱が存在し、そのような場合のパルス電圧の波形は正常波形から大きく変形した波形(以下、「不正波形」と呼ぶ)となる。
例えば、図13(a)の左側の図に一点鎖線の円で模式的に示唆するように、アパーチャの入口と出口における開口周囲のエッジ付近は、電極間に形成される電界が局所的に強く分布することから、検出感度が中心部分よりも高くなっている。よって、図13(a)の左側の図に示した通過状態のように、血球が中心から偏って開口周囲のエッジに接近した経路を進む場合には、図13(a)の右側のグラフのように、電圧波形は2つの突起したピークを持った不正波形となる傾向にある。このような変則的な突起部の高さは、その血球の本来の正常波形のピークの高さよりも高い値となるので、その血球の真の大きさよりも大きい血球が通過したものとして計数される。
また、図13(b)の左側の図に示した通過状態のように、2つの血球が互いに接近した状態でアパーチャを連続的に通過する場合には、図13(b)の右側のグラフのように、2つのパルス電圧が1つの波形のように重なり合い、2つのピークを持った波形や、斜面にコブを持った幅の広い波形として現れる場合がある。このような波形のデータもまた、個々の血球の真の大きさよりも大きい1つの血球が通過したものとして計数される。
しかし、実際の血球計数では、前記のような理想的な通過状態のみならず、図13(a)のように、血球がアパーチャの中心からずれて内壁に接近した経路をたどる通過状態や、図13(b)のように、複数の血球が互いに接近した状態のままでアパーチャを通過するといったような種々の通過状態や外乱が存在し、そのような場合のパルス電圧の波形は正常波形から大きく変形した波形(以下、「不正波形」と呼ぶ)となる。
例えば、図13(a)の左側の図に一点鎖線の円で模式的に示唆するように、アパーチャの入口と出口における開口周囲のエッジ付近は、電極間に形成される電界が局所的に強く分布することから、検出感度が中心部分よりも高くなっている。よって、図13(a)の左側の図に示した通過状態のように、血球が中心から偏って開口周囲のエッジに接近した経路を進む場合には、図13(a)の右側のグラフのように、電圧波形は2つの突起したピークを持った不正波形となる傾向にある。このような変則的な突起部の高さは、その血球の本来の正常波形のピークの高さよりも高い値となるので、その血球の真の大きさよりも大きい血球が通過したものとして計数される。
また、図13(b)の左側の図に示した通過状態のように、2つの血球が互いに接近した状態でアパーチャを連続的に通過する場合には、図13(b)の右側のグラフのように、2つのパルス電圧が1つの波形のように重なり合い、2つのピークを持った波形や、斜面にコブを持った幅の広い波形として現れる場合がある。このような波形のデータもまた、個々の血球の真の大きさよりも大きい1つの血球が通過したものとして計数される。
上記のような不正波形が生じる現象は、電気抵抗法のみならず図12に示した光学的手法においても生じる。例えば、2つの血球が互いに接近した状態で光軸を連続的に通過する場合には、2つのパルス波形が1つの波形のように重なり合い、図13(b)と同様に、2つのピークを持った波形や、斜面にコブを持った幅の広い波形として出力されることになり、それぞれの血球の真の大きさよりも大きい1つの血球が通過したものとして計数される。
不正波形を計数に含んだ容積-度数分布グラフは、正常波形のみを計数した場合のグラフに比べて、容積の大きい側に度数が加わった分布グラフとなり、正しい診断の妨げとなる。このような問題は、血液細胞のみならず、電気抵抗法や光学的手法を用いた一般的な粒子計数においても同様に存在する問題である。
本発明の課題は、電気抵抗法や光学的手法によって得られるパルス波形から不正波形を排除し、正常波形であるパルス波形だけを計数に採用するための新たな方法を提供し、かつ、該方法を実施し得るよう構成された粒子計数装置を提供することにある。
本発明は、次の特徴を有するものである。
〔1〕下記(A)または下記(B)の粒子計数法に従って、試料液中の各粒子に対応するパルス波形を得、そのパルス波形に基いて粒子を計数する粒子計数方法であって、
各粒子のパルス波形が計数に採用可能か否かを判定する第1の判定ステップを少なくとも有し、
該第1の判定ステップでは、判定すべきパルス波形を、それに近似する下記式(I)のガウス関数V(t)で規定されるガウス曲線に対応付け、
V(t)=Vp * exp(-t2/(2*c2)) 式(I)
(上式(I)中、tは時間の変数、Vpは判定すべきパルス波形の最大値、c2はそのガウス曲線に対応付けられたパルス波形のパルス幅Wと等しい幅を持つように決定される分散値である。)
前記ガウス曲線の分散値c2が、そのガウス曲線の高さに対応して予め定められた上限と下限の閾値の範囲以内にあるならば、そのパルス波形を計数に採用可能であると判定する、
前記粒子計数方法。
(A)アパーチャと電極対とを用いる電気抵抗法に従って、試料液中の各粒子がアパーチャを通過する際の電極間のインピーダンスの変化をパルス状の電気信号として得、該パルス状の電気信号のパルス波形に基いて粒子を計数する粒子計数法。
(B)管路とそれに直交して配置された光電センサーとを用い、管路を流れる試料液中の各粒子が光電センサーの光軸を横切ることによって得られる受光量の変化をパルス状の電気信号として得、該パルス状の電気信号のパルス波形に基いて粒子を計数する粒子計数法。
〔2〕第2の判定ステップをさらに有し、該第2の判定ステップは、第1の判定ステップの前後にまたは並行して位置し、
該第2の判定ステップは、判定すべきパルス波形の幅Wの中央の時間Tmと、該パルス波形の最大値Vpにおける時間Tpとの間の差を演算し、その差が予め定められた閾値の範囲以内にあるならば、そのパルス波形を計数に採用可能であると判定するステップであって、
同じパルス波形に対して、第1の判定ステップと第2の判定ステップが、両方共に、計数に採用可能であると判定したときのみ、そのパルス波形を計数に採用するように構成されている、
上記〔1〕記載の粒子計数方法。
〔3〕パルス波形をパルス幅Wについて予め選別する第1の予備選別ステップをさらに有し、
該第1の予備選別ステップは、全ての判定ステップの前に位置し、予め定められた許容範囲外のパルス幅Wを持ったパルス波形を排除するステップである、上記〔1〕または〔2〕記載の粒子計数方法。
〔4〕パルス波形を最大値Vpについて予め選別する第2の予備選別ステップをさらに有し、
該第2の予備選別ステップは、全ての判定ステップの前に位置し、かつ、第1の予備選別ステップの後に位置し、予め定められた下限値以上の最大値Vpを持ったパルス波形を上記判定ステップへ送るステップであって、
前記下限値未満の最大値Vpを持ったパルス波形を計数に採用するように構成されている、
上記〔3〕記載の粒子計数方法。
〔5〕下記(A)または下記(B)の粒子計数法に従って、試料液中の各粒子に対応するパルス波形を得、そのパルス波形に基いて粒子を計数するよう構成された粒子計数装置であって、
当該粒子計数装置は、粒子の計数を行うための演算部を有し、
該演算部は、各粒子のパルス波形が計数に採用可能か否かを判定する第1の判定部を少なくとも有し、
該第1の判定部は、判定すべき粒子のパルス波形を、それに近似する下記式(I)のガウス関数V(t)で規定されるガウス曲線に対応付け、
V(t)=Vp * exp(-t2/(2*c2)) 式(I)
(上式(I)中、tは時間の変数、Vpは判定すべきパルス波形の最大値、c2はそのガウス曲線に対応付けられたパルス波形のパルス幅Wと等しい幅を持つように決定される分散値である。)
前記ガウス曲線の分散値c2が、そのガウス曲線の高さに対応して予め定められた上限と下限の閾値の範囲以内にあるならば、そのパルス波形を計数に採用可能であると判定するように構成されている、
前記粒子計数装置。
〔6〕演算部が、第2の判定部をさらに有し、
該第2の判定部は、第1の判定部の前後にまたは並行して位置し、
判定すべきパルス波形の幅Wの中央の時間Tmと、該パルス波形の最大値Vpにおける時間Tpとの間の差を演算し、その差が予め定められた閾値の範囲以内にあるならば、そのパルス波形を計数に採用可能であると判定するよう構成され、
前記演算部は、同じパルス波形に対して、第1の判定部と第2の判定部が、両方共に計数に採用可能であると判定したときのみ、そのパルス波形を計数に採用するように構成されている、
上記〔5〕記載の粒子計数装置。
〔7〕演算部が、パルス波形をパルス幅Wについて予め選別する第1の予備選別部をさらに有し、
該第1の予備選別部は、全ての判定部よりも先にデータ処理を行うように位置し、予め定められた許容範囲外のパルス幅Wを持ったパルス波形を排除するように構成されている、上記〔5〕または〔6〕記載の粒子計数装置。
〔8〕演算部が、パルス波形を最大値Vpについて予め選別する第2の予備選別部をさらに有し、
該第2の予備選別部は、全ての判定部よりも先に選別の処理を行うように位置し、かつ、第1の予備選別部によって排除されなかったパルス波形を選別するように位置し、予め定められた下限値以上の最大値Vpを持ったパルス波形を上記判定部へ送るように構成されており、
前記演算部は、該下限値未満の最大値Vpを持ったパルス波形を計数に採用するように構成されている、
上記〔7〕記載の粒子計数装置。
〔1〕下記(A)または下記(B)の粒子計数法に従って、試料液中の各粒子に対応するパルス波形を得、そのパルス波形に基いて粒子を計数する粒子計数方法であって、
各粒子のパルス波形が計数に採用可能か否かを判定する第1の判定ステップを少なくとも有し、
該第1の判定ステップでは、判定すべきパルス波形を、それに近似する下記式(I)のガウス関数V(t)で規定されるガウス曲線に対応付け、
V(t)=Vp * exp(-t2/(2*c2)) 式(I)
(上式(I)中、tは時間の変数、Vpは判定すべきパルス波形の最大値、c2はそのガウス曲線に対応付けられたパルス波形のパルス幅Wと等しい幅を持つように決定される分散値である。)
前記ガウス曲線の分散値c2が、そのガウス曲線の高さに対応して予め定められた上限と下限の閾値の範囲以内にあるならば、そのパルス波形を計数に採用可能であると判定する、
前記粒子計数方法。
(A)アパーチャと電極対とを用いる電気抵抗法に従って、試料液中の各粒子がアパーチャを通過する際の電極間のインピーダンスの変化をパルス状の電気信号として得、該パルス状の電気信号のパルス波形に基いて粒子を計数する粒子計数法。
(B)管路とそれに直交して配置された光電センサーとを用い、管路を流れる試料液中の各粒子が光電センサーの光軸を横切ることによって得られる受光量の変化をパルス状の電気信号として得、該パルス状の電気信号のパルス波形に基いて粒子を計数する粒子計数法。
〔2〕第2の判定ステップをさらに有し、該第2の判定ステップは、第1の判定ステップの前後にまたは並行して位置し、
該第2の判定ステップは、判定すべきパルス波形の幅Wの中央の時間Tmと、該パルス波形の最大値Vpにおける時間Tpとの間の差を演算し、その差が予め定められた閾値の範囲以内にあるならば、そのパルス波形を計数に採用可能であると判定するステップであって、
同じパルス波形に対して、第1の判定ステップと第2の判定ステップが、両方共に、計数に採用可能であると判定したときのみ、そのパルス波形を計数に採用するように構成されている、
上記〔1〕記載の粒子計数方法。
〔3〕パルス波形をパルス幅Wについて予め選別する第1の予備選別ステップをさらに有し、
該第1の予備選別ステップは、全ての判定ステップの前に位置し、予め定められた許容範囲外のパルス幅Wを持ったパルス波形を排除するステップである、上記〔1〕または〔2〕記載の粒子計数方法。
〔4〕パルス波形を最大値Vpについて予め選別する第2の予備選別ステップをさらに有し、
該第2の予備選別ステップは、全ての判定ステップの前に位置し、かつ、第1の予備選別ステップの後に位置し、予め定められた下限値以上の最大値Vpを持ったパルス波形を上記判定ステップへ送るステップであって、
前記下限値未満の最大値Vpを持ったパルス波形を計数に採用するように構成されている、
上記〔3〕記載の粒子計数方法。
〔5〕下記(A)または下記(B)の粒子計数法に従って、試料液中の各粒子に対応するパルス波形を得、そのパルス波形に基いて粒子を計数するよう構成された粒子計数装置であって、
当該粒子計数装置は、粒子の計数を行うための演算部を有し、
該演算部は、各粒子のパルス波形が計数に採用可能か否かを判定する第1の判定部を少なくとも有し、
該第1の判定部は、判定すべき粒子のパルス波形を、それに近似する下記式(I)のガウス関数V(t)で規定されるガウス曲線に対応付け、
V(t)=Vp * exp(-t2/(2*c2)) 式(I)
(上式(I)中、tは時間の変数、Vpは判定すべきパルス波形の最大値、c2はそのガウス曲線に対応付けられたパルス波形のパルス幅Wと等しい幅を持つように決定される分散値である。)
前記ガウス曲線の分散値c2が、そのガウス曲線の高さに対応して予め定められた上限と下限の閾値の範囲以内にあるならば、そのパルス波形を計数に採用可能であると判定するように構成されている、
前記粒子計数装置。
〔6〕演算部が、第2の判定部をさらに有し、
該第2の判定部は、第1の判定部の前後にまたは並行して位置し、
判定すべきパルス波形の幅Wの中央の時間Tmと、該パルス波形の最大値Vpにおける時間Tpとの間の差を演算し、その差が予め定められた閾値の範囲以内にあるならば、そのパルス波形を計数に採用可能であると判定するよう構成され、
前記演算部は、同じパルス波形に対して、第1の判定部と第2の判定部が、両方共に計数に採用可能であると判定したときのみ、そのパルス波形を計数に採用するように構成されている、
上記〔5〕記載の粒子計数装置。
〔7〕演算部が、パルス波形をパルス幅Wについて予め選別する第1の予備選別部をさらに有し、
該第1の予備選別部は、全ての判定部よりも先にデータ処理を行うように位置し、予め定められた許容範囲外のパルス幅Wを持ったパルス波形を排除するように構成されている、上記〔5〕または〔6〕記載の粒子計数装置。
〔8〕演算部が、パルス波形を最大値Vpについて予め選別する第2の予備選別部をさらに有し、
該第2の予備選別部は、全ての判定部よりも先に選別の処理を行うように位置し、かつ、第1の予備選別部によって排除されなかったパルス波形を選別するように位置し、予め定められた下限値以上の最大値Vpを持ったパルス波形を上記判定部へ送るように構成されており、
前記演算部は、該下限値未満の最大値Vpを持ったパルス波形を計数に採用するように構成されている、
上記〔7〕記載の粒子計数装置。
本発明では、電気抵抗法または光学的手法によって得られる個々の粒子に対応したパルス波形を、それに近似したガウス曲線に対応付けるという新たな発想に基づき、各粒子のパルス波形が計数に採用可能か否かというパルス波形に対する判定を、ガウス曲線に対する判定に置き換えることに成功している。
即ち、本発明では、ガウス曲線に対する判定において、ガウス曲線の幅を決定付ける分散値に、判定用の閾値として上限と下限を設定し、各粒子のパルス波形に対応付けられたガウス曲線の分散値が、その上限と下限の閾値の範囲以内に入っているかどうかを判定する。ガウス曲線の分散値に上限と下限とを設定することで、正常波形に対応するガウス曲線と、不正波形に対応するガウス曲線とを、より明確に判別することができる。
即ち、本発明では、ガウス曲線に対する判定において、ガウス曲線の幅を決定付ける分散値に、判定用の閾値として上限と下限を設定し、各粒子のパルス波形に対応付けられたガウス曲線の分散値が、その上限と下限の閾値の範囲以内に入っているかどうかを判定する。ガウス曲線の分散値に上限と下限とを設定することで、正常波形に対応するガウス曲線と、不正波形に対応するガウス曲線とを、より明確に判別することができる。
従来においてもパルス波形の良否を判定しようとする試みはあった。しかし、従来の判定の手法では、パルス波形の高さ(パルス高さ)とパルス波形の幅(パルス幅)にそれぞれ上限と下限の閾値を固定的に定めておき、その固定された上限、下限の閾値の範囲内にあるか否かで、パルス波形の良否を判定するというだけのものであった。
また、従来では、(i)電圧波形の対称度を調べることによって不正波形を判別する方法や、(ii)1つの波形の最大ピーク値の半値における時間(t1、t2)の中間時点における電圧値をその波形のピーク値(中心振幅)として採用する方法なども提案されていた。
しかし、上記(i)の様な方法には、たとえ不正波形であっても左右対称であれば排除できないという欠点があり、上記(ii)の様な方法には、2つの粒子が通過する場合、誤ったピーク値を算出してしまう可能性があるという欠点がある。
また、従来では、(i)電圧波形の対称度を調べることによって不正波形を判別する方法や、(ii)1つの波形の最大ピーク値の半値における時間(t1、t2)の中間時点における電圧値をその波形のピーク値(中心振幅)として採用する方法なども提案されていた。
しかし、上記(i)の様な方法には、たとえ不正波形であっても左右対称であれば排除できないという欠点があり、上記(ii)の様な方法には、2つの粒子が通過する場合、誤ったピーク値を算出してしまう可能性があるという欠点がある。
これに対して、本発明では、個々の粒子について得られたパルス波形を、そのパルス高さとパルス幅に基いてガウス曲線に変換しており、各パルス幅の上限と下限の閾値は、各波形のパルス高さに応じて変動する。即ち、本発明では、波形判定の閾値は固定された値ではない。ガウス曲線のパルス高さの変化に応じて、ガウス曲線のパルス幅の上限と下限の閾値が変動する様子は、図1(b)のグラフに示されたとおりである。
本発明は、パルス波形の判定をガウス曲線の判定に置き換え、コンピュータやFPGA(Field Programmable Gate Array)等のデジタル演算装置の高い処理能力を利用することで、判定条件として入力したパルス高さとパルス幅の二次元の閾値(即ち、パルス高さの変化に応じて変動するパルス幅の上限と下限の閾値)の範囲内に入るか否かを判定するものである。
よって、本発明の判定法は、従来にはなかった新たな技術的思想に基づいた判定法であり、誤判定を抑制しながらも、処理速度を低下させることなしに、不正波形を排除することが可能な方法である。また、本発明は、上記した従来法(i)、(ii)の欠点を解消することも可能な方法である。
本発明は、パルス波形の判定をガウス曲線の判定に置き換え、コンピュータやFPGA(Field Programmable Gate Array)等のデジタル演算装置の高い処理能力を利用することで、判定条件として入力したパルス高さとパルス幅の二次元の閾値(即ち、パルス高さの変化に応じて変動するパルス幅の上限と下限の閾値)の範囲内に入るか否かを判定するものである。
よって、本発明の判定法は、従来にはなかった新たな技術的思想に基づいた判定法であり、誤判定を抑制しながらも、処理速度を低下させることなしに、不正波形を排除することが可能な方法である。また、本発明は、上記した従来法(i)、(ii)の欠点を解消することも可能な方法である。
以下、本発明の粒子計数方法と粒子計数装置を詳細に説明する。
本発明の粒子計数方法は、電気抵抗法または光学的手法に従って試料液中の各粒子に対応するパルス波形を得、その波形に基いて粒子を計数する方法である。以下の説明では、パルス波形を得るための計測手法として電気抵抗法を例として、パルス波形をパルス電圧として得る場合を例としているが、パルス波形を得るための計測手法を光学的手法に適宜置き換えてもよく、得られるパルス電圧は、パルス状に変化する信号であればよい。
本発明の方法では、パルス波形の判定、予備的な選別、その後の計数などの種々の処理は、後述の演算装置が自動的に行う。
当該方法の重要な特徴は、各粒子のパルス波形が計数に採用可能か否かを判定する第1の判定ステップを有する点にある。
該第1の判定ステップでは、判定すべきパルス波形を、それに近似する下記式(I)のガウス関数V(t)で規定されるガウス曲線に対応付けている。
V(t)=Vp * exp(-t2/(2*c2)) 式(I)
上式(I)において、tは時間の変数、Vpは判定すべきパルス波形(パルス電圧)の最大値(最大電圧値)、c2は、分散値であって、ガウス曲線の裾野の広がりの度合いを決定付けるパラメータである。該c2は、上式(I)のガウス曲線が、もとの信号のパルス波形のパルス幅Wに対応した幅を持つように決定されている。
また、上式(I)において、「*」は乗算を意味する演算子、「/」は除算を意味する演算子、「exp( )」は自然対数の底eの指数関数e( )を意味する演算子である。
該第1の判定ステップでは、前記ガウス曲線の分散値c2が、そのガウス曲線の高さに対応して予め定められた分散値の上限と下限の閾値の範囲以内にあるならば、そのパルス電圧の波形を計数に採用可能であると判定する。即ち、図1(a)に示すように、判定すべきガウス曲線(太い実線のグラフ)が、上限の分散を持ったガウス曲線(一点鎖線)と、下限の分散を持ったガウス曲線(破線)との間にあれば、そのガウス曲線に対応するもとのパルス波形を計数に採用可能であると判定する。
本発明の粒子計数方法は、電気抵抗法または光学的手法に従って試料液中の各粒子に対応するパルス波形を得、その波形に基いて粒子を計数する方法である。以下の説明では、パルス波形を得るための計測手法として電気抵抗法を例として、パルス波形をパルス電圧として得る場合を例としているが、パルス波形を得るための計測手法を光学的手法に適宜置き換えてもよく、得られるパルス電圧は、パルス状に変化する信号であればよい。
本発明の方法では、パルス波形の判定、予備的な選別、その後の計数などの種々の処理は、後述の演算装置が自動的に行う。
当該方法の重要な特徴は、各粒子のパルス波形が計数に採用可能か否かを判定する第1の判定ステップを有する点にある。
該第1の判定ステップでは、判定すべきパルス波形を、それに近似する下記式(I)のガウス関数V(t)で規定されるガウス曲線に対応付けている。
V(t)=Vp * exp(-t2/(2*c2)) 式(I)
上式(I)において、tは時間の変数、Vpは判定すべきパルス波形(パルス電圧)の最大値(最大電圧値)、c2は、分散値であって、ガウス曲線の裾野の広がりの度合いを決定付けるパラメータである。該c2は、上式(I)のガウス曲線が、もとの信号のパルス波形のパルス幅Wに対応した幅を持つように決定されている。
また、上式(I)において、「*」は乗算を意味する演算子、「/」は除算を意味する演算子、「exp( )」は自然対数の底eの指数関数e( )を意味する演算子である。
該第1の判定ステップでは、前記ガウス曲線の分散値c2が、そのガウス曲線の高さに対応して予め定められた分散値の上限と下限の閾値の範囲以内にあるならば、そのパルス電圧の波形を計数に採用可能であると判定する。即ち、図1(a)に示すように、判定すべきガウス曲線(太い実線のグラフ)が、上限の分散を持ったガウス曲線(一点鎖線)と、下限の分散を持ったガウス曲線(破線)との間にあれば、そのガウス曲線に対応するもとのパルス波形を計数に採用可能であると判定する。
ここで、図3に示すように、電気抵抗法によって得られる実際のパルス電圧の0V付近にはノイズ等による波形の変動が存在する。よって、そのような下方の変動部分を排除するためには、各粒子のパルス波形およびガウス曲線に対して閾値電圧Vsを設定し、該閾値電圧Vs以上の部分だけを取り扱うことが好ましい。
そして、パルス波形およびそれに対応付けられるガウス曲線のそれぞれの幅を、図1(a)のグラフに示すように、閾値電圧Vsにおける幅Wであると規定することで、幅の値が明らかになり、より正確な演算処理を行うことができるようになる。
以下の説明では、パルス波形およびガウス曲線のそれぞれの幅は、閾値電圧Vsにおける幅Wである。
そして、パルス波形およびそれに対応付けられるガウス曲線のそれぞれの幅を、図1(a)のグラフに示すように、閾値電圧Vsにおける幅Wであると規定することで、幅の値が明らかになり、より正確な演算処理を行うことができるようになる。
以下の説明では、パルス波形およびガウス曲線のそれぞれの幅は、閾値電圧Vsにおける幅Wである。
上式(I)で規定されるガウス曲線は、図1(a)に示すように、判定すべき粒子に対応するパルス波形の最大値(最大電圧値)Vpと同じ高さVpを持っている。パルス波形の最大値Vpとは、例えば、パルス電圧の場合、外乱などによる不規則な突起部の電圧値をも含んだ、そのパルス全体の最大値である。一方、ガウス曲線の高さVpは、中央のピークの高さである。また、上式(I)で規定されるガウス曲線は、判定すべき粒子のパルス電圧のパルス幅Wに対応した幅(例えば、同じ幅)Wを持っている。
ここで、ガウス関数と分散値c2について説明する。
xを変数とするガウス関数は、一般的に下式(a)のように表される。
f(x)=a * exp(-(x-b)2/(2*c2)) 式(a)
上式(a)において、aは波形の高さを決定する係数、bはピークの位置(時間)である。
本発明では、粒子がアパーチャを通過するときに現れるパルス電圧の波形(光学的手法では、粒子が光軸を横切るときに得られるパルス状の信号の波形)が、ガウス関数によって近似的に表現できると仮定し、該パルス波形の高さ(電圧値)の変化を下式(b)で表している。
V(t)=Vp * exp(-(t-b)2/(2*c2)) 式(b)
上式(b)において、tは時間を表す変数である。Vpは、ガウス関数の最大値(ピークの高さ)を決定する値であって、各粒子のパルス波形の最大値(パルス電圧の最大電圧値)を表している。
上式(b)においてt=0のときにVpとなるように(即ち、V(0)=Vpとなるように)、b=0とすると、上式(b)は、上式(I)で表される。
xを変数とするガウス関数は、一般的に下式(a)のように表される。
f(x)=a * exp(-(x-b)2/(2*c2)) 式(a)
上式(a)において、aは波形の高さを決定する係数、bはピークの位置(時間)である。
本発明では、粒子がアパーチャを通過するときに現れるパルス電圧の波形(光学的手法では、粒子が光軸を横切るときに得られるパルス状の信号の波形)が、ガウス関数によって近似的に表現できると仮定し、該パルス波形の高さ(電圧値)の変化を下式(b)で表している。
V(t)=Vp * exp(-(t-b)2/(2*c2)) 式(b)
上式(b)において、tは時間を表す変数である。Vpは、ガウス関数の最大値(ピークの高さ)を決定する値であって、各粒子のパルス波形の最大値(パルス電圧の最大電圧値)を表している。
上式(b)においてt=0のときにVpとなるように(即ち、V(0)=Vpとなるように)、b=0とすると、上式(b)は、上式(I)で表される。
閾値電圧Vsにおけるガウス曲線の幅をWとすると、ガウス関数V(t)は、V(-W/2)=V(W/2)=Vsと表され、V(t)=Vsのときの上式(I)は次式のように表すことができる。
V(W/2)=Vs=Vp * exp(-(W/2)2/(2*c2)) 式(c)
上式(c)は次のように変形される。
Vs/Vp= exp(W2/8c2)
該式を、分散値c2を表す式へと変形すると、次式(d)が得られる。
c2=W2/(-8 * ln(Vs/Vp)) 式(d)
上式中「ln ( )」は自然対数を意味する演算子である。
上式(d)から明らかなとおり、各粒子のパルス波形に対応付けられたガウス関数の分散値c2は、パルス波形の最大値(パルス電圧の最大電圧値)Vp、パルス幅W、閾値電圧Vsによって決定付けられている。
V(W/2)=Vs=Vp * exp(-(W/2)2/(2*c2)) 式(c)
上式(c)は次のように変形される。
Vs/Vp= exp(W2/8c2)
該式を、分散値c2を表す式へと変形すると、次式(d)が得られる。
c2=W2/(-8 * ln(Vs/Vp)) 式(d)
上式中「ln ( )」は自然対数を意味する演算子である。
上式(d)から明らかなとおり、各粒子のパルス波形に対応付けられたガウス関数の分散値c2は、パルス波形の最大値(パルス電圧の最大電圧値)Vp、パルス幅W、閾値電圧Vsによって決定付けられている。
上式(I)のガウス関数において、それぞれの高さVpに対して分散値c2が取り得る全範囲(不正波形をも含んだ範囲)は、粒子の種類や試料液の流速、対応させようとするガウス関数のグラフのスケールによっても異なるが、一般的な電気抵抗法や光学的手法によって得られるパルス波形をガウス関数に対応付ける場合には、分散値c2の値は20~60程度であり、この全範囲のなかで、対象とする粒子の平均径、電気抵抗法での電極間電圧、光学的手法でのビーム径、それぞれの流速などに応じて、上式(d)から分散値c2の上限の閾値と下限の閾値とを、単一粒径を持ったビーズを用いた実測値などに基いて決定すればよい。
一例として、赤血球の計数では、分散値c2として設定すべき上限の閾値から下限の閾値まで範囲は、30~50程度である。
一例として、赤血球の計数では、分散値c2として設定すべき上限の閾値から下限の閾値まで範囲は、30~50程度である。
図1(b)は、第1の判定ステップにおける判定の原理をより分り易く示したグラフ図である。分散値の上限の閾値の変化を示す上限曲線(一点鎖線で示す)と、分散値の下限の閾値の変化を示す下限曲線(破線で示す)との間にある領域以内に、判定すべきガウス曲線の分散値c2が入っていれば、そのパルス波形を計数に採用可能であると判定し得る。
図2は、実際に測定された各粒子のパルス波形をガウス曲線に対応付け、各ガウス曲線の(分散値、高さ)をプロットしたグラフ図である。図2のグラフ図にも、図1(b)と同様に、上限曲線と下限曲線を重ねて示している。図2に示すように、不正波形は、上限の曲線よりも上側に逸脱する。その主たる理由は、電気抵抗法の場合、一定の流速下では、パルス幅は粒子がアパーチャを通過する時間によって決まるが、粒子のサイズよりもアパーチャの厚さ(電界強度)が支配的となるからである。
図2は、実際に測定された各粒子のパルス波形をガウス曲線に対応付け、各ガウス曲線の(分散値、高さ)をプロットしたグラフ図である。図2のグラフ図にも、図1(b)と同様に、上限曲線と下限曲線を重ねて示している。図2に示すように、不正波形は、上限の曲線よりも上側に逸脱する。その主たる理由は、電気抵抗法の場合、一定の流速下では、パルス幅は粒子がアパーチャを通過する時間によって決まるが、粒子のサイズよりもアパーチャの厚さ(電界強度)が支配的となるからである。
本発明が判定の対象とすべき粒子は、特に限定はされないが、赤血球、白血球、血小板などの血液細胞の計数(血球計数)に対して本発明は有用である。とりわけ、赤血球は、他の血球に比べて濃度が高く、計数時に二重通過が起き易いので、赤血球の計数において本発明の有用性はより顕著になる。また、平均赤血球容積(MCV)は臨床上、重要である点からも、赤血球は、本発明にとって判定の対象とすべき重要な粒子である。
電気抵抗法を実施するためのアパーチャの開口形状や、光学的手法をを実施するための流路の断面形状は、特に限定はされないが、通常、円形が好ましい形状である。その場合の口径は、計数すべき粒子によっても異なるが、赤血球に対しては、0.01mm~1mm程度の範囲から適宜選択すればよい。
アパーチャの流路方向の長さや、一対の電極の材料、電極の位置、試料液の調整法、試料液の流速、電源、印加電圧などは、電気抵抗法を実施するための従来公知の粒子計数技術を適宜参照すればよい。
アパーチャの流路方向の長さや、一対の電極の材料、電極の位置、試料液の調整法、試料液の流速、電源、印加電圧などは、電気抵抗法を実施するための従来公知の粒子計数技術を適宜参照すればよい。
電気抵抗法に基いてパルス電圧を得る場合、パルス波形の最大値(最大電圧値)Vpは、測定する粒子の容積や、それに応じたアパーチャの断面積、電極間に印加する電圧、粒子の通過経路などによって異なる。従来公知の一般的な血球計数装置では、赤血球のパルス電圧の波形の最大電圧値Vpは、不正波形を含めると0.1~10V程度である。
閾値電圧Vsは、電圧0V付近のノイズだけを効果的に排除できるように、パルス波形の最大値(最大電圧値)Vpなどに応じて適宜決定すればよく、例えば、0.1~1V程度である。
一般的な血球計数装置による赤血球の計数では、閾値電圧Vsによって決定される赤血球のパルス幅Wは、流速によって大きく異なるが、例えば、不正波形を含めて5~30μsec程度である。
その場合、例えば、分散値c2の上限の閾値を40とし、分散値の下限の閾値を30とすることによって、図1(b)に示す2つの曲線が得られる。
一般的な血球計数装置による赤血球の計数では、閾値電圧Vsによって決定される赤血球のパルス幅Wは、流速によって大きく異なるが、例えば、不正波形を含めて5~30μsec程度である。
その場合、例えば、分散値c2の上限の閾値を40とし、分散値の下限の閾値を30とすることによって、図1(b)に示す2つの曲線が得られる。
本発明では、第1の判定ステップに加えて、次に説明する第2の判定ステップを設けてもよい。該第2の判定ステップは、第1の判定ステップの前後にあってもよいし、並行に位置していてもよい。
第2の判定ステップでは、図3のグラフ図に示すように、判定すべきパルス波形の幅Wの中央の時間(一点鎖線で示した中心線の位置)Tmと、パルス波形の最大値Vpにおける時間Tpとの間の差ΔT(即ち、幅の中心位置からの、最大値における位置のずれ)を演算する。そして、その差ΔTが予め定められた閾値の範囲以内にあるならば、その粒子のパルス波形を計数に採用可能であると判定する。
差ΔTは、1つのパルス幅に対する相対値であり、正負の符号を持った値でもよく、閾値の範囲や演算法は、それらに応じて決定すればよい。
上述の一般的な血球計数装置による赤血球の計数では、ΔTの閾値の範囲は、各パルス幅の±50%程度が挙げられる。
第2の判定ステップでは、図3のグラフ図に示すように、判定すべきパルス波形の幅Wの中央の時間(一点鎖線で示した中心線の位置)Tmと、パルス波形の最大値Vpにおける時間Tpとの間の差ΔT(即ち、幅の中心位置からの、最大値における位置のずれ)を演算する。そして、その差ΔTが予め定められた閾値の範囲以内にあるならば、その粒子のパルス波形を計数に採用可能であると判定する。
差ΔTは、1つのパルス幅に対する相対値であり、正負の符号を持った値でもよく、閾値の範囲や演算法は、それらに応じて決定すればよい。
上述の一般的な血球計数装置による赤血球の計数では、ΔTの閾値の範囲は、各パルス幅の±50%程度が挙げられる。
本発明の方法の好ましい態様では、同じ1つの粒子のパルス波形に対して、第1の判定ステップにおける判定結果と、第2の判定ステップにおける判定結果が、両方共に、計数に採用可能である場合のみ、その粒子のパルス波形を計数に採用する。図4のフローチャートに示す好ましい態様例では、第2の判定ステップs4は、第1の判定ステップs5の前に位置し、第2の判定ステップs4が計数に採用可能であると判定した波形のみを、第1の判定ステップs5で判定している。
図4のフローチャートの例では、測定によって得られたパルス波形データ(パルス電圧データなど)の集合(データセット)の選別や判定の処理を、直列的に順番に行っているが、データセット中の各データに識別番号を設け、別個に並行して処理を行い、各データに対して最後に総合的な判定を行うといった手順であってもよい。
図4のフローチャートの例では、測定によって得られたパルス波形データ(パルス電圧データなど)の集合(データセット)の選別や判定の処理を、直列的に順番に行っているが、データセット中の各データに識別番号を設け、別個に並行して処理を行い、各データに対して最後に総合的な判定を行うといった手順であってもよい。
本発明の方法の好ましい態様では、全ての判定ステップ(第1、第2の判定ステップ)に先立って、次に説明する第1、第2の予備選別ステップがさらに設けられる。
測定で得られたパルス波形には、判定する必要の無い、明らかに規定外の高さや幅を持った不正波形が含まれている場合がある。そのような不正波形は、予め、第1、第2の予備選別ステップにおいて、単純にフィルターをかけて選別し、無駄な判定処理や誤った判定処理を行わないようにすることが好ましい。第1、第2の予備選別ステップは、いずれか一方だけを設けてもよい。
測定で得られたパルス波形には、判定する必要の無い、明らかに規定外の高さや幅を持った不正波形が含まれている場合がある。そのような不正波形は、予め、第1、第2の予備選別ステップにおいて、単純にフィルターをかけて選別し、無駄な判定処理や誤った判定処理を行わないようにすることが好ましい。第1、第2の予備選別ステップは、いずれか一方だけを設けてもよい。
〔第1の予備選別ステップ:パルス幅についての予備選別〕
図4のフローチャ-トに例示するように、第1の予備選別ステップs2は、第1、第2の判定ステップの前に位置し、予め定められた許容範囲外のパルス幅を持ったパルス波形を簡単なフィルターで排除するステップである。
第1の予備選別ステップにおいて設定されるパルス幅に関する許容範囲は、従来公知の血球計数法を参照し、各血球計数装置に応じた適切な値を設定すればよい。
好ましい態様では、図4のフローチャ-トに例示するように、第1の予備選別ステップs2においてパルス幅が許容範囲以内にあったパルス波形データは、第2の予備選別ステップs3に送られる。
図4のフローチャ-トに例示するように、第1の予備選別ステップs2は、第1、第2の判定ステップの前に位置し、予め定められた許容範囲外のパルス幅を持ったパルス波形を簡単なフィルターで排除するステップである。
第1の予備選別ステップにおいて設定されるパルス幅に関する許容範囲は、従来公知の血球計数法を参照し、各血球計数装置に応じた適切な値を設定すればよい。
好ましい態様では、図4のフローチャ-トに例示するように、第1の予備選別ステップs2においてパルス幅が許容範囲以内にあったパルス波形データは、第2の予備選別ステップs3に送られる。
〔第2の予備選別ステップ:パルス波形の最大値についての予備選別〕
第2の予備選別ステップもまた、第1、第2の判定ステップの前に位置する。好ましい態様では、図4のフローチャ-トに例示するように、第2の予備選別ステップs3は、第1の予備選別ステップs2の後に設けられる。
第2の予備選別ステップでは、パルス波形の最大値に関する下限値が設定されており、この下限値以上の最大値Vpを持ったパルス波形は、第1、第2の判定ステップへと単純に送られる。
一方、本発明の方法の好ましい態様では、この下限値未満の最大値Vpを持ったパルス波形を、排除するのではなく計数に採用する(図4のフローチャ-トの例では、最終的に採用を判定するステップs6に送る)。その理由は、例えば、熱傷などを負った患者の検体中に存在する破砕赤血球のように、下限値未満の小さいパルス波形を持った粒子であっても、計数すべき場合があるからである。下限値未満の小さいパルス波形は、高さに対して幅の広い台形のような形状など、ガウス曲線とは大きく異なる形状であるので、第一の判定ステップでは排除されてしまう場合がある。このような計数すべき不正波形は、予備選別ステップの結果に応じて、適宜計数に採用することが好ましい。
第2の予備選別ステップもまた、第1、第2の判定ステップの前に位置する。好ましい態様では、図4のフローチャ-トに例示するように、第2の予備選別ステップs3は、第1の予備選別ステップs2の後に設けられる。
第2の予備選別ステップでは、パルス波形の最大値に関する下限値が設定されており、この下限値以上の最大値Vpを持ったパルス波形は、第1、第2の判定ステップへと単純に送られる。
一方、本発明の方法の好ましい態様では、この下限値未満の最大値Vpを持ったパルス波形を、排除するのではなく計数に採用する(図4のフローチャ-トの例では、最終的に採用を判定するステップs6に送る)。その理由は、例えば、熱傷などを負った患者の検体中に存在する破砕赤血球のように、下限値未満の小さいパルス波形を持った粒子であっても、計数すべき場合があるからである。下限値未満の小さいパルス波形は、高さに対して幅の広い台形のような形状など、ガウス曲線とは大きく異なる形状であるので、第一の判定ステップでは排除されてしまう場合がある。このような計数すべき不正波形は、予備選別ステップの結果に応じて、適宜計数に採用することが好ましい。
次に、本発明による粒子計数装置について説明する。
図5は、当該装置の構成の一例を模式的に示す図である。同図では、説明のために電気抵抗法を実施するための装置構成を示しているが、光学的手法に置き換えてもよい。同図に例示するように、当該装置1は、本発明による粒子計数方法を実施するよう構成されており、概しては、測定構造部2と、制御部3とを有している。
図5は、当該装置の構成の一例を模式的に示す図である。同図では、説明のために電気抵抗法を実施するための装置構成を示しているが、光学的手法に置き換えてもよい。同図に例示するように、当該装置1は、本発明による粒子計数方法を実施するよう構成されており、概しては、測定構造部2と、制御部3とを有している。
測定構造部2は、試料液を流すための流路20と、該流路に設けられたアパーチャ21と、該アパーチャの両側(上流側、下流側)に配置された一対の電極22、23とを備え、電気抵抗法に従って粒子のパルス電圧(パルス波形)を取得し得るように構成されている。タンク、ポンプ、流路の細部の形態など、測定構造部2の詳細な構造や付帯的な装置は、従来技術を参照してもよい。
制御部3は、測定構造部2に電気抵抗法(または、光学的手法による測定)を実施させるための制御装置であって、試料液の流れを制御し、電極対への電圧印加を制御し(光学的手法の場合には、光電センサーの駆動制御)、各粒子のパルス波形の測定データを得、該データを処理し、計数するように構成されている。
制御部3は、定電流電源部4と演算部5とを少なくとも有する。
定電流電源部は、電極対22、23に電圧を印加し、各粒子がアパーチャを通過したときのパルス電圧の波形データを演算部5に出力するよう構成されている。
制御部3は、定電流電源部4と演算部5とを少なくとも有する。
定電流電源部は、電極対22、23に電圧を印加し、各粒子がアパーチャを通過したときのパルス電圧の波形データを演算部5に出力するよう構成されている。
演算部5は、上記した本発明の方法を実行し、計数に採用可能であると最終的に判定されたパルス波形を計数するよう構成された演算装置である。該演算装置としては、本発明の方法を実施するように作成されたプログラムを実行するコンピュータが挙げられるが、全ての演算処理をプログラムで行うだけはなく、上記FPGAなど、演算処理を電子回路によって行えるように構築されたデジタル演算素子を部分的に利用する態様が、処理の高速化や、データの確認後、回路の調整が容易である点で好ましい。コンピュータとデジタル演算素子とのデータ通信の技術自体は、従来技術を参照すればよい。また、図5の態様において、得られたパルス波形をデジタルデータに変換する構成などは、定電流電源部4と演算部5のどちらに含まれていてもよい。
演算部5は、上記した本発明の方法における第1の判定ステップを実行するように構成された第1の判定部6を少なくとも有する。第1の判定部における判定原理やそのための設定値、詳細な処理内容は上記したとおりである。
また、好ましい態様では、演算部5は、上記した本発明の方法における第2の判定ステップを実行するように構成された第2の判定部7をさらに有する。第2の判定部における判定原理やそのための設定値、詳細な処理内容は上記したとおりである。
この場合、演算部は、同じ1つのパルス波形に対して、第1の判定部6と第2の判定部7が、両方共に計数に採用可能であると判定したときのみ、そのパルス波形を計数に採用するように構成される。
この場合、演算部は、同じ1つのパルス波形に対して、第1の判定部6と第2の判定部7が、両方共に計数に採用可能であると判定したときのみ、そのパルス波形を計数に採用するように構成される。
また、好ましい態様では、演算部5は、上記した本発明の方法における第1の予備選別ステップを実行するように構成された第1の予備選別部をさらに有する(図5には示さず)。該第1の予備選別部は、第1、第2の判定部よりも先にデータ処理を行うように位置する。第1の予備選別部における選別内容やそのための設定値、詳細な処理内容は上記したとおりである。
また、好ましい態様では、演算部5は、本発明の方法における第2の予備選別ステップを実行するように構成された第2の予備選別部をさらに有する(図5には示さず)。該第2の予備選別部は、第1、第2の判定部よりも先にデータ処理を行うように位置し、かつ、第1の予備選別部によって排除されなかったパルス波形を選別するように位置する。
第2の予備選別部における選別内容やそのための設定値、詳細な処理内容は上記したとおりである。また、好ましい態様では、演算部5は、第2の予備選別部において、下限値未満の最大値(最大電圧値)Vpを持っていると判定されたパルス波形を計数に採用するように構成されている。その理由は、上記したとおりである。
第2の予備選別部における選別内容やそのための設定値、詳細な処理内容は上記したとおりである。また、好ましい態様では、演算部5は、第2の予備選別部において、下限値未満の最大値(最大電圧値)Vpを持っていると判定されたパルス波形を計数に採用するように構成されている。その理由は、上記したとおりである。
好ましい態様では、演算部5の主要装置であるコンピュータは、図4のフローチャートに示されたステップs1のパルス波形の取得から、ステップs7の計数処理ステップまでを、全て外付けのデジタル演算素子(特にFPGA)に処理させるように構成される。これにより、ガウス波形を処理するという複雑な演算であっても、負担にはなることなく、小型の装置でありながら、高速に処理することが可能になる。
本実施例では、血液を試料液として用い、本発明の粒子計数装置を用いて、本発明の粒子計数方法を実際に行い、電気抵抗法に従って粒子のパルス波形(パルス電圧の波形)を取得し、本発明の粒子計数方法を実施した(図6~図10)。
本発明の粒子計数装置における制御部3の本体はコンピュータである。
アパーチャは断面円形であって、口径は50μmである。
図6は、試料液として血液を用い、測定によって得られた個々の粒子のパルス電圧の最大値Vpとパルス幅Wとの関係を示したスキャッターグラム(分散図)である。また、図7~10も、試料液として血液を用いた場合の測定結果を示すスキャッターグラムまたはグラフである。
本発明の粒子計数装置における制御部3の本体はコンピュータである。
アパーチャは断面円形であって、口径は50μmである。
図6は、試料液として血液を用い、測定によって得られた個々の粒子のパルス電圧の最大値Vpとパルス幅Wとの関係を示したスキャッターグラム(分散図)である。また、図7~10も、試料液として血液を用いた場合の測定結果を示すスキャッターグラムまたはグラフである。
また、分散閾値の妥当性を確認するために、3種類の平均粒子径を持ったポリスチレンビーズを含んだ実験用の試料液を用い、スキャッターグラムを判定した。該実験用の試料液には、生理食塩水に、3種類(平均粒子径が5μm、6μm、7μm)のポリスチレン単分散粒子をほぼ同じ比率にて混在させた液を用い、実際の血液に対する判定の性能を検証した。
その結果、上下の閾値の間にビーズの分布が入ったことから、該閾値が妥当であると判断した。
その結果、上下の閾値の間にビーズの分布が入ったことから、該閾値が妥当であると判断した。
〔第2の判定ステップ〕
電気抵抗法に従って得られたパルス波形のデータセットに対し、コンピュータによって、本発明の方法における第2の判定ステップでの判定処理を行った。これにより、最大値Vpの位置Tpとパルス幅の中心Tmとの差異ΔTが、所定の閾値範囲を超えているパルス波形が排除された。このときの差異ΔTの閾値範囲は、パルス波形の幅の±30%とした。
図7は、第2の判定ステップで計数に採用可能であると判定されたパルス波形の最大値Vpとパルス幅Wとの関係を示したスキャッターグラムである。図6と比べると、パルス幅が異常に広いパルス波形が好ましく排除されていることがわかる。
電気抵抗法に従って得られたパルス波形のデータセットに対し、コンピュータによって、本発明の方法における第2の判定ステップでの判定処理を行った。これにより、最大値Vpの位置Tpとパルス幅の中心Tmとの差異ΔTが、所定の閾値範囲を超えているパルス波形が排除された。このときの差異ΔTの閾値範囲は、パルス波形の幅の±30%とした。
図7は、第2の判定ステップで計数に採用可能であると判定されたパルス波形の最大値Vpとパルス幅Wとの関係を示したスキャッターグラムである。図6と比べると、パルス幅が異常に広いパルス波形が好ましく排除されていることがわかる。
〔第1の判定ステップ〕
上記第2の判定ステップで計数に採用可能であると判定されたパルス波形のデータセットに対し、コンピュータによって、第1の判定ステップでの判定処理を行った。これにより、分散値c2が、所定の閾値範囲を超えているパルス波形が排除された。
このときの分散値c2の閾値の上限と下限は、血液やポリスチレン単分散粒子をサンプルとした際のパルスの形状から、上限を30、下限を43とした。
図8は、第1の判定ステップで計数に採用可能であると判定されたパルス電圧の最大電圧値Vpとパルス幅Wとの関係を示したスキャッターグラムである。
図6、図7と比べると、パルス幅が広いパルス波形が効果的に排除され、正常波形のパルス波形だけが残っていることがわかる。
上記第2の判定ステップで計数に採用可能であると判定されたパルス波形のデータセットに対し、コンピュータによって、第1の判定ステップでの判定処理を行った。これにより、分散値c2が、所定の閾値範囲を超えているパルス波形が排除された。
このときの分散値c2の閾値の上限と下限は、血液やポリスチレン単分散粒子をサンプルとした際のパルスの形状から、上限を30、下限を43とした。
図8は、第1の判定ステップで計数に採用可能であると判定されたパルス電圧の最大電圧値Vpとパルス幅Wとの関係を示したスキャッターグラムである。
図6、図7と比べると、パルス幅が広いパルス波形が効果的に排除され、正常波形のパルス波形だけが残っていることがわかる。
上記第1の判定ステップで計数に採用可能であると判定されたパルス波形のデータセットに対してコンピュータで計数処理を行い、粒子の容積と度数との関係を演算し、容積度数分布を作成した(図9)。また、図9には、処理前の最初のデータセットの容積度数分布をも重ねて示している。
図9のグラフから明らかなとおり、第2の判定ステップ~第1の判定ステップでの判定処理によって、体積が大きい側の度数だけが効果的に削り取られていることがわかる。
図9のグラフから明らかなとおり、第2の判定ステップ~第1の判定ステップでの判定処理によって、体積が大きい側の度数だけが効果的に削り取られていることがわかる。
〔判定性能の評価〕
上記の実験を2回繰り返し、それぞれの容積度数分布の結果から、それぞれの実験に用いた試料液に含まれた粒子のヘマトクリット値を計算によって求めた。
ヘマトクリット値は、試料液全体の容積に対する、その試料液に含まれた粒子全体の容積の比率である。
一方、それぞれの実験に用いた各試料液のヘマトクリット値をミクロヘマトクリット法によって実際に測定した。粒子を遠沈させるための遠心器での処理は12000rpmで5分間とした。
本発明による判定法が正しければ、上記各実験によって得られた各試料液のヘマトクリット値と、計算で得られた各試料液のヘマトクリット値とは、強い相関関係を持つはずである。
図10は、上記各実験で得られた各試料液のヘマトクリット値を横軸とし、それぞれの試料液の計算で得られたヘマトクリット値を縦軸として、プロットしたグラフである。
同図からも明らかなとおり、両者の相関の度合いを表す決定計数R2の値は0.97であり、強い相関関係を持っており、本発明による判定法が正しいことがわかった。
尚、各実験で得られた各試料液の実際のヘマトクリット値が、計算で得られた各試料液のヘマトクリット値よりも全て高い値となっているのは、ヘマトクリット値に各粒子同士の間の微量な隙間が含まれているからであると推定される。
上記の実験を2回繰り返し、それぞれの容積度数分布の結果から、それぞれの実験に用いた試料液に含まれた粒子のヘマトクリット値を計算によって求めた。
ヘマトクリット値は、試料液全体の容積に対する、その試料液に含まれた粒子全体の容積の比率である。
一方、それぞれの実験に用いた各試料液のヘマトクリット値をミクロヘマトクリット法によって実際に測定した。粒子を遠沈させるための遠心器での処理は12000rpmで5分間とした。
本発明による判定法が正しければ、上記各実験によって得られた各試料液のヘマトクリット値と、計算で得られた各試料液のヘマトクリット値とは、強い相関関係を持つはずである。
図10は、上記各実験で得られた各試料液のヘマトクリット値を横軸とし、それぞれの試料液の計算で得られたヘマトクリット値を縦軸として、プロットしたグラフである。
同図からも明らかなとおり、両者の相関の度合いを表す決定計数R2の値は0.97であり、強い相関関係を持っており、本発明による判定法が正しいことがわかった。
尚、各実験で得られた各試料液の実際のヘマトクリット値が、計算で得られた各試料液のヘマトクリット値よりも全て高い値となっているのは、ヘマトクリット値に各粒子同士の間の微量な隙間が含まれているからであると推定される。
本発明によって、電気抵抗法や光学的手法によって得られるパルス波形から不正波形を効果的に排除し、正常波形のパルス波形だけを計数に採用することが可能になった。これにより、血球計数では、不正波形を計数に含まない容積度数分布グラフが得られ、より正しい診断を行うことが可能になる。
本出願は、日本で出願された特願2013-273574(出願日:2013年12月27日)を基礎としている。
Claims (8)
- 下記(A)または下記(B)の粒子計数法に従って、試料液中の各粒子に対応するパルス波形を得、そのパルス波形に基いて粒子を計数する粒子計数方法であって、
各粒子のパルス波形が計数に採用可能か否かを判定する第1の判定ステップを少なくとも有し、
該第1の判定ステップでは、判定すべきパルス波形を、それに近似する下記式(I)のガウス関数V(t)で規定されるガウス曲線に対応付け、
V(t)=Vp * exp(-t2/(2*c2)) 式(I)
(上式(I)中、tは時間の変数、Vpは判定すべきパルス波形の最大値、c2はそのガウス曲線に対応付けられたパルス波形のパルス幅Wと等しい幅を持つように決定される分散値である。)
前記ガウス曲線の分散値c2が、そのガウス曲線の高さに対応して予め定められた上限と下限の閾値の範囲以内にあるならば、そのパルス波形を計数に採用可能であると判定する、
前記粒子計数方法。
(A)アパーチャと電極対とを用いる電気抵抗法に従って、試料液中の各粒子がアパーチャを通過する際の電極間のインピーダンスの変化をパルス状の電気信号として得、該パルス状の電気信号のパルス波形に基いて粒子を計数する粒子計数法。
(B)管路とそれに直交して配置された光電センサーとを用い、管路を流れる試料液中の各粒子が光電センサーの光軸を横切ることによって得られる受光量の変化をパルス状の電気信号として得、該パルス状の電気信号のパルス波形に基いて粒子を計数する粒子計数法。 - 第2の判定ステップをさらに有し、該第2の判定ステップは、第1の判定ステップの前後にまたは並行して位置し、
該第2の判定ステップは、判定すべきパルス波形の幅Wの中央の時間Tmと、該パルス波形の最大値Vpにおける時間Tpとの間の差を演算し、その差が予め定められた閾値の範囲以内にあるならば、そのパルス波形を計数に採用可能であると判定するステップであって、
同じパルス波形に対して、第1の判定ステップと第2の判定ステップが、両方共に、計数に採用可能であると判定したときのみ、そのパルス波形を計数に採用するように構成されている、
請求項1記載の粒子計数方法。 - パルス波形をパルス幅Wについて予め選別する第1の予備選別ステップをさらに有し、
該第1の予備選別ステップは、全ての判定ステップの前に位置し、予め定められた許容範囲外のパルス幅Wを持ったパルス波形を排除するステップである、請求項1または2記載の粒子計数方法。 - パルス波形を最大値Vpについて予め選別する第2の予備選別ステップをさらに有し、
該第2の予備選別ステップは、全ての判定ステップの前に位置し、かつ、第1の予備選別ステップの後に位置し、予め定められた下限値以上の最大値Vpを持ったパルス波形を上記判定ステップへ送るステップであって、
前記下限値未満の最大値Vpを持ったパルス波形を計数に採用するように構成されてい
る、
請求項3記載の粒子計数方法。 - 下記(A)または下記(B)の粒子計数法に従って、試料液中の各粒子に対応するパルス波形を得、そのパルス波形に基いて粒子を計数するよう構成された粒子計数装置であって、
当該粒子計数装置は、粒子の計数を行うための演算部を有し、
該演算部は、各粒子のパルス波形が計数に採用可能か否かを判定する第1の判定部を少なくとも有し、
該第1の判定部は、判定すべき粒子のパルス波形を、それに近似する下記式(I)のガウス関数V(t)で規定されるガウス曲線に対応付け、
V(t)=Vp * exp(-t2/(2*c2)) 式(I)
(上式(I)中、tは時間の変数、Vpは判定すべきパルス波形の最大値、c2はそのガウス曲線に対応付けられたパルス波形のパルス幅Wと等しい幅を持つように決定される分散値である。)
前記ガウス曲線の分散値c2が、そのガウス曲線の高さに対応して予め定められた上限と下限の閾値の範囲以内にあるならば、そのパルス波形を計数に採用可能であると判定するように構成されている、
前記粒子計数装置。 - 演算部が、第2の判定部をさらに有し、
該第2の判定部は、第1の判定部の前後にまたは並行して位置し、
判定すべきパルス波形の幅Wの中央の時間Tmと、該パルス波形の最大値Vpにおける時間Tpとの間の差を演算し、その差が予め定められた閾値の範囲以内にあるならば、そのパルス波形を計数に採用可能であると判定するよう構成され、
前記演算部は、同じパルス波形に対して、第1の判定部と第2の判定部が、両方共に計数に採用可能であると判定したときのみ、そのパルス波形を計数に採用するように構成されている、
請求項5記載の粒子計数装置。 - 演算部が、パルス波形をパルス幅Wについて予め選別する第1の予備選別部をさらに有し、
該第1の予備選別部は、全ての判定部よりも先にデータ処理を行うように位置し、予め定められた許容範囲外のパルス幅Wを持ったパルス波形を排除するように構成されている、請求項5または6に記載の粒子計数装置。 - 演算部が、パルス波形を最大値Vpについて予め選別する第2の予備選別部をさらに有し、
該第2の予備選別部は、全ての判定部よりも先に選別の処理を行うように位置し、かつ、第1の予備選別部によって排除されなかったパルス波形を選別するように位置し、予め定められた下限値以上の最大値Vpを持ったパルス波形を上記判定部へ送るように構成されており、
前記演算部は、該下限値未満の最大値Vpを持ったパルス波形を計数に採用するように構成されている、
請求項7記載の粒子計数装置。
Applications Claiming Priority (2)
| Application Number | Priority Date | Filing Date | Title |
|---|---|---|---|
| JP2013-273574 | 2013-12-27 | ||
| JP2013273574 | 2013-12-27 |
Publications (1)
| Publication Number | Publication Date |
|---|---|
| WO2015099116A1 true WO2015099116A1 (ja) | 2015-07-02 |
Family
ID=53478955
Family Applications (1)
| Application Number | Title | Priority Date | Filing Date |
|---|---|---|---|
| PCT/JP2014/084488 Ceased WO2015099116A1 (ja) | 2013-12-27 | 2014-12-26 | 粒子計数方法および粒子計数装置 |
Country Status (1)
| Country | Link |
|---|---|
| WO (1) | WO2015099116A1 (ja) |
Cited By (8)
| Publication number | Priority date | Publication date | Assignee | Title |
|---|---|---|---|---|
| JPWO2017110753A1 (ja) * | 2015-12-25 | 2018-10-25 | 国立大学法人大阪大学 | 個数分析方法、個数分析装置および個数分析用記憶媒体 |
| CN110243729A (zh) * | 2018-03-09 | 2019-09-17 | 理音株式会社 | 粒子计数器 |
| US20200070167A1 (en) * | 2018-08-31 | 2020-03-05 | Vortex Biosciences, Inc. | Processing systems for isolating and enumerating cells or particles |
| CN111060443A (zh) * | 2019-12-24 | 2020-04-24 | 深圳开立生物医疗科技股份有限公司 | 一种干扰脉冲识别方法、装置、存储介质及细胞计数设备 |
| CN112444621A (zh) * | 2019-08-30 | 2021-03-05 | 深圳迈瑞生物医疗电子股份有限公司 | 血液细胞分析仪及其计数方法 |
| CN116481982A (zh) * | 2023-04-20 | 2023-07-25 | 瑞芯智造(深圳)科技有限公司 | 一种基于库尔特粒度检测仪的颗粒检测方法及检测仪 |
| US11781099B2 (en) | 2015-12-25 | 2023-10-10 | Aipore Inc. | Number analyzing method, number analyzing device, and storage medium for number analysis |
| JP2025072630A (ja) * | 2019-03-22 | 2025-05-09 | シスメックス株式会社 | 細胞の分析方法、深層学習アルゴリズムの訓練方法、細胞分析装置、深層学習アルゴリズムの訓練装置、細胞の分析プログラム及び深層学習アルゴリズムの訓練プログラム |
Citations (6)
| Publication number | Priority date | Publication date | Assignee | Title |
|---|---|---|---|---|
| JPS59171540A (ja) * | 1983-03-18 | 1984-09-28 | 富士通株式会社 | スペクトル形状利用測定方法 |
| JPS61115188A (ja) * | 1984-11-09 | 1986-06-02 | Toa Medical Electronics Co Ltd | 網状赤血球検査方法 |
| US6542833B1 (en) * | 1997-09-12 | 2003-04-01 | Foss Electric A/S | Method of checking the performance of a flow cytometer instrument and apparatus for executing said method as well as a standard kit therefore |
| US20080079929A1 (en) * | 2006-09-30 | 2008-04-03 | Shenzhen Mindray Bio-Medical Electronics Co., Ltd. | Flow cytometer |
| JP2008292448A (ja) * | 2007-04-27 | 2008-12-04 | Furukawa Electric Co Ltd:The | 光計測装置および光計測方法 |
| WO2012032981A1 (ja) * | 2010-09-10 | 2012-03-15 | オリンパス株式会社 | 単一発光粒子の光強度を用いた光分析方法 |
-
2014
- 2014-12-26 WO PCT/JP2014/084488 patent/WO2015099116A1/ja not_active Ceased
Patent Citations (6)
| Publication number | Priority date | Publication date | Assignee | Title |
|---|---|---|---|---|
| JPS59171540A (ja) * | 1983-03-18 | 1984-09-28 | 富士通株式会社 | スペクトル形状利用測定方法 |
| JPS61115188A (ja) * | 1984-11-09 | 1986-06-02 | Toa Medical Electronics Co Ltd | 網状赤血球検査方法 |
| US6542833B1 (en) * | 1997-09-12 | 2003-04-01 | Foss Electric A/S | Method of checking the performance of a flow cytometer instrument and apparatus for executing said method as well as a standard kit therefore |
| US20080079929A1 (en) * | 2006-09-30 | 2008-04-03 | Shenzhen Mindray Bio-Medical Electronics Co., Ltd. | Flow cytometer |
| JP2008292448A (ja) * | 2007-04-27 | 2008-12-04 | Furukawa Electric Co Ltd:The | 光計測装置および光計測方法 |
| WO2012032981A1 (ja) * | 2010-09-10 | 2012-03-15 | オリンパス株式会社 | 単一発光粒子の光強度を用いた光分析方法 |
Cited By (12)
| Publication number | Priority date | Publication date | Assignee | Title |
|---|---|---|---|---|
| JPWO2017110753A1 (ja) * | 2015-12-25 | 2018-10-25 | 国立大学法人大阪大学 | 個数分析方法、個数分析装置および個数分析用記憶媒体 |
| EP3396354A4 (en) * | 2015-12-25 | 2019-08-28 | Osaka University | NUMBER ANALYSIS PROCEDURE, NUMBER ANALYSIS DEVICE AND STORAGE MEDIUM FOR NUMBER ANALYSIS |
| US11597898B2 (en) | 2015-12-25 | 2023-03-07 | Aipore Inc. | Number analyzing method, number analyzing device, and storage medium for number analysis |
| US11781099B2 (en) | 2015-12-25 | 2023-10-10 | Aipore Inc. | Number analyzing method, number analyzing device, and storage medium for number analysis |
| CN110243729A (zh) * | 2018-03-09 | 2019-09-17 | 理音株式会社 | 粒子计数器 |
| US20200070167A1 (en) * | 2018-08-31 | 2020-03-05 | Vortex Biosciences, Inc. | Processing systems for isolating and enumerating cells or particles |
| US20240375103A1 (en) * | 2018-08-31 | 2024-11-14 | Vortex Biosciences, Inc. | Processing systems for isolating and enumerating cells or particles |
| JP2025072630A (ja) * | 2019-03-22 | 2025-05-09 | シスメックス株式会社 | 細胞の分析方法、深層学習アルゴリズムの訓練方法、細胞分析装置、深層学習アルゴリズムの訓練装置、細胞の分析プログラム及び深層学習アルゴリズムの訓練プログラム |
| CN112444621A (zh) * | 2019-08-30 | 2021-03-05 | 深圳迈瑞生物医疗电子股份有限公司 | 血液细胞分析仪及其计数方法 |
| CN111060443A (zh) * | 2019-12-24 | 2020-04-24 | 深圳开立生物医疗科技股份有限公司 | 一种干扰脉冲识别方法、装置、存储介质及细胞计数设备 |
| CN111060443B (zh) * | 2019-12-24 | 2022-09-30 | 深圳开立生物医疗科技股份有限公司 | 一种干扰脉冲识别方法、装置、存储介质及细胞计数设备 |
| CN116481982A (zh) * | 2023-04-20 | 2023-07-25 | 瑞芯智造(深圳)科技有限公司 | 一种基于库尔特粒度检测仪的颗粒检测方法及检测仪 |
Similar Documents
| Publication | Publication Date | Title |
|---|---|---|
| WO2015099116A1 (ja) | 粒子計数方法および粒子計数装置 | |
| CN109239360B (zh) | 一种反应曲线异常检测方法及装置 | |
| CN111801568B (zh) | 测定血小板浓度的方法及系统 | |
| CN106662572B (zh) | 细胞分析仪、粒子分类方法及装置 | |
| CN104755905B (zh) | 具有凝集块校准的血小板计数的系统和方法 | |
| CN104541149A (zh) | 用于确定白血细胞计数的方法和装置 | |
| CN104903699A (zh) | 未成熟血小板的计数系统和方法 | |
| DE3781855D1 (de) | Mittel zum kalibrieren von durchflusszytometriegeraeten und anderen analysevorrichtungen. | |
| CN106769698B (zh) | 一种基于电阻抗原理的血细胞异常脉冲信号识别处理方法 | |
| EP0874983B1 (en) | Method and apparatus for determination of hemoglobin content of individual red blood cells | |
| CN110887818A (zh) | 一种血液样本的分析方法和血液细胞分析仪及存储介质 | |
| US4797624A (en) | Method and apparatus for editing particle produced electrical pulses | |
| CN113227757B (zh) | 一种血液细胞参数修正方法、血液样本检测仪和存储介质 | |
| EP1370848A2 (en) | Method for the analysis of abnormal particle populations | |
| CN113252537B (zh) | 一种样本分析仪及其计数异常的检测方法 | |
| EP2252872B1 (en) | High resolution classification | |
| Gray et al. | A new method for cell volume measurement based on volume exclusion of a fluorescent dye | |
| EP1664737B1 (en) | A pulse height analyser | |
| JP2005077148A (ja) | 血液検査方法及び装置 | |
| US7928718B2 (en) | Method for calibrating a particle counting apparatus | |
| DE102015119027B4 (de) | Verfahren und Messeinrichtung zur Bestimmung von Blutkörperchen | |
| Bacus et al. | Clinical evaluation of a new electrical impedance instrument for counting platelets in whole blood | |
| JP2714629B2 (ja) | 粒子計数方法および装置 | |
| CN115201269A (zh) | 应用电阻抗检测血小板的方法和血液分析系统 | |
| JP2022530087A (ja) | インピーダンス信号処理による医療分析装置 |
Legal Events
| Date | Code | Title | Description |
|---|---|---|---|
| 121 | Ep: the epo has been informed by wipo that ep was designated in this application |
Ref document number: 14873374 Country of ref document: EP Kind code of ref document: A1 |
|
| NENP | Non-entry into the national phase |
Ref country code: DE |
|
| 122 | Ep: pct application non-entry in european phase |
Ref document number: 14873374 Country of ref document: EP Kind code of ref document: A1 |
|
| NENP | Non-entry into the national phase |
Ref country code: JP |