WO2015041177A1 - 画像解析装置、画像解析方法、画像解析プログラム、細胞の製造方法、細胞の培養方法、および細胞の製造装置 - Google Patents
画像解析装置、画像解析方法、画像解析プログラム、細胞の製造方法、細胞の培養方法、および細胞の製造装置 Download PDFInfo
- Publication number
- WO2015041177A1 WO2015041177A1 PCT/JP2014/074268 JP2014074268W WO2015041177A1 WO 2015041177 A1 WO2015041177 A1 WO 2015041177A1 JP 2014074268 W JP2014074268 W JP 2014074268W WO 2015041177 A1 WO2015041177 A1 WO 2015041177A1
- Authority
- WO
- WIPO (PCT)
- Prior art keywords
- image
- unit
- magnitude
- calculated
- motion
- Prior art date
- Legal status (The legal status is an assumption and is not a legal conclusion. Google has not performed a legal analysis and makes no representation as to the accuracy of the status listed.)
- Ceased
Links
Images






Classifications
-
- G—PHYSICS
- G06—COMPUTING OR CALCULATING; COUNTING
- G06T—IMAGE DATA PROCESSING OR GENERATION, IN GENERAL
- G06T7/00—Image analysis
- G06T7/20—Analysis of motion
- G06T7/246—Analysis of motion using feature-based methods, e.g. the tracking of corners or segments
-
- C—CHEMISTRY; METALLURGY
- C12—BIOCHEMISTRY; BEER; SPIRITS; WINE; VINEGAR; MICROBIOLOGY; ENZYMOLOGY; MUTATION OR GENETIC ENGINEERING
- C12M—APPARATUS FOR ENZYMOLOGY OR MICROBIOLOGY; APPARATUS FOR CULTURING MICROORGANISMS FOR PRODUCING BIOMASS, FOR GROWING CELLS OR FOR OBTAINING FERMENTATION OR METABOLIC PRODUCTS, i.e. BIOREACTORS OR FERMENTERS
- C12M41/00—Means for regulation, monitoring, measurement or control, e.g. flow regulation
- C12M41/12—Means for regulation, monitoring, measurement or control, e.g. flow regulation of temperature
- C12M41/14—Incubators; Climatic chambers
-
- C—CHEMISTRY; METALLURGY
- C12—BIOCHEMISTRY; BEER; SPIRITS; WINE; VINEGAR; MICROBIOLOGY; ENZYMOLOGY; MUTATION OR GENETIC ENGINEERING
- C12M—APPARATUS FOR ENZYMOLOGY OR MICROBIOLOGY; APPARATUS FOR CULTURING MICROORGANISMS FOR PRODUCING BIOMASS, FOR GROWING CELLS OR FOR OBTAINING FERMENTATION OR METABOLIC PRODUCTS, i.e. BIOREACTORS OR FERMENTERS
- C12M41/00—Means for regulation, monitoring, measurement or control, e.g. flow regulation
- C12M41/30—Means for regulation, monitoring, measurement or control, e.g. flow regulation of concentration
- C12M41/36—Means for regulation, monitoring, measurement or control, e.g. flow regulation of concentration of biomass, e.g. colony counters or by turbidity measurements
-
- C—CHEMISTRY; METALLURGY
- C12—BIOCHEMISTRY; BEER; SPIRITS; WINE; VINEGAR; MICROBIOLOGY; ENZYMOLOGY; MUTATION OR GENETIC ENGINEERING
- C12N—MICROORGANISMS OR ENZYMES; COMPOSITIONS THEREOF; PROPAGATING, PRESERVING, OR MAINTAINING MICROORGANISMS; MUTATION OR GENETIC ENGINEERING; CULTURE MEDIA
- C12N5/00—Undifferentiated human, animal or plant cells, e.g. cell lines; Tissues; Cultivation or maintenance thereof; Culture media therefor
- C12N5/06—Animal cells or tissues; Human cells or tissues
- C12N5/0602—Vertebrate cells
- C12N5/0652—Cells of skeletal and connective tissues; Mesenchyme
- C12N5/0657—Cardiomyocytes; Heart cells
-
- G—PHYSICS
- G01—MEASURING; TESTING
- G01N—INVESTIGATING OR ANALYSING MATERIALS BY DETERMINING THEIR CHEMICAL OR PHYSICAL PROPERTIES
- G01N33/00—Investigating or analysing materials by specific methods not covered by groups G01N1/00 - G01N31/00
- G01N33/48—Biological material, e.g. blood, urine; Haemocytometers
- G01N33/483—Physical analysis of biological material
- G01N33/4833—Physical analysis of biological material of solid biological material, e.g. tissue samples, cell cultures
-
- G—PHYSICS
- G06—COMPUTING OR CALCULATING; COUNTING
- G06T—IMAGE DATA PROCESSING OR GENERATION, IN GENERAL
- G06T7/00—Image analysis
- G06T7/0002—Inspection of images, e.g. flaw detection
- G06T7/0012—Biomedical image inspection
-
- G—PHYSICS
- G06—COMPUTING OR CALCULATING; COUNTING
- G06T—IMAGE DATA PROCESSING OR GENERATION, IN GENERAL
- G06T7/00—Image analysis
- G06T7/20—Analysis of motion
- G06T7/215—Motion-based segmentation
-
- G—PHYSICS
- G06—COMPUTING OR CALCULATING; COUNTING
- G06T—IMAGE DATA PROCESSING OR GENERATION, IN GENERAL
- G06T2207/00—Indexing scheme for image analysis or image enhancement
- G06T2207/30—Subject of image; Context of image processing
- G06T2207/30004—Biomedical image processing
- G06T2207/30024—Cell structures in vitro; Tissue sections in vitro
Definitions
- the present invention relates to an image analysis device, an image analysis method, an image analysis program, a cell manufacturing method, a cell culture method, and a cell manufacturing device.
- stem cells have both pluripotency and proliferation ability, theoretically, any number of cells can be produced.
- An application example of this technique is culture of cardiomyocytes. Since cardiomyocytes are terminally differentiated cells, they are difficult to regenerate if they are damaged by ischemic heart disease or the like. Therefore, a treatment method is considered in which stem cells are differentiated into cardiomyocytes and the obtained cardiomyocytes are transplanted into the heart.
- differentiated cells Even if differentiation induction is performed on stem cells, there are not always many cells that differentiate into target cells. Therefore, when using differentiated cells, it is necessary to distinguish and separate differentiated cells from undifferentiated cells. In consideration of actual application, it is desirable that this cell selection process is performed automatically from the viewpoint of ensuring safety and manufacturing efficiency. In addition, it is desirable to use a non-invasive technique so as not to damage the differentiated cells.
- Non-patent document 1 and non-patent document 2 disclose a technique for measuring the pulsation of the heart and cardiomyocytes from images obtained by observing the heart and cardiomyocytes in time series by applying this technique.
- Cultured cardiomyocytes have the property of autonomous pulsation.
- cardiomyocytes differentiated from stem cells can be identified automatically and non-invasively.
- Another object of the present invention is to more accurately group a group of image elements that may have imaged the same moving object.
- the image analysis apparatus includes a first calculation unit that calculates the magnitude of motion of an image element from a time-series image of beating cardiomyocytes, and the image calculated by the first calculation unit.
- a second calculation unit that calculates a feature amount based on the magnitude of movement of the element; and whether or not the image element is a predetermined image element based on the feature amount calculated by the second calculation unit
- an identification unit that identifies the image analysis apparatus.
- the computer calculates the magnitude of the movement of the image element from the time series image of the beating cardiomyocytes, and based on the calculated magnitude of the movement of the image element.
- a feature amount is calculated, and whether or not the image element is a predetermined image element is identified based on the calculated feature amount.
- the image analysis program of one embodiment of the present invention causes a computer to calculate the magnitude of motion of an image element from a time-series image of beating cardiomyocytes, and based on the calculated magnitude of motion of the image element. And an image analysis program for determining whether or not the image element is a predetermined image element based on the calculated feature quantity.
- the cell manufacturing method of one embodiment of the present invention includes a cell culturing procedure for culturing cells, an imaging procedure for imaging a cell cultured in the culturing procedure a plurality of times, and a plurality of images captured in the imaging procedure.
- a first calculation procedure for calculating the magnitude of motion of an image element included in an image, and a second calculation for calculating a feature amount based on the magnitude of motion of the image element calculated in the first calculation procedure A method for producing a cell, comprising: a calculation procedure; and an identification procedure for identifying whether or not the image element is a desired cell based on the feature amount calculated by the second calculation procedure.
- the cell culturing method of one embodiment of the present invention includes a cell culturing procedure for culturing a cell, an imaging procedure for imaging the cell cultured in the culturing procedure a plurality of times, and a plurality of images captured in the imaging procedure.
- a first calculation procedure for calculating the magnitude of the motion of the image element included in the image of the second, and a second for calculating the feature amount based on the magnitude of the motion of the image element calculated in the first calculation procedure A determination procedure for identifying whether or not the image element is a desired cell based on the feature amount calculated by the second calculation procedure, and removing the identified desired cell or A cell culturing method comprising: a cell obtaining procedure for removing cells other than the desired cells; and an obtained cell culturing procedure for further culturing the cells obtained by the cell obtaining procedure.
- the cell manufacturing apparatus of one embodiment of the present invention includes a cell culture unit that cultures cells, an imaging unit that images the cells cultured by the culture unit a plurality of times, and a plurality of images captured by the imaging unit.
- a first calculation unit that calculates the magnitude of motion of the image element included in the image of the second, and a second that calculates the feature amount based on the magnitude of motion of the image element calculated by the first calculation unit
- An identification unit for identifying whether the image element is a desired cell based on the feature amount calculated by the second calculation unit, and the identification unit is a desired cell.
- a take-out unit for taking out a cell corresponding to the identified image element.
- the image analysis apparatus includes a calculation unit that calculates a feature amount related to movement for each image element from a time-series image obtained by capturing an observation target that may include one or more moving objects in time series. And a grouping unit that groups image elements having similar feature quantities calculated by the calculation unit as candidates of a group of image elements obtained by imaging the same moving object.
- the computer calculates a feature amount related to movement for each image element from a time-series image obtained by capturing an observation target that may include one or more moving objects in time series.
- the image elements having similar calculated feature amounts are estimated and grouped as image elements obtained by imaging the same moving object.
- the image analysis program of one embodiment of the present invention calculates a feature amount relating to movement for each image element from a time-series image obtained by capturing an observation target that may include one or a plurality of moving objects in a time-series manner.
- the method for producing a cell of one embodiment of the present invention includes a cell culturing procedure for culturing a cell, an imaging procedure for imaging the cell cultured in the culturing procedure a plurality of times, and the plurality of captured images.
- a calculation procedure for calculating a feature amount relating to movement for each image element, and a grouping procedure for grouping image elements having similar calculated feature amounts as image elements obtained by imaging the same cell An identification procedure for identifying whether or not the grouped image elements are desired cells.
- the cell manufacturing apparatus of one embodiment of the present invention includes a cell culture unit that cultures cells, an imaging unit that images the cells cultured by the culture unit a plurality of times, and a plurality of images captured by the imaging unit.
- a calculation unit that calculates a feature amount related to movement for each image element, and an image element having a similar feature amount calculated by the calculation unit as an image element obtained by imaging the same cell.
- An apparatus for producing a cell comprising: an extraction unit that extracts a cell corresponding to an image element identified as being present.
- a group of image elements that may have captured the same moving object can be grouped more accurately.
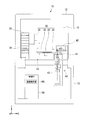
- FIG. 1 is an example of a perspective view of an incubator 10 including an image analysis unit (image analysis device) viewed from the front (in the + Y direction in the figure).
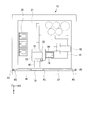
- FIG. 2 is an example of a perspective view of the incubator 10 as viewed from the top surface (+ Z direction in the drawing). In FIG. 1 and FIG. 2, the positional relationship is shown using XYZ coordinate systems orthogonal to each other.
- the temperature-controlled room 15 includes a temperature adjusting unit and a humidity adjusting unit (not shown), and the temperature-controlled room 15 is maintained in an environment suitable for cell culture (for example, an atmosphere having a temperature of 37 ° C. and a humidity of 90%). Yes.
- a large door 16, a middle door 17, and a small door 18 are arranged in front of the temperature-controlled room 15.
- the large door 16 covers the front surfaces of the upper casing 12 and the lower casing 13.
- the middle door 17 covers the front surface of the upper casing 12 and isolates the environment between the temperature-controlled room 15 and the outside when the large door 16 is opened.
- the small door 18 is a door for carrying in and out a culture vessel 19 for culturing cells, and is attached to the middle door 17. It is possible to suppress environmental changes in the temperature-controlled room 15 by carrying the culture container 19 in and out of the small door 18.
- the large door 16, the middle door 17, and the small door 18 are maintained airtight by the packings P1, P2, and P3, respectively.
- a stocker 20 In the temperature-controlled room 15, a stocker 20, a container transport unit 30, an observation unit 40, and a mounting table 45 are arranged.
- the mounting table 45 is disposed in front of the small door 18, and the culture container 19 is carried in and out through the small door
- the container transport unit 30 is disposed in the center of the temperature-controlled room 15 when viewed from the front surface of the upper casing 12.
- the container transport unit 30 transports the culture container 19 from the stocker 20 to the sample table 41 of the observation unit 40, transports the culture container 19 from the mounting table 45 to the stocker 20 or the observation unit 40, or samples the observation unit 40.
- the culture container 19 is transported from the table 41 to the stocker 20.
- the container transport unit 30 includes a vertical robot 31 having an articulated arm, a rotary stage 32, a mini stage 33, and an arm unit 34.
- the rotary stage 32 is attached to the tip of the vertical robot 31 so as to be rotatable by 180 ° in the horizontal direction (XY plane direction) about the rotation shaft 35. Therefore, the rotary stage 32 can make the arm part 34 face the stocker 20, the sample table 41, and the mounting table 45, respectively.
- the mini stage 33 is attached to the rotary stage 32 so as to be slidable in the horizontal direction.
- the mini stage 33 is provided with an arm portion 34 that holds the culture vessel 19.
- the observation unit 40 is disposed on the right side of the temperature-controlled room 15 when viewed from the front of the upper casing 12.
- the observation unit 40 can take and observe images of cells in the culture container 19 at regular time intervals. Hereinafter, such observation is also referred to as “time-lapse observation”.
- the observation unit 40 is disposed by being fitted into the opening of the base plate 14 of the upper casing 12.
- the observation unit 40 includes a sample stage 41, a stand arm 42 projecting above the sample stage 41, and a main body 43 incorporating a microscopic optical system for phase difference observation and an imaging unit 160 (described later).
- the sample table 41 and the stand arm 42 are disposed in the temperature-controlled room 15, while the main body 43 is accommodated in the lower casing 13.
- the control unit 50 includes a processor such as a CPU (Central Processing Unit), a storage unit 150 (described later) such as a HDD (Hard Disk Drive), a flash memory, a RAM (Random Access Memory), and a ROM (Read Only Memory). Yes.
- the storage unit 150 stores management data related to each culture vessel 19 stored in the stocker 20, data of a microscope image captured by the imaging unit 160, and the like. Further, the storage unit 150 stores processing results of image processing, temporary data generated during the processing, and programs executed by the CPU.
- the management data includes index data which is identification information of each culture vessel 19, the storage position of the culture vessel 19 in the stocker 20, the type and shape of the culture vessel 19 (well plate, dish, flask, etc.), culture, and the like.
- index data is identification information of each culture vessel 19, the storage position of the culture vessel 19 in the stocker 20, the type and shape of the culture vessel 19 (well plate, dish, flask, etc.), culture, and the like.
- the types of cells cultured in the container 19, the observation schedule of the culture container 19, imaging conditions at the time-lapse observation (magnification of objective lens, observation point in the container, etc.), and the like are included.
- management data may be generated for each small container.
- the control unit 50 is connected to the temperature adjustment unit, the humidity adjustment unit, the container transport unit 30 and the observation unit 40.
- the control unit 50 comprehensively controls each unit of the incubator 10 according to a predetermined program.
- the control unit 50 controls the temperature adjustment unit and the humidity adjustment unit, respectively, to maintain the inside of the temperature-controlled room 15 at a predetermined environmental condition.
- the control unit 50 controls the container transport unit 30 and the observation unit 40 based on a predetermined observation schedule, and executes time-lapse observation of the cells in the culture container 19.
- the image analysis unit 100 of the control unit 50 analyzes time-series images acquired by time-lapse observation and identifies cardiomyocytes that perform autonomous pulsation.
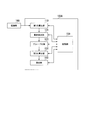
- FIG. 3 is a diagram illustrating an example of a functional configuration of the image analysis unit 100 according to the first embodiment.
- the image analysis unit 100 includes, for example, a first calculation unit 110, a region extraction unit 120, a second calculation unit 130, an identification unit 140, and a storage unit 150.
- These functional units are, for example, software functional units that function when the CPU of the control unit 50 executes a program stored in the storage unit 150.
- some or all of these functional units may be hardware functional units such as LSI (Large Scale Integration) and ASIC (Application Specific Integrated Circuit).
- the image analysis unit 100 is shown as if it is a function of the control unit 50, but the image analysis unit 100 (image analysis device) may be realized by a computer independent of the incubator 10. .
- the imaging unit 160 repeatedly images the cultured cardiomyocytes at a predetermined cycle.
- the objective lens of the microscopic optical system of the observation unit 40 is doubled, and the numerical aperture is 0.09.
- the imaging unit 160 captures an image with a resolution of 1000 ⁇ 1000 pixels. Since the objective lens of the microscopic optical system is doubled, the imaging unit 160 can image a wide range of cells with a single imaging. Therefore, the image analysis unit 100 can efficiently find even if there are few cells that have differentiated into cardiomyocytes and are beating.
- said observation conditions are an example and this embodiment is not restricted to said thing, It can apply.
- the imaging unit 160 outputs the captured time series image to the first calculation unit 110.
- the region extraction unit 120 is a region having motion in the image (hereinafter referred to as “motion region”) based on the magnitude of motion for each pixel of each time-series image input from the first calculation unit 110. To extract.
- the region extraction unit 120 outputs a set of identification information indicating each motion region and the magnitude of the motion region motion to the second calculation unit 130.
- the magnitude of the movement is, for example, associating a pixel that is considered to show the same part of the object between an image (image A) and an image (image B) immediately after that, and For each pixel B, the distance from the corresponding pixel in the image A is obtained.
- the association can be performed using, for example, a known optical flow or a block matching method. Since the magnitude of the motion is obtained for a set of temporally adjacent pixels in the time-series image, it is calculated by a number one less than the number of frames of the time-series image.
- the second calculation unit 130 calculates, for example, a plurality of feature amounts from the magnitude of movement of each motion region input from the region extraction unit 120.
- the second calculation unit 130 outputs the calculated feature amount to the identification unit 140.
- the identification unit 140 identifies whether the motion of each motion region is a pulsation of a cardiomyocyte based on the feature amount input from the second calculation unit 130.
- the identification unit 140 associates the identification result with the identification information of the motion area.
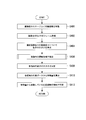
- FIG. 4 is an example of a flowchart showing the flow of cell observation, imaging, and image processing.
- the control unit 50 refers to the observation schedule in the management data, and outputs a conveyance command for the culture vessel 19 that has been observed to the vessel conveyance unit 30.
- the container transport unit 30 transports the culture container 19 to the sample stage based on the transport command of the culture container 19 input from the control unit 50.
- Step S402 the imaging unit 160 images the cells in the culture container 19 a plurality of times at a predetermined cycle. For example, the imaging unit 160 acquires an image at 15 fps (frame / second) for 4 seconds. In this case, the time series image obtained by one observation is 60 frames. The imaging unit 160 outputs the time-series images of the captured cells to the first calculation unit 110.
- Step S406 the region extraction unit 120 extracts a motion region in the image based on the magnitude of the motion input from the first calculation unit 110.
- the motion region is a set of pixels whose magnitude of motion is larger than a reference (details will be described later).
- the region extraction unit 120 assigns individual identification information to each of the extracted motion regions, and associates the coordinate groups of the pixels included in each motion region with the identification information.
- Step S408 the region extraction unit 120 calculates the motion magnitude of each motion region from the motion size of the pixels belonging to each motion region.
- the region extraction unit 120 outputs the set of the calculated magnitude of each motion region and the motion region identification information to the second calculation unit 130.
- the second calculation unit 130 calculates, for example, six feature amounts based on the magnitude of movement of each motion region.
- the six feature amounts include, for example, the maximum value of the magnitude of movement, the degree of protrusion, the time periodicity, the dispersion of the frequency spectrum, the ratio of the high frequency component to the low frequency component, and the low frequency component of the medium frequency component. Is the ratio. Note that some of these may be omitted, and other feature amounts may be calculated and used.
- the second calculation unit 130 outputs the set of the calculated six feature amounts and the identification information of the motion area to the identification unit 140.
- Step S412 the identification unit 140 identifies whether or not each motion region indicates heartbeat pulsation based on the six feature amounts input from the second calculation unit 130.
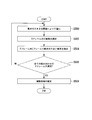
- FIG. 5 is an example of a flowchart illustrating a flow of the extraction process of the motion area from the time-series image, which is executed by the area extraction unit 120 according to the first embodiment.
- Step S500 First, the region extraction unit 120 compares the magnitude of movement for each pixel with respect to each of the time-series images, and binarizes them into a value greater than or equal to the threshold value and a value less than the threshold value. Thus, the pixel is divided into a pixel having a large motion and a pixel having a small motion.
- the region extracting unit 120 extracts five temporally continuous images from the time-series images.
- the region extraction unit 120 for example, images # 1 to # 59 for the first time if the images for which the magnitude of motion is obtained among the time-series images # 0 to # 59 for 60 frames are the images # 1 to # 59. 5. Images for five frames are taken out in order, such as images # 2 to # 6 for the second time and images # 3 to # 7 for the third time (conversely, they may be in descending order). Note that extracting five frames of images from the entire time-series image is merely an example, and the region extracting unit 120 may extract an arbitrary number of images.
- Step S504 the region extraction unit 120 extracts pixels determined to have a large motion in at least two frames out of the extracted five-frame images, and stores them in the storage unit 150.
- Step S506 the region extracting unit 120 determines whether or not all the five-frame images of all combinations are extracted from the images # 1 to # 59. If five frames of all combinations have been extracted (YES), the region extraction unit 120 transitions to step S508. If all the 5-frame images of the combination have not been extracted (NO), the region extracting unit 120 returns to step S500 and extracts the next 5-frame image.
- the region extraction unit 120 refers to all the pixels stored in the storage unit 150 in the process of step S502 of each routine, and is stored in the storage unit 150.
- a region where adjacent pixels are adjacent to each other is defined as one motion region.
- the area extraction unit 120 assigns individual identification information to each movement area and stores it in the storage unit 150 together with the coordinates occupied by the movement area.
- FIG. 6 shows cells 610 (1) to 610 (3) included in a part (600) of an image captured by the image capturing unit 160, and motion regions a to c extracted from the image by the region extracting unit 120.
- the motion area for example, three types described below are extracted.
- the motion region a is a motion region from which motion based on the pulsation of cardiomyocytes is extracted.
- the motion area is referred to as a “pulsation area”.
- the motion region b is a motion region that is extracted by the shaking of the culture solution.
- the motion region is referred to as a “liquid shaking region”.
- the motion region c is a motion region extracted by other noise elements, for example.
- the motion region is referred to as a “noise region”.
- the region extraction unit 120 confirms the magnitude of motion for each pixel in each motion region for all time-series images as follows. First, the region extraction unit 120 extracts a pixel that indicates the magnitude of the largest motion among the pixels in the motion region (“maximum motion pixel in the region”). Next, the region extraction unit 120 selects an image region of 5 ⁇ 5 pixels around the maximum motion pixel in the region. Then, the area extraction unit 120 calculates the average value of the motion magnitude of the selected 5 ⁇ 5 pixel image area for all the time-series images. The region extraction unit 120 outputs the calculated magnitude of movement for each exercise region to the second calculation unit 130 in association with the corresponding exercise region identification information.
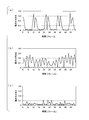
- FIG. 7 is an example of a graph showing the transition of the magnitude of movement of each motion area extracted by the area extraction unit 120.
- the horizontal axis of the graph of FIG. 7 is the frame of the time-series image, and the vertical axis is the value of the magnitude of movement.
- (a) shows a pulsation region
- (b) shows a liquid shaking region
- (c) shows a noise region.
- the image analysis unit 100 calculates a plurality of feature amounts based on the magnitude of motion, and comprehensively identifies the type of motion region using these.
- the “maximum value of the magnitude of motion” is the maximum value of the magnitude of motion for each motion region.
- the second calculation unit 130 calculates the “maximum value of the magnitude of motion” by the following equation (1).
- “t” represents time, that is, the value of the frame of the time-series image
- “D (t)” represents the value of the magnitude of motion.
- the “maximum value of the magnitude of motion” is one of D (1) to D (59). The largest value.
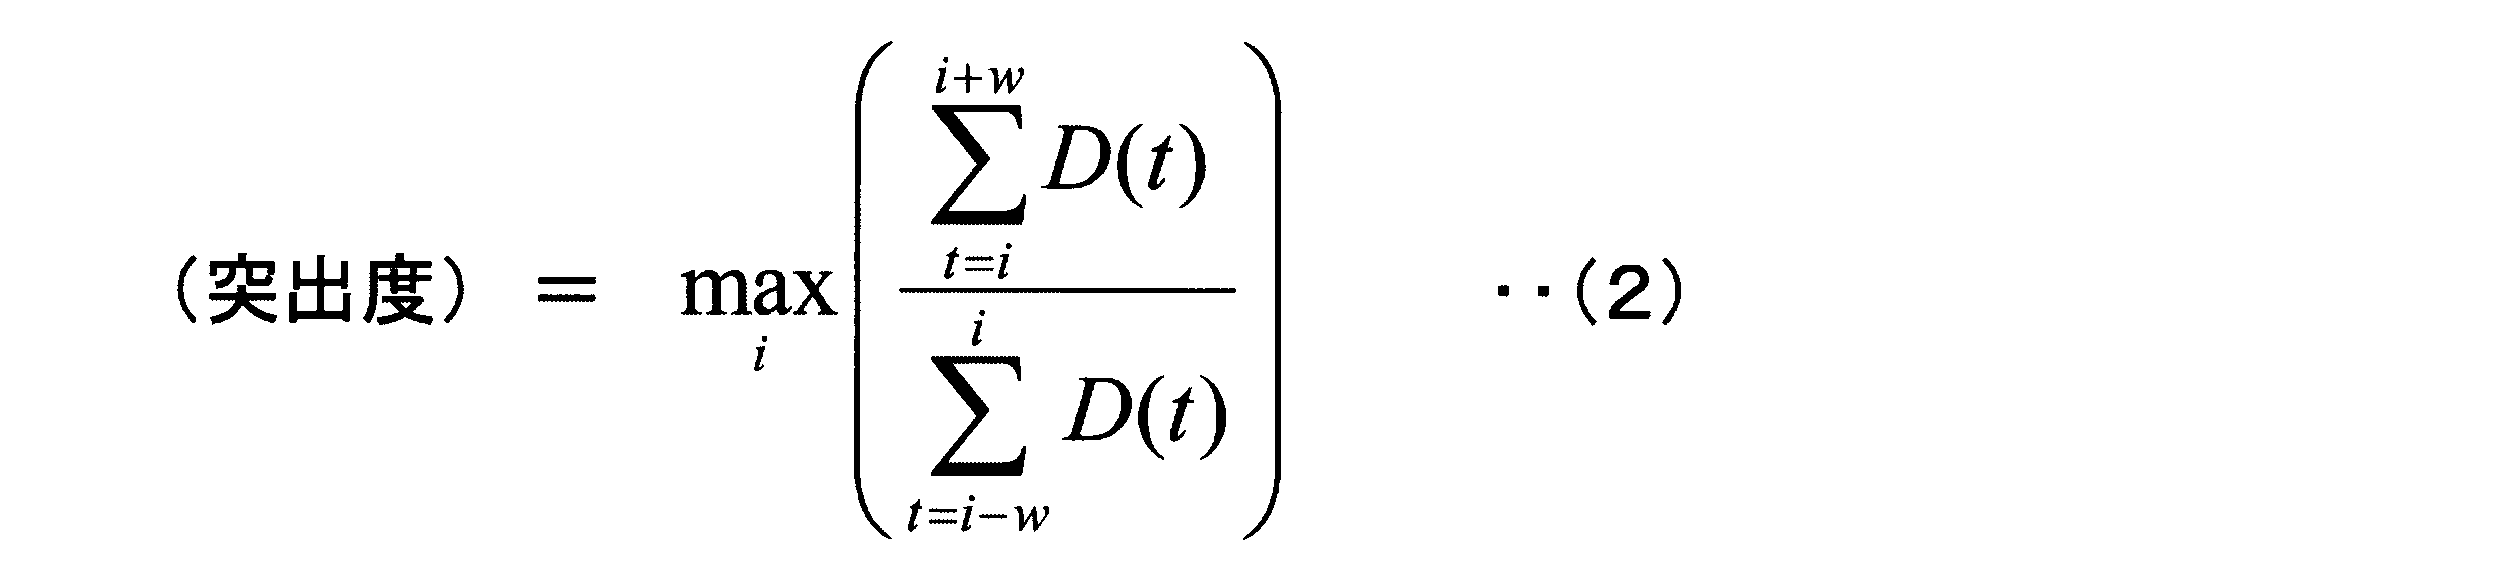
- “Projection degree” is the maximum value of the rate of change in the magnitude of motion (hereinafter referred to as “change rate”) calculated while changing the reference frame.
- the rate of change is based on a comparison of the total amount of motion in a predetermined number of frames before the reference frame of interest and the total amount of motion in a predetermined number of frames after the reference frame for each motion region. This is a calculated value. Accordingly, when the motion magnitude value is small in a predetermined number of frames before the reference frame and the motion magnitude value is large in a predetermined number of frames after the reference frame, the change rate becomes a large value.
- the second calculation unit 130 calculates the “projection degree” by Expression (2).
- w is the window size.
- the second calculation unit 130 When calculating the protrusion degree for the motion magnitudes D (1) to D (59) of a certain motion region, if the window size w is 5, the second calculation unit 130 first sets the sixth frame as the reference frame. To do. The second calculation unit 130 calculates the total sum of the magnitudes D (1) to D (6) of the motion from the first frame, which is five frames before the reference frame, to the reference frame. In addition, the second calculation unit 130 calculates the total sum of motion magnitudes D (6) to D (11) from the reference frame to the eleventh frame that is five frames after the reference frame.
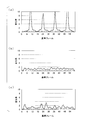
- FIG. 8 is an example of a graph showing the transition of the rate of change of the magnitude of movement in each motion area.
- the horizontal axis of the graph is a reference frame, and the vertical axis of the graph is a change rate.
- (a) shows a pulsation region
- (b) shows a liquid shaking region
- (c) shows a noise region.
- the rate of change in the magnitude of movement increases when moving from the stationary state to the motion state. Therefore, as shown in FIG. 8A, the graph of the rate of change in the magnitude of the movement of the pulsation region is particularly when the stationary state is long to some extent (for example, about 5 frames or more) and then rises greatly after that. Shows a clear peak.
- the rate of change in the magnitude of motion does not increase in a motion region where there is almost no static state such as a liquid shaking region. Therefore, as shown in FIG. 8B, the graph of the rate of change in the magnitude of the movement of the liquid shaking area does not show a clear peak.
- the graph of the change rate of the magnitude of the movement of the noise region does not show a clear peak.
- the window size should be about 1/2 to the upper limit of the lower limit (5 to 10 frames) within which the distribution of time required for a single heartbeat to pulsate is roughly within the range (5 to 10 frames). This is preferable.
- 5 frames are used as the window size.
- the calculation formula of the protrusion degree is not limited to the formula (2).
- the division may be replaced with subtraction, and the absolute value thereof may be calculated.
- the calculation of the protrusion degree is not limited to a specific formula or method, and may be any method that reflects the degree of change in the magnitude of movement.
- Time periodicity is, for example, the maximum value of the autocorrelation of the magnitude of motion calculated while changing the window interval.
- the second calculation unit 130 calculates “time periodicity” by the following equation (3).
- ⁇ is a window interval.
- N is the total number of frames (for example, 59).
- the 2nd calculation part 130 calculates
- the second calculator 130 determines the motion magnitudes D (1) to D (58) and the motion magnitudes D (2) to D (59) shifted by one frame. ) With one to one.
- the second calculation unit 130 calculates a product (D (1) ⁇ D (2), D (2) ⁇ D (3),...) For each pair of associated motion magnitudes.
- the second calculation unit 130 calculates an average value of the calculated products.
- the calculated product has a large value when the magnitudes of the movements associated with each other are large.
- the second calculation unit 130 calculates the autocorrelation when the frame interval is shifted to 58 frames by sequentially changing the window interval, for example, 1 frame for the first time and 2 frames for the second time.
- “Time periodicity” is the maximum value of autocorrelation calculated for each frame for each motion region. Therefore, when the magnitude of movement has periodicity, “time periodicity” shows a large value. Conversely, when the magnitude of the movement is poor in periodicity, “time periodicity” shows a low value.
- FIG. 9 is an example of a graph showing the transition of autocorrelation of the magnitude of movement in each motion area.
- the horizontal axis of the graph is the window interval ⁇ of the time series image, and the vertical axis of the graph is autocorrelation.
- 9A shows a pulsation region
- FIG. 9B shows a liquid shaking region
- FIG. 9C shows a noise region.
- the movement in the pulsation region and the liquid shaking region shows a certain degree of periodicity. Therefore, as shown in FIGS. 9A and 9B, the autocorrelation of the pulsation region and the liquid shaking region shows a peak corresponding to the change in the window interval.
- the autocorrelation of the noise region does not show a clear peak. Therefore, “time periodicity” is an effective feature amount for appropriately excluding a noise region.
- the “low frequency component” is a frequency component having a frequency of 1 to 6 [Hz], for example.
- FIG. 10 is an example of a graph showing an example of a frequency spectrum of the magnitude of motion in each motion region. The horizontal axis of the graph is frequency, and the vertical axis of the graph is power spectral density. In FIG. 10, (a) shows a pulsation region, (b) shows a liquid shaking region, and (c) shows a noise region.
- “High / low frequency component ratio” is the ratio of the high frequency component to the low frequency component of the magnitude of motion. As shown in FIGS. 10A and 10B, the magnitude of the movement of the liquid shaking area tends to have more high-frequency components than the magnitude of the movement of the pulsating area. Therefore, the “high / low frequency component ratio” is an effective feature amount for distinguishing between the pulsation region and the liquid shaking region.
- “Medium / low frequency component ratio” is the ratio of the medium frequency component to the low frequency component of the magnitude of motion. As shown in FIGS. 10A and 10B, the magnitude of the movement of the pulsation area tends to have more medium frequency components than the magnitude of the movement of the liquid shaking area. Therefore, the “medium / low frequency component ratio” is an effective feature amount for distinguishing between the pulsation region and the liquid shaking region.
- the second calculation unit 130 may classify the frequency components more finely, or may divide the frequency components into two instead of three.
- the “high / low frequency component ratio” and “medium / low frequency component ratio” are examples of feature amounts based on the frequency spectrum.
- the second calculation unit 130 calculates, for example, the power spectrum density of the high-frequency component and the medium-frequency component itself, the power spectrum density normalized by some reference, or the sum of these operations as the feature amount. May be.
- Dispersion of frequency spectrum is the dispersion of frequency components of the magnitude of motion.
- the magnitude of the movement of the pulsation region and the liquid shaking region is periodic. Therefore, the dispersion of the frequency spectrum in the pulsation region and the liquid shaking region becomes small.
- the magnitude of the movement of the noise region is not periodic. For this reason, the frequency spectrum of the noise region does not show a specific peak, and the dispersion of the frequency spectrum becomes large. Accordingly, “frequency spectrum dispersion” is an effective feature amount for suitably excluding the noise region.
- the second calculation unit 130 may calculate feature quantities other than the six described above.
- the luminance of the region can also be an effective index for cell identification. This is because the cell region often has lower luminance than the liquid shaking region and the noise region.
- the second calculation unit 130 may calculate various feature amounts in addition to the above-described feature amounts based on the magnitude of the motion region movement and the region-specific value.
- the identification unit 140 classifies each motion region into one of a pulsation region, a liquid shaking region, and a noise region based on the feature amount calculated by the second calculation unit 130.
- a k-neighbor method can be used as a method for identifying a motion region.
- the image analysis unit 100 performs identification using teacher data stored in advance in the storage unit 150.
- the identification unit 140 adds the distance in the coordinate space with each feature quantity as a coordinate axis to the data of the unknown motion area. As many teacher data as possible are detected. Then, the identification unit 140 determines that the largest type of region among the k types of regions of the teacher data is the type of motion region whose classification is unknown. The identification unit 140 stores the identification information of the exercise area and the identified type of the exercise area in the storage unit 150 in association with each other. The information stored in the storage unit 150 may or may not be used as teacher data thereafter.
- the identification unit 140 is not limited to the k-neighbor method, and may use a support vector machine, a discriminant analysis, a decision tree, or the like to identify a motion region.
- the identification unit 140 compares the data of the area whose type is unknown and the five data in the vicinity thereof. Five pieces of data in the vicinity of the data “x” of the region of unknown type are included in a circular region 700 centered on “x” in FIG. Of the five data in the vicinity of “x”, three are liquid shaking regions and the remaining two are pulsation regions. Therefore, the identification unit 140 determines that the region with unknown classification indicating “x” is a liquid shaking region from the majority of the types of the five nearby regions.
- the second calculation unit 130 calculates a plurality of feature amounts, and the identification unit 140 determines that the motion region is a pulsation region based on the plurality of feature amounts. In order to identify whether or not there is a pulsation region, even if it is difficult to identify with only one feature amount, the pulsation region can be accurately identified.
- the second calculation unit 130 calculates the degree of protrusion based on a comparison of the magnitude of movement between two window sizes (time zones) that move back and forth in time. Since the calculating unit 140 identifies whether or not the motion region is a pulsation region based on the degree of protrusion, it can accurately identify even a pulsation region that does not puls very frequently. it can. In addition, according to the image analysis unit 100 of the first embodiment, the second calculation unit 130 performs 1/2 to the upper limit of the lower limit value of the time required for one heartbeat (about 5 to 10 frames). Since the protrusion degree is calculated using the time of the value as the window size, the pulsation region can be more accurately identified.
- the second calculation unit 130 calculates a feature amount based on the frequency spectrum of the magnitude of motion, and the identification unit 140 uses this to calculate the motion region.
- the identification unit 140 uses this to calculate the motion region.
- the exercise area identified as the pulsation area may be displayed on the display unit with a color such as red.
- region may become clear by enclosing the identified exercise
- an addition means such as a pipette for adding a drug to be studied may be provided to desired cells cultured by continuous culture.
- the adding means may be arranged outside the incubator in consideration of the problem of contamination (mixing of germs and the like) due to diffusion of the added chemical into the incubator.
- the incubator 10 may be configured as a cell manufacturing apparatus including a manipulator (extraction unit) that automatically extracts cells of a part identified as a pulsation region. The same applies to second to fourth embodiments described later.
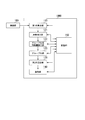
- FIG. 12 is a diagram illustrating an example of a functional configuration of the image analysis unit 100A according to the second embodiment.
- the image analysis unit 100A is a function of the control unit 50 of the incubator 10, or is realized by a computer independent of the incubator 10, for example.
- the image analysis unit 100A includes, for example, a first calculation unit 110, a pixel extraction unit 121, a grouping unit 123, a second calculation unit 130, an identification unit 140, and a storage unit 150.
- These functional units are, for example, software functional units that function when the CPU of the control unit 50 executes a program stored in the storage unit 150. Further, some or all of these functional units may be hardware functional units such as LSI and ASIC.
- the first calculation unit 110 calculates the magnitude of motion for each pixel of the image, as in the first embodiment. Similar to the region extraction unit 120 of the first embodiment, the pixel extraction unit 121 extracts pixels with large motion based on the magnitude of motion for each pixel in each time-series image, and stores the pixel in the storage unit 150. . That is, the pixel extraction unit 121 performs the processes of steps S500 to S506 in the flowchart of FIG.
- the grouping unit 123 assigns pixels having similar motion magnitude (an example of a feature amount related to motion) between the “pixels having a large motion magnitude” extracted by the pixel extraction unit 121 to the same cardiomyocyte. Are grouped as a group of candidate pixels.
- the pixels grouped by the grouping unit 123 are handled in the same manner as the “motion area” in the first embodiment. That is, the grouping unit 123 extracts a pixel (“maximum motion pixel in the region”) that indicates the magnitude of the largest motion among the pixels in each group (motion region), and surroundings the maximum motion pixel in the region 5.
- a 5 ⁇ 5 pixel image area is selected, and an average value of the motion magnitude of the selected 5 ⁇ 5 pixel image area is calculated for all the time-series images. Then, the grouping unit 123 outputs the calculated magnitude of movement for each exercise area together with the corresponding exercise area identification information to the second calculation unit 130.
- the grouping unit 123 extracts some pixels (hereinafter referred to as “representative pixels”) having a particularly large magnitude of motion from the pixels extracted by the pixel extraction unit 121.
- “Especially large” means, for example, that the magnitude of motion is equal to or greater than a second threshold value that is larger than the threshold value used when the pixel extraction unit 121 performs extraction. Instead of this, for example, a pixel having a high motion number of about several [%] may be used as the representative pixel.
- the grouping unit 123 calculates the similarity for the combination of the representative pixel and all the other pixels, and includes the representative pixel and the other pixels in the same group when the similarity is, for example, a threshold value or more.
- the grouping unit 123 may include representative pixels in the same group.
- the similarity is calculated by, for example, the normalized cross correlation expressed by the equation (4).
- D (t) is the magnitude of motion
- D with an overline is the average value of the magnitude of motion
- N is the total number of frames (for example, 59). Accordingly, the degree of similarity of the movement magnitude D (t) can be appropriately quantified.
- the grouping unit 123 may reflect the distance between the pixels in the calculation of the similarity so that the similarity of the pixels having a large distance is calculated to be low.
- the grouping unit 123 may calculate the similarity by multiplying an index value such as normalized cross-correlation by the reciprocal of the distance or the reciprocal of the square of the distance. Equation (5) indicates the similarity obtained by multiplying the normalized cross-correlation by the reciprocal of the distance.
- X 12 is the distance between the pixel 1 and the pixel 2. In this way, it is possible to prevent pixels that are distant from each other and that happen to have similar movement cycles from being included in the same group.
- the motion region can be more appropriately cut out.
- pixels adjacent to each other are used as a group of pixels, that is, a motion region.
- each myocardial pulsation has a specific period, and if the pixels are obtained by imaging the same myocardial cells, they move in the same period.
- the portion is “small motion” by the pixel extraction unit 121.
- one cardiomyocyte is imaged across pixels that are separated from each other. In some cases.
- the image analysis unit 100A of the second embodiment in order to treat a plurality of pixels moving in the same cycle as one movement region, the magnitude of movement is extracted for each pixel as a time-series one-dimensional signal, By calculating the similarity between the pixels based on the one-dimensional signal, it is possible to extract pixels that move in the same cycle.
- pixels that should originally belong to one pulsation region are treated as separate motion regions, or conversely, two pulsation regions are treated as one motion region. Can be reduced.
- FIG. 13 shows cardiomyocytes 810 (1) and 810 (2) included in a part (800) of an image captured by the imaging unit 160, and a pixel MP that has been determined to be “large in motion” by the pixel extraction unit 121.
- FIG. 4 is a diagram illustrating an example of motion areas d and e extracted by the grouping unit 123.
- the pixels MP determined to be “large in motion” by the pixel extraction unit 121 may appear as pixel groups that are separated from each other even if the same cardiomyocytes 810 are imaged.
- the image analysis unit 100A of the second embodiment can include pixels obtained by imaging the same cardiomyocytes in the same motion region.
- the second calculation unit 130 and the identification unit 140 perform the same processing as in the first embodiment. The description about this is omitted.
- the image analysis unit 100A of the second embodiment by calculating the similarity of pixels having a large relative distance to be low, pixels that are unlikely to have originally imaged the same cardiomyocytes are detected. , It can be prevented from being included in the same group.
- the grouping unit 123 performs grouping on the basis of representative pixels with particularly large motion, but instead, all combinations of pixels extracted by the pixel extraction unit 121 are used. Similarity may be calculated for and grouped. Also, if the pixel extraction unit 121 is omitted and the pixel extraction unit 121 exists, the grouping unit 123 calculates the similarity for all pixel combinations including pixels that are excluded because the movement is small, and grouping is performed. You may go.
- FIG. 14 is a diagram illustrating an example of a functional configuration of the image analysis unit 100B according to the third embodiment.
- the image analysis unit 100B is a function of the control unit 50 of the incubator 10 or is realized by a computer independent of the incubator 10, for example.
- the image analysis unit 100B includes, for example, a first calculation unit 110, a pixel extraction unit 121, a grouping feature amount calculation unit 122, a grouping unit 123, a second calculation unit 130, and an identification unit 140.
- a storage unit 150 are, for example, software functional units that function when the CPU of the control unit 50 executes a program stored in the storage unit 150. Further, some or all of these functional units may be hardware functional units such as LSI and ASIC.
- the first calculation unit 110 calculates the magnitude of motion for each pixel of the image, as in the first embodiment. Similar to the region extraction unit 120 of the first embodiment, the pixel extraction unit 121 extracts pixels with large motion based on the magnitude of motion for each pixel in each time-series image, and stores the pixel in the storage unit 150. . That is, the pixel extraction unit 121 performs the processes of steps S500 to S506 in the flowchart of FIG.
- the grouping feature amount calculation unit 122 calculates, for example, a plurality of feature amounts for each pixel determined to be “large in motion” by the pixel extraction unit 121.
- the feature amount calculated by the grouping feature amount calculation unit 122 includes, for example, the change rate of the magnitude of motion (in parentheses in the expression (2)) and the frequency component of the magnitude of motion described in the first embodiment. Ratio.
- the grouping part 123 which concerns on 2nd Embodiment extracts some representative pixels from the pixel extracted by the pixel extraction part 121, for example like 2nd Embodiment, A representative pixel and all other pixels A clustering analysis is performed on a plurality of feature amounts using a method such as mean shift, and pixel groups that belong to the same group by clustering are grouped into one motion region as pixels having similar feature amounts.
- the feature amount may include both the magnitude of the motion calculated by the first calculation unit 110 and the feature amount calculated by the grouping feature amount calculation unit 122.
- the grouping unit 123 may include representative pixels in the same group. Further, the grouping unit 123 may calculate a similarity by obtaining a normalized cross-correlation for a plurality of feature amounts.
- the motion area can be more appropriately cut out. Since this is the same as in the second embodiment, a description thereof will be omitted.
- the second calculation unit 130 and the identification unit 140 perform the same processing as in the first embodiment.
- a process may be performed in which a pixel having a large relative distance is less likely to belong to the same motion region.
- the grouping unit 123 performs grouping on the basis of representative pixels with particularly large motion, but instead, all combinations of pixels extracted by the pixel extraction unit 121 are used. Similarity may be calculated for and grouped. Also, if the pixel extraction unit 121 is omitted and the pixel extraction unit 121 exists, the grouping unit 123 performs clustering analysis or similarity calculation for all pixel combinations including pixels that are excluded because the movement is small. And grouping may be performed.
- FIG. 15 is a diagram illustrating an example of a functional configuration of an image analysis unit 100C according to the fourth embodiment.
- the image analysis unit 100C is a function of the control unit 50 of the incubator 10, or is realized by a computer independent of the incubator 10, for example.
- the image analysis unit 100C includes, for example, a first calculation unit 110, a region extraction unit 120, a second calculation unit 130, an identification unit 140, a region resetting unit 145, and a storage unit 150.
- These functional units are, for example, software functional units that function when the CPU of the control unit 50 executes a program stored in the storage unit 150. Further, some or all of these functional units may be hardware functional units such as LSI and ASIC.
- LSI and ASIC hardware functional units
- the region resetting unit 145 determines whether one or a plurality of motion regions identified as the pulsation region by the identification unit 140 are due to the same cardiomyocytes, and resets the pulsation region. .
- FIG. 16 is a diagram schematically illustrating an example of a processing flow by the region resetting unit 145.
- the cardiomyocytes 910 (1) and 910 (2) included in a part (900) of the image captured by the imaging unit 160 and the pulsation region are identified by the identification unit 140. Beating regions f and g are shown.
- FIG. 16A the cardiomyocytes 910 (1) and 910 (2) included in a part (900) of the image captured by the imaging unit 160 and the pulsation region are identified by the identification unit 140. Beating regions f and g are shown.
- FIG. 16A the cardiomyocytes 910 (1) and 910 (2) included in a part (900) of the image captured by the imaging unit 160 and the pulsation region are identified by the identification unit 140. Be
- the heel pulsation regions f and g obtained by imaging the same cardiomyocyte 910 (1) are output as separate pulsation regions by the first calculation unit 110 to the identification unit 140.
- the pulsation region g includes cardiomyocytes 910 (2) different from the cardiomyocytes (1).
- the region resetting unit 145 resets the pulsation region in view of the possibility of such a situation.
- the region resetting unit 145 searches for a constricted portion in the shape of the pulsation region, for example, and divides the pulsation region into a plurality of regions.
- the constricted portion can be found by, for example, dividing the shape while changing the position and inclination of the dividing line and obtaining a dividing line having a minimum length.
- the region resetting unit 145 may divide the pulsation region randomly (randomly or in a lattice shape of a desired size). Further, the area resetting unit 145 may not divide a pulsating area having a small size as in the pulsating area f illustrated in FIG.
- the pulsation region g is divided into pulsation regions g-1 and g-2.
- the area resetting unit 145 calculates, for example, the magnitude of movement for each of the pulsation areas f, g-1, and g-2.
- the area resetting unit 145 may calculate other feature quantities related to the movement instead of or in addition to the magnitude of the movement.
- the magnitude of the motion of the pulsation area is, for example, an image of 5 ⁇ 5 pixels around the maximum motion pixel in the area showing the largest magnitude of motion among the pixels in the pulsation area, as in the first embodiment.
- An area is selected and obtained as an average value of the magnitude of motion of the selected 5 ⁇ 5 pixel image area.
- the region resetting unit 145 calculates the degree of similarity by, for example, obtaining a correlation coefficient between the magnitudes of the motions calculated for each of the pulsation regions f, g ⁇ 1, and g-2 (see FIG. 16 (B)).
- the correlation coefficient between the pulsation regions f and g-1 is high and the correlation coefficient between the pulsation regions g-1 and g-2 is low.
- the region resetting unit 145 newly resets the pulsation regions f and g-1 as one pulsation region h, and newly sets the pulsation region g-2 as one pulsation region i. Reset is performed (see FIG. 16C).
- the area resetting unit 145 can more accurately group a group of pixels that may have imaged the same cardiomyocytes.
Landscapes
- Engineering & Computer Science (AREA)
- Health & Medical Sciences (AREA)
- Life Sciences & Earth Sciences (AREA)
- Chemical & Material Sciences (AREA)
- Biomedical Technology (AREA)
- Physics & Mathematics (AREA)
- Zoology (AREA)
- Bioinformatics & Cheminformatics (AREA)
- Organic Chemistry (AREA)
- Wood Science & Technology (AREA)
- General Health & Medical Sciences (AREA)
- General Physics & Mathematics (AREA)
- Biochemistry (AREA)
- Genetics & Genomics (AREA)
- Biotechnology (AREA)
- Analytical Chemistry (AREA)
- General Engineering & Computer Science (AREA)
- Microbiology (AREA)
- Computer Vision & Pattern Recognition (AREA)
- Theoretical Computer Science (AREA)
- Multimedia (AREA)
- Sustainable Development (AREA)
- Molecular Biology (AREA)
- Urology & Nephrology (AREA)
- Pathology (AREA)
- Immunology (AREA)
- Optics & Photonics (AREA)
- Medicinal Chemistry (AREA)
- Biophysics (AREA)
- Food Science & Technology (AREA)
- Hematology (AREA)
- Thermal Sciences (AREA)
- Medical Informatics (AREA)
- Cell Biology (AREA)
- Nuclear Medicine, Radiotherapy & Molecular Imaging (AREA)
- Rheumatology (AREA)
- Radiology & Medical Imaging (AREA)
- Quality & Reliability (AREA)
- Cardiology (AREA)
- Apparatus Associated With Microorganisms And Enzymes (AREA)
Abstract
Description
本願は、2013年9月18日に出願された日本国特願2013-193545号及び2013年9月18日に出願された日本国特願2013-193520号に基づき優先権を主張し、その内容をここに援用する。
[インキュベータの構成]
図1は、画像解析部(画像解析装置)を含むインキュベータ10を正面(図中、+Y方向)から見た透視図の一例である。また図2は、インキュベータ10を上面(図中、+Z方向)から見た透視図の一例である。図1および図2においては、互いに直交するXYZ座標系を用いて位置関係を示している。
以下、自律的な拍動を行う心筋細胞の識別について説明する。図3は、第1実施形態に係る画像解析部100の機能構成の一例を示す図である。画像解析部100は、例えば、第1の算出部110と、領域抽出部120と、第2の算出部130と、識別部140と、記憶部150とを備える。これらの機能部は、例えば、制御部50のCPUが記憶部150に格納されたプログラムを実行することにより機能するソフトウェア機能部である。また、これらの機能部の一部または全部は、LSI(Large Scale Integration)やASIC(Application Specific Integrated Circuit)等のハードウェア機能部であってもよい。また、図1では、画像解析部100が制御部50の一機能であるかのように示したが、画像解析部100(画像解析装置)は、インキュベータ10から独立したコンピュータにより実現されてもよい。
動きの大きさは、時系列画像のうち時間的に隣接する画素の組について得られるため、時系列画像のフレーム数よりも1少ない数だけ算出される。
図4は、細胞の観察、撮像、及び画像処理の流れを示すフローチャートの一例である。
(ステップS400)まず、制御部50が、管理データ内の観察スケジュールを参照し、観察時期が到来した培養容器19の搬送命令を容器搬送部30に出力する。容器搬送部30は、制御部50から入力された培養容器19の搬送命令に基づき、前記培養容器19を試料台に搬送する。
(ステップS500)まず、領域抽出部120は、時系列画像の各画像について、画素毎の動きの大きさを、それぞれ閾値と比較し、閾値以上のものと閾値未満のものとに二値化することで、動きの大きい画素と小さい画素とに分ける。
ここで、各運動領域の動きの大きさの特徴について説明する。図7は、領域抽出部120によって抽出された各運動領域の動きの大きさの推移を示すグラフの一例である。図7のグラフの横軸は時系列画像のフレームであり、縦軸は動きの大きさの値である。また、図7において、(a)は拍動領域を、(b)は液揺れ領域を、(c)はノイズ領域を示す。
特徴量の算出について詳述する。本実施形態では、第2の算出部130は、運動領域の動きの大きさに基づいて、以下の6つの特徴量を算出する。第2の算出部130は、算出した6つの特徴量と領域の識別情報とを対応付けて、識別部140に出力する。


第2の算出部130は、対応付けられた動きの大きさの組についてそれぞれ積(D(1)×D(2)、D(2)×D(3)、‥)を算出する。次に、第2の算出部130は、算出された積の平均値を算出する。算出される積は、組として対応付けられた動きの大きさが共に大きいときに大きい値となる。また、平均値であるので、動きの大きさのフレーム毎の変化について、元の動きの大きさと窓間隔分ずらした動きの大きさとが組全体において類似しているときに、自己相関は大きくなる。そして、第2の算出部130は、例えば、1回目は1フレーム、2回目は2フレームというように順に窓間隔を変えていき、58フレームまでフレームをずらしたときの自己相関を算出する。「時間周期性」は、各運動領域について、フレーム毎に算出された自己相関の最大値である。従って、動きの大きさが周期性を持つとき、「時間周期性」は大きな値を示す。その逆に、動きの大きさが周期性に乏しいとき、「時間周期性」は低い値を示す。
(5)「中/低周波成分比」は、動きの大きさの低周波成分に対する中周波数成分の比である。図10(a)及び(b)に示すように、拍動領域の動きの大きさは、液揺れ領域の動きの大きさと比較して、中周波成分が多い傾向にある。従って、「中/低周波成分比」は、拍動領域と液揺れ領域との識別に有効な特徴量である。
以下、運動領域の識別方法について詳述する。識別部140は、第2の算出部130が算出した特徴量に基づいて、各運動領域を、拍動領域、液揺れ領域、またはノイズ領域のいずれかに分類する。運動領域の識別方法には、例えば、k-近傍法を用いることができる。k-近傍法による識別を行う場合、画像解析部100は、予め記憶部150に記憶されている教師データを用いて識別を行う。
本実施形態において、識別部140は、6つの特徴量を用いて運動領域の種類の識別を行うが、図11は、簡易的に2つの特徴量を用いた場合を示している。図11は、横軸を特徴量1、縦軸を特徴量2としている。図11には、それぞれの種類の運動領域の教師データがプロットされている。図11にプロットされている「○」は拍動領域の教師データであり、「□」は液揺れ領域の教師データであり、「△」はノイズ領域の教師データである。「×」は、領域抽出部120によって抽出された分類未知の運動領域であり、第2の算出部130によって算出された特徴量に基づいて、図11中の対応する位置にプロットされている。
以上説明したように、第1実施形態の画像解析部100によれば、第2の算出部130が、領域抽出部120により算出された運動領域毎の動きの大きさに基づいて特徴量を算出し、識別部140が、第2の算出部130により算出された特徴量に基づいて運動領域が拍動領域であるか否かを識別するため、拍動領域(すなわち自律的な運動をする運動領域=画像要素)を、より正確に識別することができる。
[構成]
以下、第2実施形態に係る画像解析部(画像解析装置)について説明する。第1実施形態と同様の構成要素については、説明を省略する。図12は、第2実施形態に係る画像解析部100Aの機能構成の一例を示す図である。画像解析部100Aは、第1実施形態と同様、例えば、インキュベータ10の制御部50の一機能であり、或いはインキュベータ10から独立したコンピュータにより実現される。画像解析部100Aは、例えば、第1の算出部110と、画素抽出部121と、グループ化部123と、第2の算出部130と、識別部140と、記憶部150とを備える。これらの機能部は、例えば、制御部50のCPUが記憶部150に格納されたプログラムを実行することにより機能するソフトウェア機能部である。また、これらの機能部の一部または全部は、LSIやASIC等のハードウェア機能部であってもよい。
類似度は、例えば、式(4)で表される正規化相互相関により算出される。式中、D(t)は、動きの大きさであり、上線付きのDは、動きの大きさの平均値であり、Nは、総フレーム数(例えば59)である。これによって、動きの大きさD(t)の推移が類似する程度を、適切に数値化することができる。


以上説明した第2実施形態の画像解析部100Aによれば、動きの大きさの推移が類似する画素を同じグループに含めることで、同一の運動物体(心筋細胞)を撮像した可能性がある一群の画素を、より正確にグループ化することができる。
以下、第3実施形態に係る画像解析部(画像解析装置)について説明する。第1実施形態と同様の構成要素については、説明を省略する。図14は、第3実施形態に係る画像解析部100Bの機能構成の一例を示す図である。画像解析部100Bは、第1実施形態と同様、例えば、インキュベータ10の制御部50の一機能であり、或いはインキュベータ10から独立したコンピュータにより実現される。画像解析部100Bは、例えば、第1の算出部110と、画素抽出部121と、グループ化用特徴量算出部122と、グループ化部123と、第2の算出部130と、識別部140と、記憶部150とを備える。これらの機能部は、例えば、制御部50のCPUが記憶部150に格納されたプログラムを実行することにより機能するソフトウェア機能部である。また、これらの機能部の一部または全部は、LSIやASIC等のハードウェア機能部であってもよい。
以上説明した第3実施形態の画像解析部100Bによれば、画素毎に算出された複数の特徴量に基づいてクラスタリング分析を行うことによりグループ化された一群の画素を運動領域とすることで、同一の運動物体(心筋細胞)を撮像した可能性がある一群の画素を、より正確にグループ化することができる。
以下、第4実施形態に係る画像解析部(画像解析装置)について説明する。第1実施形態と同様の構成要素については、説明を省略する。図15は、第4実施形態に係る画像解析部100Cの機能構成の一例を示す図である。画像解析部100Cは、第1実施形態と同様、例えば、インキュベータ10の制御部50の一機能であり、或いはインキュベータ10から独立したコンピュータにより実現される。画像解析部100Cは、例えば、第1の算出部110と、領域抽出部120と、第2の算出部130と、識別部140と、領域再設定部145と、記憶部150とを備える。これらの機能部は、例えば、制御部50のCPUが記憶部150に格納されたプログラムを実行することにより機能するソフトウェア機能部である。また、これらの機能部の一部または全部は、LSIやASIC等のハードウェア機能部であってもよい。第1の算出部110、領域抽出部120、第2の算出部130、および識別部140については、第1実施形態と同様であるため、説明を省略する。
以上説明した第4実施形態の画像解析部100Cによれば、識別部140によって拍動領域であると識別された一または複数の運動領域について、同じ心筋細胞によるものであるか否かを判定し、拍動領域の再設定を行うため、同一の運動物体(心筋細胞)を撮像した可能性がある一群の画素を、より正確にグループ化することができる。
例えば、上記各実施形態の処理は、心筋細胞とは別の観察対象に対して行われてもよい。
Claims (19)
- 拍動する心筋細胞の時系列画像から画像要素の動きの大きさを算出する第1の算出部と、
前記第1の算出部により算出された前記画像要素の動きの大きさに基づいて特徴量を算出する第2の算出部と、
前記第2の算出部により算出された前記特徴量に基づいて前記画像要素が所定の画像要素であるか否かを識別する識別部と、
を備える画像解析装置。 - 前記第2の算出部は、複数の特徴量を算出し、
前記識別部は、前記複数の特徴量に基づいて前記画像要素が所定の画像要素であるか否かを識別する、
請求項1に記載の画像解析装置。 - 前記第2の算出部は、前記時系列画像のうち時間的に前後する2つの時間帯のそれぞれの画像における画像要素の動きの大きさの比較に基づいて前記特徴量を算出する、
請求項1又は2記載の画像解析装置。 - 前記第2の算出部は、1回の拍動に要する時間の分布における下限値の1/2倍から上限値程度の時間を、前記時間帯の長さとして、前記特徴量を算出する、
請求項3記載の画像解析装置。 - 前記第2の算出部は、前記画像要素の動きの大きさの周波数スペクトルを算出し、前記算出した周波数スペクトルに基づいて前記特徴量を算出する、
請求項1から4のうちいずれか一項に記載の画像解析装置。 - コンピュータが、
拍動する心筋細胞の時系列画像から画像要素の動きの大きさを算出し、
前記算出された画像要素の動きの大きさに基づいて特徴量を算出し、
前記算出された特徴量に基づいて前記画像要素が所定の画像要素であるか否かを識別する、
画像解析方法。 - コンピュータに、
拍動する心筋細胞の時系列画像から画像要素の動きの大きさを算出させ、
前記算出された画像要素の動きの大きさに基づいて特徴量を算出させ、
前記算出された特徴量に基づいて前記画像要素が所定の画像要素であるか否かを識別させる、
画像解析プログラム。 - 細胞を培養する細胞の培養手順と、
前記培養手順において培養される細胞を複数回撮像する撮像手順と、
前記撮像手順において撮像された複数の画像に含まれる画像要素の動きの大きさを算出する第1の算出手順と、
前記第1の算出手順において算出された前記画像要素の動きの大きさに基づいて特徴量を算出する第2の算出手順と、
前記第2の算出手順により算出された前記特徴量に基づいて前記画像要素が所望の細胞であるか否かを識別する識別手順と、
を有する細胞の製造方法。 - 細胞を培養する細胞の培養手順と、
前記培養手順において培養される前記細胞を複数回撮像する撮像手順と、
前記撮像手順において撮像された複数の画像に含まれる画像要素の動きの大きさを算出する第1の算出手順と、
前記第1の算出手順において算出された前記画像要素の動きの大きさに基づいて特徴量を算出する第2の算出手順と、
前記第2の算出手順により算出された前記特徴量に基づいて前記画像要素が所望の細胞であるか否かを識別する識別手順と、
前記識別された所望の細胞を取り除くまたは前記所望の細胞以外のものを取り除く細胞取得手順と、
前記細胞取得手順により取得された前記所望の細胞をさらに培養する取得細胞培養手順と、
を有する細胞の培養方法。 - 細胞を培養する細胞の培養部と、
前記培養部により培養される前記細胞を複数回撮像する撮像部と、
前記撮像部により撮像された複数の画像に含まれる画像要素の動きの大きさを算出する第1の算出部と、
前記第1の算出部により算出された前記画像要素の動きの大きさに基づいて特徴量を算出する第2の算出部と、
前記第2の算出部により算出された前記特徴量に基づいて前記画像要素が所望の細胞であるか否かを識別する識別部と、
前記識別部により所望の細胞であると識別された画像要素に対応する細胞を取り出す取出部と、
を有する細胞の製造装置。 - 一つまたは複数の運動物体が含まれ得る観察対象を時系列で撮像した時系列画像から、画像要素毎の動きに関する特徴量を算出する算出部と、
前記算出部により算出された前記特徴量が類似する画像要素を、同一の前記運動物体を撮像した一群の画像要素の候補としてグループ化するグループ化部と、
を備える画像解析装置。 - 前記算出部は、前記画像要素毎の動きの大きさ、または前記動きの大きさに基づく値を、前記特徴量として算出する、
請求項11記載の画像解析装置。 - 前記算出部は、複数種類の特徴量を算出し、
前記グループ化部は、前記複数種類の特徴量についてクラスタリング分析を行うことにより、前記特徴量が類似する画像要素を抽出する、
請求項11または12記載の画像解析装置。 - 前記グループ化部は、画像要素間の距離が大きくなるほど、同一の前記運動物体を撮像した画像要素であると推定する可能性を低下させる、
請求項11から13のうちいずれか1項記載の画像解析装置。 - 前記運動物体とは、心筋細胞である、
請求項11から14のうちいずれか一項に記載の画像解析装置。 - コンピュータが、
一つまたは複数の運動物体が含まれ得る観察対象を時系列で撮像した時系列画像から、画像要素毎の動きに関する特徴量を算出し、
前記算出された特徴量が類似する画像要素を、同一の前記運動物体を撮像した画像要素であると推定してグループ化する、
画像解析方法。 - コンピュータに、
一つまたは複数の運動物体が含まれ得る観察対象を時系列で撮像した時系列画像から、画像要素毎の動きに関する特徴量を算出させ、
前記算出された特徴量が類似する画像要素を、同一の前記運動物体を撮像した画像要素であると推定してグループ化させる、
画像解析プログラム。 - 細胞を培養する細胞の培養手順と、
前記培養手順において培養される前記細胞を複数回撮像する撮像手順と、
前記撮像された複数の画像から、画像要素毎の動きに関する特徴量を算出する算出手順と、
前記算出された特徴量が類似する画像要素を、同一の細胞を撮像した画像要素であると推定してグループ化するグループ化手順と、
前記グループ化された画像要素が所望の細胞であるか否かを識別する識別手順と、
を有する細胞の製造方法。 - 細胞を培養する細胞の培養部と、
前記培養部により培養される前記細胞を複数回撮像する撮像部と、
前記撮像部により撮像された複数の画像から、画像要素毎の動きに関する特徴量を算出する算出部と、
前記算出部により算出された特徴量が類似する画像要素を、同一の細胞を撮像した画像要素であると推定してグループ化するグループ化部と、
前記グループ化部によりグループ化された画像要素が所望の細胞を映したものであるか否かを識別する識別部と、
前記識別部により所望の細胞を映したものであると識別された画像要素に対応する細胞を取り出す取出部と、
を有する細胞の製造装置。
Priority Applications (2)
| Application Number | Priority Date | Filing Date | Title |
|---|---|---|---|
| JP2015537905A JP6402717B2 (ja) | 2013-09-18 | 2014-09-12 | 画像解析装置、画像解析方法、画像解析プログラム、細胞の製造方法、細胞の製造装置、細胞の培養方法、および細胞の培養装置 |
| US15/022,806 US10163218B2 (en) | 2013-09-18 | 2014-09-12 | Image analysis device, image analysis method, image analysis program, cell manufacturing method, cell culturing method, and cell manufacturing device |
Applications Claiming Priority (4)
| Application Number | Priority Date | Filing Date | Title |
|---|---|---|---|
| JP2013193520 | 2013-09-18 | ||
| JP2013-193545 | 2013-09-18 | ||
| JP2013-193520 | 2013-09-18 | ||
| JP2013193545 | 2013-09-18 |
Publications (1)
| Publication Number | Publication Date |
|---|---|
| WO2015041177A1 true WO2015041177A1 (ja) | 2015-03-26 |
Family
ID=52688827
Family Applications (1)
| Application Number | Title | Priority Date | Filing Date |
|---|---|---|---|
| PCT/JP2014/074268 Ceased WO2015041177A1 (ja) | 2013-09-18 | 2014-09-12 | 画像解析装置、画像解析方法、画像解析プログラム、細胞の製造方法、細胞の培養方法、および細胞の製造装置 |
Country Status (3)
| Country | Link |
|---|---|
| US (1) | US10163218B2 (ja) |
| JP (1) | JP6402717B2 (ja) |
| WO (1) | WO2015041177A1 (ja) |
Cited By (9)
| Publication number | Priority date | Publication date | Assignee | Title |
|---|---|---|---|---|
| JP2016208854A (ja) * | 2015-04-30 | 2016-12-15 | 富士フイルム株式会社 | 撮像装置および方法並びに撮像制御プログラム |
| JP2017167965A (ja) * | 2016-03-17 | 2017-09-21 | 東芝メディカルシステムズ株式会社 | 画像処理装置及び医用情報管理システム |
| WO2018003181A1 (ja) * | 2016-07-01 | 2018-01-04 | 富士フイルム株式会社 | 撮影装置および方法並びに撮影制御プログラム |
| WO2018012601A1 (ja) * | 2016-07-14 | 2018-01-18 | 大日本印刷株式会社 | 画像解析システム、培養管理システム、画像解析方法、培養管理方法、細胞群製造方法及びプログラム |
| JP2018181333A (ja) * | 2017-04-20 | 2018-11-15 | カール・ツアイス・メディテック・アーゲー | 医学−光学式表示システムを作動させるための方法 |
| JPWO2018003063A1 (ja) * | 2016-06-30 | 2019-05-16 | 株式会社ニコン | 画像選択装置、画像選択方法、画像選択プログラム、表示装置、演算装置 |
| EP3456812A4 (en) * | 2016-06-21 | 2019-06-26 | Sony Corporation | INFORMATION PROCESSING DEVICE, INFORMATION PROCESSING PROCESS AND PROGRAM |
| JP2020043842A (ja) * | 2018-09-21 | 2020-03-26 | 株式会社Screenホールディングス | 画像処理方法、コンピュータプログラムおよび記録媒体 |
| JPWO2021049332A1 (ja) * | 2019-09-10 | 2021-03-18 |
Families Citing this family (9)
| Publication number | Priority date | Publication date | Assignee | Title |
|---|---|---|---|---|
| JP6078943B2 (ja) * | 2011-02-28 | 2017-02-15 | ソニー株式会社 | 画像処理装置および方法、並びに、プログラム |
| JP6066492B2 (ja) * | 2013-08-22 | 2017-01-25 | 富士フイルム株式会社 | 細胞画像評価装置および方法並びにプログラム |
| JP6301199B2 (ja) * | 2014-05-30 | 2018-03-28 | 富士フイルム株式会社 | 細胞評価装置および方法並びにプログラム |
| US10803580B2 (en) * | 2018-10-24 | 2020-10-13 | Wearless Tech Inc. | Video image processing and motion detection |
| US11381825B2 (en) * | 2018-11-27 | 2022-07-05 | Advanced Micro Devices, Inc. | Variable rate rendering based on motion estimation |
| US11686868B2 (en) * | 2019-03-26 | 2023-06-27 | Japan Agency For Marine-Earth Science And Technology | Earthquake estimation method, non-transitory computer readable medium, and earthquake estimation device |
| CN110866906B (zh) * | 2019-11-12 | 2022-07-08 | 安徽师范大学 | 基于图像边缘提取的三维培养人体心肌细胞搏动检测方法 |
| WO2021095256A1 (ja) * | 2019-11-15 | 2021-05-20 | オリンパス株式会社 | 画像処理システム、画像処理方法、及び、プログラム |
| WO2022113366A1 (ja) * | 2020-11-30 | 2022-06-02 | 株式会社ニコン | 学習済みモデルを生成する方法、画像処理方法、画像変換装置、プログラム |
Citations (6)
| Publication number | Priority date | Publication date | Assignee | Title |
|---|---|---|---|---|
| JP2005293367A (ja) * | 2004-04-01 | 2005-10-20 | Seiko Epson Corp | 画像処理方法及び装置 |
| JP2007101867A (ja) * | 2005-10-04 | 2007-04-19 | Sharp Corp | 携帯端末 |
| JP2010538603A (ja) * | 2007-06-05 | 2010-12-16 | ゼネラル・エレクトリック・カンパニイ | 細胞の動きの自動的特徴づけ |
| WO2011013319A1 (ja) * | 2009-07-31 | 2011-02-03 | 株式会社ニコン | 細胞塊の成熟判定手法、この手法を用いた画像処理プログラム及び画像処理装置、並びに細胞塊の製造方法 |
| WO2011122200A1 (ja) * | 2010-03-29 | 2011-10-06 | ソニー株式会社 | データ処理装置およびデータ処理方法、画像処理装置および方法、並びに、プログラム |
| JP2014179061A (ja) * | 2013-02-14 | 2014-09-25 | Sony Corp | 分析システム、分析プログラム及び分析方法 |
Family Cites Families (3)
| Publication number | Priority date | Publication date | Assignee | Title |
|---|---|---|---|---|
| JP2870415B2 (ja) | 1994-08-22 | 1999-03-17 | 日本電気株式会社 | 領域分割方法および装置 |
| JP3196749B2 (ja) | 1998-12-25 | 2001-08-06 | 日本電気株式会社 | 領域の属性モデルを用いる領域分割方法及び装置 |
| DE602006006752D1 (de) * | 2005-06-01 | 2009-06-25 | Fraunhofer Ges Forschung | Verfahren zur optischen Bestimmung des dynamischen Verhaltens von kontrahierenden Zellen |
-
2014
- 2014-09-12 US US15/022,806 patent/US10163218B2/en active Active
- 2014-09-12 JP JP2015537905A patent/JP6402717B2/ja active Active
- 2014-09-12 WO PCT/JP2014/074268 patent/WO2015041177A1/ja not_active Ceased
Patent Citations (6)
| Publication number | Priority date | Publication date | Assignee | Title |
|---|---|---|---|---|
| JP2005293367A (ja) * | 2004-04-01 | 2005-10-20 | Seiko Epson Corp | 画像処理方法及び装置 |
| JP2007101867A (ja) * | 2005-10-04 | 2007-04-19 | Sharp Corp | 携帯端末 |
| JP2010538603A (ja) * | 2007-06-05 | 2010-12-16 | ゼネラル・エレクトリック・カンパニイ | 細胞の動きの自動的特徴づけ |
| WO2011013319A1 (ja) * | 2009-07-31 | 2011-02-03 | 株式会社ニコン | 細胞塊の成熟判定手法、この手法を用いた画像処理プログラム及び画像処理装置、並びに細胞塊の製造方法 |
| WO2011122200A1 (ja) * | 2010-03-29 | 2011-10-06 | ソニー株式会社 | データ処理装置およびデータ処理方法、画像処理装置および方法、並びに、プログラム |
| JP2014179061A (ja) * | 2013-02-14 | 2014-09-25 | Sony Corp | 分析システム、分析プログラム及び分析方法 |
Non-Patent Citations (1)
| Title |
|---|
| ARIMITSU YOKOTA ET AL.: "Estimation of Earthquake Motion by Image Analysis of Sliding Movement", ITE TECHNICAL REPORT, vol. 30, no. 32, 26 June 2006 (2006-06-26), pages 9 - 12 * |
Cited By (18)
| Publication number | Priority date | Publication date | Assignee | Title |
|---|---|---|---|---|
| JP2016208854A (ja) * | 2015-04-30 | 2016-12-15 | 富士フイルム株式会社 | 撮像装置および方法並びに撮像制御プログラム |
| JP2017167965A (ja) * | 2016-03-17 | 2017-09-21 | 東芝メディカルシステムズ株式会社 | 画像処理装置及び医用情報管理システム |
| EP3456812A4 (en) * | 2016-06-21 | 2019-06-26 | Sony Corporation | INFORMATION PROCESSING DEVICE, INFORMATION PROCESSING PROCESS AND PROGRAM |
| JPWO2018003063A1 (ja) * | 2016-06-30 | 2019-05-16 | 株式会社ニコン | 画像選択装置、画像選択方法、画像選択プログラム、表示装置、演算装置 |
| US10761295B2 (en) | 2016-07-01 | 2020-09-01 | Fujifilm Corporation | Image focusing device, image focusing method and computer readable medium with image focusing control program |
| WO2018003181A1 (ja) * | 2016-07-01 | 2018-01-04 | 富士フイルム株式会社 | 撮影装置および方法並びに撮影制御プログラム |
| JP2018000102A (ja) * | 2016-07-01 | 2018-01-11 | 富士フイルム株式会社 | 撮影装置および方法並びに撮影制御プログラム |
| WO2018012601A1 (ja) * | 2016-07-14 | 2018-01-18 | 大日本印刷株式会社 | 画像解析システム、培養管理システム、画像解析方法、培養管理方法、細胞群製造方法及びプログラム |
| US11398032B2 (en) | 2016-07-14 | 2022-07-26 | Dai Nippon Printing Co., Ltd. | Image analysis system, culture management system, image analysis method, culture management method, cell group structure method, and program |
| US10989911B2 (en) | 2017-04-20 | 2021-04-27 | Carl Zeiss Meditec Ag | Method for operating a medical-optical display system |
| JP2018181333A (ja) * | 2017-04-20 | 2018-11-15 | カール・ツアイス・メディテック・アーゲー | 医学−光学式表示システムを作動させるための方法 |
| JP2020043842A (ja) * | 2018-09-21 | 2020-03-26 | 株式会社Screenホールディングス | 画像処理方法、コンピュータプログラムおよび記録媒体 |
| JP7197316B2 (ja) | 2018-09-21 | 2022-12-27 | 株式会社Screenホールディングス | 画像処理方法、コンピュータプログラムおよび記録媒体 |
| JPWO2021049332A1 (ja) * | 2019-09-10 | 2021-03-18 | ||
| WO2021049332A1 (ja) * | 2019-09-10 | 2021-03-18 | 株式会社ニコン | 画像処理装置、画像処理方法およびプログラム |
| JP7416074B2 (ja) | 2019-09-10 | 2024-01-17 | 株式会社ニコン | 画像処理装置、画像処理方法およびプログラム |
| US12169957B2 (en) | 2019-09-10 | 2024-12-17 | Nikon Corporation | Image processing device, image processing method, and program |
| JP7655375B2 (ja) | 2019-09-10 | 2025-04-02 | 株式会社ニコン | 画像処理方法、画像処理装置およびプログラム |
Also Published As
| Publication number | Publication date |
|---|---|
| US10163218B2 (en) | 2018-12-25 |
| JP6402717B2 (ja) | 2018-10-10 |
| JPWO2015041177A1 (ja) | 2017-03-02 |
| US20160232682A1 (en) | 2016-08-11 |
Similar Documents
| Publication | Publication Date | Title |
|---|---|---|
| JP6402717B2 (ja) | 画像解析装置、画像解析方法、画像解析プログラム、細胞の製造方法、細胞の製造装置、細胞の培養方法、および細胞の培養装置 | |
| Linder et al. | A malaria diagnostic tool based on computer vision screening and visualization of Plasmodium falciparum candidate areas in digitized blood smears | |
| US9208580B2 (en) | Hand detection, location, and/or tracking | |
| US12223645B2 (en) | Method and device for identifying abnormal cell in to-be-detected sample, and storage medium | |
| US20180342078A1 (en) | Information processing device, information processing method, and information processing system | |
| KR20050082252A (ko) | 객체 추적 방법 및 그 장치 | |
| CN108351919A (zh) | 信息处理设备、信息处理方法、程序及信息处理系统 | |
| US11282201B2 (en) | Information processing device, information processing method and information processing system | |
| JP6102166B2 (ja) | 心筋細胞の運動検出方法、心筋細胞の培養方法、薬剤評価方法、画像処理プログラム及び画像処理装置 | |
| JP2011525009A (ja) | 1以上のデフォーカス画像又は低コントラスト対雑音比画像を検出し除去するシステム及び方法 | |
| Bao et al. | Dmnet: Dual-stream marker guided deep network for dense cell segmentation and lineage tracking | |
| JP2010538603A (ja) | 細胞の動きの自動的特徴づけ | |
| JP2017023055A (ja) | 細胞管理システム、プログラム、及び、細胞管理方法 | |
| EP3432269B1 (en) | Information processing device, information processing method, program, and information processing system | |
| JP2017140006A (ja) | 培養状態解析システム及び培養状態解析方法、並びに、プログラム | |
| de Oliveira Feijó et al. | An algorithm to track laboratory zebrafish shoals | |
| JP2011002995A (ja) | 細胞認識装置、インキュベータおよびプログラム | |
| Hsu | A novel image registration algorithm for indoor and built environment applications | |
| CN114585722A (zh) | 图像解析装置、细胞培养观察装置、图像解析方法、程序及信息处理系统 | |
| JP6343874B2 (ja) | 観察装置、観察方法、観察システム、そのプログラム、および細胞の製造方法 | |
| Maiseli et al. | An automatic and cost-effective parasitemia identification framework for low-end microscopy imaging devices | |
| Khalili et al. | Elderly fall detection using CCTV cameras under partial occlusion of the subjects body | |
| Nautre et al. | Detection of malaria parasites in thin red blood smear using a segmentation approach with U-Net | |
| US12307632B2 (en) | Systems, methods, and computer programs for a microscope and microscope system | |
| Reski et al. | Identification of Drug Material Melting Conditions from Hot-Stage Microscopy Images Using Active Contour and Support Vector Machine Methods |
Legal Events
| Date | Code | Title | Description |
|---|---|---|---|
| 121 | Ep: the epo has been informed by wipo that ep was designated in this application |
Ref document number: 14845653 Country of ref document: EP Kind code of ref document: A1 |
|
| ENP | Entry into the national phase |
Ref document number: 2015537905 Country of ref document: JP Kind code of ref document: A |
|
| WWE | Wipo information: entry into national phase |
Ref document number: 15022806 Country of ref document: US |
|
| NENP | Non-entry into the national phase |
Ref country code: DE |
|
| 122 | Ep: pct application non-entry in european phase |
Ref document number: 14845653 Country of ref document: EP Kind code of ref document: A1 |