WO2014188622A1 - Examination method - Google Patents
Examination method Download PDFInfo
- Publication number
- WO2014188622A1 WO2014188622A1 PCT/JP2013/081669 JP2013081669W WO2014188622A1 WO 2014188622 A1 WO2014188622 A1 WO 2014188622A1 JP 2013081669 W JP2013081669 W JP 2013081669W WO 2014188622 A1 WO2014188622 A1 WO 2014188622A1
- Authority
- WO
- WIPO (PCT)
- Prior art keywords
- light
- protective layer
- test piece
- sensor
- substrate
- Prior art date
Links
Images


Classifications
-
- G—PHYSICS
- G01—MEASURING; TESTING
- G01N—INVESTIGATING OR ANALYSING MATERIALS BY DETERMINING THEIR CHEMICAL OR PHYSICAL PROPERTIES
- G01N21/00—Investigating or analysing materials by the use of optical means, i.e. using sub-millimetre waves, infrared, visible or ultraviolet light
- G01N21/62—Systems in which the material investigated is excited whereby it emits light or causes a change in wavelength of the incident light
- G01N21/63—Systems in which the material investigated is excited whereby it emits light or causes a change in wavelength of the incident light optically excited
- G01N21/65—Raman scattering
- G01N21/658—Raman scattering enhancement Raman, e.g. surface plasmons
-
- G—PHYSICS
- G01—MEASURING; TESTING
- G01N—INVESTIGATING OR ANALYSING MATERIALS BY DETERMINING THEIR CHEMICAL OR PHYSICAL PROPERTIES
- G01N21/00—Investigating or analysing materials by the use of optical means, i.e. using sub-millimetre waves, infrared, visible or ultraviolet light
- G01N21/62—Systems in which the material investigated is excited whereby it emits light or causes a change in wavelength of the incident light
- G01N21/63—Systems in which the material investigated is excited whereby it emits light or causes a change in wavelength of the incident light optically excited
- G01N21/64—Fluorescence; Phosphorescence
- G01N21/645—Specially adapted constructive features of fluorimeters
- G01N21/648—Specially adapted constructive features of fluorimeters using evanescent coupling or surface plasmon coupling for the excitation of fluorescence
Definitions
- the present invention relates to an inspection method, and more particularly to an inspection method of a test piece including a biological tissue section, which can analyze an emission spectrum derived from a biological tissue with high sensitivity.
- a method for medical application of biomolecule imaging using light a method of staining with a fluorescent dye and measuring fluorescence from the dye specifically accumulated in a target cell or biological tissue section is performed.
- Raman spectroscopy of cells and biological tissue sections can be measured and mapped for each site by selecting the wavelength of the spectrum, so that it is not necessary to stain with a fluorescent dye and tissue can be cut off. It becomes possible to directly evaluate the state of cells.
- the examination of living tissue is often used to determine whether or not there is any abnormality in the part. For example, during surgery, the target region is taken out and sliced to a size that can be examined, and then stained with a fluorescent dye, irradiated with excitation light, and the pathologist observes the light emission state from the dye. . At this time, the examination of whether or not there is an abnormality in the part requires a tissue diagnosis by a pathologist who is experienced and skilled in judgment, and the number of examinations is limited. Therefore, there is a need for a more rapid, simple and accurate diagnostic method using spectra.
- the signal is weak because of low sensitivity, and a long measurement time is required to obtain a necessary and sufficient signal for obtaining an image. Therefore, when obtaining a two-dimensional image within a limited measurement time, it is necessary to narrow the area to be measured. That is, the person who performs the inspection specifies the measurement target area in a narrow range in advance, and then irradiates the region with excitation light and detects the Raman spectrum. For this reason, when a lesion location exists outside the specified measurement target area, there is a high possibility that the lesion state is overlooked.
- the above-mentioned TERS method exists as a method for measuring Raman spectroscopy with high sensitivity.
- the measurement target area becomes extremely narrow, and thus the above-described problem occurs.
- an apparatus required for inspection is increased in size and an expensive apparatus is required.
- the signal is weak to measure a wide range. Therefore, it is necessary to set the measurement target area very narrow and its limited area ( ⁇ 1 mm In some cases, it takes a long time of several hours. Since it is necessary to observe an area of several centimeters or more for tissue diagnosis, this method takes a very long time to be practically unusable.
- nonlinear Raman spectroscopy such as stimulated Raman spectroscopy, a pulse laser or a high NA lens is required to induce efficient stimulated Raman scattering, which increases the size of the device and limits the measurement area that can be acquired at one time. Become. Therefore, there has been a demand for a method capable of measuring a Raman spectrum spectrum with high sensitivity and quickly measuring a wide area.
- a conventional method for measuring the Raman spectrum and fluorescence spectrum of the outermost surface using the localized surface plasmon effect there is a conventional method for measuring the Raman spectrum and fluorescence spectrum of the outermost surface using the localized surface plasmon effect.
- a device for realizing a localized surface plasmon effect is prepared, light is irradiated in a state where a test piece to be inspected is placed on the device, and light emission from the test piece is spectrally analyzed. It is.
- the localized surface plasmon effect enhances light emission from the specimen.
- an object of the present invention is to provide an inspection method capable of inspecting a biological tissue section with a simple apparatus.
- the inspection method of the present invention is an inspection method of a test piece including a biological tissue section,
- An optical enhancement element comprising: a substrate; an enhanced electromagnetic field forming layer in which a large number of metal fine particles are dispersed and arranged independently of each other on the surface of the substrate; and a protective layer formed on the substrate and the enhanced electromagnetic field forming layer
- Preparing step (a) Placing the test piece to be inspected on the upper surface of the protective layer (b), Irradiating excitation light to the light enhancement element from the upper surface or from the back surface (c), And (d) measuring light emission spectrum by receiving light emitted from the test piece.
- the localized surface plasmon effect can be used because the structure includes an enhanced electromagnetic field forming layer in which a large number of metal fine particles are dispersed and arranged independently from each other on the surface of the substrate. For this reason, unlike the surface plasmon effect using evanescent waves, there is no strict restriction on the incident angle of light with respect to the substrate, and the degree of freedom is ensured.
- a test piece to be inspected is placed on the upper surface of the protective layer formed on the enhanced electromagnetic field forming layer. For this reason, even when a biological material such as a biological tissue slice is included as a test piece, the test piece is only in direct contact with the protective layer, and the metal fine particles are not kept in direct contact with the test piece for a long time. . For this reason, when the metal fine particles are continuously exposed to the halide ions for a long time, the halide ions and the metal fine particles do not undergo chemical reaction and change in quality. As a result, Ag having a high light enhancement effect can be used as the metal fine particles. In the configuration of the present invention, Ag is preferably used as the metal fine particles, but other metal materials (for example, Au) may be used.
- the light enhancement effect acts only in the vicinity of a large number of metal fine particles constituting the enhanced electromagnetic field forming layer.
- the test piece is placed on the upper surface of the protective layer formed on the upper layer of the enhanced electromagnetic field forming layer, the strong enhancing effect reaches the surface through the protective layer formed on the upper layer of the enhanced electromagnetic field forming layer.
- a light enhancement effect can be exerted on the test piece placed on the upper surface of the protective layer far from the metal fine particles. Therefore, strong luminescence derived from a living tissue as a test piece can be obtained.
- the method of the present invention can be used not only for Raman scattered light from a test piece but also for fluorescence spectrum analysis.
- the localized surface plasmon effect can be used, the light emission enhancement effect is extremely high.
- the fluorescence enhancement effect of a substance that has not conventionally been lit in a normal state and has not been recognized as a fluorescent substance can be used. Therefore, a fluorescence spectrum analysis of a living tissue can be performed without introducing a fluorescent substance.
- the inspection method of the present invention includes:
- the step (c) is a step of irradiating the light enhancement element with the excitation light while scanning in a predetermined direction.
- the method includes a step (e) of two-dimensional mapping the intensity distribution of the emission spectrum obtained in the step (d).
- the light emission enhancement effect is extremely high, the emission spectrum can be detected in a short time.
- a wide range of two-dimensional mapping can be performed at high speed using a low-magnification objective lens using a microscopic Raman measurement apparatus.
- the sensitivity is high, the signal is strong, and it takes a short measurement time to obtain a signal that is necessary and sufficient to obtain an image of a wide observation area. Therefore, the measurement area can be widened even when a two-dimensional image is obtained within a limited measurement time.
- mapping image in the case where an abnormality exists and a mapping image in the case where no abnormality exists are prepared in advance, and by comparing these with a mapping image based on the measured spectrum data, Since diagnosis is possible, tissue diagnosis can be performed even if the pathologist is not an experienced and skilled in judgment.
- the protective layer may be composed of an inorganic substance having an orientation or an organic polymer having an orientation in connection with the numerous metal fine particles.
- the protective layer may contain a halogen element.
- this configuration it is possible to transmit the enhanced electromagnetic field caused by the localized surface plasmon effect in the enhanced electromagnetic field forming layer to the surface of the protective layer with higher efficiency.
- this configuration is different from the case in which halide ions are brought into direct contact with the exposed metal fine particles in the configuration having no protective layer, and therefore, a material containing a halogen element is used as the protective layer. Similarly, the function of protecting the metal fine particles from damage by halide ions is secured.
- a biological tissue section can be inspected with a simple device.
- a wide range of imaging can be performed in a short time, and a living tissue section can be diagnosed even without a skilled pathologist.
- Example 6 is a graph which shows the Raman spectrum light-received by the light-receiving part. It is a Raman mapping image obtained in Example 6. It is a microscope image of the vagus nerve section
- FIG. 1 is a drawing schematically showing the structure of a sensor used in the inspection method of the present invention.
- the sensor 1 includes a substrate 7, an enhanced electromagnetic field forming layer 9, and a protective layer 11 to constitute a light enhancement element. Then, the test piece 5 to be inspected is placed on the upper surface of the protective layer 11 and inspected.
- the material of the substrate 7 is not particularly limited, and for example, glass, ceramics, resin, or the like can be used. As will be described later, when heat treatment (for example, heating at 100 ° C. or higher) is performed in the manufacturing process of the sensor 1, it is preferable to have heat resistance such as glass or polyimide resin.
- the enhanced electromagnetic field forming layer 9 is configured by a large number of metal fine particles 10 being dispersed and arranged on the surface of the substrate 7 independently of each other.
- the arrangement method of the metal fine particles 10 on the surface of the substrate 7 may be a two-dimensional random arrangement or a regular arrangement.
- the metal fine particles 10 constituting the enhanced electromagnetic field forming layer 9 for example, Ag can be suitably used, but Au, Al, and the like can be used as long as they can be excited by irradiation with excitation light to realize the localized surface plasmon effect.
- Other materials such as Cu can also be used.
- shape of the metal fine particles 10 for example, those having shape anisotropy such as a flat hemispherical shape or a flat plate shape can be suitably used. Note that it is desirable that all the metal fine particles 10 have a uniform size and shape, but there may be some variation in size and shape.
- the particle diameter of the metal fine particles 10 is preferably smaller than the wavelength of the excitation light.
- particle size refers to a projected area equivalent circle diameter measured by microscopy. Specifically, it is obtained as follows. Field of view of a scanning electron microscope (for example, 1.5 ⁇ m ⁇ 2 ⁇ m) in which a 2 ⁇ m-long line segment is observed to be enlarged to a length of 6 cm (magnification: 30000 times) in an arbitrarily selected region on the surface of the sensor 1 As an imaging region, a secondary electron image of the region in the sensor 1 is obtained. At this time, for each of the metal fine particles having a brightness index (256 steps) of about 100 or more, the diameter of a perfect circle having the same area as the metal fine particle 10 is obtained as the particle diameter of the metal fine particle 10.
- the particle size of the metal fine particles 10 is in the range of 5 to 300 nm, for example, and the thickness is in the range of 5 to 70 nm, for example. Further, the density of the metal fine particles 10 constituting the enhanced electromagnetic field forming layer 9 can be, for example, about 10 8 to 10 11 particles / cm 2 .
- a method for forming such an enhanced electromagnetic field forming layer 9 a method in which a dispersion liquid in which a precursor of metal fine particles 10 is dispersed in an appropriate solvent is applied to the surface of the substrate 7 by a spin coating method and heated. be able to. Further, as another method, a method of dipping the precursor of the metal fine particles 10 on the surface of the substrate 7 and heating, a method of vacuum-depositing the metal fine particles 10 on the surface of the substrate 7, and a method of depositing the metal fine particles 10 on the surface of the substrate 7 A sputter deposition method or the like can be used.
- a protective layer 11 is formed on the enhanced electromagnetic field forming layer 9 including the surface of the substrate 7 exposed between adjacent metal fine particles 10.
- the material constituting the protective layer 11 include silicon oxide, titanium oxide, cerium oxide, boron oxide, phosphorus oxide, magnesium oxide, calcium oxide, aluminum oxide, gallium oxide, germanium oxide, and zinc oxide.
- the average thickness of the protective layer 11 is preferably 50 to 250 nm, for example. In particular, since the thickness of the protective layer 11 is 85 nm or more, even when the test piece 5 contains a halide ion (for example, Cl ⁇ ) such as a biological material, sufficient resistance to the metal fine particles 10 ( Protection function).
- a halide ion for example, Cl ⁇
- Such a sensor 1 is manufactured by the following method, for example. First, a metal nanoparticle film is formed on the surface of the substrate 7, and the graininess is changed by heat-treating the film, whereby an enhanced electromagnetic field forming layer 9 made of metal fine particles 10 having a particle diameter within a predetermined range is formed. Form. At this time, the particle diameter of the metal fine particles 10 to be formed can be adjusted by appropriately changing the heat treatment conditions.
- a protective layer is grown in the thickness direction from the metal fine particle 10 as a starting point on the surface of the enhanced electromagnetic field forming layer 9 including the surface portion of the substrate 7 exposed between the adjacent metal fine particles 10 by vapor deposition.
- the protective layer 11 having a columnar structure is formed.
- the thickness of the protective layer 11 can be adjusted by appropriately changing the growth conditions and time.
- methods such as a radio frequency (RF) sputter vapor deposition method, an electron beam vapor deposition method, or an electron cyclotron resonance (ECR) sputter vapor deposition method, can be selected suitably and can be utilized.
- FIG. 2 is a conceptual diagram for explaining the inspection method.
- a method for performing spectrum analysis by irradiating the sensor 1 on which the test piece 5 is placed with excitation light and receiving Raman scattered light emitted from the test piece 5 will be described.
- the light source unit 41 includes an excitation light source 50, a filter 51, and a mirror 61.
- the light receiving unit 43 includes a filter 53, a spectroscope 55, and a photodetector 56.
- a half mirror 62 that transmits light from the light source unit 41 and reflects light emitted from the test piece 5 is provided.
- the condensing lens 52 is installed for the purpose of condensing excitation light from the light source unit 41 and light emission from the test piece 5.
- the apparatus configuration shown in FIG. 2 is merely an example, and the present invention is not limited to this configuration.
- excitation light is incident from the light source unit 41 toward the sensor 1. Due to the incident light, the plasmon electric field generated in the enhanced electromagnetic field forming layer 9 of the sensor 1 propagates to the test piece 5 placed on the upper surface of the protective layer 11. Thereby, strong excitation light is exerted on the test piece 5, and high-output Raman scattered light is emitted from the test piece 5.
- the Raman scattered light is reflected by the half mirror 62 and received by the light receiving unit 43. Wavelength decomposition is performed by the spectroscope 55 of the light receiving unit 43, and a spectral distribution of the light received by the photodetector 56 is obtained.
- a biological material including a biological tissue section as the test piece 5.
- the enhanced electromagnetic field formed by the enhanced electromagnetic field forming layer 9 selectively excites the specimen 5, that is, the molecular species of the biological tissue, via the protective layer 11 having electromagnetic field propagating properties, thereby the Raman signal derived from the biological tissue. Is selectively obtained.
- the enhanced Raman scattered light generated in this way is optically strongly coupled to the enhanced electromagnetic field forming layer 9, so that the enhanced electromagnetic field forming layer 9 efficiently guides this scattered light to the light receiving portion 43, and thus, due to the synergistic effect thereof. Gives a strong Raman signal.
- Example 1 First, a method for manufacturing the sensor 1 of Example 1 will be described. A glass slide having a size of several centimeters was used as the substrate 7, and an Ag film for forming the metal fine particles 10 was formed on the surface of the glass slide by depositing Ag with a thickness of about 10 nm. Thereafter, the substrate 7 on which the Ag film is formed is heated for several minutes on a hot plate at about 100 ° C., thereby changing the granularity of the Ag film and thereby increasing the number of metals (Ag) as the enhanced electromagnetic field forming layer 9. An Ag fine particle monolayer film of fine particles 10 was formed.
- a glass slide having a size of several centimeters was used as the substrate 7, and an Ag film for forming the metal fine particles 10 was formed on the surface of the glass slide by depositing Ag with a thickness of about 10 nm. Thereafter, the substrate 7 on which the Ag film is formed is heated for several minutes on a hot plate at about 100 ° C., thereby changing the granularity of the Ag film and
- the particle diameter of the metal fine particles 10 in the obtained Ag fine particle monolayer film is in the range of 50 to 150 nm, the thickness is about 20 nm on average, and the density of the metal fine particles 10 is approximately 5 ⁇ 10 9 particles / cm 3. 2 .
- RF sputtering apparatus “RFS-200 type” (manufactured by Ulvac)
- SiO 2 silicon oxide
- the sensor 1 was produced by forming the protective layer 11 on the surface of the enhanced electromagnetic field forming layer 9 including the surface portion of the above.
- the thickness of the protective layer 11 was adjusted by appropriately changing the sputtering time.
- the sputtering conditions are as follows. -Distance from the target to the surface of the enhanced electromagnetic field forming layer 9: 45 mm ⁇ Atmosphere: Ar 3.0Pa (during discharge) ⁇ Discharge output: 100W ⁇ RF frequency: 13.6MHz -Growth rate of the protective layer 11: 8.5 nm / min
- the fluorescence enhancement effect is verified. That is, the dye molecule is coated on the surface of the protective layer 11 by spin-coating a diluted ethanol solution of rhodamine 6G dye (Rh6G: emission quantum yield of about 1) at 3000 revolutions on the surface of the protective layer 11 on the sensor 1. It was made to carry on.
- the relationship between the density of the dye molecules carried on the surface of the sensor 1 and the dye concentration of the solution used for spin coating is that the amount of dye molecules carried is 3 ⁇ 10 11 when the concentration of rhodamine 6G dye is 1 ⁇ M. / Cm 2 .
- the emission quantum yield ⁇ is defined by the ratio between the number of photons absorbed by the molecule and the number of photons emitted by fluorescence (see Equation 1).
- k f is a fluorescence transition rate constant of a molecule in an electronically excited state
- knr is a non-radiative transition rate constant (speed at which quenching occurs per unit time).
- the non-radiative transition is a transition that returns to the ground state without emitting fluorescence.
- a dye having a low emission quantum yield is a dye having k f ⁇ kn nr . Note that a dye that hardly emits light under the condition of k f ⁇ k nr is called a non-light emitting dye.
- FIG. 3 is a conceptual diagram of a measuring device for verifying the performance of the sensor 1.
- a light source unit 41 is configured by the diode laser as the excitation light source 50 and the filter 51, light is incident on the sensor 1 from the light source unit 41, and light from the dye molecules carried on the surface of the protective layer 11 is received by the light receiving unit. 43 receives light.
- the light receiving unit 43 is composed of a condenser lens 52, a filter 53, a light receiving head 54, and a photodetector 55 (electronically cooled diode array detector).
- a green diode laser (wavelength of 532 nm) having an output of less than 1 mW is used as the excitation light source 50, and light emitted from the excitation light source 50 is not condensed through the filter 51 (energy density is about 30 mW / cm). 2 ) or anti-condensation (energy density of about 10 mW / cm 2 or less) is made incident on the sensor 1 at an angle of about 45 ° as excitation light. Then, the light scattered in the 90 ° angle direction by the dye molecules carried on the sensor 1 was condensed by the condenser lens 52 onto the light receiving head 54 of the photodetector 55 through the filter 53.
- FIG. 4 shows the measurement results of the measurement apparatus shown in FIG.
- the vertical axis represents the increase in luminescence intensity (unit: times), corresponding to the relative ratio to the luminescence intensity measured by the same method for the same amount of dye supported on the glass substrate without the enhancement effect. To do.
- a non-luminescent fuchsine dye (luminescence quantum yield ⁇ 0.01) is used instead of rhodamine 6G dye as a sample, and the sample is supported on the surface of the protective layer 11 at a density of 3 ⁇ 10 12 particles / cm 2.
- the emission intensity was measured by the same method as described above. The measurement results are shown in FIG.
- the radiation transition speed k f of the dye is increased as a result.
- k f >> kn nr the above-mentioned light emission quantum yield becomes large, and originally, it is a non-light emitting substance (k f ⁇ k nr ) whose light emission quantum yield is 0.01 or less. It can be seen that even pigments emit light strongly.
- the Raman scattering intensity of rhodamine 6G dye with the same arrangement as in FIG. 3 except that a He—Ne laser (wavelength 632.8 nm) with an output of less than 1 mW was used as the excitation light source 50 instead of the diode laser.
- a He—Ne laser wavelength 632.8 nm
- the excitation light source 50 instead of the diode laser.
- the film thickness of the protective layer 11 exceeds 200 nm, an enhanced Raman signal (intensity is about 10) which is not different from the signal obtained when the dye molecules are directly adsorbed on the surface of the metal fine particles 10. 5 times) was obtained.
- the following points can be considered as one of the reasons why the enhancement effect propagates as much as the thickness of the protective layer 11 as described above.
- the plasmon electric field is not disturbed and reaches the surface of the protective layer 11 without loss. Therefore, even when the thickness of the protective layer 11 is increased to some extent, the electromagnetic field (localized surface plasmon) generated in the metal fine particles 10 is transmitted to the surface of the protective layer 11.
- the test piece 5 is influenced by an enhanced electromagnetic field.
- the substance that constitutes the test piece 5, that is, light that strongly contains a spectrum derived from living tissue is emitted.
- the light receiving unit 43 receives this light emission and obtains a spectrum distribution, whereby the biological tissue can be analyzed.
- Example 2 An aqueous solution of antibody IgG labeled with a fuchsin dye was added dropwise to the sensor 1 produced by the same method as in Example 1. More specifically, an aqueous solution of antibody IgG labeled with a fuchsin dye was dropped onto the upper surface of the protective layer 11.
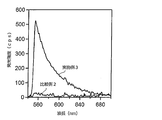
- FIG. 6 shows the result of examining the spectral distribution of the light obtained by the light receiving unit 43 by causing excitation light to enter the respective elements of Example 2 and Comparative Example 1 using the measuring device shown in FIG. .
- the horizontal axis represents the wavelength of light
- the vertical axis represents the emission intensity.
- the fuchsin dye which is a non-luminescent labeling substance, emits luminescence quantum by the interaction through the protective layer 11 with the localized plasmon generated by the enhanced electromagnetic field forming layer 9. It can be seen that the yield is improved and the amount of light emitted by the fuchsin dye is significantly increased.
- Comparative Example 1 there is no light emission enhancement effect. This shows that the sensor 1 of the present invention has a very high light emission enhancement effect.
- Example 3 An aqueous solution of a self-luminous biopolymer collagen having a low luminescence quantum yield was spin-coated on the upper surface of the protective layer 11 of the sensor 1 produced by the same method as in Example 1.
- Example 2 (Comparative Example 2) Similarly to Example 3, the substrate 7 was spin-coated with an aqueous solution of self-luminous biopolymer collagen having a low luminescence quantum yield.
- Example 4 An aqueous solution of self-luminous riboflavin having a low emission quantum yield was spin-coated on the upper surface of the protective layer 11 of the sensor 1 produced by the same method as in Example 1.
- Example 3 (Comparative Example 3) Similarly to Example 4, the substrate 7 was spin-coated with an aqueous solution of self-luminous riboflavin having a low emission quantum yield.
- FIG. 7 shows the results of examining the spectral distribution of the light obtained by the light receiving unit 43 by causing excitation light to enter the elements of Example 3 and Comparative Example 2 using the measuring device shown in FIG.
- FIG. 8 shows the result of examining the spectral distribution of the light obtained by the light receiving unit 43 by causing excitation light to enter the elements of Example 4 and Comparative Example 3 using the measuring apparatus shown in FIG. Show. 7 and 8, the horizontal axis represents the wavelength of light, and the vertical axis represents the emission intensity.
- the self-luminous biopolymer collagen having a low luminescence quantum yield passes through the protective layer 11 with the localized plasmon generated by the enhanced electromagnetic field forming layer 9. It can be seen that the quantum yield of light emission is improved by the interaction, and the amount of light emitted from the biopolymer collagen is significantly increased.
- Comparative Example 2 there is no effect of enhancing luminescence, and it is suggested that analysis by receiving light emitted from self-luminous biopolymer collagen is difficult.
- the self-luminous riboflavin having a low emission quantum yield passes through the protective layer 11 with the localized plasmon generated by the enhanced electromagnetic field forming layer 9. It can be seen that the quantum yield of light emission is improved by the interaction, and the amount of light emitted by riboflavin is significantly increased.
- Comparative Example 3 there is no light emission enhancement effect, which suggests that analysis by receiving light emitted from self-luminous riboflavin is difficult.
- the protective layer 11 of the sensor 1 may contain a halogen element in advance.
- a method of containing the halogen element in the protective layer 11 a method of immersing the sensor 1 in which the protective layer 11 is formed in an aqueous solution of a halide salt can be used.
- concentration of the halide salt aqueous solution is 0.1 to 0.3 mol / L
- the maximum effect can be obtained by room temperature immersion for about 5 to 30 minutes, but the concentration of the aqueous solution is higher than that.
- the halogen element content in the protective layer 11 is preferably 0.002% by mass to 0.05% by mass.
- halide salt examples include alkali metal salts such as sodium chloride (NaCl), potassium chloride (KCl), sodium bromide (NaBr), and potassium iodide (KI), and calcium chloride (CaCl 2 ). And alkaline earth metal salts.
- Example 5 Using the same method as in Example 1, the processing time by the RF sputtering apparatus was adjusted, and the sensor 1 having the protective layer 11 having a thickness of 100 nm was produced. Thereafter, the substrate 7 on which the enhanced electromagnetic field forming layer 9 and the protective layer 11 are formed is immersed in a sodium chloride aqueous solution having a chloride ion concentration of 0.2 to 0.3 mol / L for about 30 minutes. By washing with water and drying, halide ions were contained in the protective layer 11 to obtain the sensor 1 of this example. Although it is difficult to accurately determine the content ratio of the halogen element contained in the protective layer in the light enhancement element obtained by this method, it is estimated to be about 0.01% by mass.
- a thin ethanol solution of rhodamine 6G dye is spin-coated at 3000 revolutions on the upper surface of the protective layer 11 of the sensor 1, so that the dye molecules have a density of 3 ⁇ 10 11 particles / cm 2 on the surface of the protective layer 11. It was made to carry by.
- the senor 1 was also produced in the same manner except that it was not immersed in an aqueous sodium chloride solution.
- the sensor 1 corresponds to the element of the first embodiment.
- the intensity of Raman scattered light emitted from the sample (dye molecule) by irradiating excitation light to the sensor 1 of Example 5 and Example 1 is changed to a He—Ne laser having an output of less than 1 mW instead of the diode laser 50.
- the measurement was performed with the same measuring apparatus as in FIG. 3 except that (wavelength 632.8 nm) was used as the excitation light source. The result is shown in FIG. In the graph of FIG. 9, the vertical axis indicates the Raman scattering intensity (cps), and the horizontal axis indicates the Raman shift (cm ⁇ 1 ).
- Example 5 the intensity of Raman scattered light was compared with each sensor 1 of Example 5 and Example 1. This is because the intensity of Raman scattered light itself is smaller than the intensity of fluorescence, so that it is easy to compare in comparing the light enhancement effects of both.
- Example 5 in which the halide ions were immersed, a remarkable Raman signal was observed compared to Example 1 in which the halide ions were not immersed, suggesting that the light enhancement effect was higher.
- Example 5 In the sensor 1 of Example 1 in which the halide ions in FIG. 9 are not immersed, as described above with reference to FIGS. 4 and 5, the effect of extremely increasing the emission intensity is obtained. In addition, it is suggested that Example 5 in which halide ions are immersed has a higher light emission enhancing effect than Example 1.
- Example 5 a sodium chloride aqueous solution having a chloride ion concentration of 0.2 to 0.3 mol / L was immersed, but instead, the chloride ion concentration was 0.2 mol / L.
- An element formed by immersing a certain potassium chloride aqueous solution an element formed by immersing a sodium bromide aqueous solution having a bromide ion concentration of 0.2 mol / L, an iodine having a iodide ion concentration of 0.2 mol / L
- the same results as in Example 5 were obtained.
- Example 6 Using the sensor 1 of the present invention, a rat heart tissue (8 weeks old, female, tissue section thickness 5 ⁇ m) as a test piece 5 is placed on the upper surface of the protective layer 11, and a light source unit is formed in the same manner as in FIG. 41 was irradiated with excitation light, and the Raman spectrum from the test piece 5 was measured. More specifically, a tissue section obtained by freezing and fixing rat heart tissue with OCT-compound was used as a test piece 5 and placed on the upper surface of the protective layer 11 of the sensor 1.
- FIG. 10 is a microscopic image of a rat heart tissue section as the test piece 5.
- Measurement device Raman-11 (manufactured by Nanophoton)
- Excitation light wavelength 532 nm, output 91.1 mW / mm 2 (73 mW / Line)
- Excitation light irradiation area Measurement area 30 in FIG. 10 (scanning range is about 740 ⁇ m ⁇ 370 ⁇ m)
- Objective lens X10, NA 0.3 (Olympus)
- the excitation light irradiated from the light source part 41 was made into a line shape by the cylindrical lens and the objective lens, and focused on the surface of the test piece 5 and irradiated.
- the Raman scattered light from the test piece 5 irradiated in a linear shape is condensed through the same objective lens, and a one-dimensional Raman image is converted into a two-dimensional CCD image sensor (Pixis 400BR, electronic cooling-70 ° C., 1340 ⁇ 400 pixels; acquired by Princeton Instruments, Inc., Trenton, NJ, USA.
- a two-dimensional Raman scattering image was acquired by scanning excitation light having a linear shape.
- One one-dimensional image has a width of about 740 ⁇ m and a slit width of 70 ⁇ m, and requires a measurement time of 1 second.
- a Raman spectrum image two-dimensional mapping image in a range of about 740 ⁇ m ⁇ 370 ⁇ m was obtained. .
- Example 4 A rat heart tissue (8 weeks old, female, tissue section thickness 5 ⁇ m) as a test piece 5 is placed on the upper surface of the substrate 7, and a Raman spectrum is obtained by irradiating excitation light from the light source unit 41 as in Example 6. Obtained.
- Example 6 and Comparative Example 4 are shown in FIG. According to FIG. 11, in comparison with Comparative Example 4 in which the test piece 5 is directly placed on the upper surface of the substrate 7, Example 6 in which the test piece 5 is placed on the upper surface of the sensor 1 including the light enhancement element is It can be seen that a clear Raman spectrum can be measured. As described above, by using the sensor 1, a spectrum clearer than a normal Raman spectrum can be obtained, so that measurement in a short time becomes possible.
- FIG. 12 shows the result of Raman mapping of the cardiomyocytes on the sensor 1 with a contrast difference given by the peak intensity of 754 cm ⁇ 1 . From the comparison with the optical microscope image of FIG. 10, it can be seen that the Raman mapping image of FIG. 12 reflects the shape of the tissue.
- the Raman mapping image obtained by scanning the excitation light. Based on this Raman mapping image, A living tissue as the test piece 5 can be diagnosed.
- the Raman spectrum can be detected by the excitation light irradiation in an extremely short time as described above, a wide-range Raman mapping image can be obtained in a short time. As a result, even when a two-dimensional image is obtained within a limited measurement time, the measurement target area can be widened.
- Example 7 Using the sensor 1 of the present invention, the vagus nerve of the esophagus (myelinated fiber: tissue section thickness 5 ⁇ m) as the test piece 5 was placed on the upper surface of the protective layer 11, and the same method and apparatus as in Example 4 were used. Excitation light was irradiated from the light source part 41, and the fluorescence spectrum from the test piece 5 and the two-dimensional fluorescence mapping image were measured.
- FIG. 13 is a microscopic image of a vagus nerve section of the esophagus as the test piece 5.
- Measurement device Raman-11 (manufactured by Nanophoton)
- Excitation light wavelength 532 nm, output 300 mW / mm 2 (50 mW / Line)
- Excitation light irradiation area Measurement area 32 in FIG. 13 (scanning range is about 1000 ⁇ m ⁇ 500 ⁇ m)
- Objective lens X10, NA 0.3 (Olympus)
- a two-dimensional fluorescence image was acquired by scanning a line of excitation light.
- One one-dimensional image has a width of about 740 ⁇ m and a slit width of about 70 ⁇ m, and requires a measurement time of 10 seconds.
- a fluorescence spectrum image in a range of about 740 ⁇ m ⁇ 460 ⁇ m (two-dimensional mapping image) Got.
- two-dimensional mapping was performed by scanning the excitation light, integrating the fluorescence spectrum having a wavelength of 560 to 630 nm, and adding a contrast difference depending on the intensity.
- the fluorescence mapping image obtained as a result is shown in FIG. From the comparison with the optical microscope image of FIG. 13, it can be seen that the fluorescence mapping image of FIG. 14 reflects the shape of the tissue.
- Example 7 it is understood that a wide range of two-dimensional mapping images can be obtained in a short time not only by Raman scattered light but also by spectral analysis using fluorescence.
- the high light emission enhancement effect of the sensor 1 it is possible to obtain fluorescence by irradiating with excitation light even for substances that have not been recognized as fluorescent substances in the past. The site expands dramatically.
- the method of the present invention does not exclude use of the test piece 5 in a method of measuring a fluorescence spectrum by labeling a dye and irradiating excitation light. Also in this case, since the light emission enhancing effect is high, as described above with reference to FIGS. 4 and 5, a non-light-emitting dye can be used as the labeling dye.
- This embodiment is different only in that the protective layer 11 provided in the sensor 1 described in the first embodiment is composed of an organic polymer having crystallinity (orientation), and the others are common.
- the organic polymer an acrylic polymer such as polymethyl methacrylate, polyvinyl alcohol, or the like can be used.
- the protective layer 11 is formed by dropping or applying the protective layer forming liquid onto the substrate 7 using a spin coat method, a dip coat method, a spray coat method, a slit coat method, a bar coat method, or the like.
- the spin coating method can be suitably used as a method for forming the protective layer 11 having the most uniform thickness.
- the protective layer forming liquid may be prepared by dissolving a predetermined polymer and a metal salt of a halogen in a solvent, or dissolving a predetermined polymer in the solvent.
- the solvent for preparing the protective layer forming liquid is appropriately selected according to the polymer and metal salt used. Specifically, any polymer that can dissolve the polymer and metal salt used may be used. For example, when a water-soluble polymer such as polyvinyl alcohol is used as the polymer, water can be used as the solvent. When a polymer insoluble in water such as polymethyl methacrylate is used as the polymer, for example, cyclohexanone is used as a solvent for preparing the polymer solution, and water and acetone are used as the solvent for preparing the metal salt solution.
- a protective layer forming solution can be prepared by mixing a polymer solution and a metal salt solution using a mixed solvent.
- the content ratio of the polymer in the protective layer forming liquid is determined by the combination of the above coating method and the target protective film thickness. For example, when a polyvinyl alcohol film is formed from the aqueous solution by using a spin coating method (3000 rpm), the content of the polymer necessary for adjusting the film thickness to 100 nm is about 4.5% by mass.
- the ratio of the metal salt in the protective layer forming liquid is set according to the content ratio of the halogen element in the target protective layer 11 and the content ratio of the polymer in the protective layer forming liquid.
- Example 8 In the same manner as in Example 1, an Ag fine particle monolayer film composed of a large number of metal (Ag) fine particles 10 as the enhanced electromagnetic field forming layer 9 was formed on the substrate 7.
- a protective layer forming solution was prepared by dissolving 5% by mass of polyvinyl alcohol (manufactured by Wako Pure Chemical Industries, Ltd., degree of polymerization of about 500) and 0.2 mmol / L of sodium chloride in pure water. . Thereafter, the prepared protective layer forming solution is applied to the surface of the substrate 7 by spin coating, and dried at about 60 ° C., and crystallization is promoted, thereby enhancing the electromagnetic field forming layer 9 including the surface portion of the substrate 7.
- the sensor 1 was produced by forming the protective layer 11 on the surface.
- the protective layer 11 had a crystallinity of 50% or more and a thickness of 110 nm.
- the upper surface of the protective layer 11 is spin-coated with a diluted ethanol solution of rhodamine 6G dye at 3000 revolutions so that the dye molecules are supported on the surface of the protective layer 11 at a density of 3 ⁇ 10 11 particles / cm 2. It was.
- Example 9 A light enhancement element was produced in the same manner as in Example 6 except that the protective layer forming solution was changed to one prepared as follows. That is, a polymer solution in which 3% by mass of polymethyl methacrylate (Wako Pure Chemical Industries, Ltd.) was dissolved in cyclohexanone (Wako Pure Chemical Industries, Ltd.) was prepared. On the other hand, a metal salt solution in which 20 mmol / L of sodium chloride was dissolved in a mixed solvent in which pure water and acetone were mixed at a mass ratio of 1: 1 was prepared. Then, a protective layer forming solution was prepared by mixing the polymer solution and the metal salt solution at a volume ratio of 9: 1.
- the intensity of Raman scattered light emitted from the sample (dye molecule) was measured by irradiating the sensor 1 of Example 8 and Example 9 with excitation light by the same method as in FIG. The result is shown in FIG. Similarly to FIG. 7, in the graph of FIG. 15, the vertical axis indicates the Raman scattering intensity (cps), and the horizontal axis indicates the Raman shift (cm ⁇ 1 ). From the graph of FIG. 15, even when the protective layer 11 is composed of an organic polymer, a strong Raman scattering signal can be confirmed, and it can be seen that the light enhancement effect can be propagated to the upper surface of the protective layer 11. .
- the senor 1 is configured to have a protective layer 11 made of an organic polymer, and a biological tissue as the test piece 5 is placed on the upper surface of the protective layer 11 to place the light source unit 41.
- a protective layer 11 made of an organic polymer
- a biological tissue as the test piece 5 is placed on the upper surface of the protective layer 11 to place the light source unit 41.
- the protective layer 11 contains a halogen element.
- the protective layer 11 may be made of an organic polymer without containing a halogen element. .
- the senor 1 may be configured to have a multilayer structure further including a highly reflective layer and a dielectric layer.
- the highly reflective layer and the dielectric layer are formed in this order on the surface of the substrate 7, and the enhanced electromagnetic field forming layer 9 is formed on the surface of the dielectric layer.
- the test piece 5 is placed on the upper surface of the protective layer 11 of the sensor 1 and the excitation light is irradiated from the test piece 5 side. 1 may be irradiated with excitation light from the back surface side (substrate 7 side) to obtain a Raman scattered light or fluorescence spectrum from the test piece 5.
Abstract
This invention provides an examination method whereby a section of body tissue can be examined using a simple device. Said method, which is used to examine specimens containing sections of body tissue, has the following steps: a step (a) in which a light-intensifying element that has a substrate, an intensifying-electromagnetic-field formation layer in which a large number of separate metal microparticles are dispersed across the surface of the substrate, and a protective layer formed on top of the substrate and the intensifying-electromagnetic-field formation layer is prepared; a step (b) in which a specimen to be examined is placed on the top surface of the protective layer; a step (c) in which the light-intensifying element is exposed to excitation light from either above or below; and a step (d) in which light emitted from the specimen is received and the emission spectrum thereof is measured.
Description
本発明は検査方法に関し、より詳細には、生体組織切片を含む試験片の検査方法であって、生体組織由来の発光スペクトルを高感度で分析できる検査方法に関する。
The present invention relates to an inspection method, and more particularly to an inspection method of a test piece including a biological tissue section, which can analyze an emission spectrum derived from a biological tissue with high sensitivity.
光を用いた生体分子イメージングを医療応用する方法としては、蛍光色素で染色し、目的とする細胞や生体組織切片に特異的に蓄積した色素からの蛍光を測定する方法が行われている。
As a method for medical application of biomolecule imaging using light, a method of staining with a fluorescent dye and measuring fluorescence from the dye specifically accumulated in a target cell or biological tissue section is performed.
また、蛍光ではなく、細胞や生体組織切片のラマン分光を、スペクトルの波長を選択して各部位ごとに測定しマッピングすれば、蛍光色素で染色する必要もなく、且つ、組織を切り取らなくても、細胞の状態を直接評価することが可能になる。
In addition, instead of fluorescence, Raman spectroscopy of cells and biological tissue sections can be measured and mapped for each site by selecting the wavelength of the spectrum, so that it is not necessary to stain with a fluorescent dye and tissue can be cut off. It becomes possible to directly evaluate the state of cells.
ラマン分光を高感度で測定する方法としてTERS(Tip-Enhanced Raman Scattering)法、誘導ラマン分光法、共鳴ラマン法などの方法が知られている(例えば非特許文献1参照)。
As a method for measuring Raman spectroscopy with high sensitivity, methods such as TERS (Tip-Enhanced Raman Scattering) method, stimulated Raman spectroscopy, resonance Raman method and the like are known (for example, see Non-Patent Document 1).
生体組織の検査は、当該部位に何らかの異常が存在しているか否かを判断する際に利用されることが多い。例えば、手術中において、対象となる部位を取り出して検査できる程度の大きさにスライスした後、蛍光色素で染色をした上で励起光を照射して、色素からの発光状態を病理医が観察する。このとき、当該部位に異常が存在するかどうか等の検査は、経験豊富で判定に習熟した病理医による組織診断が必要であり、検査可能な数が限られていた。それゆえスペクトルを利用した、より迅速で簡便であり且つ正確な診断方法が求められていた。
The examination of living tissue is often used to determine whether or not there is any abnormality in the part. For example, during surgery, the target region is taken out and sliced to a size that can be examined, and then stained with a fluorescent dye, irradiated with excitation light, and the pathologist observes the light emission state from the dye. . At this time, the examination of whether or not there is an abnormality in the part requires a tissue diagnosis by a pathologist who is experienced and skilled in judgment, and the number of examinations is limited. Therefore, there is a need for a more rapid, simple and accurate diagnostic method using spectra.
通常の非共鳴ラマン分光を用いた測定では、感度が低いため信号が弱く、画像を得るための必要十分な信号を得るには長い測定時間を要する。従って、限られた測定時間内に二次元画像を求める場合には、測定対象となるエリアを狭める必要がある。すなわち、検査を行う者が、予め測定対象エリアを狭い範囲内に特定した上で、当該領域に対して励起光の照射と、ラマンスペクトルの検出を行うことになる。このため、特定した測定対象エリア外に病変箇所が存在する場合には、かかる病変状態を見落とす可能性が高くなってしまう。
In measurement using ordinary non-resonance Raman spectroscopy, the signal is weak because of low sensitivity, and a long measurement time is required to obtain a necessary and sufficient signal for obtaining an image. Therefore, when obtaining a two-dimensional image within a limited measurement time, it is necessary to narrow the area to be measured. That is, the person who performs the inspection specifies the measurement target area in a narrow range in advance, and then irradiates the region with excitation light and detects the Raman spectrum. For this reason, when a lesion location exists outside the specified measurement target area, there is a high possibility that the lesion state is overlooked.
ラマン分光を高感度で測定する方法として、上記のTERS法が存在するが、この方法では、測定対象エリアが極めて狭くなってしまうので、前記の課題が発生してしまう。また、誘導ラマン分光法や共鳴ラマン法によれば、検査に必要な装置が大型化する上、高価な装置が必要となる。また特定のスペクトルのみが増幅されるなどの方法上の制約がある。
The above-mentioned TERS method exists as a method for measuring Raman spectroscopy with high sensitivity. However, in this method, the measurement target area becomes extremely narrow, and thus the above-described problem occurs. In addition, according to the stimulated Raman spectroscopy and the resonance Raman method, an apparatus required for inspection is increased in size and an expensive apparatus is required. There are also limitations on the method such that only a specific spectrum is amplified.
誘導ラマン分光法、共鳴ラマン法、及びTERS法では、いずれも広範囲を測定するには信号が微弱であるため、測定対象エリアを極めて狭く設定する必要がある上、その限られた領域(□1mm以下)を測定するにも、場合によっては数時間程度の長い時間を要する。組織診断には数cm以上の領域を観察する必要があるので、この方法によれば、実用に耐えないほど非常に時間がかかってしまう。誘導ラマン分光などの非線形ラマン分光法では、効率的な誘導ラマン散乱を誘起するためにパルスレーザや高NAレンズを必要とするため装置が大型化し、また一度に取得できる測定領域の制限が問題となる。そのため、ラマン分光スペクトルを高感度で且つ広いエリアを迅速に測定できる方法が望まれていた。
In all of the stimulated Raman spectroscopy, resonance Raman method, and TERS method, the signal is weak to measure a wide range. Therefore, it is necessary to set the measurement target area very narrow and its limited area (□ 1 mm In some cases, it takes a long time of several hours. Since it is necessary to observe an area of several centimeters or more for tissue diagnosis, this method takes a very long time to be practically unusable. In nonlinear Raman spectroscopy such as stimulated Raman spectroscopy, a pulse laser or a high NA lens is required to induce efficient stimulated Raman scattering, which increases the size of the device and limits the measurement area that can be acquired at one time. Become. Therefore, there has been a demand for a method capable of measuring a Raman spectrum spectrum with high sensitivity and quickly measuring a wide area.
また、上記の方法とは別に、従来、局在表面プラズモン効果を用いて最表面のラマンスペクトルや蛍光スペクトルを測定する方法が存在する。この方法は、局在表面プラズモン効果を実現させるための素子を準備し、この素子上に検査対象となる試験片を載置した状態で光を照射し、試験片からの発光をスペクトル分析する方法である。局在表面プラズモン効果により、試験片からの発光が増強される。
In addition to the above method, there is a conventional method for measuring the Raman spectrum and fluorescence spectrum of the outermost surface using the localized surface plasmon effect. In this method, a device for realizing a localized surface plasmon effect is prepared, light is irradiated in a state where a test piece to be inspected is placed on the device, and light emission from the test piece is spectrally analyzed. It is. The localized surface plasmon effect enhances light emission from the specimen.
しかし、この方法によれば、局在表面プラズモン効果を実現させるための素子は、表面に銀微粒子などが塗布されている。従って、生体物質を検査対象とする場合、この生体物質を素子上に載置すると、生体物質に含まれるハロゲン化物イオンと銀微粒子などが化学反応して変質し、銀微粒子の脱離や溶解などが生じて、光増強効果が得られなくなるという問題がある。つまり、従来は局在表面プラズモン効果を利用して、生体物質の検査は行えないと考えられていた。
However, according to this method, silver fine particles or the like are coated on the surface of the element for realizing the localized surface plasmon effect. Therefore, when a biological material is to be inspected, if this biological material is placed on the device, halide ions contained in the biological material and silver fine particles etc. are chemically reacted and altered, and the silver fine particles are detached and dissolved. Occurs, and the light enhancement effect cannot be obtained. In other words, conventionally, it has been thought that a biological material cannot be inspected using the localized surface plasmon effect.
本発明は、上記の課題に鑑み、簡易な装置によって、生体組織切片の検査が可能な検査方法を提供することを目的とする。
In view of the above problems, an object of the present invention is to provide an inspection method capable of inspecting a biological tissue section with a simple apparatus.
本発明の検査方法は、生体組織切片を含む試験片の検査方法であって、
基板と、前記基板の表面上に互いに独立して多数の金属微粒子が分散配置された増強電磁場形成層と、前記基板及び前記増強電磁場形成層の上層に形成された保護層とを有する光増強素子を準備する工程(a)、
前記保護層の上面に検査対象となる前記試験片を載置する工程(b)、
前記光増強素子に対して、上面から又は裏面から励起光を照射する工程(c)、
及び、前記試験片からの発光を受光して発光スペクトルを測定する工程(d)を有することを特徴とする。 The inspection method of the present invention is an inspection method of a test piece including a biological tissue section,
An optical enhancement element comprising: a substrate; an enhanced electromagnetic field forming layer in which a large number of metal fine particles are dispersed and arranged independently of each other on the surface of the substrate; and a protective layer formed on the substrate and the enhanced electromagnetic field forming layer Preparing step (a),
Placing the test piece to be inspected on the upper surface of the protective layer (b),
Irradiating excitation light to the light enhancement element from the upper surface or from the back surface (c),
And (d) measuring light emission spectrum by receiving light emitted from the test piece.
本発明の方法では、基板の表面上に互いに独立して多数の金属微粒子が分散配置された増強電磁場形成層を備える構成であるため、局在表面プラズモン効果を利用することができる。このため、エバネッセント波を利用した表面プラズモン効果とは異なり、基板に対する光の入射角度に関する厳しい制限がなく、自由度が担保される。
In the method of the present invention, the localized surface plasmon effect can be used because the structure includes an enhanced electromagnetic field forming layer in which a large number of metal fine particles are dispersed and arranged independently from each other on the surface of the substrate. For this reason, unlike the surface plasmon effect using evanescent waves, there is no strict restriction on the incident angle of light with respect to the substrate, and the degree of freedom is ensured.
また、本発明の方法では、増強電磁場形成層の上層に形成された保護層の上面に検査対象となる試験片が載置される。このため、試験片として生体組織切片のような生体物質を含む場合においても、この試験片は保護層に直接接触するのみであり、金属微粒子が直接試験片と長時間接触し続けるということがない。このため、金属微粒子がハロゲン化物イオンに直接長時間晒され続けることにより、ハロゲン化物イオンと金属微粒子などが化学反応して変質するということがない。この結果、金属微粒子として光の増強効果の高いAgを用いることが可能となる。なお、本発明の構成においては、金属微粒子としてAgを用いるのが好適であるが、他の金属材料(例えばAu)を用いても構わない。
Further, in the method of the present invention, a test piece to be inspected is placed on the upper surface of the protective layer formed on the enhanced electromagnetic field forming layer. For this reason, even when a biological material such as a biological tissue slice is included as a test piece, the test piece is only in direct contact with the protective layer, and the metal fine particles are not kept in direct contact with the test piece for a long time. . For this reason, when the metal fine particles are continuously exposed to the halide ions for a long time, the halide ions and the metal fine particles do not undergo chemical reaction and change in quality. As a result, Ag having a high light enhancement effect can be used as the metal fine particles. In the configuration of the present invention, Ag is preferably used as the metal fine particles, but other metal materials (for example, Au) may be used.
本発明のように局在表面プラズモン効果を利用する場合、増強電磁場形成層を構成する多数の金属微粒子の近傍箇所にのみ、その光の増強効果が作用する。試験片は、増強電磁場形成層の上層に形成された保護層の上面に載置されるが、増強電磁場形成層の上層に形成された保護層を介してその表面まで強い増強効果が及ぶため、金属微粒子から遠く離れた保護層の上面に載置された試験片に対して光増強作用を及ぼすことができる。よって、試験片としての生体組織由来の強い発光を得ることができる。
When utilizing the localized surface plasmon effect as in the present invention, the light enhancement effect acts only in the vicinity of a large number of metal fine particles constituting the enhanced electromagnetic field forming layer. Although the test piece is placed on the upper surface of the protective layer formed on the upper layer of the enhanced electromagnetic field forming layer, the strong enhancing effect reaches the surface through the protective layer formed on the upper layer of the enhanced electromagnetic field forming layer. A light enhancement effect can be exerted on the test piece placed on the upper surface of the protective layer far from the metal fine particles. Therefore, strong luminescence derived from a living tissue as a test piece can be obtained.
これにより、ラマン散乱光を利用したスペクトル分析が行えるため、ラマンスペクトルから生体組織の診断が可能になる。つまり、本方法によれば、異常が存在している場合のスペクトルデータと異常が存在していない場合のスペクトルデータを予め準備しておき、測定されたスペクトルデータとこれらを比較することで、生体組織の診断ができるため、経験豊富で判定に習熟した病理医でなくても、組織診断が行える。
Thereby, since spectrum analysis using Raman scattered light can be performed, it is possible to diagnose a living tissue from a Raman spectrum. That is, according to this method, spectrum data in the case where an abnormality exists and spectrum data in the case where no abnormality exists are prepared in advance, and by comparing these with the measured spectrum data, Since the tissue can be diagnosed, tissue diagnosis can be performed even by a pathologist who is not experienced and skilled in judgment.
また、本発明の手法は、試験片からのラマン散乱光だけでなく、蛍光のスペクトル分析にも利用できる。
The method of the present invention can be used not only for Raman scattered light from a test piece but also for fluorescence spectrum analysis.
この場合、局在表面プラズモン効果を利用できるため、発光増強効果が極めて高い。この結果、従来、通常状態では光らず、蛍光物質とは認識されていなかった物質の蛍光増強効果が利用できるので、蛍光物質の導入を行うことなく生体組織の蛍光スペクトル分析が可能になる。
In this case, since the localized surface plasmon effect can be used, the light emission enhancement effect is extremely high. As a result, the fluorescence enhancement effect of a substance that has not conventionally been lit in a normal state and has not been recognized as a fluorescent substance can be used. Therefore, a fluorescence spectrum analysis of a living tissue can be performed without introducing a fluorescent substance.
また、本発明の検査方法は、
前記工程(c)が、所定方向に走査しながら前記励起光を前記光増強素子に対して照射する工程であり、
前記工程(d)によって得られた発光スペクトルの強度分布を二次元マッピングする工程(e)を有することを特徴とする。 Moreover, the inspection method of the present invention includes:
The step (c) is a step of irradiating the light enhancement element with the excitation light while scanning in a predetermined direction.
The method includes a step (e) of two-dimensional mapping the intensity distribution of the emission spectrum obtained in the step (d).
この方法によれば、発光増強効果が極めて高いため、短時間で発光スペクトルの検出が可能である。この結果、生体切片試料の観察において、顕微ラマン計測装置を用いて広範囲の二次元マッピングを低倍率の対物レンズを用いて高速に行うことができる。また、従来よりも広いエリアのマッピングが可能になる。つまり、感度が高いため信号が強く、広い観測領域の画像を得るために必要十分な信号を得るには短い測定時間ですむからである。従って、限られた測定時間内に二次元画像を求める場合でも測定エリアを広くできる。
According to this method, since the light emission enhancement effect is extremely high, the emission spectrum can be detected in a short time. As a result, in observation of a biological section sample, a wide range of two-dimensional mapping can be performed at high speed using a low-magnification objective lens using a microscopic Raman measurement apparatus. In addition, it is possible to map a wider area than before. In other words, because the sensitivity is high, the signal is strong, and it takes a short measurement time to obtain a signal that is necessary and sufficient to obtain an image of a wide observation area. Therefore, the measurement area can be widened even when a two-dimensional image is obtained within a limited measurement time.
よって、異常が存在している場合のマッピング像と異常が存在していない場合のマッピング像を予め準備しておき、測定されたスペクトルデータに基づくマッピング像とこれらを比較することで、生体組織の診断ができるため、経験豊富で判定に習熟した病理医でなくても、組織診断が行える。
Therefore, a mapping image in the case where an abnormality exists and a mapping image in the case where no abnormality exists are prepared in advance, and by comparing these with a mapping image based on the measured spectrum data, Since diagnosis is possible, tissue diagnosis can be performed even if the pathologist is not an experienced and skilled in judgment.
なお、前記保護層は、前記多数の金属微粒子に関連して配向性を有する無機物質、又は配向性を有する有機物の重合体で構成されているものとしても構わない。
The protective layer may be composed of an inorganic substance having an orientation or an organic polymer having an orientation in connection with the numerous metal fine particles.
この構成により、増強電磁場形成層における局在表面プラズモン効果に起因した増強電磁場を、高効率で保護層の表面に伝達させることが可能となり、保護層の表面に載置された試験片を高効率で発光させることができる。
With this configuration, it is possible to transmit the enhanced electromagnetic field due to the localized surface plasmon effect in the enhanced electromagnetic field forming layer to the surface of the protective layer with high efficiency, and the test piece placed on the surface of the protective layer can be highly efficient. Can emit light.
また、前記保護層は、ハロゲン元素を含有するものとしても構わない。
The protective layer may contain a halogen element.
この構成により、増強電磁場形成層における局在表面プラズモン効果に起因した増強電磁場を、更に高効率で保護層の表面に伝達させることが可能となる。なお、この構成は、保護層を有しない構成において露出した金属微粒子にハロゲン化物イオンを直接接触させる場合とは異なり、保護層としてハロゲン元素を含有した材料を用いるというものであるので、上記の構成と同様に、ハロゲン化物イオンによる金属微粒子へのダメージを防御する機能は担保される。
With this configuration, it is possible to transmit the enhanced electromagnetic field caused by the localized surface plasmon effect in the enhanced electromagnetic field forming layer to the surface of the protective layer with higher efficiency. Note that this configuration is different from the case in which halide ions are brought into direct contact with the exposed metal fine particles in the configuration having no protective layer, and therefore, a material containing a halogen element is used as the protective layer. Similarly, the function of protecting the metal fine particles from damage by halide ions is secured.
本発明によれば、簡易な装置によって、生体組織切片の検査が実現できる。特に、短時間で広範囲にわたるイメージングが可能になると共に、習熟した病理医でなくても生体組織切片の診断が可能になる。
According to the present invention, a biological tissue section can be inspected with a simple device. In particular, a wide range of imaging can be performed in a short time, and a living tissue section can be diagnosed even without a skilled pathologist.
[第1実施形態]
本発明の第1実施形態につき、図面を参照して説明する。なお、各図において図面の寸法比と実際の寸法比は必ずしも一致しない。 [First Embodiment]
A first embodiment of the present invention will be described with reference to the drawings. In each figure, the dimensional ratio in the drawing does not necessarily match the actual dimensional ratio.
本発明の第1実施形態につき、図面を参照して説明する。なお、各図において図面の寸法比と実際の寸法比は必ずしも一致しない。 [First Embodiment]
A first embodiment of the present invention will be described with reference to the drawings. In each figure, the dimensional ratio in the drawing does not necessarily match the actual dimensional ratio.
〈センサ構造〉
図1は、本発明の検査方法に利用されるセンサの構造を模式的に示す図面である。センサ1は、基板7、増強電磁場形成層9及び保護層11を備えて光増強素子を構成している。そして、検査対象となる試験片5を保護層11の上面に載置して、検査を行う。 <Sensor structure>
FIG. 1 is a drawing schematically showing the structure of a sensor used in the inspection method of the present invention. Thesensor 1 includes a substrate 7, an enhanced electromagnetic field forming layer 9, and a protective layer 11 to constitute a light enhancement element. Then, the test piece 5 to be inspected is placed on the upper surface of the protective layer 11 and inspected.
図1は、本発明の検査方法に利用されるセンサの構造を模式的に示す図面である。センサ1は、基板7、増強電磁場形成層9及び保護層11を備えて光増強素子を構成している。そして、検査対象となる試験片5を保護層11の上面に載置して、検査を行う。 <Sensor structure>
FIG. 1 is a drawing schematically showing the structure of a sensor used in the inspection method of the present invention. The
基板7の材質は特に限定されるものではなく、例えば、ガラス、セラミックス、樹脂などを用いることができる。なお、後述するように、センサ1の作製工程において加熱処理(例えば100℃以上の加熱)が行われる場合には、例えばガラス、ポリイミド樹脂などの耐熱性を有するものであることが好ましい。
The material of the substrate 7 is not particularly limited, and for example, glass, ceramics, resin, or the like can be used. As will be described later, when heat treatment (for example, heating at 100 ° C. or higher) is performed in the manufacturing process of the sensor 1, it is preferable to have heat resistance such as glass or polyimide resin.
増強電磁場形成層9は、基板7の表面上に互いに独立して多数の金属微粒子10が分散配置されて構成されている。基板7の表面上における金属微粒子10の配列方法については、二次元的にランダムに配列された構成であっても、規則的に配列された構成であっても構わない。
The enhanced electromagnetic field forming layer 9 is configured by a large number of metal fine particles 10 being dispersed and arranged on the surface of the substrate 7 independently of each other. The arrangement method of the metal fine particles 10 on the surface of the substrate 7 may be a two-dimensional random arrangement or a regular arrangement.
増強電磁場形成層9を構成する金属微粒子10としては、例えばAgを好適に用いることができるが、励起光の照射により励起されて局在表面プラズモン効果を実現し得るものであれば、Au、Al、Cuなどの他の材料を利用することもできる。また、この金属微粒子10の形状としては、例えば扁平な半球形状、平板状の形状など、形状異方性を有するものを好適に用いることができる。なお、多数の金属微粒子10は、いずれも均一の大きさ及び形状を備えていることが望ましいが、大きさや形状に多少のばらつきがあっても構わない。
As the metal fine particles 10 constituting the enhanced electromagnetic field forming layer 9, for example, Ag can be suitably used, but Au, Al, and the like can be used as long as they can be excited by irradiation with excitation light to realize the localized surface plasmon effect. Other materials such as Cu can also be used. In addition, as the shape of the metal fine particles 10, for example, those having shape anisotropy such as a flat hemispherical shape or a flat plate shape can be suitably used. Note that it is desirable that all the metal fine particles 10 have a uniform size and shape, but there may be some variation in size and shape.
また、金属微粒子10の粒径としては、励起光の波長以下の大きさであることが好ましい。ここで、本明細書において「粒径」とは、顕微鏡法による投影面積円相当径をいう。具体的には、次のようにして求められる。センサ1の表面における任意に選ばれる領域について、長さ2μmの線分が長さ6cmに拡大(倍率30000倍)されるよう観察される走査型電子顕微鏡の視野領域(例えば1.5μm×2μm)を撮像領域として、センサ1における当該領域の二次電子像を得る。このとき、明るさの指標(256段階)が100程度以上の金属微粒子の各々について、金属微粒子10の面積と同一面積の真円の直径が当該金属微粒子10の粒径として得られる。
Further, the particle diameter of the metal fine particles 10 is preferably smaller than the wavelength of the excitation light. Here, in the present specification, “particle size” refers to a projected area equivalent circle diameter measured by microscopy. Specifically, it is obtained as follows. Field of view of a scanning electron microscope (for example, 1.5 μm × 2 μm) in which a 2 μm-long line segment is observed to be enlarged to a length of 6 cm (magnification: 30000 times) in an arbitrarily selected region on the surface of the sensor 1 As an imaging region, a secondary electron image of the region in the sensor 1 is obtained. At this time, for each of the metal fine particles having a brightness index (256 steps) of about 100 or more, the diameter of a perfect circle having the same area as the metal fine particle 10 is obtained as the particle diameter of the metal fine particle 10.
なお、金属微粒子10の粒径は、例えば5~300nmの範囲内であり、厚みは例えば5~70nmの範囲内である。また、増強電磁場形成層9を構成する金属微粒子10の密度は、例えば108~1011個/cm2程度とすることができる。
The particle size of the metal fine particles 10 is in the range of 5 to 300 nm, for example, and the thickness is in the range of 5 to 70 nm, for example. Further, the density of the metal fine particles 10 constituting the enhanced electromagnetic field forming layer 9 can be, for example, about 10 8 to 10 11 particles / cm 2 .
このような増強電磁場形成層9の形成方法の一例としては、基板7の表面に金属微粒子10の前駆体が適宜の溶媒に分散された分散液をスピンコート法により塗布して加熱する方法を用いることができる。また、別の方法としては、基板7の表面に金属微粒子10の前駆体をディッピングして加熱する方法、基板7の表面に金属微粒子10を真空蒸着する方法、基板7の表面に金属微粒子10をスパッタ蒸着する方法などを用いることができる。
As an example of a method for forming such an enhanced electromagnetic field forming layer 9, a method in which a dispersion liquid in which a precursor of metal fine particles 10 is dispersed in an appropriate solvent is applied to the surface of the substrate 7 by a spin coating method and heated. be able to. Further, as another method, a method of dipping the precursor of the metal fine particles 10 on the surface of the substrate 7 and heating, a method of vacuum-depositing the metal fine particles 10 on the surface of the substrate 7, and a method of depositing the metal fine particles 10 on the surface of the substrate 7 A sputter deposition method or the like can be used.
そして、センサ1において、隣接する金属微粒子10間において露出される基板7の表面を含む増強電磁場形成層9の上層には保護層11が形成されている。保護層11を構成する材料としては、例えば酸化ケイ素、酸化チタン、酸化セリウム、酸化ボロン、酸化リン、酸化マグネシウム、酸化カルシウム、酸化アルミニウム、酸化ガリウム、酸化ゲルマニウム、酸化亜鉛などを用いることができる。
In the sensor 1, a protective layer 11 is formed on the enhanced electromagnetic field forming layer 9 including the surface of the substrate 7 exposed between adjacent metal fine particles 10. Examples of the material constituting the protective layer 11 include silicon oxide, titanium oxide, cerium oxide, boron oxide, phosphorus oxide, magnesium oxide, calcium oxide, aluminum oxide, gallium oxide, germanium oxide, and zinc oxide.
保護層11の平均厚さは、例えば50~250nmであることが好ましい。特に、保護層11の厚さが85nm以上であることにより、試験片5が生体物質のようなハロゲン化物イオン(例えばCl-)を含有する場合であっても、金属微粒子10に対する十分な耐性(保護機能)が得られる。
The average thickness of the protective layer 11 is preferably 50 to 250 nm, for example. In particular, since the thickness of the protective layer 11 is 85 nm or more, even when the test piece 5 contains a halide ion (for example, Cl − ) such as a biological material, sufficient resistance to the metal fine particles 10 ( Protection function).
このようなセンサ1は、例えば以下の方法により作製される。まず、基板7の表面上に金属ナノ粒子膜を形成し、これを加熱処理することにより粒状性を変化させ、これにより、粒径が所定範囲内にある金属微粒子10による増強電磁場形成層9を形成する。このとき、形成すべき金属微粒子10の粒径は、加熱処理条件を適宜変更することにより調整できる。
Such a sensor 1 is manufactured by the following method, for example. First, a metal nanoparticle film is formed on the surface of the substrate 7, and the graininess is changed by heat-treating the film, whereby an enhanced electromagnetic field forming layer 9 made of metal fine particles 10 having a particle diameter within a predetermined range is formed. Form. At this time, the particle diameter of the metal fine particles 10 to be formed can be adjusted by appropriately changing the heat treatment conditions.
次に、隣接する金属微粒子10間において露出される基板7の表面部分を含む増強電磁場形成層9の表面上に、蒸着法により、金属微粒子10を起点として保護層を厚さ方向に成長させることにより柱状組織構造を有する保護層11を形成する。保護層11の厚さは、成長条件、時間を適宜変更することにより調整できる。また、保護層11の形成方法としては、高周波(RF)スパッタ蒸着法、電子線蒸着法、又は電子サイクロトロン共鳴(ECR)スパッタ蒸着法などの方法を適宜選択して利用できる。
Next, a protective layer is grown in the thickness direction from the metal fine particle 10 as a starting point on the surface of the enhanced electromagnetic field forming layer 9 including the surface portion of the substrate 7 exposed between the adjacent metal fine particles 10 by vapor deposition. Thus, the protective layer 11 having a columnar structure is formed. The thickness of the protective layer 11 can be adjusted by appropriately changing the growth conditions and time. Moreover, as a formation method of the protective layer 11, methods, such as a radio frequency (RF) sputter vapor deposition method, an electron beam vapor deposition method, or an electron cyclotron resonance (ECR) sputter vapor deposition method, can be selected suitably and can be utilized.
〈センサ1の使用方法〉
次に、本実施形態のセンサ1を用いて試験片5の検査を行う方法について説明する。図2は、検査方法を説明するための概念図である。なお、ここでは、試験片5が載置されたセンサ1に対して励起光を照射し、試験片5から放射されるラマン散乱光を受光してスペクトル分析を行う方法について説明する。 <How to usesensor 1>
Next, a method for inspecting thetest piece 5 using the sensor 1 of the present embodiment will be described. FIG. 2 is a conceptual diagram for explaining the inspection method. Here, a method for performing spectrum analysis by irradiating the sensor 1 on which the test piece 5 is placed with excitation light and receiving Raman scattered light emitted from the test piece 5 will be described.
次に、本実施形態のセンサ1を用いて試験片5の検査を行う方法について説明する。図2は、検査方法を説明するための概念図である。なお、ここでは、試験片5が載置されたセンサ1に対して励起光を照射し、試験片5から放射されるラマン散乱光を受光してスペクトル分析を行う方法について説明する。 <How to use
Next, a method for inspecting the
本実施形態では、検査に際し、センサ1の上方、すなわち試験片5が載置された側から励起光を照射するための光源部41及び、試験片5からの発光を受光するための受光部43を利用する。光源部41は、励起光源50、フィルタ51、ミラー61を備える。受光部43は、フィルタ53、分光器55及び光検出器56を備える。また、図2においては、光源部41からの光を透過し、試験片5からの発光を反射するハーフミラー62を備える構成としている。また、集光レンズ52は、光源部41からの励起光の集光や試験片5からの発光を集光する目的で設置されている。図2に示す装置構成は、あくまで一例であって、この構成に限定されるものではない。
In the present embodiment, at the time of inspection, a light source unit 41 for irradiating excitation light from above the sensor 1, that is, a side on which the test piece 5 is placed, and a light receiving unit 43 for receiving light emitted from the test piece 5. Is used. The light source unit 41 includes an excitation light source 50, a filter 51, and a mirror 61. The light receiving unit 43 includes a filter 53, a spectroscope 55, and a photodetector 56. In FIG. 2, a half mirror 62 that transmits light from the light source unit 41 and reflects light emitted from the test piece 5 is provided. The condensing lens 52 is installed for the purpose of condensing excitation light from the light source unit 41 and light emission from the test piece 5. The apparatus configuration shown in FIG. 2 is merely an example, and the present invention is not limited to this configuration.
試験片5を保護層11上に載置した状態で、光源部41から励起光をセンサ1に向けて入射させる。入射された光により、センサ1の増強電磁場形成層9において生成したプラズモン電場が、保護層11の上面に載置された試験片5に伝搬する。これにより、試験片5に対して強い励起光が及ぼされ、試験片5から高い出力のラマン散乱光が放射される。このラマン散乱光は、ハーフミラー62で反射されて受光部43にて受光される。受光部43の分光器55によって波長分解されて、光検出器56によって受光された光のスペクトル分布が得られる。
In a state where the test piece 5 is placed on the protective layer 11, excitation light is incident from the light source unit 41 toward the sensor 1. Due to the incident light, the plasmon electric field generated in the enhanced electromagnetic field forming layer 9 of the sensor 1 propagates to the test piece 5 placed on the upper surface of the protective layer 11. Thereby, strong excitation light is exerted on the test piece 5, and high-output Raman scattered light is emitted from the test piece 5. The Raman scattered light is reflected by the half mirror 62 and received by the light receiving unit 43. Wavelength decomposition is performed by the spectroscope 55 of the light receiving unit 43, and a spectral distribution of the light received by the photodetector 56 is obtained.
試験片5として生体組織切片を含む生体物質を想定する。増強電磁場形成層9によって形成された増強電磁場は、電磁場伝搬性を有する保護層11を介して、試験片5、すなわち生体組織の分子種を選択的に励起し、これにより生体組織由来のラマン信号が選択的に得られる。このようにして生じる増強ラマン散乱光は増強電磁場形成層9と光学的に強く結合しているため、増強電磁場形成層9はこの散乱光を受光部43に効率よく導き、もってこれらの相乗効果により強いラマン信号を与える。
Suppose a biological material including a biological tissue section as the test piece 5. The enhanced electromagnetic field formed by the enhanced electromagnetic field forming layer 9 selectively excites the specimen 5, that is, the molecular species of the biological tissue, via the protective layer 11 having electromagnetic field propagating properties, thereby the Raman signal derived from the biological tissue. Is selectively obtained. The enhanced Raman scattered light generated in this way is optically strongly coupled to the enhanced electromagnetic field forming layer 9, so that the enhanced electromagnetic field forming layer 9 efficiently guides this scattered light to the light receiving portion 43, and thus, due to the synergistic effect thereof. Gives a strong Raman signal.
〈センサ1の性能についての説明〉
以下、センサ1が備える増強電磁場形成層9によって、光増強効果が実現できる点につき、実施例を参照しながら説明する。 <Description ofsensor 1 performance>
Hereinafter, the fact that the light enhancement effect can be realized by the enhanced electromagneticfield forming layer 9 provided in the sensor 1 will be described with reference to the examples.
以下、センサ1が備える増強電磁場形成層9によって、光増強効果が実現できる点につき、実施例を参照しながら説明する。 <Description of
Hereinafter, the fact that the light enhancement effect can be realized by the enhanced electromagnetic
(実施例1)
まず、実施例1のセンサ1の作製方法につき説明する。基板7として数cm角の大きさのスライドガラスを用い、このスライドガラスの表面上に、Agを10nm程度の厚みで蒸着させて金属微粒子10を形成するためのAg膜を形成した。その後、約100℃のホットプレート上で、Ag膜が形成された基板7を数分間加熱処理することにより、Ag膜の粒状性を変化させて増強電磁場形成層9としての多数の金属(Ag)微粒子10によるAg微粒子単層膜を形成した。得られたAg微粒子単層膜における金属微粒子10の粒径は、50~150nmの範囲内にあり、厚さは平均で約20nmであり、金属微粒子10の密度はおおよそ5×10⁹個/cm2であった。 (Example 1)
First, a method for manufacturing thesensor 1 of Example 1 will be described. A glass slide having a size of several centimeters was used as the substrate 7, and an Ag film for forming the metal fine particles 10 was formed on the surface of the glass slide by depositing Ag with a thickness of about 10 nm. Thereafter, the substrate 7 on which the Ag film is formed is heated for several minutes on a hot plate at about 100 ° C., thereby changing the granularity of the Ag film and thereby increasing the number of metals (Ag) as the enhanced electromagnetic field forming layer 9. An Ag fine particle monolayer film of fine particles 10 was formed. The particle diameter of the metal fine particles 10 in the obtained Ag fine particle monolayer film is in the range of 50 to 150 nm, the thickness is about 20 nm on average, and the density of the metal fine particles 10 is approximately 5 × 10 9 particles / cm 3. 2 .
まず、実施例1のセンサ1の作製方法につき説明する。基板7として数cm角の大きさのスライドガラスを用い、このスライドガラスの表面上に、Agを10nm程度の厚みで蒸着させて金属微粒子10を形成するためのAg膜を形成した。その後、約100℃のホットプレート上で、Ag膜が形成された基板7を数分間加熱処理することにより、Ag膜の粒状性を変化させて増強電磁場形成層9としての多数の金属(Ag)微粒子10によるAg微粒子単層膜を形成した。得られたAg微粒子単層膜における金属微粒子10の粒径は、50~150nmの範囲内にあり、厚さは平均で約20nmであり、金属微粒子10の密度はおおよそ5×10⁹個/cm2であった。 (Example 1)
First, a method for manufacturing the
その後、RFスパッタ装置「RFS-200型」(Ulvac社製)を用いて、酸化ケイ素(SiO2)をターゲットとして下記条件でスパッタを行うことにより、隣接する金属微粒子10間において露出される基板7の表面部分を含む増強電磁場形成層9の表面上に保護層11を形成することでセンサ1を作製した。なお、保護層11の厚さは、スパッタ時間を適宜に変更することにより調整した。
Thereafter, using an RF sputtering apparatus “RFS-200 type” (manufactured by Ulvac), sputtering is performed under the following conditions using silicon oxide (SiO 2 ) as a target, thereby exposing the substrate 7 exposed between the adjacent metal fine particles 10. The sensor 1 was produced by forming the protective layer 11 on the surface of the enhanced electromagnetic field forming layer 9 including the surface portion of the above. The thickness of the protective layer 11 was adjusted by appropriately changing the sputtering time.
スパッタ条件は以下のとおりである。
・ターゲットから増強電磁場形成層9の表面までの離間距離:45mm
・雰囲気:Ar 3.0Pa(放電時)
・放電出力:100W
・RF周波数:13.6MHz
・保護層11の成長速度:8.5nm/分 The sputtering conditions are as follows.
-Distance from the target to the surface of the enhanced electromagnetic field forming layer 9: 45 mm
・ Atmosphere: Ar 3.0Pa (during discharge)
・ Discharge output: 100W
・ RF frequency: 13.6MHz
-Growth rate of the protective layer 11: 8.5 nm / min
次に、実施例1として作製されたセンサ1に対する性能検証方法について説明する。ここでは、センサ1が光増強効果を有することを示す目的で、蛍光の増強効果の検証を行う。すなわち、センサ1に対し、保護層11の表面上にローダミン6G色素(Rh6G:発光量子収率およそ1)の希薄エタノール溶液を3000回転でスピンコートすることにより、色素分子を保護層11の表面上に担持させた。センサ1の表面に担持される色素分子の密度とスピンコートに用いた溶液の色素濃度との関係は、ローダミン6G色素の濃度が1μMである場合に、色素分子の担持量が3×10¹¹個/cm2である。
Next, a performance verification method for the sensor 1 manufactured as Example 1 will be described. Here, in order to show that the sensor 1 has a light enhancement effect, the fluorescence enhancement effect is verified. That is, the dye molecule is coated on the surface of the protective layer 11 by spin-coating a diluted ethanol solution of rhodamine 6G dye (Rh6G: emission quantum yield of about 1) at 3000 revolutions on the surface of the protective layer 11 on the sensor 1. It was made to carry on. The relationship between the density of the dye molecules carried on the surface of the sensor 1 and the dye concentration of the solution used for spin coating is that the amount of dye molecules carried is 3 × 10 11 when the concentration of rhodamine 6G dye is 1 μM. / Cm 2 .
なお、発光量子収率Φとは、分子に吸収された光子数と蛍光により放出された光子数の比で定義される(数1参照)。ここでkfが電子励起状態にある分子の蛍光遷移速度定数であり、knrが無輻射遷移速度定数(単位時間当たりに消光を起こす速さ)である。
(数1)
Φ=kf/(kf+knr) The emission quantum yield Φ is defined by the ratio between the number of photons absorbed by the molecule and the number of photons emitted by fluorescence (see Equation 1). Here, k f is a fluorescence transition rate constant of a molecule in an electronically excited state, and knr is a non-radiative transition rate constant (speed at which quenching occurs per unit time).
(Equation 1)
Φ = k f / (k f + k nr)
励起された分子のすべてが蛍光によって基底状態に戻れば、発光量子収率は1となり、この値に近い発光量子収率を持つ物質を「発光量子収率の高い物質」と呼ぶ。しかし、実際には、無輻射遷移によって1とはならない。無輻射遷移とは、蛍光を発しないで基底状態に戻る遷移である。発光量子収率が低い色素とはkf<knrである色素のことである。なお、kf<<knrの条件ではほとんど発光せず、このような条件を満たす色素を非発光性色素と呼ぶ。
If all excited molecules return to the ground state by fluorescence, the emission quantum yield becomes 1, and a substance having an emission quantum yield close to this value is called a “substance with a high emission quantum yield”. However, in practice, it is not 1 due to non-radiative transition. The non-radiative transition is a transition that returns to the ground state without emitting fluorescence. A dye having a low emission quantum yield is a dye having k f <kn nr . Note that a dye that hardly emits light under the condition of k f << k nr is called a non-light emitting dye.
センサ1に対して励起光を照射して試料(色素分子)から発せられる光の強度を図3に示す測定装置により測定した。図3は、センサ1の性能を検証するための測定装置の概念図である。励起光源50としてのダイオードレーザ及びフィルタ51によって光源部41を構成し、光源部41からセンサ1に対して光を入射させ、保護層11の表面上に担持させた色素分子からの光を受光部43によって受光する。受光部43は、集光レンズ52、フィルタ53、受光ヘッド54及び光検出器55(電子冷却型ダイオードアレイ検出器)によって構成した。
The intensity of light emitted from the sample (dye molecule) by irradiating the sensor 1 with excitation light was measured by a measuring apparatus shown in FIG. FIG. 3 is a conceptual diagram of a measuring device for verifying the performance of the sensor 1. A light source unit 41 is configured by the diode laser as the excitation light source 50 and the filter 51, light is incident on the sensor 1 from the light source unit 41, and light from the dye molecules carried on the surface of the protective layer 11 is received by the light receiving unit. 43 receives light. The light receiving unit 43 is composed of a condenser lens 52, a filter 53, a light receiving head 54, and a photodetector 55 (electronically cooled diode array detector).
より詳細には、励起光源50としては、出力1mW未満の緑色ダイオードレーザ(波長532nm)を用い、この励起光源50からの射出光を、フィルタ51を介して非集光(エネルギー密度約30mW/cm2)又は反集光(エネルギー密度約10mW/cm2以下)励起光としてセンサ1に対して、約45°の角度で入射させる。そして、センサ1に担持された色素分子による90°の角度方向に散乱される光を、集光レンズ52によって、光検出器55の受光ヘッド54にフィルタ53を介して集光した。
More specifically, a green diode laser (wavelength of 532 nm) having an output of less than 1 mW is used as the excitation light source 50, and light emitted from the excitation light source 50 is not condensed through the filter 51 (energy density is about 30 mW / cm). 2 ) or anti-condensation (energy density of about 10 mW / cm 2 or less) is made incident on the sensor 1 at an angle of about 45 ° as excitation light. Then, the light scattered in the 90 ° angle direction by the dye molecules carried on the sensor 1 was condensed by the condenser lens 52 onto the light receiving head 54 of the photodetector 55 through the filter 53.
図3に示す測定装置による測定結果を図4に示す。図4において、縦軸は発光の増強度(単位:倍)を示しており、増強効果がないガラス基板上に担持された同じ量の色素について同じ方法で測定された発光強度に対する相対比率に対応する。
FIG. 4 shows the measurement results of the measurement apparatus shown in FIG. In FIG. 4, the vertical axis represents the increase in luminescence intensity (unit: times), corresponding to the relative ratio to the luminescence intensity measured by the same method for the same amount of dye supported on the glass substrate without the enhancement effect. To do.
また、試料としてローダミン6G色素に代えて非発光性のフクシン色素(発光量子収率<<0.01)を用い、保護層11の表面上に3×10¹²個/cm2の密度で担持させ、上記と同様の方法により発光強度を測定した。この測定結果を図5に示す。
In addition, a non-luminescent fuchsine dye (luminescence quantum yield << 0.01) is used instead of rhodamine 6G dye as a sample, and the sample is supported on the surface of the protective layer 11 at a density of 3 × 10 12 particles / cm 2. The emission intensity was measured by the same method as described above. The measurement results are shown in FIG.
図4及び図5によれば、色素自体の発光量子収率とは関係なく、保護層11の膜厚を200nm以上としても高い発光増強率が維持されていることが分かる。特に、発光量子収率が0.01未満、すなわち非発光性の色素に対しては、数千倍以上の光増強率が確保されていることが分かる。これにより、金属微粒子10の上層に、所定の膜厚の保護層11を形成しても、その上面にまで発光増強効果を伝搬できることが分かる。
4 and 5, it can be seen that a high light emission enhancement rate is maintained even when the thickness of the protective layer 11 is 200 nm or more regardless of the light emission quantum yield of the dye itself. In particular, it can be seen that a light enhancement factor of several thousand times or more is ensured for a dye having an emission quantum yield of less than 0.01, that is, a non-luminescent pigment. Thereby, even if the protective layer 11 having a predetermined thickness is formed on the upper layer of the metal fine particles 10, it can be seen that the light emission enhancing effect can be propagated to the upper surface.
すなわち、本発明のセンサ1によれば、分子発光双極子と双極子型表面プラズモン(局在表面プラズモン)の相互作用により、結果的に色素の輻射遷移速度kf(上記数1参照)が大きくなる。これにより、kf>>knrとなるため、上式の発光量子収率が大きくなり、もともとは発光量子収率が0.01以下の非発光性物質(kf<<knr)である色素でも光を強く発するようになることが分かる。
That is, according to the sensor 1 of the present invention, due to the interaction between the molecular emission dipole and the dipole-type surface plasmon (localized surface plasmon), the radiation transition speed k f of the dye (see the above formula 1) is increased as a result. Become. Thereby, since k f >> kn nr , the above-mentioned light emission quantum yield becomes large, and originally, it is a non-light emitting substance (k f << k nr ) whose light emission quantum yield is 0.01 or less. It can be seen that even pigments emit light strongly.
なお、別の検証として、励起光源50として、ダイオードレーザに代えて出力1mW未満のHe-Neレーザ(波長632.8nm)を用いた他は、図3と同じ配置でローダミン6G色素のラマン散乱強度を保護層11の厚さの関数として測定した。この結果、保護層11の膜厚が200nmを超えても、色素分子が直接に金属微粒子10に表面に吸着した場合に得られた信号と変わらない大きさの増強ラマン信号(増強度は約105倍)が得られた。
As another verification, the Raman scattering intensity of rhodamine 6G dye with the same arrangement as in FIG. 3 except that a He—Ne laser (wavelength 632.8 nm) with an output of less than 1 mW was used as the excitation light source 50 instead of the diode laser. Was measured as a function of the thickness of the protective layer 11. As a result, even if the film thickness of the protective layer 11 exceeds 200 nm, an enhanced Raman signal (intensity is about 10) which is not different from the signal obtained when the dye molecules are directly adsorbed on the surface of the metal fine particles 10. 5 times) was obtained.
このように増強効果が保護層11の膜厚程度分を伝搬する理由の一つとしては、以下の点が考えられる。蒸着により配向性を持った誘電体で形成された柱状の保護層11中では、プラズモン電場が乱されず、損失を受けずに保護層11の表面にまで達する。従って、保護層11の厚さをある程度大きくした場合であっても、金属微粒子10に生ずる電磁場(局在表面プラズモン)が保護層11の表面に伝達される。
The following points can be considered as one of the reasons why the enhancement effect propagates as much as the thickness of the protective layer 11 as described above. In the columnar protective layer 11 formed of a dielectric having orientation by vapor deposition, the plasmon electric field is not disturbed and reaches the surface of the protective layer 11 without loss. Therefore, even when the thickness of the protective layer 11 is increased to some extent, the electromagnetic field (localized surface plasmon) generated in the metal fine particles 10 is transmitted to the surface of the protective layer 11.
つまり、図2に示すように、保護層11の表面に生体物質からなる試験片5を載置して励起光を照射することで、試験片5に対して増強電磁場の影響が及び、これにより、試験片5を構成する物質、すなわち生体組織由来のスペクトルを強く含む光が放射される。受光部43でこの発光を受光してスペクトル分布を得ることで、生体組織の分析が行える。
That is, as shown in FIG. 2, by placing the test piece 5 made of a biological material on the surface of the protective layer 11 and irradiating it with excitation light, the test piece 5 is influenced by an enhanced electromagnetic field. The substance that constitutes the test piece 5, that is, light that strongly contains a spectrum derived from living tissue is emitted. The light receiving unit 43 receives this light emission and obtains a spectrum distribution, whereby the biological tissue can be analyzed.
(実施例2)
実施例1と同様の方法により作製されたセンサ1に対し、フクシン色素で標識した抗体IgGの水溶液を滴下した。より詳細には、保護層11の上面にフクシン色素で標識した抗体IgGの水溶液を滴下した。 (Example 2)
An aqueous solution of antibody IgG labeled with a fuchsin dye was added dropwise to thesensor 1 produced by the same method as in Example 1. More specifically, an aqueous solution of antibody IgG labeled with a fuchsin dye was dropped onto the upper surface of the protective layer 11.
実施例1と同様の方法により作製されたセンサ1に対し、フクシン色素で標識した抗体IgGの水溶液を滴下した。より詳細には、保護層11の上面にフクシン色素で標識した抗体IgGの水溶液を滴下した。 (Example 2)
An aqueous solution of antibody IgG labeled with a fuchsin dye was added dropwise to the
(比較例1)
基板7に対し、実施例2と同様にフクシン色素で標識した抗体IgGの水溶液を滴下した。 (Comparative Example 1)
An aqueous solution of antibody IgG labeled with a fuchsin dye was dropped onto the substrate 7 in the same manner as in Example 2.
基板7に対し、実施例2と同様にフクシン色素で標識した抗体IgGの水溶液を滴下した。 (Comparative Example 1)
An aqueous solution of antibody IgG labeled with a fuchsin dye was dropped onto the substrate 7 in the same manner as in Example 2.
そして、実施例2及び比較例1のそれぞれの素子に対し、図3に示す測定装置によって励起光を入射させて、受光部43で得られた光のスペクトル分布を調べた結果を図6に示す。なお、図6において、横軸は光の波長、縦軸は発光強度を表している。
Then, FIG. 6 shows the result of examining the spectral distribution of the light obtained by the light receiving unit 43 by causing excitation light to enter the respective elements of Example 2 and Comparative Example 1 using the measuring device shown in FIG. . In FIG. 6, the horizontal axis represents the wavelength of light, and the vertical axis represents the emission intensity.
図6を参照すると、実施例2の構成によれば、非発光性の標識物質であるフクシン色素は、増強電磁場形成層9によって生じる局在プラズモンとの保護層11を介した相互作用で発光量子収率が向上し、それに伴ってフクシン色素が発する光の光量が著しく増加していることが分かる。これに対し、比較例1の構成によれば、発光の増強効果はない。これにより、本発明のセンサ1が極めて高い発光増強効果を有していることが分かる。
Referring to FIG. 6, according to the configuration of Example 2, the fuchsin dye, which is a non-luminescent labeling substance, emits luminescence quantum by the interaction through the protective layer 11 with the localized plasmon generated by the enhanced electromagnetic field forming layer 9. It can be seen that the yield is improved and the amount of light emitted by the fuchsin dye is significantly increased. On the other hand, according to the configuration of Comparative Example 1, there is no light emission enhancement effect. This shows that the sensor 1 of the present invention has a very high light emission enhancement effect.
(実施例3)
実施例1と同様の方法により作製されたセンサ1の保護層11の上面に、低発光量子収率を有する自家発光性の生体高分子コラーゲンの水溶液をスピンコートした。 (Example 3)
An aqueous solution of a self-luminous biopolymer collagen having a low luminescence quantum yield was spin-coated on the upper surface of theprotective layer 11 of the sensor 1 produced by the same method as in Example 1.
実施例1と同様の方法により作製されたセンサ1の保護層11の上面に、低発光量子収率を有する自家発光性の生体高分子コラーゲンの水溶液をスピンコートした。 (Example 3)
An aqueous solution of a self-luminous biopolymer collagen having a low luminescence quantum yield was spin-coated on the upper surface of the
(比較例2)
基板7に対し、実施例3と同様に、低発光量子収率を有する自家発光性の生体高分子コラーゲンの水溶液をスピンコートした。 (Comparative Example 2)
Similarly to Example 3, the substrate 7 was spin-coated with an aqueous solution of self-luminous biopolymer collagen having a low luminescence quantum yield.
基板7に対し、実施例3と同様に、低発光量子収率を有する自家発光性の生体高分子コラーゲンの水溶液をスピンコートした。 (Comparative Example 2)
Similarly to Example 3, the substrate 7 was spin-coated with an aqueous solution of self-luminous biopolymer collagen having a low luminescence quantum yield.
(実施例4)
実施例1と同様の方法により作製されたセンサ1の保護層11の上面に、低発光量子収率を有する自家発光性のリボフラビンの水溶液をスピンコートした。 Example 4
An aqueous solution of self-luminous riboflavin having a low emission quantum yield was spin-coated on the upper surface of theprotective layer 11 of the sensor 1 produced by the same method as in Example 1.
実施例1と同様の方法により作製されたセンサ1の保護層11の上面に、低発光量子収率を有する自家発光性のリボフラビンの水溶液をスピンコートした。 Example 4
An aqueous solution of self-luminous riboflavin having a low emission quantum yield was spin-coated on the upper surface of the
(比較例3)
基板7に対し、実施例4と同様に、低発光量子収率を有する自家発光性のリボフラビンの水溶液をスピンコートした。 (Comparative Example 3)
Similarly to Example 4, the substrate 7 was spin-coated with an aqueous solution of self-luminous riboflavin having a low emission quantum yield.
基板7に対し、実施例4と同様に、低発光量子収率を有する自家発光性のリボフラビンの水溶液をスピンコートした。 (Comparative Example 3)
Similarly to Example 4, the substrate 7 was spin-coated with an aqueous solution of self-luminous riboflavin having a low emission quantum yield.
実施例3及び比較例2のそれぞれの素子に対し、図3に示す測定装置によって励起光を入射させて、受光部43で得られた光のスペクトル分布を調べた結果を図7に示す。同様に、実施例4及び比較例3のそれぞれの素子に対し、図3に示す測定装置によって励起光を入射させて、受光部43で得られた光のスペクトル分布を調べた結果を図8に示す。なお、図7及び図8において、横軸は光の波長、縦軸は発光強度を表している。
FIG. 7 shows the results of examining the spectral distribution of the light obtained by the light receiving unit 43 by causing excitation light to enter the elements of Example 3 and Comparative Example 2 using the measuring device shown in FIG. Similarly, FIG. 8 shows the result of examining the spectral distribution of the light obtained by the light receiving unit 43 by causing excitation light to enter the elements of Example 4 and Comparative Example 3 using the measuring apparatus shown in FIG. Show. 7 and 8, the horizontal axis represents the wavelength of light, and the vertical axis represents the emission intensity.
図7を参照すると、実施例3の構成によれば、低発光量子収率を有する自家発光性の生体高分子コラーゲンは、増強電磁場形成層9によって生じる局在プラズモンとの保護層11を介した相互作用で発光量子収率が向上し、それに伴って生体高分子コラーゲンが発する光の光量が著しく増加していることが分かる。これに対し、比較例2の構成によれば、発光の増強効果はなく、自家発光性の生体高分子コラーゲンからの発光を受光することによる分析が困難であることが示唆される。
Referring to FIG. 7, according to the configuration of Example 3, the self-luminous biopolymer collagen having a low luminescence quantum yield passes through the protective layer 11 with the localized plasmon generated by the enhanced electromagnetic field forming layer 9. It can be seen that the quantum yield of light emission is improved by the interaction, and the amount of light emitted from the biopolymer collagen is significantly increased. On the other hand, according to the structure of Comparative Example 2, there is no effect of enhancing luminescence, and it is suggested that analysis by receiving light emitted from self-luminous biopolymer collagen is difficult.
同様に、図8を参照すると、実施例4の構成によれば、低発光量子収率を有する自家発光性のリボフラビンは、増強電磁場形成層9によって生じる局在プラズモンとの保護層11を介した相互作用で発光量子収率が向上し、それに伴ってリボフラビンが発する光の光量が著しく増加していることが分かる。これに対し、比較例3の構成によれば、発光の増強効果はなく、自家発光性のリボフラビンからの発光を受光することによる分析が困難であることが示唆される。
Similarly, referring to FIG. 8, according to the configuration of Example 4, the self-luminous riboflavin having a low emission quantum yield passes through the protective layer 11 with the localized plasmon generated by the enhanced electromagnetic field forming layer 9. It can be seen that the quantum yield of light emission is improved by the interaction, and the amount of light emitted by riboflavin is significantly increased. On the other hand, according to the configuration of Comparative Example 3, there is no light emission enhancement effect, which suggests that analysis by receiving light emitted from self-luminous riboflavin is difficult.
〈別構成のセンサ1の性能についての説明〉
センサ1が有する保護層11に予めハロゲン元素を含有させても構わない。保護層11に対してハロゲン元素を含有させる方法としては、保護層11が形成されたセンサ1に対してハロゲン化物塩の水溶液に浸漬する方法を用いることができる。例えば、ハロゲン化物塩水溶液の濃度が0.1~0.3mol/Lの場合には、5~30分間程度の室温浸漬により最大の効果を得ることができるが、水溶液の濃度がそれより高い場合、あるいは逆に低い場合には、その濃度に応じて浸漬時間を調整することにより同等の効果を得ることができる。なお、保護層11におけるハロゲン元素の含有割合は、0.002質量%~0.05質量%であることが好ましい。 <Description of Performance ofSensor 1 with Different Configuration>
Theprotective layer 11 of the sensor 1 may contain a halogen element in advance. As a method of containing the halogen element in the protective layer 11, a method of immersing the sensor 1 in which the protective layer 11 is formed in an aqueous solution of a halide salt can be used. For example, when the concentration of the halide salt aqueous solution is 0.1 to 0.3 mol / L, the maximum effect can be obtained by room temperature immersion for about 5 to 30 minutes, but the concentration of the aqueous solution is higher than that. On the other hand, if it is low, the same effect can be obtained by adjusting the immersion time according to the concentration. The halogen element content in the protective layer 11 is preferably 0.002% by mass to 0.05% by mass.
センサ1が有する保護層11に予めハロゲン元素を含有させても構わない。保護層11に対してハロゲン元素を含有させる方法としては、保護層11が形成されたセンサ1に対してハロゲン化物塩の水溶液に浸漬する方法を用いることができる。例えば、ハロゲン化物塩水溶液の濃度が0.1~0.3mol/Lの場合には、5~30分間程度の室温浸漬により最大の効果を得ることができるが、水溶液の濃度がそれより高い場合、あるいは逆に低い場合には、その濃度に応じて浸漬時間を調整することにより同等の効果を得ることができる。なお、保護層11におけるハロゲン元素の含有割合は、0.002質量%~0.05質量%であることが好ましい。 <Description of Performance of
The
なお、上記ハロゲン化物塩の具体例としては、塩化ナトリウム(NaCl)、塩化カリウム(KCl)、臭化ナトリウム(NaBr)、ヨウ化カリウム(KI)などのアルカリ金属塩や、塩化カルシウム(CaCl2)などのアルカリ土類金属塩などが挙げられる。
Specific examples of the halide salt include alkali metal salts such as sodium chloride (NaCl), potassium chloride (KCl), sodium bromide (NaBr), and potassium iodide (KI), and calcium chloride (CaCl 2 ). And alkaline earth metal salts.
このように予めハロゲン化物塩水溶液にセンサ1を浸漬させた場合においても、多数の金属微粒子10はその周囲及び上方を保護層11で覆われているため、ハロゲン化物イオンが直接金属微粒子10に接触して、金属微粒子10がハロゲン化物イオンと反応して基板7から離脱してしまうということがない。そして、このように保護層11に予めハロゲン元素を含有させることで、後述の実施例に示すように、光増強効果を更に高めることができる。
Thus, even when the sensor 1 is immersed in the halide salt aqueous solution in advance, since many metal fine particles 10 are covered with the protective layer 11 around and above the metal fine particles 10, halide ions directly contact the metal fine particles 10. Thus, the metal fine particles 10 do not react with the halide ions and leave the substrate 7. Then, by adding a halogen element to the protective layer 11 in advance as described above, the light enhancement effect can be further enhanced as shown in Examples described later.
(実施例5)
実施例1と同様の方法を用い、RFスパッタ装置による処理時間を調整して、厚さが100nmの保護層11を有するセンサ1を作製した。その後、塩化物イオンの濃度が0.2~0.3mol/Lである塩化ナトリウム水溶液中に、増強電磁場形成層9及び保護層11が形成された基板7を約30分間浸漬させ、その後、純水で洗浄して乾燥することにより、保護層11中にハロゲン化物イオンを含有させて、本実施例のセンサ1とした。この方法で得られた光増強素子における保護層に含有されたハロゲン元素の含有割合は正確には決定することが難しいが、およそ0.01質量%のオーダーと推定される。そして、このセンサ1の保護層11の上面に、ローダミン6G色素の希薄エタノール溶液を3000回転でスピンコートすることにより、色素分子を保護層11の表面上に3×1011個/cm2の密度で担持させた。 (Example 5)
Using the same method as in Example 1, the processing time by the RF sputtering apparatus was adjusted, and thesensor 1 having the protective layer 11 having a thickness of 100 nm was produced. Thereafter, the substrate 7 on which the enhanced electromagnetic field forming layer 9 and the protective layer 11 are formed is immersed in a sodium chloride aqueous solution having a chloride ion concentration of 0.2 to 0.3 mol / L for about 30 minutes. By washing with water and drying, halide ions were contained in the protective layer 11 to obtain the sensor 1 of this example. Although it is difficult to accurately determine the content ratio of the halogen element contained in the protective layer in the light enhancement element obtained by this method, it is estimated to be about 0.01% by mass. Then, a thin ethanol solution of rhodamine 6G dye is spin-coated at 3000 revolutions on the upper surface of the protective layer 11 of the sensor 1, so that the dye molecules have a density of 3 × 10 11 particles / cm 2 on the surface of the protective layer 11. It was made to carry by.
実施例1と同様の方法を用い、RFスパッタ装置による処理時間を調整して、厚さが100nmの保護層11を有するセンサ1を作製した。その後、塩化物イオンの濃度が0.2~0.3mol/Lである塩化ナトリウム水溶液中に、増強電磁場形成層9及び保護層11が形成された基板7を約30分間浸漬させ、その後、純水で洗浄して乾燥することにより、保護層11中にハロゲン化物イオンを含有させて、本実施例のセンサ1とした。この方法で得られた光増強素子における保護層に含有されたハロゲン元素の含有割合は正確には決定することが難しいが、およそ0.01質量%のオーダーと推定される。そして、このセンサ1の保護層11の上面に、ローダミン6G色素の希薄エタノール溶液を3000回転でスピンコートすることにより、色素分子を保護層11の表面上に3×1011個/cm2の密度で担持させた。 (Example 5)
Using the same method as in Example 1, the processing time by the RF sputtering apparatus was adjusted, and the
なお、比較のために、塩化ナトリウム水溶液に浸漬させなかった以外は同様の方法でセンサ1についても作製した。なお、このセンサ1は実施例1の素子に対応する。
For comparison, the sensor 1 was also produced in the same manner except that it was not immersed in an aqueous sodium chloride solution. The sensor 1 corresponds to the element of the first embodiment.
そして、実施例5及び実施例1のセンサ1に対し、励起光を照射して試料(色素分子)から発せられるラマン散乱光の強度を、ダイオードレーザ50に代えて出力1mW未満のHe-Neレーザ(波長632.8nm)を励起光源として用いた他は、図3と同じ測定装置により測定した。この結果を図9に示す。なお、図9のグラフでは、縦軸はラマン散乱強度(cps)を示し、横軸はラマンシフト(cm-1)を示す。
Then, the intensity of Raman scattered light emitted from the sample (dye molecule) by irradiating excitation light to the sensor 1 of Example 5 and Example 1 is changed to a He—Ne laser having an output of less than 1 mW instead of the diode laser 50. The measurement was performed with the same measuring apparatus as in FIG. 3 except that (wavelength 632.8 nm) was used as the excitation light source. The result is shown in FIG. In the graph of FIG. 9, the vertical axis indicates the Raman scattering intensity (cps), and the horizontal axis indicates the Raman shift (cm −1 ).
図9では、実施例5と実施例1のそれぞれのセンサ1に対して、ラマン散乱光の強度を比較した。これは、ラマン散乱光自体の強度が蛍光の強度よりも小さいため、両者の光増強効果を比較する上での比較のしやすさを考慮して行われたものである。ハロゲン化物イオンを浸漬した実施例5の方が、ハロゲン化物イオンを浸漬しなかった実施例1よりも顕著なラマン信号が観測されており、光の増強効果が更に高いことが示唆される。
In FIG. 9, the intensity of Raman scattered light was compared with each sensor 1 of Example 5 and Example 1. This is because the intensity of Raman scattered light itself is smaller than the intensity of fluorescence, so that it is easy to compare in comparing the light enhancement effects of both. In Example 5 in which the halide ions were immersed, a remarkable Raman signal was observed compared to Example 1 in which the halide ions were not immersed, suggesting that the light enhancement effect was higher.
図9における、ハロゲン化物イオンを浸漬しなかった実施例1のセンサ1においても、図4及び図5を参照して上述したように、発光強度を極めて高くする効果は得られている。またハロゲン化物イオンを浸漬した実施例5では、実施例1よりも更に発光増強効果が高くなっていることが示唆される。
In the sensor 1 of Example 1 in which the halide ions in FIG. 9 are not immersed, as described above with reference to FIGS. 4 and 5, the effect of extremely increasing the emission intensity is obtained. In addition, it is suggested that Example 5 in which halide ions are immersed has a higher light emission enhancing effect than Example 1.
なお、実施例5では、塩化物イオンの濃度が0.2~0.3mol/Lである塩化ナトリウム水溶液を浸漬させたが、これに代えて、塩化物イオンの濃度が0.2mol/Lである塩化カリウム水溶液を浸漬させて形成した素子、臭化物イオンの濃度が0.2mol/Lである臭化ナトリウム水溶液を浸漬させて形成した素子、ヨウ化物イオンの濃度が0.2mol/Lであるヨウ化カリウム水溶液を浸漬させて形成した素子、塩化物イオンの濃度が0.2mol/Lである塩化カルシウム水溶液を浸漬させて形成した素子についても、同様の測定を行った結果、実施例5と同様に高いラマン散乱光を受光できた。一方、塩化ナトリウム水溶液の代わりに硫酸イオンの濃度が0.2mol/Lである硫酸ナトリウム水溶液を浸漬させて形成した素子について同様の測定を行ったところ、受光したラマン散乱光の強度は低いものであった。このことから、保護層11にハロゲン元素を添加した場合に、光増強効果を更に高められることが分かる。
In Example 5, a sodium chloride aqueous solution having a chloride ion concentration of 0.2 to 0.3 mol / L was immersed, but instead, the chloride ion concentration was 0.2 mol / L. An element formed by immersing a certain potassium chloride aqueous solution, an element formed by immersing a sodium bromide aqueous solution having a bromide ion concentration of 0.2 mol / L, an iodine having a iodide ion concentration of 0.2 mol / L As a result of performing the same measurement on the element formed by immersing the potassium chloride aqueous solution and the element formed by immersing the calcium chloride aqueous solution having a chloride ion concentration of 0.2 mol / L, the same results as in Example 5 were obtained. High Raman scattered light was received. On the other hand, when the same measurement was performed on an element formed by immersing a sodium sulfate aqueous solution having a sulfate ion concentration of 0.2 mol / L instead of a sodium chloride aqueous solution, the intensity of the received Raman scattered light was low. there were. This shows that the light enhancement effect can be further enhanced when a halogen element is added to the protective layer 11.
〈センサ1を用いた検査例〉
以下、上述したセンサ1の使用方法に基づいて行った試験片5の検査結果について説明する。 <Inspectionexample using sensor 1>
Hereinafter, the test result of thetest piece 5 performed based on the usage method of the sensor 1 mentioned above is demonstrated.
以下、上述したセンサ1の使用方法に基づいて行った試験片5の検査結果について説明する。 <Inspection
Hereinafter, the test result of the
(実施例6)
本発明のセンサ1を用い、この保護層11の上面に試験片5としてのラット心臓組織(8週齢、雌、組織切片厚5μm)を載置し、図2と同様の方法によって、光源部41より励起光を照射して試験片5からのラマンスペクトルを測定した。より詳細には、ラット心臓組織をOCT-compoundにより凍結固定した組織切片を試験片5とし、センサ1の保護層11の上面に載置した。なお、図10は、試験片5としてのラット心臓組織切片の顕微鏡像である。 (Example 6)
Using thesensor 1 of the present invention, a rat heart tissue (8 weeks old, female, tissue section thickness 5 μm) as a test piece 5 is placed on the upper surface of the protective layer 11, and a light source unit is formed in the same manner as in FIG. 41 was irradiated with excitation light, and the Raman spectrum from the test piece 5 was measured. More specifically, a tissue section obtained by freezing and fixing rat heart tissue with OCT-compound was used as a test piece 5 and placed on the upper surface of the protective layer 11 of the sensor 1. FIG. 10 is a microscopic image of a rat heart tissue section as the test piece 5.
本発明のセンサ1を用い、この保護層11の上面に試験片5としてのラット心臓組織(8週齢、雌、組織切片厚5μm)を載置し、図2と同様の方法によって、光源部41より励起光を照射して試験片5からのラマンスペクトルを測定した。より詳細には、ラット心臓組織をOCT-compoundにより凍結固定した組織切片を試験片5とし、センサ1の保護層11の上面に載置した。なお、図10は、試験片5としてのラット心臓組織切片の顕微鏡像である。 (Example 6)
Using the
計測条件は以下のとおりである.
・計測装置:Raman-11(ナノフォトン社製)
・励起光:波長532nm、出力91.1mW/mm2(73mW/Line)
・励起光照射領域: 図10内の測定領域30(走査範囲は約740μm×370μm)
・対物レンズ:X10、NA0.3(オリンパス社製) The measurement conditions are as follows.
・ Measurement device: Raman-11 (manufactured by Nanophoton)
Excitation light: wavelength 532 nm, output 91.1 mW / mm 2 (73 mW / Line)
Excitation light irradiation area: Measurement area 30 in FIG. 10 (scanning range is about 740 μm × 370 μm)
Objective lens: X10, NA 0.3 (Olympus)
なお、光源部41から照射される励起光は、シリンドリカルレンズと対物レンズによってライン状とし、試験片5の面上に焦点を合わせて照射した。直線形状に照射された試験片5からのラマン散乱光は、同じ対物レンズを介して集光され、一次元のラマン像を二次元のCCDイメージセンサ(Pixis 400BR、電子冷却-70℃、1340×400ピクセル;Princeton Instruments社, Trenton, NJ, US)により取得した。二次元のラマン散乱像は、直線形状にした励起光を走査することにより取得した。一つの一次元像は、幅約740μm、スリット幅は70μmであり、1秒の計測時間を要し、200本走査することにより約740μmx370μmの範囲におけるラマンスペクトル像(二次元マッピング像)を得た。
In addition, the excitation light irradiated from the light source part 41 was made into a line shape by the cylindrical lens and the objective lens, and focused on the surface of the test piece 5 and irradiated. The Raman scattered light from the test piece 5 irradiated in a linear shape is condensed through the same objective lens, and a one-dimensional Raman image is converted into a two-dimensional CCD image sensor (Pixis 400BR, electronic cooling-70 ° C., 1340 × 400 pixels; acquired by Princeton Instruments, Inc., Trenton, NJ, USA. A two-dimensional Raman scattering image was acquired by scanning excitation light having a linear shape. One one-dimensional image has a width of about 740 μm and a slit width of 70 μm, and requires a measurement time of 1 second. By scanning 200 lines, a Raman spectrum image (two-dimensional mapping image) in a range of about 740 μm × 370 μm was obtained. .
なお、ライン照射型ラマン散乱分光顕微鏡の構造は、例えばHarada. Y. et al., 2008, Proc. SPIE, vol. 6853, 685308に記載がある.
The structure of the line irradiation type Raman scattering spectroscopic microscope is described in, for example, Harada. Y. et al., 2008, Proc. SPIE, vol.536853, 685308.
(比較例4)
基板7の上面に試験片5としてのラット心臓組織(8週齢、雌、組織切片厚5μm)を載置し、実施例6と同様に、光源部41より励起光を照射してラマンスペクトルを得た。 (Comparative Example 4)
A rat heart tissue (8 weeks old, female,tissue section thickness 5 μm) as a test piece 5 is placed on the upper surface of the substrate 7, and a Raman spectrum is obtained by irradiating excitation light from the light source unit 41 as in Example 6. Obtained.
基板7の上面に試験片5としてのラット心臓組織(8週齢、雌、組織切片厚5μm)を載置し、実施例6と同様に、光源部41より励起光を照射してラマンスペクトルを得た。 (Comparative Example 4)
A rat heart tissue (8 weeks old, female,
実施例6及び比較例4におけるスペクトル結果を、図11に示す。図11によれば、基板7の上面に直接試験片5を載置した比較例4に比べて、光増強素子を含むセンサ1の上面に試験片5を載置した実施例6の方が、明瞭なラマンスペクトルが計測できていることが分かる。このように、センサ1を用いることで、通常のラマン分光スペクトルよりも明瞭なスペクトルが得られるため、短時間の測定が可能になる。
The spectrum results in Example 6 and Comparative Example 4 are shown in FIG. According to FIG. 11, in comparison with Comparative Example 4 in which the test piece 5 is directly placed on the upper surface of the substrate 7, Example 6 in which the test piece 5 is placed on the upper surface of the sensor 1 including the light enhancement element is It can be seen that a clear Raman spectrum can be measured. As described above, by using the sensor 1, a spectrum clearer than a normal Raman spectrum can be obtained, so that measurement in a short time becomes possible.
なお、図11中に矢印で示したピークは、心筋細胞のミトコンドリアに含まれるチトクロームCに帰属されるピークである。754cm-1のピーク強度によってコントラスト差をつけ、センサ1上の心筋細胞のラマンマッピングを行った結果を図12に示す。図10の光学顕微鏡像との比較から、図12のラマンマッピング像が組織の形を反映していることが分かる。
In addition, the peak shown by the arrow in FIG. 11 is a peak attributed to cytochrome C contained in the mitochondria of cardiomyocytes. FIG. 12 shows the result of Raman mapping of the cardiomyocytes on the sensor 1 with a contrast difference given by the peak intensity of 754 cm −1 . From the comparison with the optical microscope image of FIG. 10, it can be seen that the Raman mapping image of FIG. 12 reflects the shape of the tissue.
すなわち、本方法によれば、明瞭なラマンスペクトルが計測されることから、励起光を走査して得られたラマンマッピング像にも、明瞭なコントラストが得られるので、このラマンマッピング像に基づいて、試験片5としての生体組織の診断が可能になる。また、上述したような極めて短時間での励起光照射によってラマンスペクトルの検出が可能となるため、短時間で広範囲のラマンマッピング像が得られる。これにより、限られた測定時間内に二次元画像を求める場合でも測定対象領域を広くできる。
That is, according to the present method, since a clear Raman spectrum is measured, a clear contrast is also obtained in the Raman mapping image obtained by scanning the excitation light. Based on this Raman mapping image, A living tissue as the test piece 5 can be diagnosed. In addition, since the Raman spectrum can be detected by the excitation light irradiation in an extremely short time as described above, a wide-range Raman mapping image can be obtained in a short time. As a result, even when a two-dimensional image is obtained within a limited measurement time, the measurement target area can be widened.
(実施例7)
本発明のセンサ1を用い、この保護層11の上面に試験片5としての食道の迷走神経(有髄線維:組織切片厚5μm)を載置し、実施例4と同様の方法及び装置によって、光源部41より励起光を照射して、試験片5からの蛍光スペクトル及び二次元の蛍光マッピング像を測定した。なお、図13は、試験片5としての食道の迷走神経切片の顕微鏡像である。 (Example 7)
Using thesensor 1 of the present invention, the vagus nerve of the esophagus (myelinated fiber: tissue section thickness 5 μm) as the test piece 5 was placed on the upper surface of the protective layer 11, and the same method and apparatus as in Example 4 were used. Excitation light was irradiated from the light source part 41, and the fluorescence spectrum from the test piece 5 and the two-dimensional fluorescence mapping image were measured. FIG. 13 is a microscopic image of a vagus nerve section of the esophagus as the test piece 5.
本発明のセンサ1を用い、この保護層11の上面に試験片5としての食道の迷走神経(有髄線維:組織切片厚5μm)を載置し、実施例4と同様の方法及び装置によって、光源部41より励起光を照射して、試験片5からの蛍光スペクトル及び二次元の蛍光マッピング像を測定した。なお、図13は、試験片5としての食道の迷走神経切片の顕微鏡像である。 (Example 7)
Using the
計測条件は以下のとおりである.
・計測装置:Raman-11(ナノフォトン社製)
・励起光:波長532nm、出力300mW/mm2(50mW/Line)
・励起光照射領域: 図13内の測定領域32(走査範囲は約1000μm×500μm)
・対物レンズ:X10、NA0.3(オリンパス社製) The measurement conditions are as follows.
・ Measurement device: Raman-11 (manufactured by Nanophoton)
Excitation light: wavelength 532 nm,output 300 mW / mm 2 (50 mW / Line)
Excitation light irradiation area: Measurement area 32 in FIG. 13 (scanning range is about 1000 μm × 500 μm)
Objective lens: X10, NA 0.3 (Olympus)
・計測装置:Raman-11(ナノフォトン社製)
・励起光:波長532nm、出力300mW/mm2(50mW/Line)
・励起光照射領域: 図13内の測定領域32(走査範囲は約1000μm×500μm)
・対物レンズ:X10、NA0.3(オリンパス社製) The measurement conditions are as follows.
・ Measurement device: Raman-11 (manufactured by Nanophoton)
Excitation light: wavelength 532 nm,
Excitation light irradiation area: Measurement area 32 in FIG. 13 (scanning range is about 1000 μm × 500 μm)
Objective lens: X10, NA 0.3 (Olympus)
二次元の蛍光像はライン状にした励起光を走査することにより取得した。一つの一次元像は、幅約740μm、スリット幅は約70μmであり、10秒の計測時間を要し、100本走査することにより約740μm×460μmの範囲における蛍光スペクトル像(二次元マッピング像)を得た。より詳細には、図13内の測定領域32内において、励起光を走査し、波長が560~630nmの蛍光スペクトルを積分し、強度によりコントラスト差をつけて二次元マッピングを行った。この結果得られた蛍光マッピング像を図14に示す。図13の光学顕微鏡像との比較から、図14の蛍光マッピング像が組織の形を反映していることが分かる。
A two-dimensional fluorescence image was acquired by scanning a line of excitation light. One one-dimensional image has a width of about 740 μm and a slit width of about 70 μm, and requires a measurement time of 10 seconds. By scanning 100 lines, a fluorescence spectrum image in a range of about 740 μm × 460 μm (two-dimensional mapping image) Got. More specifically, in the measurement region 32 in FIG. 13, two-dimensional mapping was performed by scanning the excitation light, integrating the fluorescence spectrum having a wavelength of 560 to 630 nm, and adding a contrast difference depending on the intensity. The fluorescence mapping image obtained as a result is shown in FIG. From the comparison with the optical microscope image of FIG. 13, it can be seen that the fluorescence mapping image of FIG. 14 reflects the shape of the tissue.
実施例7によれば、ラマン散乱光のみならず、蛍光によるスペクトル分析によっても、短時間で広範囲の二次元マッピング像を得られることが分かる。特に、センサ1が有する高い発光増強効果によって、従来蛍光物質と認識されていなかった物質についても、励起光の照射による蛍光を得ることができるため、標識を行うことなく検査が可能な生体組織の部位が格段に拡がる。
According to Example 7, it is understood that a wide range of two-dimensional mapping images can be obtained in a short time not only by Raman scattered light but also by spectral analysis using fluorescence. In particular, because of the high light emission enhancement effect of the sensor 1, it is possible to obtain fluorescence by irradiating with excitation light even for substances that have not been recognized as fluorescent substances in the past. The site expands dramatically.
ただし、本発明の方法は、試験片5に色素を標識して励起光を照射して蛍光スペクトルを測定する方法に用いることを排除するものではない。この場合においても、発光増強効果が高いため、図4及び図5を参照して上述したように、非発光性の色素を標識色素として用いることができる。
However, the method of the present invention does not exclude use of the test piece 5 in a method of measuring a fluorescence spectrum by labeling a dye and irradiating excitation light. Also in this case, since the light emission enhancing effect is high, as described above with reference to FIGS. 4 and 5, a non-light-emitting dye can be used as the labeling dye.
[第2実施形態]
本発明の第2実施形態について図面を参照して説明する。 [Second Embodiment]
A second embodiment of the present invention will be described with reference to the drawings.
本発明の第2実施形態について図面を参照して説明する。 [Second Embodiment]
A second embodiment of the present invention will be described with reference to the drawings.
本実施形態は、第1実施形態で説明したセンサ1が備える保護層11を、結晶性(配向性)を有する有機物の重合体で構成した点のみが異なり、他は共通である。
This embodiment is different only in that the protective layer 11 provided in the sensor 1 described in the first embodiment is composed of an organic polymer having crystallinity (orientation), and the others are common.
なお、この有機物の重合体としては、ポリメチルメタクリレートなどのアクリル系重合体、ポリビニルアルコールなどを利用することができる。この場合、保護層11の形成方法としては、保護層形成液をスピンコート法、デイップコート法、スプレーコート法、スリットコート法、バーコート法などを用いて基板7に滴下又は塗布することで実現できるが、スピンコート法は厚さが最も均一な保護層11を形成する方法として好適に用いることができる。
As the organic polymer, an acrylic polymer such as polymethyl methacrylate, polyvinyl alcohol, or the like can be used. In this case, the protective layer 11 is formed by dropping or applying the protective layer forming liquid onto the substrate 7 using a spin coat method, a dip coat method, a spray coat method, a slit coat method, a bar coat method, or the like. However, the spin coating method can be suitably used as a method for forming the protective layer 11 having the most uniform thickness.
なお、この保護層11にハロゲン元素を含有させる場合、保護層形成液としては、溶媒中に所定の重合体およびハロゲンの金属塩を溶解させることにより、或いは溶媒中に所定の重合体が溶解されてなる重合体溶液と、溶媒中にハロゲンの金属塩が溶解されてなる金属塩溶液とを混合することにより、調製することができる。
When the protective layer 11 contains a halogen element, the protective layer forming liquid may be prepared by dissolving a predetermined polymer and a metal salt of a halogen in a solvent, or dissolving a predetermined polymer in the solvent. Can be prepared by mixing a polymer solution obtained by mixing a metal salt solution in which a halogen metal salt is dissolved in a solvent.
保護層形成液を調製するための溶媒としては、用いられる重合体および金属塩に応じて適宜選択される。具体的には、用いられる重合体および金属塩を溶解し得るものであればよい。例えば、重合体としてポリビニルアルコール等の水溶性のものを用いる場合には、溶媒として水を用いることができる。また、重合体として水に不溶な重合体例えばポリメチルメタクリレートを用いる場合には、重合体溶液を調製するための溶媒として例えばシクロヘキサノンを用いると共に、金属塩溶液を調製するための溶媒として水とアセトンとの混合溶媒を用い、重合体溶液と金属塩溶液とを混合することによって、保護層形成液を調製することができる。
The solvent for preparing the protective layer forming liquid is appropriately selected according to the polymer and metal salt used. Specifically, any polymer that can dissolve the polymer and metal salt used may be used. For example, when a water-soluble polymer such as polyvinyl alcohol is used as the polymer, water can be used as the solvent. When a polymer insoluble in water such as polymethyl methacrylate is used as the polymer, for example, cyclohexanone is used as a solvent for preparing the polymer solution, and water and acetone are used as the solvent for preparing the metal salt solution. A protective layer forming solution can be prepared by mixing a polymer solution and a metal salt solution using a mixed solvent.
保護層形成液中における重合体の含有割合は、上記塗布方法と目的とする保護膜の厚さとの組合せによって決定される。例えばスピンコート法(3000rpm)を用いてポリビニルアルコール膜をその水溶液から形成する場合において、膜厚を100nmに調整するために必要な重合体の含有割合は約4.5質量%である。保護層形成液中における金属塩の割合は、目的とする保護層11中のハロゲン元素の含有割合や、保護層形成液中の重合体の含有割合に応じて設定される。
The content ratio of the polymer in the protective layer forming liquid is determined by the combination of the above coating method and the target protective film thickness. For example, when a polyvinyl alcohol film is formed from the aqueous solution by using a spin coating method (3000 rpm), the content of the polymer necessary for adjusting the film thickness to 100 nm is about 4.5% by mass. The ratio of the metal salt in the protective layer forming liquid is set according to the content ratio of the halogen element in the target protective layer 11 and the content ratio of the polymer in the protective layer forming liquid.
(実施例8)
実施例1と同様の方法で、基板7上に増強電磁場形成層9としての多数の金属(Ag)微粒子10によるAg微粒子単層膜を形成した。 (Example 8)
In the same manner as in Example 1, an Ag fine particle monolayer film composed of a large number of metal (Ag)fine particles 10 as the enhanced electromagnetic field forming layer 9 was formed on the substrate 7.
実施例1と同様の方法で、基板7上に増強電磁場形成層9としての多数の金属(Ag)微粒子10によるAg微粒子単層膜を形成した。 (Example 8)
In the same manner as in Example 1, an Ag fine particle monolayer film composed of a large number of metal (Ag)
また、純水中に、5質量%のポリビニルアルコール(和光純薬工業(株)製、重合度約500)、及び0.2mmol/Lの塩化ナトリウムが溶解されてなる保護層形成液を調製した。その後、スピンコート法によって、基板7の表面に、調製した保護層形成液を塗布して約60℃で乾燥すると共に結晶化を促すことにより、基板7の表面部分を含む増強電磁場形成層9の表面上に保護層11を形成することでセンサ1を作製した。なお、保護層11は、結晶度が50%以上で厚さが110nmであった。
Also, a protective layer forming solution was prepared by dissolving 5% by mass of polyvinyl alcohol (manufactured by Wako Pure Chemical Industries, Ltd., degree of polymerization of about 500) and 0.2 mmol / L of sodium chloride in pure water. . Thereafter, the prepared protective layer forming solution is applied to the surface of the substrate 7 by spin coating, and dried at about 60 ° C., and crystallization is promoted, thereby enhancing the electromagnetic field forming layer 9 including the surface portion of the substrate 7. The sensor 1 was produced by forming the protective layer 11 on the surface. The protective layer 11 had a crystallinity of 50% or more and a thickness of 110 nm.
そして、この保護層11の上面に、ローダミン6G色素の希薄エタノール溶液を3000回転でスピンコートすることにより、色素分子を保護層11の表面上に3×10¹¹個/cm2の密度で担持させた。
The upper surface of the protective layer 11 is spin-coated with a diluted ethanol solution of rhodamine 6G dye at 3000 revolutions so that the dye molecules are supported on the surface of the protective layer 11 at a density of 3 × 10 11 particles / cm 2. It was.
(実施例9)
保護層形成液を、以下のようにして調製されたものに変更したこと以外は、実施例6と同様にして光増強素子を製造した。すなわち、シクロヘキサノン(和光純薬工業(株)製)中に3質量%のポリメチルメタクリレート(和光純薬工業(株)製)が溶解されてなる重合体溶液を調製した。一方、純水とアセトンとが質量比で1:1の割合で混合されてなる混合溶媒中に、20mmol/Lの塩化ナトリウムが溶解されてなる金属塩溶液を調製した。そして、重合体溶液と金属塩溶液とを容量比9:1で混合することにより、保護層形成液を調製した。 Example 9
A light enhancement element was produced in the same manner as in Example 6 except that the protective layer forming solution was changed to one prepared as follows. That is, a polymer solution in which 3% by mass of polymethyl methacrylate (Wako Pure Chemical Industries, Ltd.) was dissolved in cyclohexanone (Wako Pure Chemical Industries, Ltd.) was prepared. On the other hand, a metal salt solution in which 20 mmol / L of sodium chloride was dissolved in a mixed solvent in which pure water and acetone were mixed at a mass ratio of 1: 1 was prepared. Then, a protective layer forming solution was prepared by mixing the polymer solution and the metal salt solution at a volume ratio of 9: 1.
そして、図7と同様の方法により、実施例8及び実施例9のセンサ1に対し、励起光を照射して試料(色素分子)から発せられるラマン散乱光の強度を測定した。この結果を図15に示す。図7と同様に、図15のグラフにおいても、縦軸はラマン散乱強度(cps)を示し、横軸はラマンシフト(cm-1)を示す。図15のグラフより、保護層11を有機物の重合体で構成した場合であっても、強いラマン散乱信号が確認できており、保護層11の上面に光増強効果が伝搬できていることが分かる。
Then, the intensity of Raman scattered light emitted from the sample (dye molecule) was measured by irradiating the sensor 1 of Example 8 and Example 9 with excitation light by the same method as in FIG. The result is shown in FIG. Similarly to FIG. 7, in the graph of FIG. 15, the vertical axis indicates the Raman scattering intensity (cps), and the horizontal axis indicates the Raman shift (cm −1 ). From the graph of FIG. 15, even when the protective layer 11 is composed of an organic polymer, a strong Raman scattering signal can be confirmed, and it can be seen that the light enhancement effect can be propagated to the upper surface of the protective layer 11. .
つまり、本実施形態のように、センサ1を有機物の重合体で構成した保護層11を有する構成とし、この保護層11の上面に、試験片5としての生体組織を載置して光源部41から励起光を照射して、試験片5からのラマン散乱光又は蛍光のスペクトルを分析することで、第1実施形態と同様に試験片5の診断を行うことが可能である。
That is, as in the present embodiment, the sensor 1 is configured to have a protective layer 11 made of an organic polymer, and a biological tissue as the test piece 5 is placed on the upper surface of the protective layer 11 to place the light source unit 41. By irradiating with excitation light from and analyzing the spectrum of Raman scattered light or fluorescence from the test piece 5, it is possible to diagnose the test piece 5 as in the first embodiment.
なお、実施例8及び実施例9では、いずれも保護層11にハロゲン元素を含有した構成としたが、保護層11として、ハロゲン元素を含有せずに有機物の重合体で構成しても構わない。
In each of Examples 8 and 9, the protective layer 11 contains a halogen element. However, the protective layer 11 may be made of an organic polymer without containing a halogen element. .
[別実施形態]
上記の各実施形態において、センサ1を、高反射層および誘電体層を更に具えた多層構造を有する構成としてもよい。このような構造のものにおいては、基板7の表面上に高反射層および誘電体層がこの順で形成され、誘電体層の表面上に増強電磁場形成層9が形成される。 [Another embodiment]
In each of the above embodiments, thesensor 1 may be configured to have a multilayer structure further including a highly reflective layer and a dielectric layer. In such a structure, the highly reflective layer and the dielectric layer are formed in this order on the surface of the substrate 7, and the enhanced electromagnetic field forming layer 9 is formed on the surface of the dielectric layer.
上記の各実施形態において、センサ1を、高反射層および誘電体層を更に具えた多層構造を有する構成としてもよい。このような構造のものにおいては、基板7の表面上に高反射層および誘電体層がこの順で形成され、誘電体層の表面上に増強電磁場形成層9が形成される。 [Another embodiment]
In each of the above embodiments, the
また、図2を参照して説明したように、上記実施形態では、センサ1の保護層11の上面に試験片5を載置して、この試験片5側から励起光を照射したが、センサ1の裏面側(基板7側)から励起光を照射して、試験片5からのラマン散乱光又は蛍光のスペクトルを得るものとしても構わない。
Further, as described with reference to FIG. 2, in the above embodiment, the test piece 5 is placed on the upper surface of the protective layer 11 of the sensor 1 and the excitation light is irradiated from the test piece 5 side. 1 may be irradiated with excitation light from the back surface side (substrate 7 side) to obtain a Raman scattered light or fluorescence spectrum from the test piece 5.
1 : センサ
5 : 試験片
7 : 基板
9 : 増強電磁場形成層
10 : 金属微粒子
11 : 保護層
30 : 励起光照射領域
31 : チトクロームCに帰属されるスペクトルピーク
32 : 励起光照射領域
41 : 光源部
43 : 受光部
50 : 励起光源
51 : フィルタ
52 : 集光レンズ
53 : フィルタ
54 : 受光ヘッド
55 : 分光器
56 : 光検出器
61 : ミラー
62 : ハーフミラー 1: Sensor 5: Test piece 7: Substrate 9: Enhanced electromagnetic field forming layer 10: Metal fine particle 11: Protective layer 30: Excitation light irradiation region 31: Spectral peak attributed to cytochrome C 32: Excitation light irradiation region 41: Light source part 43: Light receiving unit 50: Excitation light source 51: Filter 52: Condensing lens 53: Filter 54: Light receiving head 55: Spectrometer 56: Photo detector 61: Mirror 62: Half mirror
Claims (5)
- 生体組織切片を含む試験片の検査方法であって、
基板と、前記基板の表面上に互いに独立して多数の金属微粒子が分散配置された増強電磁場形成層と、前記基板及び前記増強電磁場形成層の上層に形成された保護層とを有する光増強素子を準備する工程(a)、
前記保護層の上面に検査対象となる前記試験片を載置する工程(b)、
前記光増強素子に対して、上面から又は裏面から励起光を照射する工程(c)、
及び、前記試験片からの発光を受光して発光スペクトルを測定する工程(d)を有することを特徴とする検査方法。 A method for inspecting a specimen including a biological tissue section,
An optical enhancement element comprising: a substrate; an enhanced electromagnetic field forming layer in which a large number of metal fine particles are dispersed and arranged independently of each other on the surface of the substrate; and a protective layer formed on the substrate and the enhanced electromagnetic field forming layer Preparing step (a),
Placing the test piece to be inspected on the upper surface of the protective layer (b),
Irradiating excitation light to the light enhancement element from the upper surface or from the back surface (c),
And an inspection method comprising the step (d) of measuring light emission spectrum by receiving light emitted from the test piece. - 前記工程(c)が、所定方向に走査しながら前記励起光を前記光増強素子に対して照射する工程であり、
前記工程(d)によって得られた発光スペクトルの強度分布を二次元マッピングする工程(e)を有することを特徴とする請求項1に記載の検査方法。 The step (c) is a step of irradiating the light enhancement element with the excitation light while scanning in a predetermined direction.
The inspection method according to claim 1, further comprising a step (e) of two-dimensional mapping the intensity distribution of the emission spectrum obtained by the step (d). - 前記試験片からの発光が、ラマン散乱光又は蛍光であることを特徴とする請求項1又は2に記載の検査方法。 3. The inspection method according to claim 1, wherein light emitted from the test piece is Raman scattered light or fluorescence.
- 前記保護層は、前記多数の金属微粒子に関連して配向性を有する無機物質、又は配向性を有する有機物の重合体で構成されていることを特徴とする請求項1~3のいずれか1項に記載の検査方法。 4. The protective layer according to claim 1, wherein the protective layer is composed of an inorganic substance having an orientation or an organic polymer having an orientation in association with the large number of metal fine particles. Inspection method described in 1.
- 前記保護層は、ハロゲン元素を含有することを特徴とする請求項1~3のいずれか1項に記載の検査方法。 4. The inspection method according to claim 1, wherein the protective layer contains a halogen element.
Applications Claiming Priority (2)
| Application Number | Priority Date | Filing Date | Title |
|---|---|---|---|
| JP2013-106649 | 2013-05-20 | ||
| JP2013106649A JP2014228321A (en) | 2013-05-20 | 2013-05-20 | Inspection method |
Publications (1)
| Publication Number | Publication Date |
|---|---|
| WO2014188622A1 true WO2014188622A1 (en) | 2014-11-27 |
Family
ID=51933201
Family Applications (1)
| Application Number | Title | Priority Date | Filing Date |
|---|---|---|---|
| PCT/JP2013/081669 WO2014188622A1 (en) | 2013-05-20 | 2013-11-25 | Examination method |
Country Status (2)
| Country | Link |
|---|---|
| JP (1) | JP2014228321A (en) |
| WO (1) | WO2014188622A1 (en) |
Cited By (1)
| Publication number | Priority date | Publication date | Assignee | Title |
|---|---|---|---|---|
| US10268031B2 (en) | 2015-03-19 | 2019-04-23 | Koninklijke Philips N.V. | Illumination in digital pathology scanning |
Families Citing this family (2)
| Publication number | Priority date | Publication date | Assignee | Title |
|---|---|---|---|---|
| JP6624919B2 (en) * | 2015-12-18 | 2019-12-25 | 株式会社ディスコ | Protective film detection method for laser processing |
| WO2023136308A1 (en) * | 2022-01-17 | 2023-07-20 | 国立大学法人大阪大学 | Method for evaluating cardiocytes using raman scattering |
Citations (7)
| Publication number | Priority date | Publication date | Assignee | Title |
|---|---|---|---|---|
| JP2006113021A (en) * | 2004-10-18 | 2006-04-27 | Univ Waseda | Raman spectroscopic device and spectroscopic device |
| JP2006514309A (en) * | 2003-03-12 | 2006-04-27 | インテル・コーポレーション | Chemical sensitization of surface-sensitized Raman spectroscopy using lithium salts |
| JP2007525662A (en) * | 2003-12-30 | 2007-09-06 | インテル・コーポレーション | Obtaining a protein profile of a biological sample using Raman spectroscopy |
| JP4317989B2 (en) * | 2005-01-31 | 2009-08-19 | 独立行政法人産業技術総合研究所 | Molecular sensing device and chip for enhancing Raman scattering |
| JP2011209108A (en) * | 2010-03-30 | 2011-10-20 | Nippon Telegr & Teleph Corp <Ntt> | Substrate for measurement and method of measuring biochemical binding formation and biochemical binding amount using the same |
| JP2011208993A (en) * | 2010-03-29 | 2011-10-20 | Toyo Univ | Analyzing substrate, and method for manufacturing the same |
| WO2012086586A1 (en) * | 2010-12-22 | 2012-06-28 | 国立大学法人京都大学 | Raman-scattered light intensifying element |
-
2013
- 2013-05-20 JP JP2013106649A patent/JP2014228321A/en active Pending
- 2013-11-25 WO PCT/JP2013/081669 patent/WO2014188622A1/en active Application Filing
Patent Citations (7)
| Publication number | Priority date | Publication date | Assignee | Title |
|---|---|---|---|---|
| JP2006514309A (en) * | 2003-03-12 | 2006-04-27 | インテル・コーポレーション | Chemical sensitization of surface-sensitized Raman spectroscopy using lithium salts |
| JP2007525662A (en) * | 2003-12-30 | 2007-09-06 | インテル・コーポレーション | Obtaining a protein profile of a biological sample using Raman spectroscopy |
| JP2006113021A (en) * | 2004-10-18 | 2006-04-27 | Univ Waseda | Raman spectroscopic device and spectroscopic device |
| JP4317989B2 (en) * | 2005-01-31 | 2009-08-19 | 独立行政法人産業技術総合研究所 | Molecular sensing device and chip for enhancing Raman scattering |
| JP2011208993A (en) * | 2010-03-29 | 2011-10-20 | Toyo Univ | Analyzing substrate, and method for manufacturing the same |
| JP2011209108A (en) * | 2010-03-30 | 2011-10-20 | Nippon Telegr & Teleph Corp <Ntt> | Substrate for measurement and method of measuring biochemical binding formation and biochemical binding amount using the same |
| WO2012086586A1 (en) * | 2010-12-22 | 2012-06-28 | 国立大学法人京都大学 | Raman-scattered light intensifying element |
Non-Patent Citations (1)
| Title |
|---|
| JOJI TAKAYOSHI ET AL.: "Ihosei Silica Hogoso o Yusuru Gin Nanoisland Maku ni yoru Chokyori Zokyo Hakko Zokyo Raman Sanran", 93RD ANNUAL MEETING OF THE CHEMICAL SOCIETY OF JAPAN IN SPRING (2013) KOEN YOKOSHU II, 8 March 2013 (2013-03-08), pages 689 * |
Cited By (1)
| Publication number | Priority date | Publication date | Assignee | Title |
|---|---|---|---|---|
| US10268031B2 (en) | 2015-03-19 | 2019-04-23 | Koninklijke Philips N.V. | Illumination in digital pathology scanning |
Also Published As
| Publication number | Publication date |
|---|---|
| JP2014228321A (en) | 2014-12-08 |
Similar Documents
| Publication | Publication Date | Title |
|---|---|---|
| Buchler et al. | Measuring the quantum efficiency of the optical emission of single radiating dipoles using a scanning mirror | |
| Bharadwaj et al. | Nanoplasmonic enhancement of single-molecule fluorescence | |
| Greybush et al. | Plasmon-enhanced upconversion luminescence in single nanophosphor–nanorod heterodimers formed through template-assisted self-assembly | |
| D’Andrea et al. | SERS enhancement and field confinement in nanosensors based on self-organized gold nanowires produced by ion-beam sputtering | |
| WO2009031838A1 (en) | Spectral analyzer for measuring the thickness and identification of chemicals of organic thin films using cars microscopy | |
| CN110398479B (en) | Micro-spectrum measuring device and method based on optical chip substrate | |
| US7929132B2 (en) | Transmission microscopy using light emitted from nanoparticles | |
| Alessandri et al. | Colloidal lenses as universal Raman scattering enhancers | |
| KR20190110595A (en) | Plasmon device | |
| JP2010513884A (en) | High-resolution detection of temperature and temperature distribution for microscopic electronic devices and living organisms | |
| WO2012086236A1 (en) | Photoenhancement element | |
| JP7093836B2 (en) | Devices and methods for super-resolution fluorescence microscopes and fluorescence lifetime measurements | |
| US6914720B2 (en) | Time resolved fluorescence microscope | |
| Gruber et al. | Controlled addressing of quantum dots by nanowire plasmons | |
| WO2014188622A1 (en) | Examination method | |
| US8837039B2 (en) | Multiscale light amplification structures for surface enhanced Raman spectroscopy | |
| Kedem et al. | Distance-dependent fluorescence of tris (bipyridine) ruthenium (II) on supported plasmonic gold nanoparticle ensembles | |
| WO2014188620A1 (en) | Sensor and test method | |
| JP2014228320A (en) | Optical enhancement element and manufacturing method therefor | |
| JP2014092534A (en) | Raman scattered light enhancement element and method of manufacturing the same | |
| WO2014188621A1 (en) | Examination method and sensor | |
| Fabelinsky et al. | Laser intensity limits in surface‐enhanced linear and nonlinear Raman micro‐spectroscopy of organic molecule/Au‐nanoparticle conjugates | |
| US8581211B2 (en) | Imaging method and system using substrate functionalization | |
| JP5728449B2 (en) | Light enhancement element and method for manufacturing the same | |
| JP2009229714A (en) | Chart for resolution evaluation of coherent raman microscope, its manufacturing method, light source device for coherent raman microscope, and method of adjusting coherent raman microscope |
Legal Events
| Date | Code | Title | Description |
|---|---|---|---|
| 121 | Ep: the epo has been informed by wipo that ep was designated in this application |
Ref document number: 13885130 Country of ref document: EP Kind code of ref document: A1 |
|
| NENP | Non-entry into the national phase |
Ref country code: DE |
|
| 122 | Ep: pct application non-entry in european phase |
Ref document number: 13885130 Country of ref document: EP Kind code of ref document: A1 |