WO2014115182A1 - 画像診断装置及び情報処理装置及びそれらの制御方法、プログラム及びコンピュータ可読記憶媒体 - Google Patents
画像診断装置及び情報処理装置及びそれらの制御方法、プログラム及びコンピュータ可読記憶媒体 Download PDFInfo
- Publication number
- WO2014115182A1 WO2014115182A1 PCT/JP2013/000327 JP2013000327W WO2014115182A1 WO 2014115182 A1 WO2014115182 A1 WO 2014115182A1 JP 2013000327 W JP2013000327 W JP 2013000327W WO 2014115182 A1 WO2014115182 A1 WO 2014115182A1
- Authority
- WO
- WIPO (PCT)
- Prior art keywords
- imaging core
- dimensional image
- data
- stent
- rotation
- Prior art date
- Legal status (The legal status is an assumption and is not a legal conclusion. Google has not performed a legal analysis and makes no representation as to the accuracy of the status listed.)
- Ceased
Links
Images




Classifications
-
- A—HUMAN NECESSITIES
- A61—MEDICAL OR VETERINARY SCIENCE; HYGIENE
- A61B—DIAGNOSIS; SURGERY; IDENTIFICATION
- A61B1/00—Instruments for performing medical examinations of the interior of cavities or tubes of the body by visual or photographical inspection, e.g. endoscopes; Illuminating arrangements therefor
- A61B1/00002—Operational features of endoscopes
- A61B1/00004—Operational features of endoscopes characterised by electronic signal processing
- A61B1/00009—Operational features of endoscopes characterised by electronic signal processing of image signals during a use of endoscope
- A61B1/000094—Operational features of endoscopes characterised by electronic signal processing of image signals during a use of endoscope extracting biological structures
-
- A—HUMAN NECESSITIES
- A61—MEDICAL OR VETERINARY SCIENCE; HYGIENE
- A61B—DIAGNOSIS; SURGERY; IDENTIFICATION
- A61B5/00—Measuring for diagnostic purposes; Identification of persons
- A61B5/0059—Measuring for diagnostic purposes; Identification of persons using light, e.g. diagnosis by transillumination, diascopy, fluorescence
- A61B5/0062—Arrangements for scanning
- A61B5/0066—Optical coherence imaging
-
- A—HUMAN NECESSITIES
- A61—MEDICAL OR VETERINARY SCIENCE; HYGIENE
- A61B—DIAGNOSIS; SURGERY; IDENTIFICATION
- A61B5/00—Measuring for diagnostic purposes; Identification of persons
- A61B5/0059—Measuring for diagnostic purposes; Identification of persons using light, e.g. diagnosis by transillumination, diascopy, fluorescence
- A61B5/0082—Measuring for diagnostic purposes; Identification of persons using light, e.g. diagnosis by transillumination, diascopy, fluorescence adapted for particular medical purposes
- A61B5/0084—Measuring for diagnostic purposes; Identification of persons using light, e.g. diagnosis by transillumination, diascopy, fluorescence adapted for particular medical purposes for introduction into the body, e.g. by catheters
-
- A—HUMAN NECESSITIES
- A61—MEDICAL OR VETERINARY SCIENCE; HYGIENE
- A61B—DIAGNOSIS; SURGERY; IDENTIFICATION
- A61B5/00—Measuring for diagnostic purposes; Identification of persons
- A61B5/02—Detecting, measuring or recording for evaluating the cardiovascular system, e.g. pulse, heart rate, blood pressure or blood flow
- A61B5/02007—Evaluating blood vessel condition, e.g. elasticity, compliance
-
- A—HUMAN NECESSITIES
- A61—MEDICAL OR VETERINARY SCIENCE; HYGIENE
- A61B—DIAGNOSIS; SURGERY; IDENTIFICATION
- A61B5/00—Measuring for diagnostic purposes; Identification of persons
- A61B5/06—Devices, other than using radiation, for detecting or locating foreign bodies ; Determining position of diagnostic devices within or on the body of the patient
-
- A—HUMAN NECESSITIES
- A61—MEDICAL OR VETERINARY SCIENCE; HYGIENE
- A61B—DIAGNOSIS; SURGERY; IDENTIFICATION
- A61B5/00—Measuring for diagnostic purposes; Identification of persons
- A61B5/68—Arrangements of detecting, measuring or recording means, e.g. sensors, in relation to patient
- A61B5/6846—Arrangements of detecting, measuring or recording means, e.g. sensors, in relation to patient specially adapted to be brought in contact with an internal body part, i.e. invasive
- A61B5/6847—Arrangements of detecting, measuring or recording means, e.g. sensors, in relation to patient specially adapted to be brought in contact with an internal body part, i.e. invasive mounted on an invasive device
- A61B5/6852—Catheters
-
- A—HUMAN NECESSITIES
- A61—MEDICAL OR VETERINARY SCIENCE; HYGIENE
- A61B—DIAGNOSIS; SURGERY; IDENTIFICATION
- A61B5/00—Measuring for diagnostic purposes; Identification of persons
- A61B5/74—Details of notification to user or communication with user or patient; User input means
- A61B5/742—Details of notification to user or communication with user or patient; User input means using visual displays
-
- G—PHYSICS
- G06—COMPUTING OR CALCULATING; COUNTING
- G06T—IMAGE DATA PROCESSING OR GENERATION, IN GENERAL
- G06T12/00—Tomographic reconstruction from projections
-
- G—PHYSICS
- G06—COMPUTING OR CALCULATING; COUNTING
- G06T—IMAGE DATA PROCESSING OR GENERATION, IN GENERAL
- G06T7/00—Image analysis
- G06T7/0002—Inspection of images, e.g. flaw detection
-
- A—HUMAN NECESSITIES
- A61—MEDICAL OR VETERINARY SCIENCE; HYGIENE
- A61B—DIAGNOSIS; SURGERY; IDENTIFICATION
- A61B2576/00—Medical imaging apparatus involving image processing or analysis
- A61B2576/02—Medical imaging apparatus involving image processing or analysis specially adapted for a particular organ or body part
-
- G—PHYSICS
- G06—COMPUTING OR CALCULATING; COUNTING
- G06T—IMAGE DATA PROCESSING OR GENERATION, IN GENERAL
- G06T2207/00—Indexing scheme for image analysis or image enhancement
- G06T2207/10—Image acquisition modality
- G06T2207/10072—Tomographic images
-
- G—PHYSICS
- G06—COMPUTING OR CALCULATING; COUNTING
- G06T—IMAGE DATA PROCESSING OR GENERATION, IN GENERAL
- G06T2207/00—Indexing scheme for image analysis or image enhancement
- G06T2207/30—Subject of image; Context of image processing
- G06T2207/30004—Biomedical image processing
- G06T2207/30101—Blood vessel; Artery; Vein; Vascular
-
- G—PHYSICS
- G16—INFORMATION AND COMMUNICATION TECHNOLOGY [ICT] SPECIALLY ADAPTED FOR SPECIFIC APPLICATION FIELDS
- G16H—HEALTHCARE INFORMATICS, i.e. INFORMATION AND COMMUNICATION TECHNOLOGY [ICT] SPECIALLY ADAPTED FOR THE HANDLING OR PROCESSING OF MEDICAL OR HEALTHCARE DATA
- G16H30/00—ICT specially adapted for the handling or processing of medical images
- G16H30/40—ICT specially adapted for the handling or processing of medical images for processing medical images, e.g. editing
Definitions
- the present invention relates to a tomographic image generation technique for living tissue using light.
- OCT optical coherence tomography
- the optical coherence tomography diagnostic apparatus incorporates an optical fiber having an imaging core having an optical lens and an optical mirror attached at the tip, and has a sheath at least at the tip. Then, the sheath is inserted into the blood vessel of the patient, the imaging core is rotated, the light is applied to the blood vessel wall through the optical mirror, and the reflected light from the blood vessel is received again through the optical mirror. A radial scan is performed, and a cross-sectional image of the blood vessel is constructed based on the obtained reflected light. Then, a three-dimensional image of the inner wall in the longitudinal direction of the blood vessel is formed by performing an operation of pulling at a predetermined speed (generally referred to as pullback) while rotating the optical fiber (Patent Document 1). Further, as an improved type of OCT, an optical coherence tomography diagnostic device (SS-OCT: Optical coherence Tomography) using wavelength sweeping has been developed.
- SS-OCT Optical coherence Tomography
- An important point in post-operative follow-up after placement in the blood vessel of the stent is to check how closely the blood vessel lumen surface to the stent is close.
- the diagnostician has to set and check various viewpoint positions, and the operation is complicated. Further, each time the viewpoint position is changed, enormous calculations must be performed to generate a three-dimensional image observed from the changed viewpoint position, and a high response to a user operation cannot be expected.
- the present specification provides an image diagnostic apparatus described below. That is, By using a probe containing an imaging core that emits light toward the lumen surface of the blood vessel and detects the reflected light, the imaging core is rotated and moved along the probe at a predetermined speed.
- An image diagnostic apparatus for reconstructing a three-dimensional image, Based on data obtained from the imaging core during the period of rotation and movement of the imaging core, a plurality of luminance values arranged in the radial direction from the rotation center of the imaging core for each rotation angle in the rotation Deriving means for deriving the line data to be processed;
- the rotation angle ⁇ of the imaging core and the line data at the movement position z in the movement are defined as L ( ⁇ , z)
- Calculating means for calculating two-dimensional image data having ⁇ and z as two axes by calculating a representative pixel value P ( ⁇ , z) in the direction of the line of sight toward;
- Display means for displaying the calculated two-dimensional image data.
- External Configuration Figure 1 of an image diagnostic apparatus is a diagram showing such an external configuration of an image diagnosis apparatus 100 according to an embodiment of the present invention.
- the diagnostic imaging apparatus 100 includes a probe unit 101, a scanner and pullback unit 102, and an operation control device 103, and the scanner and pullback unit 102 and the operation control device 103 are connected by a signal line 104. Various signals are connected so that transmission is possible.
- the probe unit 101 includes an optical transmission / reception unit that is directly inserted into a blood vessel and continuously transmits the transmitted light (measurement light) into the blood vessel and continuously receives reflected light from the blood vessel.
- the imaging core is interpolated. In the diagnostic imaging apparatus 100, the state inside the blood vessel is measured by using the imaging core.
- the scanner and pullback unit 102 is detachably attached to the probe unit 101, and operates in the axial direction and rotational direction in the blood vessel of the imaging core inserted in the probe unit 101 by driving a built-in motor. It prescribes.
- the operation control device 103 has a function for inputting various set values and a function for processing data obtained by the measurement and displaying various blood vessel images when performing the measurement.
- 111 is a main body control unit.
- the main body control unit 111 generates interference light data by causing interference between the reflected light obtained by the measurement and the reference light obtained by separating the light from the light source, and based on the interference light data.
- An optical section image is generated by processing the generated line data.
- Reference numeral 111-1 is a printer and a DVD recorder, which prints the processing results in the main body control unit 111 or stores them as data.
- Reference numeral 112 denotes an operation panel, and the user inputs various setting values and instructions via the operation panel 112.
- Reference numeral 113 denotes an LCD monitor as a display device, which displays a cross-sectional image generated by the main body control unit 111.
- Reference numeral 114 denotes a mouse as a pointing device (coordinate input device).
- the probe unit 101 includes a long catheter sheath 201 that is inserted into a blood vessel, and a connector that is disposed on the user's hand side without being inserted into the blood vessel to be operated by the user. Part 202.
- a guide wire lumen tube 203 for fixing a guide wire 250 for guiding the probe unit 101 to the blood vessel position to be diagnosed is provided at the distal end of the catheter sheath 201.
- the catheter sheath 201 forms a continuous lumen from a connection portion with the guide wire lumen tube 203 to a connection portion with the connector portion 202.
- a transmission / reception unit 221 in which an optical transmission / reception unit for transmitting / receiving light is disposed, and a coil-like member that includes an optical fiber cable inside and transmits a rotational driving force for rotating the optical fiber cable.
- An imaging core 220 including a drive shaft 222 is inserted through almost the entire length of the catheter sheath 201.
- the connector portion 202 includes a sheath connector 202a configured integrally with the proximal end of the catheter sheath 201, and a drive shaft connector 202b configured by rotatably fixing the drive shaft 222 to the proximal end of the drive shaft 222.
- a kink protector 211 is provided at the boundary between the sheath connector 202a and the catheter sheath 201. Thereby, predetermined rigidity is maintained, and bending (kink) due to a sudden change in physical properties can be prevented.
- the base end of the drive shaft connector 202b is detachably attached to the scanner and the pullback unit 102.
- the housing 223 has a shape having a notch in a part of a short cylindrical metal pipe, and is formed by cutting out from a metal lump, MIM (metal powder injection molding) or the like. Further, a short coil-shaped elastic member 231 is provided on the tip side.
- the elastic member 231 is a stainless steel wire formed in a coil shape, and the elastic member 231 is disposed on the distal end side, thereby preventing the imaging core 220 from being caught in the catheter sheath 201 when moving the imaging core 220 back and forth.
- 232 is a reinforcing coil, which is provided for the purpose of preventing a sharp bending of the distal end portion of the catheter sheath 201.
- the guide wire lumen tube 203 has a guide wire lumen into which the guide wire 250 can be inserted.
- the guide wire 250 is used to guide the distal end of the catheter sheath 201b to the affected area.
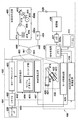
- FIG. 3 is a diagram illustrating a functional configuration of the diagnostic imaging apparatus 100 having an OCT function (here, a wavelength sweep type OCT as an example).
- OCT function here, a wavelength sweep type OCT as an example.
- the functional configuration of the wavelength sweep type OCT will be described with reference to FIG.
- reference numeral 408 denotes a wavelength swept light source (Swept Laser), which is a type of Extended-cavity Laser composed of an SOA 415 (semiconductor optical amplifier), a ring-shaped optical fiber 416, and a polygon scanning filter (408b).
- SOA 415 semiconductor optical amplifier
- ring-shaped optical fiber 416 a ring-shaped optical fiber 416
- polygon scanning filter (408b) a wavelength swept light source
- the light output from the SOA 415 travels through the optical fiber 416 and enters the polygon scanning filter 408b.
- the light whose wavelength is selected here is amplified by the SOA 415 and finally output from the coupler 414.
- the wavelength is selected by a combination of the diffraction grating 412 for separating light and the polygon mirror 409.
- the light split by the diffraction grating 412 is condensed on the surface of the polygon mirror 409 by two lenses (410, 411).
- the wavelength time sweep can be performed by rotating the polygon mirror 409.
- the polygon mirror 409 for example, a 32-hedron mirror is used, and the rotation speed is about 50000 rpm.
- the wavelength sweeping method combining the polygon mirror 409 and the diffraction grating 412 enables high-speed, high-output wavelength sweeping.
- the light of the wavelength swept light source 408 output from the coupler 414 is incident on one end of the first single mode fiber 440 and transmitted to the distal end side.
- the first single mode fiber 440 is optically coupled to the second single mode fiber 445 and the third single mode fiber 444 at an intermediate optical coupler 441.
- An optical rotary joint (optical cup) that transmits light by coupling a non-rotating part (fixed part) and a rotating part (rotational drive part) to the tip side of the optical coupler part 441 of the first single mode fiber 440.
- a ring portion) 403 is provided in the rotary drive device 404.
- the fifth single mode fiber 443 of the probe unit 101 is detachably connected to the distal end side of the fourth single mode fiber 442 in the optical rotary joint (optical coupling unit) 403 via the adapter 402. Yes.
- the light from the wavelength swept light source 408 is transmitted to the fifth single mode fiber 443 that is inserted into the imaging core 220 and can be driven to rotate.
- the transmitted light is irradiated from the optical transmission / reception unit 221 of the imaging core 220 to the living tissue in the blood vessel while rotating and moving in the axial direction. Then, a part of the reflected light scattered on the surface or inside of the living tissue is taken in by the optical transmission / reception unit 320 of the imaging core 220, and returns to the first single mode fiber 440 side through the reverse optical path. Further, a part of the optical coupler unit 441 moves to the second single mode fiber 445 side, and is emitted from one end of the second single mode fiber 445, and then received by a photodetector (eg, a photodiode 424).
- a photodetector eg, a photodiode 424
- rotation drive unit side of the optical rotary joint 403 is rotationally driven by a radial scanning motor 405 of the rotation drive unit 404.
- an optical path length variable mechanism 432 for finely adjusting the optical path length of the reference light is provided at the tip of the third single mode fiber 444 opposite to the optical coupler section 441.
- the optical path length variable mechanism 432 changes the optical path length to change the optical path length corresponding to the variation in length so that the variation in length of each probe unit 101 when the probe unit 101 is replaced and used can be absorbed. Means.
- the third single mode fiber 444 and the collimating lens 418 are provided on a uniaxial stage 422 that is movable in the direction of the optical axis as indicated by an arrow 423, and form optical path length changing means.
- the uniaxial stage 422 when the probe unit 101 is replaced, functions as an optical path length changing unit having a variable range of the optical path length that can absorb variations in the optical path length of the probe unit 101. Further, the uniaxial stage 422 also has a function as an adjusting means for adjusting the offset. For example, even when the tip of the probe unit 101 is not in close contact with the surface of the living tissue, the optical path length is minutely changed by the uniaxial stage so as to interfere with the reflected light from the surface position of the living tissue. Is possible.
- the optical path length is finely adjusted by the uniaxial stage 422, and the light reflected by the mirror 421 via the grating 419 and the lens 420 is first coupled by the optical coupler unit 441 provided in the middle of the third single mode fiber 444. It is mixed with the light obtained from the single mode fiber 440 side and received by the photodiode 424.
- the interference light received by the photodiode 424 in this way is photoelectrically converted, amplified by the amplifier 425, and then input to the demodulator 426.
- the demodulator 426 performs demodulation processing for extracting only the signal portion of the interfered light, and its output is input to the A / D converter 427 as an interference light signal.
- the A / D converter 427 samples the interference light signal for 2048 points at 90 MHz, for example, and generates one line of digital data (interference light data).
- the sampling frequency of 90 MHz is based on the premise that about 90% of the wavelength sweep period (12.5 ⁇ sec) is extracted as 2048 digital data when the wavelength sweep repetition frequency is 40 kHz.
- the present invention is not limited to this.
- the line-by-line interference light data generated by the A / D converter 427 is input to the signal processing unit 428.
- the interference light data is frequency-resolved by FFT (Fast Fourier Transform) to generate data in the depth direction (line data), and this is coordinate-converted to obtain an optical cross section at each position in the blood vessel.
- FFT Fast Fourier Transform
- the signal processing unit 428 is further connected to the optical path length adjusting means control device 430.
- the signal processing unit 428 controls the position of the uniaxial stage 422 via the optical path length adjusting unit controller 430.
- the signal processing unit 428 controls the scanner and the pullback unit 102 to rotate the imaging core 220, and The image core 220 is pulled at a predetermined speed to move the blood vessel in the longitudinal direction. At this time, generally, a transparent flash solution is allowed to flow into the blood vessel until light emission and reception by the imaging core 220 are prevented from being disturbed by blood.
- the signal processing unit 428 since the A / D converter 427 outputs digital interference light data, the signal processing unit 428 performs the optical cross-sectional image at each position along the moving direction of the imaging core 220. Are built in the memory 428a of the signal processing unit 428.
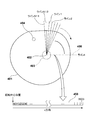
- FIG. 4 is a diagram for explaining the reconstruction processing of the cross-sectional image of the blood vessel 401 in which the imaging core 220 is located. While the imaging core 220 rotates once (360 degrees), the measurement light is transmitted and received a plurality of times. With one transmission / reception of light, data of one line in the direction of irradiation with the light can be obtained. Accordingly, 512 line data extending radially from the rotation center 402 can be obtained by transmitting and receiving light 512 times, for example, during one rotation. By performing a known calculation for the data of this line, 3D model data is generated from the rotation center position in the radial direction (r direction). One line in the model data is composed of 1024 luminance values I0 to I1023. I0 is at the rotation center position, and I1023 is a luminance value at a position farthest from the rotation center position.
- these 512 line data are constructed, but are close to each other in the vicinity of the rotation center position and become sparse with each other as they move away from the rotation center position. Therefore, the pixels in the space in which each line is free are generated by performing a known interpolation process, and a cross-sectional image that can be seen by a human is generated. It should be noted that the center position of the cross-sectional image coincides with the rotation center position of the imaging core 220 and is not the center position of the blood vessel cross section.
- the reference numeral 404 shown in the figure is a shadow of the guide wire 250.
- the guide wire 250 is made of metal and does not transmit light, an image of the back side portion of the guide wire 250 cannot be obtained when viewed from the rotation center position. It should be recognized that the illustration is only a conceptual diagram.
- the signal processing unit 428 controls the scanner and the pullback unit 102 to rotate the imaging core 220 and to move the imaging core 220 at a predetermined speed. Pulling is performed to move the blood vessel in the longitudinal direction (pullback processing). As a result, the signal processing unit 428 constructs a plurality of cross-sectional images along the pulling direction of the imaging core 220 in its own memory 428a.
- FIG. 5 indicates a conceptual diagram of three-dimensional image data generated by connecting a plurality of cross-sectional images constructed in the memory 428a to each other by pullback processing.
- the illustrated z-axis indicates the pullback direction (the longitudinal direction of the blood vessel).
- the broken line in the figure represents a boundary surface with blood in the blood vessel, and is hereinafter referred to as a blood vessel lumen surface. That is, it should be understood that the vascular lumen surface includes not only the inner wall of the blood vessel but also thrombus.
- the positional relationship between the stent and the blood vessel lumen surface is not displayed as a three-dimensional image, but is displayed as a two-dimensional image that does not require changing the viewpoint position.
- this principle will be described with reference to FIGS.
- the most important point to observe when observing the positional relationship between the stent and the vascular lumen surface is which part of the stent has a gap between the stent and the vascular lumen surface. It is in contact with the blood vessel lumen surface.
- a two-dimensional image that easily grasps such a point is generated.
- the vascular tissue covers the lumen surface of the stent. Therefore, the two-dimensional image according to the present embodiment makes it possible to easily observe such a point.
- One of the 1024 luminance values in the line data 450 can be specified by a distance r from the rotation center position (r is 0, 1, 2,..., Or 1023), and thus is obtained by pullback processing. It will be understood that arbitrary pixel values in the line data can be specified in a three-axis space of ⁇ z, ⁇ , r ⁇ .
- FIG. 6 shows a three-dimensional space represented by z, ⁇ , and r.
- data I 0 to I n-1 reference numeral 403 in FIG. 4
- this part is cut, dealing with the remaining luminance I n to I 1023 as valid data.
- the smaller the value of r the closer to the center of rotation.
- n represented here is a known value including the outer diameter of the catheter sheath 201.
- a “two-dimensional image” is reconstructed from the position where the r-axis value is negative and the direction in which the r value is positive.
- a two-dimensional image of [ ⁇ -z] viewed from the rotation center position is reconstructed. Since this two-dimensional image is an image represented by the coordinate space of ⁇ and z, the pixel value in the two-dimensional image can be expressed as P (z, ⁇ ). Therefore, a method for calculating the pixel value P (z, ⁇ ) will be described below.
- a conversion curve f indicated by reference numeral 700 represented by a luminance value and opacity is set, and each luminance value I m (m is any one of n to 1023) is set to opacity.
- the luminance value is equal to or higher than I H
- the opacity is the maximum value a max , that is, the transparency is minimum.
- the luminance values I L and I H have a linear shape. Note that the user can freely translate the conversion curve 700 along the z axis, the meaning of which will be described later.
- the opacity of the surface tissue of the blood vessel lumen surface obtained statistically was set to a value larger than a min .
- f (I n ) + f (I n + 1 ) +... f (I m ) ⁇ Th the representative pixel value P (z, ⁇ ) representing the target line data is calculated by the following equation.
- other line data is not referred to and can be expressed as a function of only the position in the target line data as in the following equation.
- i is the index number of the data point sequence in the r direction, and has a relationship of n ⁇ i ⁇ m.
- the above-described processing describes the image generation of the “two-dimensional image” when the direction in which the value of r is positive is seen from the position where the value of the r-axis is negative in FIG.
- the viewpoint direction may be arbitrarily rotated and translated by the user.
- the displayed 2D image is the 3D shown in FIG. It is displayed as an orthogonal projection image with respect to the viewing direction of the dimensional space.
- the processing content may be calculated by replacing the data group of ⁇ In to Im ⁇ with the data group of luminance values aligned on the line of sight in FIG. In this case, m can take a value larger than 1023.
- the luminance value from the catheter sheath 201 to the blood vessel lumen surface is smaller than the action of the flush liquid. Therefore, the opacity between them is at or near the minimum a max (maximum transparency). Then, when the surface of the blood vessel lumen surface is reached, the opacity gradually increases along the depth direction, so that the pixel value P (z, ⁇ ) is a certain amount from the blood vessel lumen surface. It can be said that it represents the sum of the opacity in the depth direction.
- the stent has a very high luminance (high reflection intensity) because it is made of metal.
- the high luminance representing this stent is a sufficiently large value as compared with the vascular tissue, so that it is convenient to distinguish it from the vascular lumen surface, and the pixel value P (z, ⁇ ) is also larger than the pixel value on the vascular lumen surface.
- the opacity of greater than a min of vascular tissue is somewhat added. Thereafter, the opacity indicating the stent is added, and the resulting pixel value P (z, ⁇ ) is a larger value than when the stent is exposed. That is, it is possible to distinguish between the case where the stent is exposed on the blood flow surface and the case where the vascular tissue covers the stent.
- the back surface of the stent is in contact with the vascular lumen surface, or there is a gap from the back surface to the vascular lumen surface. I ca n’t figure out. Therefore, the two-dimensional image in this embodiment is subjected to correction processing so that such points can be identified.
- This figure is a perspective conceptual view of the blood vessel 800 viewed from a position orthogonal to the longitudinal direction.
- Reference numeral 850 in the drawing indicates a stent.
- reference numeral 201 denotes a catheter sheath
- reference numeral 250 denotes a guide wire.
- sectional views of the blood vessel 800 at positions A-A ′ and B-B ′ are shown.
- the stent 850 has a network structure in order to expand the diameter after being placed at a target blood vessel position. Accordingly, as shown in the AA ′ and BB ′ sectional views in the figure, the stent 850 is detected scattered in discrete positions on a sectional image obtained by one rotation viewed from the imaging core 220. Will be.
- the A-A ′ cross-sectional image shows that there is a gap over the entire angle range between the stent and the blood vessel lumen surface 801. Further, the B-B ′ cross-sectional image shows a state in which a part of the stent is covered with vascular tissue.
- the stent 850 and the guide wire 250 are made of metal, the reflectance with respect to light is very high and light is not transmitted. Therefore, it is impossible to obtain an image of the back side of the stent 850 and the guide wire 250 when viewed from the imaging core 220. It should be recognized that the illustration is merely a conceptual diagram. Although details will be described later, a method for identifying the guide wire and the stent will be described later.
- the virtual blood vessel lumen surface May be generated, and the distance L1 may be obtained by referring to the generated closed curve.
- a gap (generally called malapposition) MP between the back surface of the stent 850 and the blood vessel lumen surface 801 is obtained by the following equation.
- MP L1- ⁇ L0 + d ⁇
- a predetermined non-negative threshold TH mp1 is set, and when a relationship of MP> TH mp1 is established, it is determined that there is a mull position.
- the pixel for determining the presence / absence of the mala position may be a pixel adjacent to the pixel to be determined belonging to the stent and determined to belong to the blood vessel lumen surface.
- the guide wire 250 is a metal like the stent 850
- the luminance distribution of the line data where the stent exists is similar to the luminance distribution of the guide wire 250.
- the guide wire 250 is not necessarily separated from the inner surface of the stent 850 by an appropriate distance, and may contact the inner surface of the stent 850. Therefore, it is difficult to distinguish a guide wire and a stent for one cross-sectional image.
- the inventor of the present application focused on the fact that the stent 850 is placed only in the treatment target region, and the pullback is performed in a form including the outside of the treatment target region in order to observe the entire treatment target region. That is, the guide wire 250 is detected over the entire pullback, and the stent or the like appears only in a specific region during the pullback.
- the guide wire and the stent are distinguished as follows.
- an angle ⁇ direction in which line data in which a high-intensity pixel is detected in a single tomographic image at the end of the pullback is present is determined as a stent candidate point.
- Stent candidates are similarly obtained for adjacent tomographic images, and candidate points having the closest candidate point angles in adjacent cross-sectional images are detected and grouped.
- a group of one candidate point continuous over the entire pullback region is calculated.
- Candidate points constituting one group are recognized as a guide wire 250.
- the signal processing unit 428 Based on the line data obtained by the pull-back process, the signal processing unit 428 performs each cross-sectional tomographic image along the z-axis that is the basis of the three-dimensional tomographic image as usual, that is, three-dimensional volume data (see FIG. 5). ) Build. Then, the signal processing unit 428 converts the luminance value in each line data in accordance with the opacity conversion curve f, and in accordance with the principle described above, each pixel constituting the two-dimensional image that is the basis of ⁇ -z in the embodiment. The value P (z, ⁇ ) is calculated. At this time, the stent and guide wire are also identified. By the processing so far, each pixel of the two-dimensional image is determined as belonging to any of a stent, a guide wire, and a blood vessel lumen surface.
- the signal processing unit 428 obtains a distance L0 between the pixel P1 belonging to the stent and adjacent to the pixel of the blood vessel lumen and the rotation center position in the tomographic image. Further, the signal processing unit 428 obtains a distance L1 between the pixel P2 that belongs to the blood vessel lumen and is adjacent to the pixel P1 of the stent and the rotation center position in the tomographic image. Based on the preset stent thickness d and L0 and L1, whether or not the pixel P2 (or P1) constitutes a mull position, or whether or not the stent is covered with the tissue of the blood vessel lumen And a correction is added to the determination result to emphasize the pixel value P2. In the embodiment, as the correction process, the pixel value is corrected so as to be a thick broken line, a solid line, and a normal broken line segment along the pixel P2.
- FIG. 9 shows an example of a generated two-dimensional image with the above correction processing added.
- the vertical axis represents ⁇
- a reference numeral 900 forming the mesh shown in the figure indicates an image of a stent.
- a thick broken line 901 indicates that the stent having the thick broken line as a boundary line on both sides constitutes a mull position (there is a gap between the back surface of the stent and the vascular lumen surface).
- a thin broken line 902 indicates that the tissue of the blood vessel lumen covers the stent at that portion. Note that the curve 250 represents a guide wire, but since it is identified from the stent as described above, the edge of the curve 250 indicates that the marl position or the vascular lumen tissue is covered. It is not a display target.
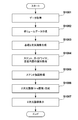
- the signal processing unit 428 that has undergone the pull-back process may eventually generate each cross-sectional image according to the flowchart of FIG.
- the processing of the signal processing unit 428 will be described with reference to FIG. Note that the processing procedure according to the flowchart of FIG. 8 is actually stored in a hard disk device or the like as a program executed by the signal processing unit.
- step S1001 the line data acquired by the pull-back process is received and stored in the memory 428a.
- step S1002 the signal processing unit 429 reconstructs each cross-sectional image and generates three-dimensional volume data (see FIG. 5). Since this generation process is known, a description thereof is omitted here.
- step S1003 the signal processing unit 428 calculates each pixel value P (z, ⁇ ) of the basic ⁇ -z two-dimensional image.
- step S1004 a process of identifying whether the pixel belongs to any of a stent, a guide wire, and a blood vessel lumen is performed. As described in detail above, all the pixels may be determined as belonging to the vascular inner shroud as initial values, and then the guide wire and the stent may be determined for the pixel P having a high reflectance.
- step S1005 with reference to the volume data, it is determined whether a pixel adjacent to the stent pixel among the pixels belonging to the blood vessel lumen constitutes a mull position, or is covered with the vascular tissue.
- the emphasis processing is performed so that they can be distinguished based on the determination result.
- the pixels belonging to the mull position are corrected by the thick broken lines, the portions covered by the vascular tissue are broken lines, and the pixel values other than that (the state where the back of the stent is in contact with the vascular lumen surface) are indicated by solid lines.
- step S1006 a two-dimensional image for display is generated together with various user interface components.
- the signal processing unit 428 displays the generated ⁇ -z two-dimensional image and user interface components on the LCD monitor 113.
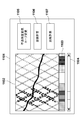
- FIG. 11 an example of the user interface displayed on the screen of the LCD 113 is shown in FIG. 11 and will be described below.
- reference numeral 1101 indicates a window displayed on the screen of the LCD 113.
- This window 1101 is a region 1102 that displays a two-dimensional image in ⁇ -z space, a state region that visually displays the degree of the muller position along the z-axis, and the degree that the vascular tissue covers the stent, z-axis direction
- a scroll bar 1104 for scrolling to the screen (to deal with a case where the pullback distance exceeds the screen width)
- a button 1105 for instructing to change the opacity conversion curve
- An area 1103 represents the degree of occurrence of the malaposition along the z-axis direction in the two-dimensional image displayed in the area 1102 and the degree to which the vascular tissue covers the stent, in order to display it one-dimensionally in multiple stages. Provided.
- the degree D of the mulla position is determined to be N in the rectangular area 950 defined by the horizontal direction W and the vertical direction in the whole angle area as shown in FIG.
- the ratio of the vascular tissue covering the stent may be calculated similarly.
- the signal processing unit 428 When the opacity conversion curve 1105 is clicked with the mouse 114, the signal processing unit 428 displays a GUI for parallel movement of the conversion curve shown in FIG. 7 along the horizontal luminance axis, and the user is free to display the GUI. You can change the position. Then, the signal processing unit 428 recalculates and displays the ⁇ -z two-dimensional image according to the changed conversion curve. For example, when the curve 700 in FIG. 7 is translated to the right, the opacity is set to amin at a certain depth from the surface of the blood vessel lumen surface, so that a deeper layer is displayed as the blood vessel lumen surface. Will be.
- the area calculation button 1106 is provided to calculate the area of the actual vascular lumen surface when the user draws a closed curve in the region 1102 shown in the figure.
- the vertical axis is ⁇ , which is different from the axis in the three-dimensional space viewed by humans. Therefore, even if a closed curve is drawn with the mouse 114 in the region 1102, it is difficult to infer the area of the actual blood vessel lumen surface from the drawing result. Therefore, in the embodiment, after clicking the button 1106, each pixel value connecting a line segment when a closed curve including an arbitrary position in the area 1102 is drawn is projected onto a three-dimensional model to obtain an actual three-dimensional position. . By performing this for each pixel position, a plurality of pixel positions defining a closed curved surface in an actual three-dimensional space are determined, an area is calculated on the position, and the result is displayed on the screen.
- the distance calculation button 1107 allows the user to specify two desired points in the area 1102 shown in the figure, and to project it onto a three-dimensional model representing the actual blood vessel lumen surface, and calculate the distance between the two projected points. , To display.
- the presence / absence of a mull position and whether or not the vascular tissue covers the stent are visually displayed by correcting the pixel value representing the vascular tissue, but the target pixel to be corrected is a pixel belonging to the stent.
- the display form is not limited to the thick broken line, the solid line, and the thin broken line, and may be displayed for each color.
- the mal position may be displayed at multiple levels according to the distance between the back surface of the stent and the vascular lumen surface. In the case of multi-level display, the degree of mala position may be expressed by the color density. This is also true for the vascular tissue covering thickness of the stent.
- the reconstruction of the cross-sectional image and the two-dimensional reconstruction process are performed by the signal processing unit 428 configured by a microprocessor. Since the microprocessor realizes its function by executing a program, the program naturally falls within the scope of the present invention. Further, the program is usually stored in a computer-readable storage medium such as a CD-ROM or DVD-ROM, and is set in a reading device (CD-ROM drive or the like) included in the computer and copied or installed in the system. It is obvious that such a computer-readable storage medium is also within the scope of the present invention.
Landscapes
- Health & Medical Sciences (AREA)
- Life Sciences & Earth Sciences (AREA)
- Engineering & Computer Science (AREA)
- Physics & Mathematics (AREA)
- Surgery (AREA)
- General Health & Medical Sciences (AREA)
- Veterinary Medicine (AREA)
- Pathology (AREA)
- Biomedical Technology (AREA)
- Heart & Thoracic Surgery (AREA)
- Medical Informatics (AREA)
- Molecular Biology (AREA)
- Biophysics (AREA)
- Animal Behavior & Ethology (AREA)
- Public Health (AREA)
- Nuclear Medicine, Radiotherapy & Molecular Imaging (AREA)
- Radiology & Medical Imaging (AREA)
- General Physics & Mathematics (AREA)
- Theoretical Computer Science (AREA)
- Optics & Photonics (AREA)
- Signal Processing (AREA)
- Human Computer Interaction (AREA)
- Cardiology (AREA)
- Physiology (AREA)
- Vascular Medicine (AREA)
- Computer Vision & Pattern Recognition (AREA)
- Quality & Reliability (AREA)
- Endoscopes (AREA)
- Ultra Sonic Daignosis Equipment (AREA)
Abstract
本発明は、イメージングコアの回転位置と移動によって導出されるイメージングコアの回転中心位置から半径方向に向かう複数の輝度値で表わされるラインデータを取得する。そして、取得したラインデータに基づき、回転角度を表わすθと、移動時方向の位置を表わすzを2軸とする2次元空間の画像を生成し、表示する。
Description
本発明は光による生体組織の断層画像生成技術に関するものである。
バルーンカテーテル、ステント等の高機能カテーテルによる血管内治療が行われている。この手術前の診断、或いは、手術後の経過確認のため、光干渉断層診断装置(OCT:Optical Coherence Tomography)等の画像診断装置が用いられるのが一般的になってきた。
光干渉断層診断装置は、光学レンズと光学ミラーを有するイメージングコアを先端に取り付けた光ファイバを内蔵し、少なくとも先端部が透明なシースを有する。そして、そのシースを患者の血管内に挿入し、イメージングコアを回転させながら、光学ミラーを介して血管壁に光を照射し、血管からの反射光を再度、その光学ミラーを介して受光することでラジアル走査を行い、得られた反射光を元に血管の断面画像を構成するものである。そして、この光ファイバを回転させながら、所定速度で引っ張る操作(一般にプルバックと呼ばれる)を行うことで、血管の長手方向の内壁の3次元画像を形成する(特許文献1)。また、OCTの改良型として、波長掃引を利用した光干渉断層診断装置(SS-OCT:Swept-source Optical coherence Tomography)も開発されている。
ステントの血管内に留置した後の術後経過診察で重要な点は、ステントに対する血管内腔面がどの程度密接している(なじんでいる)かを確認することである。しかしながら、3次元画像で表示する場合、診断者は様々な視点位置を設定して確認しなければならず、操作が煩雑であった。また、視点位置を変えた場合に、その都度、変更後の視点位置から観察される3次元画像を生成するための膨大な演算をしなければならず、ユーザの操作に対する高いレスポンスは望めない。
本明細書では、ステントを留置した後の術後の経過を、煩雑な操作無しに、容易に確認できる技術を適用する。
上記の改題を解決するため、本明細書では、以下に示す画像診断装置を提供する。すなわち、
血管の内腔面に向けて光を出射し、その反射光を検出するイメージングコアを収容するプローブを用い、前記イメージングコアを回転させると共に所定速度で前記プローブに沿って移動させることで、血管の3次元画像を再構成する画像診断装置であって、
前記イメージングコアの前記回転と前記移動を行なっている期間に前記イメージングコアより得られたデータに基づき、前記回転における回転角度毎の前記イメージングコアの回転中心から半径方向に並ぶ複数の輝度値で構成されるラインデータを導出する導出手段と、
前記イメージングコアの回転角度θ、前記移動における移動位置zにおける前記ラインデータをL(θ、z)と定義したとき、各ラインデータL(θ、z)における前記イメージングコアの回転中心から半径方向に向かう視線方向の代表画素値P(θ、z)を算出することで、θ、zを2軸とする2次元画像データを算出する算出手段と、
算出した2次元画像データを表示する表示手段とを有する。
血管の内腔面に向けて光を出射し、その反射光を検出するイメージングコアを収容するプローブを用い、前記イメージングコアを回転させると共に所定速度で前記プローブに沿って移動させることで、血管の3次元画像を再構成する画像診断装置であって、
前記イメージングコアの前記回転と前記移動を行なっている期間に前記イメージングコアより得られたデータに基づき、前記回転における回転角度毎の前記イメージングコアの回転中心から半径方向に並ぶ複数の輝度値で構成されるラインデータを導出する導出手段と、
前記イメージングコアの回転角度θ、前記移動における移動位置zにおける前記ラインデータをL(θ、z)と定義したとき、各ラインデータL(θ、z)における前記イメージングコアの回転中心から半径方向に向かう視線方向の代表画素値P(θ、z)を算出することで、θ、zを2軸とする2次元画像データを算出する算出手段と、
算出した2次元画像データを表示する表示手段とを有する。
本明細書によれば、ステントを留置した後の術後の経過を、煩雑な操作無しに、容易に確認できるようになる。
添付図面は明細書に含まれ、その一部を構成し、本発明の実施の形態を示し、その記述と共に本発明の原理を説明するために用いられる。
本実施形態にかかる画像診断装置の外観構成を示す図である。
プローブ部の全体構成及び先端部の断面構成を示す図である。
画像診断装置の機能構成を示す図である。
断面画像の再構成処理を説明するための図である。
再構成された血管の3次元モデルデータの例を示す図である。
実施形態における2次元像を生成する際のボリュームデータの例を説明するための図である。
不透明度変換曲線の例を示す図である。
ステントと血管内腔面との関係と、血管軸に直交する断面像の例を示す図である。
実施形態におけるステントの経過観察のために生成した2次元画像の例を示す図である。
実施形態における処理手順を示すフローチャートである。
実施形態における画像診断装置の表示画面に表示されるユーザインタフェースの例を示す図である。
以下添付図面に従って本発明に係る実施形態を詳細に説明する。
1.画像診断装置の外観構成
図1は本発明の一実施形態にかかる画像診断装置100の外観構成を示す図である。
図1は本発明の一実施形態にかかる画像診断装置100の外観構成を示す図である。
図1に示すように、画像診断装置100は、プローブ部101と、スキャナ及びプルバック部102と、操作制御装置103とを備え、スキャナ及びプルバック部102と操作制御装置103とは、信号線104により各種信号が伝送可能に接続されている。
プローブ部101は、直接血管内に挿入され、伝送された光(測定光)を連続的に血管内に送信するとともに、血管内からの反射光を連続的に受信する光送受信部と、を備えるイメージングコアが内挿されている。画像診断装置100では、該イメージングコアを用いることで血管内部の状態を測定する。
スキャナ及びプルバック部102は、プローブ部101が着脱可能に取り付けられ、内蔵されたモータを駆動させることでプローブ部101に内挿されたイメージングコアの血管内の軸方向の動作及び回転方向の動作を規定している。
操作制御装置103は、測定を行うにあたり、各種設定値を入力するための機能や、測定により得られたデータを処理し、各種血管像を表示するための機能を備える。
操作制御装置103において、111は本体制御部である。この本体制御部111は、測定により得られた反射光と光源からの光を分離することで得られた参照光とを干渉させることで干渉光データを生成するとともに、該干渉光データに基づいて生成されたラインデータを処理することで、光断面画像を生成する。
111-1はプリンタ及びDVDレコーダであり、本体制御部111における処理結果を印刷したり、データとして記憶したりする。112は操作パネルであり、ユーザは該操作パネル112を介して、各種設定値及び指示の入力を行う。113は表示装置としてのLCDモニタであり、本体制御部111において生成された断面画像を表示する。114は、ポインティングデバイス(座標入力装置)としてのマウスである。
2.プローブ部の全体構成及び先端部の断面構成
次に、プローブ部101の全体構成及び先端部の断面構成について図2を用いて説明する。図2に示すように、プローブ部101は、血管内に挿入される長尺のカテーテルシース201と、ユーザが操作するために血管内に挿入されることなく、ユーザの手元側に配置されるコネクタ部202とにより構成される。カテーテルシース201の先端には、診断対象の血管位置まで、プローブ部101を案内するためのガイドワイヤ250を固定するガイドワイヤルーメン用チューブ203が設けられている。カテーテルシース201は、ガイドワイヤルーメン用チューブ203との接続部分からコネクタ部202との接続部分にかけて連続する管腔を形成している。
次に、プローブ部101の全体構成及び先端部の断面構成について図2を用いて説明する。図2に示すように、プローブ部101は、血管内に挿入される長尺のカテーテルシース201と、ユーザが操作するために血管内に挿入されることなく、ユーザの手元側に配置されるコネクタ部202とにより構成される。カテーテルシース201の先端には、診断対象の血管位置まで、プローブ部101を案内するためのガイドワイヤ250を固定するガイドワイヤルーメン用チューブ203が設けられている。カテーテルシース201は、ガイドワイヤルーメン用チューブ203との接続部分からコネクタ部202との接続部分にかけて連続する管腔を形成している。
カテーテルシース201の管腔内部には、光を送受信する光送受信部とが配置された送受信部221と、光ファイバケーブルを内部に備え、それを回転させるための回転駆動力を伝達するコイル状の駆動シャフト222とを備えるイメージングコア220が、カテーテルシース201のほぼ全長にわたって挿通されている。
コネクタ部202は、カテーテルシース201の基端に一体化して構成されたシースコネクタ202aと、駆動シャフト222の基端に駆動シャフト222を回動可能に固定して構成された駆動シャフトコネクタ202bとを備える。
シースコネクタ202aとカテーテルシース201との境界部には、耐キンクプロテクタ211が設けられている。これにより所定の剛性が保たれ、急激な物性の変化による折れ曲がり(キンク)を防止することができる。
駆動シャフトコネクタ202bの基端は、スキャナ及びプルバック部102に着脱可能に取り付けられる。
ハウジング223は、短い円筒状の金属パイプの一部に切り欠き部を有した形状をしており、金属塊からの削りだしやMIM(金属粉末射出成形)等により成形される。また、先端側には短いコイル状の弾性部材231が設けられている。
弾性部材231はステンレス鋼線材をコイル状に形成したものであり、弾性部材231が先端側に配されることで、イメージングコア220を前後移動させる際にカテーテルシース201内での引っかかりを防止する。
232は補強コイルであり、カテーテルシース201の先端部分の急激な折れ曲がりを防止する目的で設けられている。
ガイドワイヤルーメン用チューブ203は、ガイドワイヤ250が挿入可能なガイドワイヤ用ルーメンを有する。ガイドワイヤ250は、カテーテルシース201bの先端を患部まで導くのに使用される。
3.画像診断装置の機能構成
次に、画像診断装置100の機能構成について説明する。図3は、OCT(ここでは、一例として波長掃引型OCT)機能を有する画像診断装置100の機能構成を示す図である。以下、同図を用いて波長掃引型OCTの機能構成について説明する。
次に、画像診断装置100の機能構成について説明する。図3は、OCT(ここでは、一例として波長掃引型OCT)機能を有する画像診断装置100の機能構成を示す図である。以下、同図を用いて波長掃引型OCTの機能構成について説明する。
図中、408は波長掃引光源(Swept Laser)であり、SOA415(semiconductor optical amplifier)とリング状に結合された光ファイバ416とポリゴンスキャニングフィルタ(408b)よりなる、Extended-cavity Laserの一種である。
SOA415から出力された光は、光ファイバ416を進み、ポリゴンスキャニングフィルタ408bに入り、ここで波長選択された光は、SOA415で増幅され、最終的にcoupler414から出力される。
ポリゴンスキャニングフィルタ408bでは、光を分光する回折格子412とポリゴンミラー409との組み合わせで波長を選択する。具体的には、回折格子412により分光された光を2枚のレンズ(410、411)によりポリゴンミラー409の表面に集光させる。これによりポリゴンミラー409と直交する波長の光のみが同一の光路を戻り、ポリゴンスキャニングフィルタ408bから出力されることとなる。つまり、ポリゴンミラー409を回転させることで、波長の時間掃引を行うことができる。
ポリゴンミラー409は、例えば、32面体のミラーが使用され、回転数が50000rpm程度である。ポリゴンミラー409と回折格子412とを組み合わせた波長掃引方式により、高速、高出力の波長掃引が可能である。
Coupler414から出力された波長掃引光源408の光は、第1のシングルモードファイバ440の一端に入射され、先端側に伝送される。第1のシングルモードファイバ440は、途中の光カップラ部441において第2のシングルモードファイバ445及び第3のシングルモードファイバ444と光学的に結合されている。
第1のシングルモードファイバ440の光カップラ部441より先端側には、非回転部(固定部)と回転部(回転駆動部)との間を結合し、光を伝送する光ロータリジョイント(光カップリング部)403が回転駆動装置404内に設けられている。
第1のシングルモードファイバ440の光カップラ部441より先端側には、非回転部(固定部)と回転部(回転駆動部)との間を結合し、光を伝送する光ロータリジョイント(光カップリング部)403が回転駆動装置404内に設けられている。
更に、光ロータリジョイント(光カップリング部)403内の第4のシングルモードファイバ442の先端側には、プローブ部101の第5のシングルモードファイバ443がアダプタ402を介して着脱自在に接続されている。これによりイメージングコア220内に挿通され回転駆動可能な第5のシングルモードファイバ443に、波長掃引光源408からの光が伝送される。
伝送された光は、イメージングコア220の光送受信部221から血管内の生体組織に対して回転動作及び軸方向動作しながら照射される。そして、生体組織の表面あるいは内部で散乱した反射光の一部がイメージングコア220の光送受信部320により取り込まれ、逆の光路を経て第1のシングルモードファイバ440側に戻る。さらに、光カップラ部441によりその一部が第2のシングルモードファイバ445側に移り、第2のシングルモードファイバ445の一端から出射された後、光検出器(例えばフォトダイオード424)にて受光される。
なお、光ロータリジョイント403の回転駆動部側は回転駆動装置404のラジアル走査モータ405により回転駆動される。
一方、第3のシングルモードファイバ444の光カップラ部441と反対側の先端には、参照光の光路長を微調整する光路長の可変機構432が設けられている。
この光路長の可変機構432はプローブ部101を交換して使用した場合の個々のプローブ部101の長さのばらつきを吸収できるよう、その長さのばらつきに相当する光路長を変化させる光路長変化手段を備えている。
第3のシングルモードファイバ444およびコリメートレンズ418は、その光軸方向に矢印423で示すように移動自在な1軸ステージ422上に設けられており、光路長変化手段を形成している。
具体的には、1軸ステージ422はプローブ部101を交換した場合に、プローブ部101の光路長のばらつきを吸収できるだけの光路長の可変範囲を有する光路長変化手段として機能する。さらに、1軸ステージ422はオフセットを調整する調整手段としての機能も備えている。例えば、プローブ部101の先端が生体組織の表面に密着していない場合でも、1軸ステージにより光路長を微小変化させることにより、生体組織の表面位置からの反射光と干渉させる状態に設定することが可能である。
1軸ステージ422で光路長が微調整され、グレーティング419、レンズ420を介してミラー421にて反射された光は第3のシングルモードファイバ444の途中に設けられた光カップラ部441で第1のシングルモードファイバ440側から得られた光と混合されて、フォトダイオード424にて受光される。
このようにしてフォトダイオード424にて受光された干渉光は光電変換され、アンプ425により増幅された後、復調器426に入力される。この復調器426では干渉した光の信号部分のみを抽出する復調処理を行い、その出力は干渉光信号としてA/D変換器427に入力される。
A/D変換器427では、干渉光信号を例えば90MHzで2048ポイント分サンプリングして、1ラインのデジタルデータ(干渉光データ)を生成する。なお、サンプリング周波数を90MHzとしたのは、波長掃引の繰り返し周波数を40kHzにした場合に、波長掃引の周期(12.5μsec)の90%程度を2048点のデジタルデータとして抽出することを前提としたものであり、特にこれに限定されるものではない。
A/D変換器427にて生成されたライン単位の干渉光データは、信号処理部428に入力される。信号処理部428では干渉光データをFFT(高速フーリエ変換)により周波数分解して深さ方向のデータ(ラインデータ)を生成し、これを座標変換することにより、血管内の各位置での光断面画像を構築し、LCDモニタ113に出力する。
信号処理部428は、更に光路長調整手段制御装置430と接続されている。信号処理部428は光路長調整手段制御装置430を介して1軸ステージ422の位置の制御を行う。
なお、信号処理部428におけるこれらの処理も、所定のプログラムがコンピュータによって実行されることで実現されるものとする。
4.画像再構成処理
上記構成において、ユーザが操作制御装置103を操作して、スキャン開始の指示を入力すると、信号処理部428は、スキャナ及びプルバック部102を制御し、イメージングコア220の回転、並びに、イメージコア220を所定速度で引っ張って、血管の長手方向への移動を行なわせる。このとき、イメージングコア220による光の出射と受光が血液に邪魔されるのを防ぐまで、一般に、透明なフラッシュ液を血管内に流すことになる。上記の結果、先に説明したように、A/D変換器427はデジタルの干渉光データを出力してくるので、信号処理部428はイメージングコア220の移動方向に沿った各位置の光断面画像を、信号処理部428が有するメモリ428aに構築していく。
上記構成において、ユーザが操作制御装置103を操作して、スキャン開始の指示を入力すると、信号処理部428は、スキャナ及びプルバック部102を制御し、イメージングコア220の回転、並びに、イメージコア220を所定速度で引っ張って、血管の長手方向への移動を行なわせる。このとき、イメージングコア220による光の出射と受光が血液に邪魔されるのを防ぐまで、一般に、透明なフラッシュ液を血管内に流すことになる。上記の結果、先に説明したように、A/D変換器427はデジタルの干渉光データを出力してくるので、信号処理部428はイメージングコア220の移動方向に沿った各位置の光断面画像を、信号処理部428が有するメモリ428aに構築していく。
ここで、1枚の光断面画像の生成に係る処理を図4を用いて説明する。図4はイメージングコア220が位置する血管401の断面画像の再構成処理を説明するための図である。イメージングコア220の1回転(360度回転)する間に、複数回の測定光の送信、受信を行う。1回の光の送受信により、その光を照射した方向の1ラインのデータを得ることができる。従って、1回転の間に、例えば512回の光の送受信を行うことで、回転中心402から放射線状に延びる512個のラインデータを得ることができる。このラインのデータを、公知の演算を行なうことで、回転中心位置から半径方向(r方向)に向かう3Dモデルデータを生成していく。このモデルデータにおける1ラインは、1024個の輝度値I0乃至I1023で構成される。I0が回転中心位置にあり、I1023が回転中心位置から最も遠い位置の輝度値である。
さて、上記のようにして、この512個のラインデータが構築されていくが、回転中心位置の近傍では互いに密で、回転中心位置から離れるにつれて互いに疎になっていく。従って、この各ラインの空いた空間における画素については、周知の補間処理を行なって生成していき、人間が視覚できる断面画像を生成することになる。なお、断面画像の中心位置は、イメージングコア220の回転中心位置と一致し、血管断面の中心位置ではない点に注意されたい。
光の送受信の際には、カテーテルシース201自身からの反射もあるので、図示の如く、断面画像にはカテーテルシース201の影403が形成される。また、図示の符号404は、ガイドワイヤ250の影である。実際には、ガイドワイヤ250は金属製であり、光を透過しないので、回転中心位置から見てガイドワイヤ250の裏側部分の画像を得ることができない。図示はあくまで概念図であると認識されたい。
さて、ユーザが操作制御装置103を操作して、スキャン開始の指示を入力すると、信号処理部428は、スキャナ及びプルバック部102を制御し、イメージングコア220の回転並びに、イメージングコア220を所定速度で引っ張って、血管の長手方向への移動を行なわせる(プルバック処理)。この結果、信号処理部428は、自身のメモリ428aに、イメージングコア220の引っ張り方向に沿った複数の断面画像を構築していく。
図5の符号500は、プルバック処理にて、メモリ428aに構築された複数の断面画像を互いに接続して生成された3次元画像データの概念図を示している。図示のz軸はプルバック方向(血管の長手方向)を示している。周知の如く、血栓等が存在すると血液が流れる通路は局所的に狭くなる。図示の破線は、血管における血液との境界面を表わすものであり、以降、血管内腔面という。すなわち、血管内腔面とは、血管内壁だけでなく血栓を含むものと理解されたい。
さて、ステントを配置した場合について考察する。この場合、図5のような3次元画像を得ることができるとしても、ステントのどの部位が血管内腔面との間に隙間があるか、どの部位が血管内腔面と接しているかを把握するためには、様々な視点位置を設定する必要がある。しかしながら、これでは操作が煩雑になる。なによりも、3次元画像を再構成する処理は膨大な演算が必要になるわけであるから、ユーザによる視点位置変更の指示に応じてその都度、3次元画像を再構成処理を行うのは無理があるので、操作に対する高いレスポンスが望めない。
本実施形態では、ステントと血管内腔面との位置関係を3次元の画像として表示するのではなく、視点位置の変更を不要とする2次元像として表示する。以下、この原理を図6乃至図9を参照して説明する。
先に説明したように、ステントと血管内腔面との位置関係を観察する上で最も把握したい点は、ステントのどの部位が血管内腔面との間に隙間を持っているか、どの部位が血管内腔面と接しているかである。本実施形態では、係る点を容易に把握する2次元画像を生成する。また、ステントが血管内腔面にある程度馴染んでくると、血管組織がステントの内腔面まで覆ってくる。そこで、本実施形態における2次元画像は係る点をも容易に観察し得るようにする。
図4に示す1本のラインデータ450は、血管の長手方向(z軸)の位置と回転角θで特定できる。そして、ラインデータ450における1024個の輝度値の1つは、回転中心位置からの距離r(rは0、1、2、…、1023のいずれか)で特定できるので、プルバック処理で得られたラインデータにおける任意の画素値は{z、θ、r}の3軸の空間で特定できるのは理解できよう。
図6は、このz、θ、rで表わされる3次元空間を示している。図示における符号601は、z=0の断面における角度θ1で特定されるラインデータを表わしている。ただし、図4を参照して説明したように、1つラインデータにおいて、回転中心位置からカテーテルシース220の表面までのデータI0乃至In-1(図4の符号403)は、血管とは無関係なデータであるので、この部分はカットし、残りの輝度In乃至I1023を有効なデータとして扱う。図6の3次元空間において、rの値が小さい位置ほど、回転中心に近いことを表わすことになる。なお、ここで表わすnは、カテーテルシース201の外径を包含する既知の値である。
本実施形態では、図6における3次元空間において、r軸の値がマイナスとなる位置からrの値がプラスとなる方向を見た「2次元画像」を再構築する。要するに、回転中心位置から見た、[θ-z]の2次元画像を再構成する。この2次元画像は、θとzの座標空間で表わされる画像であるので、その2次元画像にける画素値はP(z、θ)として表現できる。そこで、以下、この画素値P(z、θ)の算出方法について説明する。
本実施形態では、図7に示すような、輝度値、不透明度で表わされる符号700で示す変換曲線fを設定し、各輝度値Im(mはn乃至1023のいずれか)を不透明度に変換する。この変換曲線fは、輝度値がIL以下では不透明度が最小値amin(実施形態ではamin=0)、すなわち、透明度が最大となる。一方、輝度値がIH以上では不透明度が最大値amax、すなわち、透明度が最小となる。そして、輝度値ILとIH間では線形になる形状を有する。なお、ユーザは、この変換曲線700をz軸に沿って自由に並行移動できるものとしているが、その意味については後述する。デフォルトでは、統計的に求めた血管内腔面の表面組織の不透明度がaminより大きな値となるようにした。
さて、実施形態では、予め設定された閾値Th(実施形態では閾値Th=1)との関係において、次式を満たす最小のmを求める。
f(In)+f(In+1)+…f(Im)≧Th
そして、最小値mを利用し、着目ラインデータを表わす代表画素値P(z、θ)を次式で計算する。なお、座標(θ、z)における着目ラインデータの代表画素値を算出する際、他のラインデータを参照することはなく、次式のように着目ラインデータにおける位置だけの関数として表わせる。
P(z,θ)=Pi=f(Ii)*Ii+(1-f(Ii))*Pi-1
ここでiは、r方向に対するデータ点列のインデックス番号であり、n≦i≦mの関係にある。
f(In)+f(In+1)+…f(Im)≧Th
そして、最小値mを利用し、着目ラインデータを表わす代表画素値P(z、θ)を次式で計算する。なお、座標(θ、z)における着目ラインデータの代表画素値を算出する際、他のラインデータを参照することはなく、次式のように着目ラインデータにおける位置だけの関数として表わせる。
P(z,θ)=Pi=f(Ii)*Ii+(1-f(Ii))*Pi-1
ここでiは、r方向に対するデータ点列のインデックス番号であり、n≦i≦mの関係にある。
上記の処理は、先に説明したように、図6のr軸の値がマイナスとなる位置からrの値がプラスとなる方向を見た「2次元画像」の画像生成について説明している。しかし、係る2次元画像だけでなく、この視点方向はユーザによって任意に回転、並行移動を行なうようにしてもよい、回転を行った場合、表示される2D画像は、図6で示された3次元空間の視線方向に対する正射影像として表示される。その処理内容は、先に説明したように、{In~Im}のデータ群を、図6において視線上に整列する輝度値のデータ群と置き換えて計算すればよい。この場合、mは1023よりも大きい値を取りえる。
カテーテルシース201から血管内腔面までの輝度値は、フラッシュ液の作用により小さい。それ故、その間の不透明度は、最小amax(透明度最大)かそれに近になる。そして、血管内腔面の表面に到達すると、その深さ方向に沿って不透明度が次第に増していくことになるので、画素値P(z、θ)は、血管内腔面から或る程度の深さ方向の不透明度の合算結果を表わしていると言いうことができる。
一方、ステントは、金属で構成されていることもあって、非常に高い輝度(高い反射強度)を有する。このステントを表わす高い輝度は、血管組織と比較して十分に大きな値であるので、血管内腔面との区別と付けるのに都合が良いし、上記の演算で得られる画素値P(z、θ)も、血管内腔面の画素値と比較して大きな値となる。
また、ステントの内側からみて、血管組織がステントを覆っている状態では、上記算出過程で、血管組織のaminを超える不透明度がある程度加算される。その後、ステントを示す不透明度が加算されることになり、結果として得られる画素値P(z、θ)は、ステントが露出している場合と比較して更に大きな値となる。つまり、血流面にステントが露出している場合と、血管組織がステントを覆っている場合とは識別できることになる。
しかし、上記のようにして生成された画素P(z、θ)で表わされる2次元画像では、ステントの背面が血管内腔面に接しているか、或いは、背面から血管内腔面まで隙間があるかまでは把握できない。そこで、本実施形態における2次元画像は、係る点をも識別できるように補正処理を施す。
ここで、ステントの背面と血管内腔面との間の隙間の検出原理について図8を用いて説明する。
同図は血管800を、その長手方向に対して直交する位置から見た透視概念図である。図示における符号850がステントを示している。既に説明したように、符号201はカテーテルシース、符号250はガイドワイヤである。
図8の下部には、血管800の位置A-A’、位置B-B’それぞれの断面図を示している。
一般に、ステント850は、目標とする血管位置に留置した後、その径を拡張させるため、網目構造を有する。従って、図示のA-A’断面図及びB-B’断面図に示す如く、イメージングコア220から見た1回転で得られる断面像上において、ステント850はとびとびの位置に点在して検出されることになる。
A-A’断面画像は、ステントと血管内腔面801の全角度範囲に渡って隙間があることを示している。また、B-B’断面画像は、ステントの一部が血管組織で覆われている状態を示してる。また、一般にステント850、ガイドワイヤ250は金属でできているので、光に対する反射率が非常に高く、光を透過させない。従って、イメージングコア220から見てステント850、ガイドワイヤ250の裏側の像を得ることはできない。図示は、あくまで概念図であると認識されたい。なお、詳細は後述するが、ガイドワイヤとステントとの識別方法については後述する。
イメージングコア220の回転中心位置からステントの表面までの距離L0は、この断面図から容易に算出できる。また、先に説明したように、ステントは金属製であるので、その背面の血管内腔面の像は得られないが、ステントが存在しないと仮定した場合の血管内腔面までの距離L1は、そのステントの両端にそれぞれ接し、ステント未検出の2本のラインL’とL''との平均値を、距離L1として計算すれば良い。
L1=(L'+L'')/2
また、図8のA-A’断面画像を表示し、ユーザに血管内腔面とみなせる点を複数箇所指示し、その複数点を3次スプラインで補間することで、仮想的な血管内腔面を表わす閉曲線を生成し、生成された閉曲線を参照して距離L1を求めてもよい。
L1=(L'+L'')/2
また、図8のA-A’断面画像を表示し、ユーザに血管内腔面とみなせる点を複数箇所指示し、その複数点を3次スプラインで補間することで、仮想的な血管内腔面を表わす閉曲線を生成し、生成された閉曲線を参照して距離L1を求めてもよい。
ここで、ステントの厚みdは、ステントの種類により既知であり、予め設定されている。従って、ステント850の背面と血管内腔面801との間の隙間(一般に、malapposition:マルアポジションと呼ばれる)MPは、次式で得られる。
MP=L1-{L0+d}
ここで、マルアポジションMPが0より大きい場合には、ステント850と血管内腔面801との間には「マルアポジションがある」ことを表わすことになる。なお、多少の誤差を許容するため、実施形態では所定の非負の閾値THmp1を設定し、MP>THmp1の関係にあるとき、マルアポジション有りと判定することとした。マルアポジションの有無を判定する画素は、ステントに属する判定される画素に隣接し、且つ、血管内腔面に属すると判定された画素とすれば良いであろう。
MP=L1-{L0+d}
ここで、マルアポジションMPが0より大きい場合には、ステント850と血管内腔面801との間には「マルアポジションがある」ことを表わすことになる。なお、多少の誤差を許容するため、実施形態では所定の非負の閾値THmp1を設定し、MP>THmp1の関係にあるとき、マルアポジション有りと判定することとした。マルアポジションの有無を判定する画素は、ステントに属する判定される画素に隣接し、且つ、血管内腔面に属すると判定された画素とすれば良いであろう。
また、L1<L0の場合は、血管組織がステントを覆っている状態を表わしていることになる。ただし、多少の誤差を許容するため非負の閾値THmp2に対し、L0-L1<THmp2を満たす場合、ステントを血管組織が覆っている状態とする。判定対象の画素は、マルアポジションと同じとする。
次に、ガイドワイヤ250とステント850の区別について説明する。既に説明したように、ガイドワイヤ250は、ステント850と同様に金属であるので、ステントが存在するラインデータの輝度分布は、ガイドワイヤ250の輝度分布と類似する。また、ガイドワイヤ250がステント850の内面から必ずしも適当な距離を隔てているとは限らないし、ステント850の内面に接していることも起こり得る。よって、1断面画像に対してガイドワイヤとステントを区別することは難しい。
しかし、本願発明者は、ステント850は治療対象領域のみに留置され、プルバックは当該治療対象領域全域を観察するために、治療対象領域外を含んだ形でプルバックが実施されることに着目した。つまり、プルバック全域にわたりガイドワイヤ250は検出され、ステント等はプルバック中の特定の領域にしか現れない。この特性を利用して下記の通り、ガイドワイヤとステントの区別を実施する。
まず、プルバックの端部の単一の断層画像に対して高輝度画素を検出したラインデータの存在する角度θ方向をステントの候補点として決定する。そして、隣接する断層画像についても同様にステント候補を求めていき、隣り合う断面画像において候補点の角度が最も近い候補点を検出しグルーピングする。この処理をプルバックのもう一方の端部まで実行することで、プルバック全領域にわたり連続する1つの候補点のグループが算出される。1つのグループを構成する候補点をガイドワイヤ250として認識するものとした。
以上、実施形態の処理を説明したが、まとめると次の通りである。
信号処理部428は、プルバック処理で得られたラインデータに基づき、通常と同様に3次元断層像の元になるz軸に沿った各断面断層像、すなわち、3次元のボリュームデータ(図5参照)を構築する。そして、信号処理部428は、各ラインデータにおける輝度値を、不透明度変換曲線fに従って変換し、先に示した原理に従い、実施形態におけるθ-zの基礎となる2次元画像を構成する各画素値P(z、θ)を算出する。このとき、ステントとガイドワイヤの識別処理も行なう。ここまでの処理により、2次元画像の各画素は、ステント、ガイドワイヤ、血管内腔面のいずれかに属するものとして判定されることになる。
次で、信号処理部428は、ステントに属し、且つ、その血管内腔の画素に隣接する画素P1と、断層画像における回転中心位置との距離L0を求める。また、信号処理部428は、血管内腔に属し、且つ、ステントの画素P1に隣接する画素P2と、断層画像における回転中心位置との距離L1を求める。そして、予め設定したステントの厚さdと、L0、L1に基づき、画素P2(又はP1)がマルアポジションを構成しているか否か、或いは、ステントが血管内腔の組織に覆われている否かを判定し、その判定結果に画素値P2を強調処理するために補正を加える。実施形態では、この補正処理として、画素P2に沿って太破線、実線、通常破線の線分となるように、画素値を修正を加える。
図9は上記の補正処理を加えた生成された2次元画像の例を示している。図9において縦軸がθ、横軸がz方向(血管の長手方向=プルバック方向)である。θ-zの2次元画像であるのでその画像は矩形となる。
図示の網目を形成している符号900がステントの像を示している。太破線901は、その太破線を両サイドの境界線にしているステントが、マルアポジションを構成していること(ステントの背面と血管内腔面との間に隙間があること)を示している。また、細破線902は、その部位では血管内腔の組織がステントを覆っていることを示している。なお、曲線250はガイドワイヤを表わしているが、上記のようにして、ステントとの識別を行なっているので、その曲線250のエッジが、マルアポジションや血管内腔組織が覆っていることを示す表示対象とはならない。
図9の2次元画像によると、ステントの左側の全角度域にマルアポジションが形成されていて、ステントの右側の全角度域は血管組織に覆われて安定化していることが一目瞭然とすることができる。
5.処理手順の説明
プルバック処理を経た信号処理部428は結局のところ、図10のフローチャートに従って各断面画像に生成していけば良い。以下、同図に従って信号処理部428の処理を説明する。なお、同図のフローチャートに係る処理手順を実際には、信号処理部が実行するプログラムとしてハードディスク装置等に格納されているものある。
プルバック処理を経た信号処理部428は結局のところ、図10のフローチャートに従って各断面画像に生成していけば良い。以下、同図に従って信号処理部428の処理を説明する。なお、同図のフローチャートに係る処理手順を実際には、信号処理部が実行するプログラムとしてハードディスク装置等に格納されているものある。
先ず、ステップS1001にて、プルバック処理で取得したラインデータを受信し、メモリ428aに格納する。次に、ステップS1002にて、信号処理部429は、各断面画像を再構成し、3次元のボリュームデータ(図5参照)を生成する。この生成処理は、公知であるので、ここでの説明は省略する。
次のステップS1003では、信号処理部428は、基礎となるθ-zの2次元画像の各画素値P(z、θ)を算出する。この後、ステップS1004にて、画素単位に、ステント、ガイドワイヤ、血管内腔のいずれに属するかの識別処理を行なう。詳細は先に説明したが、初期値として全画素を血管内宮に属するものとして決定し、その後で、反射率の高い画素Pについてガイドワイヤ、ステントの判定を行なえば良い。
ステップS1005では、ボリュームデータを参照し、血管内腔に属する画素のうち、ステントの画素に隣接する画素について、マルアポジションを構成しているか否か、血管組織に覆われている否かを判定し、その判定結果に基づきそれらを区別できるように強調処理を行なう。図9では、マルアポジションに属する画素は太破線、血管組織で覆われている箇所は破線、それ以外(ステント背面が血管内腔面に接している状態)は実線で示すように画素値を補正し、ステップS1006で表示用の2次元画像を、各種ユーザインタフェース部品とともに生成する。そして、ステップS1007にて、信号処理部428は、生成したθ-zの2次元画像及びユーザインタフェース部品をLCDモニタ113に表示する。
ここで、LCD113の画面に表示されたユーザインタフェースの一例を図11に示し、以下に説明する。
図示における符号1101はLCD113の画面に表示されたウインドウを示している。このウインドウ1101は、θ-z空間の2次元画像を表示する領域1102、及び、z軸に沿ってマラーポジションの度合、ステントに対する血管組織が覆う度合を視覚的に表示する状態領域、z軸方向へのスクロール(プルバックの距離が画面の幅を超えている場合に対処するため)を行なうためのスクロールバー1104、不透明度変換カーブ変更を指示するボタン1105、面積計算ボタン1106、距離計算ボタン1107を有する。
領域1102については説明するまでもないであろう。領域1103は、領域1102に表示された2次元画像におけるz軸方向に沿ってマルアポジションの発生度合、並びに、血管組織がステントを覆っている度合を表わし、それを多段階で一次元表示するために設けた。
マルアポジションの度合Dは、例えば、図9に示すように水平方向W、垂直方向は全角度域で定義される矩形領域950内の全画素数をN,その領域内のマルアポジション有りと判定された画素数をNmとし、予め設定された乗算係数をαとしたとき、次式に従って算出した。
D=α・Nm/N
また、血管組織がステントを覆っている割合も同様に算出すれば良い。
D=α・Nm/N
また、血管組織がステントを覆っている割合も同様に算出すれば良い。
不透明度変換カーブ1105がマウス114でクリックされると、信号処理部428は、図7に示す変換カーブを水平方向の輝度軸に沿って並行移動するためのGUIが表示され、ユーザは自由にその位置を変更できる。そして、信号処理部428は、その変更後の変換カーブに従って、θ-zの2次元画像再計算し、表示する。例えば、図7の曲線700を右側に並行移動した場合、血管内腔面の表面から或る程度の深さまでは不透明度がaminに設定されるので、より深い層が血管内腔面として表示されることになる。
面積計算ボタン1106は、ユーザが図示の領域1102内で閉曲線を描画した際、現実の血管内腔面の面積を算出するために設けた。実施形態では、縦軸がθであり、人間が視覚する3次元空間における軸とは異なる。従って、領域1102内にてマウス114で閉曲線を描画したとしても、その描画結果から現実の血管内腔面の面積を推察することは困難である。そこで、実施形態では、ボタン1106をクリックした後に、領域1102の任意の位置を含む閉曲線を描画した際の線分を結ぶ各画素値を、3次元モデルに射影させ、現実の3次元位置を求める。これを各画素位置に対して行なうことで、現実の3次元空間における閉曲面を定義する複数の画素位置を決定し、その上で面積を算出し、その結果を画面に表示するものとした。
距離計算ボタン1107は、ユーザが図示の領域1102内で所望とする2点を指定させ、それ現実の血管内腔面を表わす3次元モデルに投影させ、その投影した2点間の距離を算出し、表示させるものである。
以上、実施形態を説明したが、本発明は上記実施形態に限定されるものではない。例えば、実施形態ではマルアポジションの有無、血管組織がステントを覆っているか否かを、血管組織を表わす画素値を補正して視覚的に表示させたが、補正する対象画素はステントに属する画素にしても構わない。また、表示形態も、太破線、実線、細破線に限らず、色別に表示しても良い。また、特にマルアポジションについては、ステントの背面と血管内腔面との距離に応じた多段階のレベルで表示させても構わない。多段階表示の場合には、マルアポジションの度合を色の濃度で表わせば良いであろう。これはステントに対する血管組織による覆っている厚さにも言える。
上記実施形態からもわかるように、断面画像の再構成、並びに、2次元の再構成処理は、マイクロプロセッサで構成される信号処理部428によるものである。マイクロプロセッサはプログラムを実行することで、その機能を実現するわけであるから、当然、そのプログラムも本願発明の範疇になる。また、通常、プログラムは、CD-ROMやDVD-ROM等のコンピュータ可読記憶媒体に格納されており、それのコンピュータが有する読み取り装置(CD-ROMドライブ等)にセットし、システムにコピーもしくはインストールすることで実行可能になるわけであるから、係るコンピュータ可読記憶媒体も本願発明の範疇に入ることも明らかである。
本発明は上記実施の形態に制限されるものではなく、本発明の要旨及び範囲から離脱することなく、様々な変更及び変形が可能である。従って、本発明の範囲を公にするために、以下の請求項を添付する。
Claims (11)
- 血管の内腔面に向けて光を出射し、その反射光を検出するイメージングコアを収容するプローブを用い、前記イメージングコアを回転させると共に所定速度で前記プローブに沿って移動させることで、血管の3次元画像を再構成する画像診断装置であって、
前記イメージングコアの前記回転と前記移動を行なっている期間に前記イメージングコアより得られたデータに基づき、前記回転における回転角度毎の前記イメージングコアの回転中心から半径方向に並ぶ複数の輝度値で構成されるラインデータを導出する導出手段と、
前記イメージングコアの回転角度θ、前記移動における移動位置zにおける前記ラインデータをL(θ、z)と定義したとき、各ラインデータL(θ、z)における前記イメージングコアの回転中心から半径方向に向かう視線方向の代表画素値P(θ、z)を算出することで、θ、zを2軸とする2次元画像データを算出する算出手段と、
算出した2次元画像データを表示する表示手段と
を有することを特徴とする画像診断装置。 - 前記算出手段は、
前記導出手段で得られた各ラインデータに基づき、血管の3次元モデルデータを生成する生成手段と、
前記導出手段で得られたラインデータ毎に、血管内に留置したステントを表わすラインデータであるか否かを識別する識別手段と、
前記識別手段による識別結果、前記生成手段で得られた3次元モデルデータ、並びに、予め設定された前記ステントの厚さdに基づき、血管内腔面と当該血管内腔面に対向する前記ステントの表面との間に所定閾値以上となるマルアポジションが存在する部位を特定する特定手段と、
各ラインデータの輝度値を予め設定された変換関数を用いて不透明度を示す値に変換し、前記回転の中心位置から半径方向に沿った輝度値の不透明度を示す値を合算していくことで、前記ラインデータの代表画素値を算出する代表画素値算出手段と、
該代表画素値算出手段で算出した代表画素値で構成される画像データ内の、前記特定手段で特定した部位に応じた画素値を補正し、前記マルアポジションが存在する部位を強調表示するための前記2次元画像データを生成する補正手段と、
を有することを特徴とする請求項1に記載の画像診断装置。 - 前記変換関数は、予め設定された2つの輝度値IL以下では最小不透明度、前記輝度値ILより大きい輝度値IH以上では最大不透明度、前記輝度値ILとIH間では最小不透明度、最大不透明度を直線で結ぶ形状の変換曲線を有する関数であることを特徴とする請求項2に記載の画像診断装置。
- ユーザの指示に応じて前記変換曲線を前記輝度軸にそって並行移動する手段を有することを特徴とする請求項3に記載の画像診断装置。
- 前記特定手段は、前記識別手段の識別結果に基づき、前記イメージングコアとステントの表面間の距離L0と、前記距離L0の測定位置に近傍の前記イメージングコアと血管内腔面との距離L1との関係が、L0>L1を満たして、血管組織が前記ステントを覆っている部位を更に特定し、
前記補正手段は、該代表画素値算出手段で算出した代表画素値で構成される画像データ内の、前記特定手段で特定した血管組織が前記ステントを覆っている部位の画素を補正する
を有することを特徴とする請求項2乃至4のいずれか1項に記載の画像診断装置。 - 更に、前記2次元画像の前記z軸の各位置に対してマルアポジションの存在する割合、血管組織がステンを覆っている割合を示すガイド画像を生成する手段を有し、
前記表示手段は、前記2次元画像データ及び前記ガイド画像を、前記z軸に沿って並列に表示する
ことを特徴とする請求項5に記載の画像診断装置。 - 血管の内腔面に向けて光を出射し、その反射光を検出するイメージングコアを収容するプローブを用い、前記イメージングコアを回転させると共に所定速度で前記プローブに沿って移動させることで、血管の3次元画像を再構成する画像診断装置の制御方法であって、
前記イメージングコアの前記回転と前記移動を行なっている期間に前記イメージングコアより得られたデータに基づき、前記回転における回転角度毎の前記イメージングコアの回転中心から半径方向に並ぶ複数の輝度値で構成されるラインデータを導出する導出工程と、
前記イメージングコアの回転角度θ、前記移動における移動位置zにおける前記ラインデータをL(θ、z)と定義したとき、各ラインデータL(θ、z)における前記イメージングコアの回転中心から半径方向に向かう視線方向の代表画素値P(θ、z)を算出することで、θ、zを2軸とする2次元画像データを算出する算出工程と、
算出した2次元画像データを表示する表示工程と
を有することを特徴とする画像診断装置の制御方法。 - 血管の内腔面に向けて光を出射し、その反射光を検出するイメージングコアを収容するプローブを用い、前記イメージングコアを回転させると共に所定速度で前記プローブに沿って移動させることで、血管の3次元画像を再構成する画像診断装置より得られた前記イメージングコアからのデータに基づき、3次元画像を生成する情報処理装置であって、
前記イメージングコアの前記回転と前記移動を行なっている期間に前記イメージングコアより得られたデータに基づき、前記回転における回転角度毎の前記イメージングコアの回転中心から半径方向に並ぶ複数の輝度値で構成されるラインデータを導出する導出手段と、
前記イメージングコアの回転角度θ、前記移動における移動位置zにおける前記ラインデータをL(θ、z)と定義したとき、各ラインデータL(θ、z)における前記イメージングコアの回転中心から半径方向に向かう視線方向の代表画素値P(θ、z)を算出することで、θ、zを2軸とする2次元画像データを算出する算出手段と、
算出した2次元画像データを表示する表示手段と
を有することを特徴とする情報処理装置。 - 血管の内腔面に向けて光を出射し、その反射光を検出するイメージングコアを収容するプローブを用い、前記イメージングコアを回転させると共に所定速度で前記プローブに沿って移動させることで、血管の3次元画像を再構成する画像診断装置より得られた前記イメージングコアからのデータに基づき、3次元画像を生成する情報処理装置の制御方法であって、
前記イメージングコアの前記回転と前記移動を行なっている期間に前記イメージングコアより得られたデータに基づき、前記回転における回転角度毎の前記イメージングコアの回転中心から半径方向に並ぶ複数の輝度値で構成されるラインデータを導出する導出工程と、
前記イメージングコアの回転角度θ、前記移動における移動位置zにおける前記ラインデータをL(θ、z)と定義したとき、各ラインデータL(θ、z)における前記イメージングコアの回転中心から半径方向に向かう視線方向の代表画素値P(θ、z)を算出することで、θ、zを2軸とする2次元画像データを算出する算出工程と、
算出した2次元画像データを表示する表示工程と
を有することを特徴とする情報処理装置の制御方法。 - コンピュータに読み込ませ実行させることで、前記コンピュータに請求項9に記載の方法の各工程を実行させるためのプログラム。
- 請求項10に記載のプログラムを格納したことを特徴とするコンピュータが読み取り可能な記憶媒体。
Priority Applications (4)
| Application Number | Priority Date | Filing Date | Title |
|---|---|---|---|
| PCT/JP2013/000327 WO2014115182A1 (ja) | 2013-01-23 | 2013-01-23 | 画像診断装置及び情報処理装置及びそれらの制御方法、プログラム及びコンピュータ可読記憶媒体 |
| EP13873103.9A EP2949259B1 (en) | 2013-01-23 | 2013-01-23 | Image diagnostic device and information processing device |
| JP2014558274A JP6046749B2 (ja) | 2013-01-23 | 2013-01-23 | 画像診断装置及び情報処理装置及びプログラム及びコンピュータ可読記憶媒体 |
| US14/806,119 US9572496B2 (en) | 2013-01-23 | 2015-07-22 | Imaging apparatus for diagnosis, information processing apparatus, control method thereof, program and computer-readable storage medium |
Applications Claiming Priority (1)
| Application Number | Priority Date | Filing Date | Title |
|---|---|---|---|
| PCT/JP2013/000327 WO2014115182A1 (ja) | 2013-01-23 | 2013-01-23 | 画像診断装置及び情報処理装置及びそれらの制御方法、プログラム及びコンピュータ可読記憶媒体 |
Related Child Applications (1)
| Application Number | Title | Priority Date | Filing Date |
|---|---|---|---|
| US14/806,119 Continuation US9572496B2 (en) | 2013-01-23 | 2015-07-22 | Imaging apparatus for diagnosis, information processing apparatus, control method thereof, program and computer-readable storage medium |
Publications (1)
| Publication Number | Publication Date |
|---|---|
| WO2014115182A1 true WO2014115182A1 (ja) | 2014-07-31 |
Family
ID=51227006
Family Applications (1)
| Application Number | Title | Priority Date | Filing Date |
|---|---|---|---|
| PCT/JP2013/000327 Ceased WO2014115182A1 (ja) | 2013-01-23 | 2013-01-23 | 画像診断装置及び情報処理装置及びそれらの制御方法、プログラム及びコンピュータ可読記憶媒体 |
Country Status (4)
| Country | Link |
|---|---|
| US (1) | US9572496B2 (ja) |
| EP (1) | EP2949259B1 (ja) |
| JP (1) | JP6046749B2 (ja) |
| WO (1) | WO2014115182A1 (ja) |
Cited By (5)
| Publication number | Priority date | Publication date | Assignee | Title |
|---|---|---|---|---|
| CN107847135A (zh) * | 2015-05-17 | 2018-03-27 | 光学实验室成像公司 | 血管内成像系统界面和支架检测方法 |
| WO2021048834A1 (ja) | 2019-09-12 | 2021-03-18 | テルモ株式会社 | 診断支援装置、診断支援システム、及び診断支援方法 |
| JP2021118855A (ja) * | 2015-07-25 | 2021-08-12 | ライトラボ・イメージング・インコーポレーテッド | 血管内データ視覚化方法 |
| JP2023001057A (ja) * | 2021-06-18 | 2023-01-04 | キヤノン ユーエスエイ,インコーポレイテッド | 光干渉断層撮影画像等の1つ以上の画像において編集用の管腔曲線を単純化するための装置、方法及び記憶媒体 |
| US12561810B2 (en) | 2015-05-17 | 2026-02-24 | Lightlab Imaging, Inc. | Stent detection methods and imaging system interfaces |
Families Citing this family (7)
| Publication number | Priority date | Publication date | Assignee | Title |
|---|---|---|---|---|
| EP3282921B1 (en) | 2015-04-16 | 2022-02-16 | Gentuity LLC | Micro-optic probes for neurology |
| JP6981967B2 (ja) | 2015-08-31 | 2021-12-17 | ジェンテュイティ・リミテッド・ライアビリティ・カンパニーGentuity, LLC | 撮像プローブおよびデリバリデバイスを含む撮像システム |
| WO2019108598A1 (en) | 2017-11-28 | 2019-06-06 | Gentuity, Llc | Imaging system |
| US12262872B2 (en) | 2018-09-17 | 2025-04-01 | Gentuity, Llc | Imaging system with optical pathway |
| EP3962346A4 (en) | 2019-04-30 | 2023-04-19 | Gentuity LLC | IMAGING PROBE WITH FLUID PRESSURIZATION ELEMENT |
| WO2020237024A1 (en) | 2019-05-21 | 2020-11-26 | Gentuity, Llc | Systems and methods for oct-guided treatment of a patient |
| US11922633B2 (en) | 2020-06-30 | 2024-03-05 | Canon U.S.A., Inc. | Real-time lumen distance calculation based on three-dimensional (3D) A-line signal data |
Citations (2)
| Publication number | Priority date | Publication date | Assignee | Title |
|---|---|---|---|---|
| JP2007267867A (ja) | 2006-03-30 | 2007-10-18 | Terumo Corp | 画像診断装置およびその処理方法 |
| JP2012505669A (ja) * | 2008-10-14 | 2012-03-08 | ライトラブ イメージング, インコーポレイテッド | 光コヒーレンス断層撮影法を使用するステントストラット検出ならびに関連する測定および表示のための方法 |
Family Cites Families (5)
| Publication number | Priority date | Publication date | Assignee | Title |
|---|---|---|---|---|
| EP2040059A3 (en) * | 2007-09-19 | 2013-09-04 | FUJIFILM Corporation | Optical tomography imaging system, contact area detecting method and image processing method using the same, and optical tomographic image obtaining method |
| JP5451485B2 (ja) * | 2010-03-29 | 2014-03-26 | テルモ株式会社 | 光干渉断層像形成装置及びその作動方法 |
| JP5592137B2 (ja) * | 2010-03-30 | 2014-09-17 | テルモ株式会社 | 光画像診断装置及びその表示制御方法 |
| US8750615B2 (en) * | 2010-08-02 | 2014-06-10 | Case Western Reserve University | Segmentation and quantification for intravascular optical coherence tomography images |
| JP5827024B2 (ja) * | 2011-03-31 | 2015-12-02 | 株式会社吉田製作所 | 光干渉断層画像生成装置の制御装置、制御方法及び制御プログラム |
-
2013
- 2013-01-23 EP EP13873103.9A patent/EP2949259B1/en active Active
- 2013-01-23 JP JP2014558274A patent/JP6046749B2/ja active Active
- 2013-01-23 WO PCT/JP2013/000327 patent/WO2014115182A1/ja not_active Ceased
-
2015
- 2015-07-22 US US14/806,119 patent/US9572496B2/en active Active
Patent Citations (2)
| Publication number | Priority date | Publication date | Assignee | Title |
|---|---|---|---|---|
| JP2007267867A (ja) | 2006-03-30 | 2007-10-18 | Terumo Corp | 画像診断装置およびその処理方法 |
| JP2012505669A (ja) * | 2008-10-14 | 2012-03-08 | ライトラブ イメージング, インコーポレイテッド | 光コヒーレンス断層撮影法を使用するステントストラット検出ならびに関連する測定および表示のための方法 |
Non-Patent Citations (1)
| Title |
|---|
| See also references of EP2949259A4 |
Cited By (9)
| Publication number | Priority date | Publication date | Assignee | Title |
|---|---|---|---|---|
| CN107847135A (zh) * | 2015-05-17 | 2018-03-27 | 光学实验室成像公司 | 血管内成像系统界面和支架检测方法 |
| US12561810B2 (en) | 2015-05-17 | 2026-02-24 | Lightlab Imaging, Inc. | Stent detection methods and imaging system interfaces |
| JP2021118855A (ja) * | 2015-07-25 | 2021-08-12 | ライトラボ・イメージング・インコーポレーテッド | 血管内データ視覚化方法 |
| US12554388B2 (en) | 2015-07-25 | 2026-02-17 | Lightlab Imaging, Inc. | Intravascular data visualization and interface systems and methods |
| WO2021048834A1 (ja) | 2019-09-12 | 2021-03-18 | テルモ株式会社 | 診断支援装置、診断支援システム、及び診断支援方法 |
| US11957509B2 (en) | 2019-09-12 | 2024-04-16 | Terumo Kabushiki Kaisha | Diagnosis assistance device, diagnosis assistance system, and diagnosis assistance method |
| JP2023001057A (ja) * | 2021-06-18 | 2023-01-04 | キヤノン ユーエスエイ,インコーポレイテッド | 光干渉断層撮影画像等の1つ以上の画像において編集用の管腔曲線を単純化するための装置、方法及び記憶媒体 |
| US11779221B2 (en) | 2021-06-18 | 2023-10-10 | Canon U.S.A., Inc. | Apparatus, method and storage medium for lumen curve simplification for editing in one or more images, such as in optical coherence tomography images |
| JP7542575B2 (ja) | 2021-06-18 | 2024-08-30 | キヤノン ユーエスエイ,インコーポレイテッド | 光干渉断層撮影画像等の1つ以上の画像において編集用の管腔曲線を単純化するための装置、方法及び記憶媒体 |
Also Published As
| Publication number | Publication date |
|---|---|
| JP6046749B2 (ja) | 2016-12-21 |
| US9572496B2 (en) | 2017-02-21 |
| JPWO2014115182A1 (ja) | 2017-01-19 |
| EP2949259B1 (en) | 2018-06-27 |
| US20150320317A1 (en) | 2015-11-12 |
| EP2949259A4 (en) | 2016-07-13 |
| EP2949259A1 (en) | 2015-12-02 |
Similar Documents
| Publication | Publication Date | Title |
|---|---|---|
| JP6046749B2 (ja) | 画像診断装置及び情報処理装置及びプログラム及びコンピュータ可読記憶媒体 | |
| US9836835B2 (en) | Imaging apparatus for diagnosis, information processing apparatus, and control method thereof, program thereof, and computer-readable storage medium thereof | |
| US10470665B2 (en) | Imaging apparatus for diagnosis and method of controlling the same | |
| JP6095770B2 (ja) | 画像診断装置及びその作動方法、プログラム及びコンピュータ可読記憶媒体 | |
| US10478156B2 (en) | Imaging apparatus for diagnosis, method of controlling the same, program, and computer readable storage medium | |
| JP6013502B2 (ja) | 画像診断装置及び情報処理装置及びそれらの制御方法 | |
| JP5592137B2 (ja) | 光画像診断装置及びその表示制御方法 | |
| US20150182192A1 (en) | Imaging apparatus for diagnosis and image processing method | |
| JP6587624B2 (ja) | 断層像形成装置および制御方法 | |
| JP5508092B2 (ja) | 光画像診断装置及びその表示制御方法 | |
| JPWO2016152624A1 (ja) | 画像診断装置及びその作動方法、プログラム及びコンピュータ可読記憶媒体 | |
| US20140257095A1 (en) | Shape sensing interventional catheters and methods of use | |
| JP6100911B2 (ja) | 画像診断装置及びその作動方法 | |
| JP2023514816A (ja) | 前方視型rgb/光コヒーレンストモグラフィ二重画像化装置 | |
| WO2022209657A1 (ja) | コンピュータプログラム、情報処理方法及び情報処理装置 | |
| JP2023054764A (ja) | 手動管腔検出に基づく蛍光較正 | |
| JP6809905B2 (ja) | 画像診断装置、画像診断装置の作動方法及びプログラム | |
| WO2014162366A1 (ja) | 画像診断装置及びその制御方法、プログラム及びコンピュータ可読記憶媒体 | |
| JP6563666B2 (ja) | 画像診断装置及びその制御方法、プログラム及びコンピュータ可読記憶媒体 | |
| JP6584806B2 (ja) | 画像診断装置及びその制御方法、プログラム及びコンピュータ可読記憶媒体 | |
| JP2015181701A (ja) | 画像診断装置及びその制御方法 |
Legal Events
| Date | Code | Title | Description |
|---|---|---|---|
| 121 | Ep: the epo has been informed by wipo that ep was designated in this application |
Ref document number: 13873103 Country of ref document: EP Kind code of ref document: A1 |
|
| ENP | Entry into the national phase |
Ref document number: 2014558274 Country of ref document: JP Kind code of ref document: A |
|
| WWE | Wipo information: entry into national phase |
Ref document number: 2013873103 Country of ref document: EP |
|
| NENP | Non-entry into the national phase |
Ref country code: DE |