WO2014033894A1 - サービス性能監視方法 - Google Patents
サービス性能監視方法 Download PDFInfo
- Publication number
- WO2014033894A1 WO2014033894A1 PCT/JP2012/072097 JP2012072097W WO2014033894A1 WO 2014033894 A1 WO2014033894 A1 WO 2014033894A1 JP 2012072097 W JP2012072097 W JP 2012072097W WO 2014033894 A1 WO2014033894 A1 WO 2014033894A1
- Authority
- WO
- WIPO (PCT)
- Prior art keywords
- monitoring
- event
- service
- information
- baseline
- Prior art date
- Legal status (The legal status is an assumption and is not a legal conclusion. Google has not performed a legal analysis and makes no representation as to the accuracy of the status listed.)
- Ceased
Links
Images









Classifications
-
- H—ELECTRICITY
- H04—ELECTRIC COMMUNICATION TECHNIQUE
- H04L—TRANSMISSION OF DIGITAL INFORMATION, e.g. TELEGRAPHIC COMMUNICATION
- H04L43/00—Arrangements for monitoring or testing data switching networks
- H04L43/08—Monitoring or testing based on specific metrics, e.g. QoS, energy consumption or environmental parameters
-
- G—PHYSICS
- G06—COMPUTING OR CALCULATING; COUNTING
- G06F—ELECTRIC DIGITAL DATA PROCESSING
- G06F11/00—Error detection; Error correction; Monitoring
- G06F11/30—Monitoring
- G06F11/34—Recording or statistical evaluation of computer activity, e.g. of down time, of input/output operation ; Recording or statistical evaluation of user activity, e.g. usability assessment
- G06F11/3409—Recording or statistical evaluation of computer activity, e.g. of down time, of input/output operation ; Recording or statistical evaluation of user activity, e.g. usability assessment for performance assessment
-
- G—PHYSICS
- G06—COMPUTING OR CALCULATING; COUNTING
- G06F—ELECTRIC DIGITAL DATA PROCESSING
- G06F11/00—Error detection; Error correction; Monitoring
- G06F11/30—Monitoring
- G06F11/34—Recording or statistical evaluation of computer activity, e.g. of down time, of input/output operation ; Recording or statistical evaluation of user activity, e.g. usability assessment
- G06F11/3466—Performance evaluation by tracing or monitoring
- G06F11/3495—Performance evaluation by tracing or monitoring for systems
-
- H—ELECTRICITY
- H04—ELECTRIC COMMUNICATION TECHNIQUE
- H04L—TRANSMISSION OF DIGITAL INFORMATION, e.g. TELEGRAPHIC COMMUNICATION
- H04L43/00—Arrangements for monitoring or testing data switching networks
- H04L43/04—Processing captured monitoring data, e.g. for logfile generation
- H04L43/045—Processing captured monitoring data, e.g. for logfile generation for graphical visualisation of monitoring data
-
- H—ELECTRICITY
- H04—ELECTRIC COMMUNICATION TECHNIQUE
- H04L—TRANSMISSION OF DIGITAL INFORMATION, e.g. TELEGRAPHIC COMMUNICATION
- H04L63/00—Network architectures or network communication protocols for network security
- H04L63/14—Network architectures or network communication protocols for network security for detecting or protecting against malicious traffic
- H04L63/1408—Network architectures or network communication protocols for network security for detecting or protecting against malicious traffic by monitoring network traffic
-
- G—PHYSICS
- G06—COMPUTING OR CALCULATING; COUNTING
- G06F—ELECTRIC DIGITAL DATA PROCESSING
- G06F11/00—Error detection; Error correction; Monitoring
-
- G—PHYSICS
- G06—COMPUTING OR CALCULATING; COUNTING
- G06F—ELECTRIC DIGITAL DATA PROCESSING
- G06F11/00—Error detection; Error correction; Monitoring
- G06F11/07—Responding to the occurrence of a fault, e.g. fault tolerance
-
- G—PHYSICS
- G06—COMPUTING OR CALCULATING; COUNTING
- G06F—ELECTRIC DIGITAL DATA PROCESSING
- G06F11/00—Error detection; Error correction; Monitoring
- G06F11/07—Responding to the occurrence of a fault, e.g. fault tolerance
- G06F11/0703—Error or fault processing not based on redundancy, i.e. by taking additional measures to deal with the error or fault not making use of redundancy in operation, in hardware, or in data representation
- G06F11/0706—Error or fault processing not based on redundancy, i.e. by taking additional measures to deal with the error or fault not making use of redundancy in operation, in hardware, or in data representation the processing taking place on a specific hardware platform or in a specific software environment
- G06F11/0748—Error or fault processing not based on redundancy, i.e. by taking additional measures to deal with the error or fault not making use of redundancy in operation, in hardware, or in data representation the processing taking place on a specific hardware platform or in a specific software environment in a remote unit communicating with a single-box computer node experiencing an error/fault
-
- G—PHYSICS
- G06—COMPUTING OR CALCULATING; COUNTING
- G06F—ELECTRIC DIGITAL DATA PROCESSING
- G06F2201/00—Indexing scheme relating to error detection, to error correction, and to monitoring
- G06F2201/81—Threshold
-
- G—PHYSICS
- G06—COMPUTING OR CALCULATING; COUNTING
- G06F—ELECTRIC DIGITAL DATA PROCESSING
- G06F2201/00—Indexing scheme relating to error detection, to error correction, and to monitoring
- G06F2201/875—Monitoring of systems including the internet
-
- H—ELECTRICITY
- H04—ELECTRIC COMMUNICATION TECHNIQUE
- H04L—TRANSMISSION OF DIGITAL INFORMATION, e.g. TELEGRAPHIC COMMUNICATION
- H04L63/00—Network architectures or network communication protocols for network security
- H04L63/14—Network architectures or network communication protocols for network security for detecting or protecting against malicious traffic
- H04L63/1408—Network architectures or network communication protocols for network security for detecting or protecting against malicious traffic by monitoring network traffic
- H04L63/1425—Traffic logging, e.g. anomaly detection
Definitions
- the embodiment relates to a technology for monitoring and monitoring information systems.
- an abnormality is detected by setting a threshold for a monitoring target server and monitoring items that can be monitored by the server, and monitoring the threshold for each monitoring item.
- a threshold value for each monitoring item and the setting work load.
- the technology includes an abnormal load detecting means 17 for detecting an abnormal load of the system by comparing the current load information of the system 1 and threshold data of the time corresponding to the current load information.
- Patent Document 1 With the technology disclosed in Patent Document 1, it is difficult to monitor a system that provides services to client computers through a network.
- the difficulty is, for example, the following (1) or (2).
- the monitoring value may vary depending on the content of the request from the terminal (for example, the request type and the number of requests per unit time).
- the past monitoring value is not managed as a baseline in consideration of such request contents, erroneous abnormality detection frequently occurs.
- a monitoring system for monitoring a service execution infrastructure manages a baseline of component monitoring values for each service load provided by the infrastructure, and reduces the current service load. Use different baselines accordingly. Further, in order to solve the above (2), when the monitoring system detects an abnormality in the service monitoring value or the component monitoring value in the baseline, the event from the latest time to the predetermined time and the time zone within the baseline Compare with the event to identify the differential event (that is, the most recent event that is not normal).
- FIG. 3 is a diagram illustrating a hardware configuration of a computer according to the first embodiment. It is a figure which shows the structure of the service monitoring server of Example 1. FIG. It is a figure which shows the performance analysis processing flow of the service monitoring manager using the stream data processing system of Example 1.
- FIG. 3 is an example of configuration information according to the first embodiment. 1 is a configuration example of a Web system that is an example of a system execution platform according to a first embodiment. It is a figure which shows the content of the service monitoring information stream and the service monitoring information stream with business information regarding the system execution base service of the first embodiment.
- FIG. 1 It is a figure which shows the content of the system monitoring information stream and the system monitoring information stream with business information regarding the component of the system execution base
- FIG. It is a figure which shows the content of the event monitoring information stream regarding the system execution base
- FIG. 3 is a flowchart of a performance analysis processing unit according to the first embodiment.
- FIG. 6 is a flowchart of similar event detection processing according to the first embodiment. It is a figure which shows the monitoring screen of Example 1.
- FIG. It is a figure which shows the monitoring screen of Example 1.
- FIG. It is a figure which shows the information system of Example 2.
- FIG. 10 is a flowchart of similar event detection processing according to the second embodiment. It is a flowchart of the incident search process of Example 2. It is a figure which shows the monitoring screen of Example 2.
- FIG. 10 is a flowchart of similar event detection processing according to the second embodiment. It is a flowchart of the incident search process of Example 2. It is a figure which shows the monitoring screen of Example 2.
- Stream A flow of information that represents the time transition of information that can change over time, such as events and measured values.
- Baseline A past monitoring value or a value obtained by statistically processing a monitoring value, which is the basis for determining an abnormality.
- program is used as the subject.
- the program performs processing determined by being executed by the processor using the memory and the communication port (communication control device)
- the processor is used as the subject.
- the explanation may be as follows. Further, the processing disclosed with the program as the subject may be processing performed by a computer such as a management server or an information processing apparatus. Further, part or all of the program may be realized by dedicated hardware.
- Various programs may be installed in each computer by a program distribution server or a storage medium that can be read by the computer.
- the program distribution server includes a CPU and storage resources, and the storage resources further store a distribution program and a program to be distributed.
- the distribution program is executed by the CPU, the CPU of the program distribution server distributes the distribution target program to other computers.
- FIG. 1 is a configuration diagram of an information system including a monitoring system.
- the monitoring target is a service execution-based Web system 101 and a service that an end user uses from each terminal 102 via the network 104 using the Web browser 103.
- the monitoring system monitors a plurality of Web systems and services available thereon.
- the Web is exemplified as an example of the service, but other file sharing services and other network services are included in the service.
- the Web system 101 is a service execution platform configured by physical or logical components such as a server (configured by a processor, a storage resource, a network, etc.), an OS, and middleware.
- a server configured by a processor, a storage resource, a network, etc.
- OS an OS
- middleware an OS
- the system remote monitoring server 107 monitors the OS and middleware remote monitoring 109 that remotely monitors the operating performance of the OS and middleware of the servers that constitute the system.
- the OS monitoring agent 105, the middleware monitoring agent 106, the OS remote monitoring 108, and the middleware remote monitoring 108 transmit monitoring values for predetermined monitoring items of the components that are the monitoring targets to the service monitoring server 113.
- transmission / reception packets of the Web system 101 are mirrored from the mirror port of the network switch 110 and sent to the traffic monitoring server 111.
- the traffic monitoring agent 112 mounted on the traffic monitoring server 111 analyzes the HTTP packet and calculates the response time.
- the traffic monitoring server 111 transmits an overview of the monitoring result HTTP packet and the response time to the service monitoring server 113.
- a plurality of traffic monitoring servers 111 may be provided, and packets may be collected and analyzed from the connection destination switches.
- any packet may be used as long as it has a function of collecting packets flowing through the network, analyzing the http packet, calculating the response time, and outputting the http packet information and the response time.
- the service monitoring method may be other methods, for example, a method of adding a program capable of calculating a response time to a service execution base Web server.
- the event monitoring manager 116 in the event monitoring server 115 acquires all event information notified from the monitoring target Web system 101 and the various monitoring servers 107 and 111.
- the types of events that occur on the service execution platform in other words, the event monitoring server detects (including reception)) monitor values such as component failures and warnings, component performance, etc. If it exceeds the limit, some sort of processing has started in the service execution platform (for example, virus scanning, garbage collection, defragmentation, etc.), but it can be considered as an example, but other examples may be used.
- the service monitoring manager 114 mounted on the service monitoring server 113 compares the component monitoring value with the baseline, makes an abnormality determination, and notifies the event monitoring manager 116 in the event monitoring server 115 of an abnormality notification. Further, based on the overview of the HTTP packet and the response time, the response time and the baseline are compared for each monitored service, an abnormality is determined, and an abnormality notification event is notified to the event monitoring manager 116 in the event monitoring server 115.
- the events related to the service and related systems are compared between the normal time zone and the abnormal time zone adopted for the baseline, and the difference event or Detect event combinations. Then, it is searched whether or not the difference event and the similar event or the combination of events are included in the past events.
- a numerical calculation for leveling the response time is performed, and a baseline is set based on the monitoring results.
- the service monitoring result can be viewed remotely using the Web browser 118 of the terminal 117.
- the terminal 117 that displays the service monitoring result may be the same as or different from the terminal 102 that receives the service provision.
- the monitoring system for monitoring the service execution base in this embodiment is composed of three servers: a traffic monitoring server 111, a service monitoring server 113, and an event monitoring server 115. It only needs to be able to handle monitoring and service monitoring. Furthermore, as long as the display and input are mentioned in the claims, the monitoring system may include the terminal 117 in line with the above-mentioned purpose. On the other hand, if the display or input is performed on a server that performs traffic monitoring or service monitoring processing such as a service monitoring server, the monitoring system may not include a terminal. Further, if the monitoring processing is shared by a plurality of servers for the purpose of high reliability, parallelization, and decentralization of the monitoring processing, the monitoring system is a group of servers that handle these processing.
- component monitoring values will be described using performance values as examples, but other monitoring values (number of component access retries, packet loss rate, number of context switches, request queue length to components, number of queue overflows, etc.) ) Is also applicable.
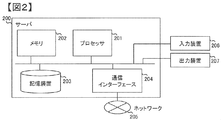
- FIG. 2 shows a hardware configuration of a computer other than the terminal 102, the server included in the Web system 101, the traffic monitoring server 111, the system remote monitoring server 107, the event monitoring server 115, and the terminal 117 according to the embodiment.
- these computers include a processor 201, a memory 202, a storage device 203, and a communication interface 204, which are connected to each other.
- the computer may include an input device 206 and an output device 207 if necessary.
- each server and the terminal were collectively demonstrated in FIG. 2, these computers do not necessarily need to be the same hardware. 1 are stored in the memory 202 or the storage device 203 (hereinafter collectively referred to as storage resources) and executed by the processor 201.
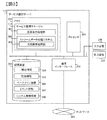
- FIG. 3 is a diagram showing information and programs stored in the storage resources of the computer shown in FIG.
- the service monitoring manager program 114 (hereinafter simply referred to as the service monitoring manager) is stored in the memory 202 and other information is stored in the storage device 203. However, if stored in a storage resource, each program and information May be stored in either.
- the service monitoring manager 114 includes a screen display processing unit 301 and a performance analysis processing unit 303.
- the storage device 203 stores configuration information 304, performance information 305, baseline information 306, event information 307, and system operation information 308.
- the input device and the output device are illustrated as separate devices. However, since a computer such as a smartphone or a tablet computer is also assumed to be used as a server or a terminal, the input device and the output device are assumed. One device may also serve as the device.
- FIG. 4 shows an example of the configuration and processing flow of the service monitoring manager 114 in the service monitoring server 113.
- the service monitoring manager 114 has a performance analysis processing unit 303 using the stream data processing system 302.
- the query repository 406 stores an execution code of each processing content of the performance analysis processing unit 303.
- the technique disclosed in Japanese Patent Laid-Open No. 2006-338432 is used. Use it.
- the present invention is not necessarily realized in Japanese Patent Laid-Open No. 2006-338432, and other implementation methods can be used as long as the baseline information 306, performance information 305, and event information 307 can be updated or created from the following input stream. May be.
- the stream data processing system 302 receives the service monitoring information stream 401 from the traffic monitoring server 111, the system monitoring information stream 402 from the Web system 101 or the system remote monitoring server 107, and the event monitoring information stream 403 from the event monitoring server 105. These input streams (monitoring information streams) 401 to 403 perform performance analysis processing using the query processing engine 405 via the stream data flow manager 404.
- the performance analysis processing unit 303 is executed in the order of a task identification process 410, an abnormality determination process 411, a similar event detection process 412, and a baseline setting process 413.
- a monitoring information stream with business information is generated by adding business information including the service and system of the configuration information 304 to the input streams (monitoring information streams) 401 to 403.
- the event information stream 407 with business information is stored in the event information 307.
- a service performance stream with business information within a predetermined time is subjected to statistical processing (calculating an average value, maximum value, minimum value, and variance value) for each service, and statistical
- the service performance information stream 408 including the determination result is determined by comparing the value with the service performance summary information of the baseline adoption date and time for each business service group of the baseline information 306, and determining whether the value is within the allowable range of the baseline. Stored in the performance information 305.
- the performance value of the system monitoring information stream with business information is compared with the server performance summary information of the monitoring items by agent of each host at the baseline adoption date for each business system of the baseline information 306, and the baseline permission It is determined whether it is within the range, and the system performance information stream 408 including the determination result is stored in the performance information 305.
- the event monitoring server 115 is notified.
- the similar event detection processing 412 is performed based on the event information 307, the event in the abnormal time zone related to the business, and the normal time adopted for the baseline.
- a band event is taken out and compared to detect a differential event that appears only when an abnormality occurs.
- the event information 307 is searched for whether there is an event similar to the difference event in the past events related to the business. If there is no similar event in the business, a system similar to the system configuration of the business is detected from the system operation information 308, and the event information on the business related to the similar system among the event information 307 is also searched.
- difference event information 407 and similar event information 407 are stored in event information 308.
- Baseline setting processing 413 performs statistical processing on service performance streams with business information within a predetermined time (for example, 1 hour) for each service group (calculates average value, maximum value, minimum value, and variance value). And stored in the baseline information 306.
- system performance information streams with business information within a predetermined time are statistically processed (average value, maximum value, minimum value, variance value) for each monitoring item for each agent of each host. Calculated) and stored in the baseline information 306.
- a predetermined time for example, 1 hour
- the date and time when the average value of throughput / min for each service group is close to the value of throughput / min in the past same time period stored in the baseline information 306 is detected.
- the baseline adoption date and time for each job in the next time zone is stored in the baseline information 306 as the next time zone on the detection date.
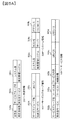
- FIG. 5A is a schematic diagram showing the configuration information 304.
- the configuration information 304 stores information about components including business groups included in the Web system (for example, component setting information and attribute information) and relationships between components (communication relationship, inclusion relationship, etc.).
- FIG. 5 shows that configuration information 502, service group information 503, system information 504, and service information 505 are included as examples included in the configuration information 304.
- the contents of the business information 502 are a business name 502a, a service group name 502b, and a system name 502c.
- the contents of the service group information 503 are a service group name 502b and a URI path 503a.
- the contents of the service information 505 are a service group name 502b, a service name 505a, a service content 505b, a URI path 505c, and a URI query 505d.
- the contents of the system information 504 are a system name 502c, a host name 504a, and an IP address 504b.
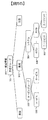
- FIG. 5B is a diagram showing a configuration example of the Web system.
- the business group 501 includes a plurality of business tasks 502.
- the business 502 includes a service group 503 and a system 504.
- the service group 503 includes a plurality of services 505.
- the system 504 includes a plurality of hosts 506.
- the host 506 is composed of a plurality of agents. Note that if a single monitoring system and Web system do not handle a plurality of tasks, there may be no task group. Similarly, a service group may not exist if a plurality of services are not provided.
- FIG. 6 shows a service monitoring information stream 401 and a service monitoring information stream 605 with business information which is an output result of the business identification processing 410.
- the service monitoring information stream 401 includes time 601, request information 602, response information 603, and response time 604.
- the contents of the request information 602 are a transmission source IP address 602a, a method 602b, a URI path 602c, and a URI query 602d.
- the contents of the response information 603 are an HTTP status code 603a and a transfer data amount 603b.
- the service monitoring information stream with business information includes a time 601, a business name 502a, a service group name 502b, service information 505, request information 602, response information 603, and a response time 604.
- the contents of the service information 505 are a service name 505a and service contents 505b.
- FIG. 7 shows a system monitoring information stream 402 and a system monitoring information stream 706 with business information as an output result of the business identification processing 410.
- the system monitoring information stream 402 includes time 701, host information 702, agent name 703, monitoring item 704, and performance value 705.
- the contents of the host information 702 are a host name 702a and an IP address 702b.
- the contents of the monitoring item 704 are a record name 704a and a field name 704b.
- the system monitoring information stream 706 with business information includes a time 701, a business name 502a, a system name 502c, host information 702, an agent name 703, a monitoring item 704, and a performance value 705.
- FIG. 8 shows an event monitoring information stream 403, a service event information stream with business information 407a and a system event information stream with business information 407b as output results of the business identification process 410.
- the event monitoring information stream 403 includes time 801, event information 802, object type 803, and object information 804.
- the contents of the event information 802 are a severity 802a, a registration time 802b, an event ID 802c, a source 802d, a message 802e, and an action 802f.
- the object type 803 is information for identifying the event issuer, and includes service information, system information, job information, and the like.
- the service event information stream 407a with business information includes a time 801, a business name 502a, a service group name 502b, service information 505, and event information 802.
- the system event information stream with business information 407b includes a time 801, a business name 502a, a system name 502c, host information 702, and event information 802.
- FIG. 9 shows an event information table 307a in the event information 307 that stores the event information stream 407 with business information, and a differential event that stores an event monitoring information stream with business information of the differential event and similar events in the similar event search processing 412. It is a table structure of the information table 307b and the similar event information table 307c.
- Each event information table 307a, 307b, 307c has the same table structure, and includes a time 801, a business name 502a, a service group name 502b, service information 505, a system name 502c, host information 702, and event information 802.
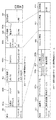
- FIG. 10 shows the service performance information in the performance information 306 that stores the service performance information stream 408a as a result of the baseline determination by obtaining the statistical value in the abnormality determination processing 411 for the service monitoring information stream 605 with business information. It is a table 305a.
- the service performance information stream 408a with business information includes a time 1001, a business name 502a, a service group name 502b, service information 505, a determination 1002, a response time statistical value 1003 per minute, a throughput accumulated value 1004 per minute, 1 It consists of an error rate cumulative value 1005 per minute.
- the contents of the service performance information table 305a include time 1001, service name 502a, service group name 502b, service information 505, determination 1002, response time statistical value 1003 per minute, throughput accumulated value 1004 per minute, 1 minute
- the accumulated error rate is 1005.
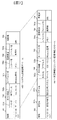
- FIG. 11 is a system performance information table 305b in the performance information 306 that stores the system performance information stream 408b as a result of the baseline determination in the abnormality determination processing 411 for the system monitoring information stream with business information 706.
- the system performance information stream 408b with business information includes a time 1101, a business name 502a, a system name 502c, host information 702, an agent name 703, a monitoring item 704, performance information 705, and a determination 1102.
- the contents of the system performance information table 305b are time 1101, business name 502a, system name 502c, host information 702, agent name 703, monitoring item 704, performance information 705, and determination 1102.
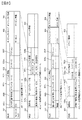
- FIG. 12 shows a service performance information stream with business information 408a.
- a baseline setting process 413 a statistical value of service performance is obtained for each service group in a predetermined time (for example, 1 hour).
- a service group baseline with business information that detects the day with the closest average throughput value per minute in the same time zone, and sets the next time zone on that detection date as the baseline adoption date for each job in the next time zone It is the service group performance summary information table 306a of the baseline information 306 that stores the information stream 409a.
- Service performance baseline information stream 409a with business information includes time 1201, business name 502a, service group name 502b, throughput (statistical value) 1202, error rate (statistical value) 1203, response time (statistical value) 1204, and baseline adoption.
- the contents of the service group performance summary information table 306a include time 1201, business name 502a, service group name 502b, throughput statistical value (1202), error rate (statistical value) 1203, response time (statistical value) 1204, baseline adoption date and time. 1205.
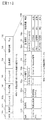
- FIG. 13 shows the performance value statistics for the monitoring item of the host agent in the system in a predetermined time (for example, 1 hour) in the baseline setting process 413 for the system performance information stream with business information 408b.
- the system baseline information stream 409b with business information includes a time 1301, a business name 502a, a system name 502c, host information 702, an agent name 703, a monitoring item 704, and a performance value (statistical value) 1302.
- the contents of the system performance summary information table 306b are time 1301, business name 502a, system name 502c, host information 702, agent name 703, monitoring item 704, and performance value (statistical value) 1302.
- FIG. 14 shows a service catalog table 1401 and a system operation information table 1402 included in the system operation information 308.
- the contents of the service catalog table 1401 include a system type 1403, a server specification 1404, an OS type 1405, a middleware type 1406, and a quantity 1407.
- the contents of the system operation information table 1402 include system name 502c, system type 1403, UP (User Program) information 1408, cumulative operation days 1409, number of alert occurrences 1410, number of failures 1411, average service performance information 1412 for a predetermined period, predetermined period Of the average system performance information 1413.
- the service catalog table 1401 is registered by a PaaS (Platform as a Service) provider.
- the system operation information table 1402 registers a system name 502c, a system type 1403 selected from the service catalog table 1401, and UP information 1408 at the time of system construction or renewal.
- the cumulative number of working days 1409, the number of alert occurrences 1410, and the number of failures 1411 are periodically registered and updated from separately managed incident management.
- the average service performance information 1412 for a predetermined period and the average system performance information 1413 for a predetermined period are periodically added and registered and updated from the performance information 305.
- the system operation information table 1402 is necessary to search for a system having the same system type 1403 as the target system, or to select a system having a long operation history or a similar operation among similar systems.
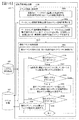
- FIG. 15 is a processing flow of the performance analysis processing unit 303.
- the performance analysis processing unit 303 performs processing in the order of a task identification process 410, an abnormality determination process 411, a similar event detection process 412, and a baseline setting process 413.
- the business identification process 410 includes a process 1501 for receiving a monitoring information stream and a process 1502 for adding business information to the monitoring information stream.
- the reception process 1501 receives new information of the monitoring information stream.
- event monitoring information stream when the object type is a service, the task related to the service group in the service information stored in the object information is acquired, and event monitoring information with a job type is created.
- event monitoring information with business type is stored in the event information 307.
- Abnormality determination processing 411 obtains statistical values (average, maximum, minimum, variance) of performance values for the service monitoring information stream with business type that arrives within a predetermined time, and creates a service performance information stream with business type Processing 1503 and the statistical value of the service performance information with business type is determined whether it exceeds the baseline, and the service performance information stream with business type is registered in the performance information 305, or the system monitoring information with business type The processing 1504 determines whether the performance value for the monitoring item of the agent in the host does not exceed the baseline, and registers the system performance information stream with business type in the performance information 305.
- Similar event detection processing 412 compares event information between normal time and abnormal time to detect a difference event, and searches for whether there is an event similar to the difference event in the past, event information comparison processing 1506 It consists of an event search process 1507.
- a process 1508 for creating performance summary information within a predetermined time is a service performance (response time, throughput, etc.) per unit time (for example, 1 minute) for each service group for each business. Then, a statistical value within a predetermined time (for example, 1 hour) is calculated to create service performance summary information. Also, the processing 1508 calculates a statistical value within a predetermined time (for example, 1 hour) of the performance value of the monitoring item for each agent of each host in the system, and creates system performance summary information. In the processing 1508, statistical values (maximum value, minimum value, average value) of performance information are accumulated every unit time (for example, 1 minute).
- a process 1509 for detecting a past statistical value close to a throughput statistical value within a predetermined time and determining a baseline for the next time zone is performed when the performance summary information for a predetermined time (for example, 1 hour) is accumulated.
- a predetermined time for example, 1 hour
- the closest date is found among the throughput statistics of the same business service group in the past same time zone, and is stored in the baseline information 306 as the baseline adoption date of the next time zone.
- FIG. 16 shows the flow of the similar event detection process 412.
- the similar event detection process 412 includes an event information comparison process 1506 and a similar event search process 1507.
- the event information comparison process 1506 is a process 1601 for acquiring event information within the most recent predetermined time including the baseline excess time, and a process 1602 for acquiring event information in the baseline adoption time period (normal time) for each business.
- the event ID is compared between the baseline excess time zone (abnormal) event and the baseline adoption time zone (normal) event, and a differential event that does not appear when normal but appears when abnormal is detected. Is stored in the event information 307.
- the similar event search process 1507 is a process 1604 for searching for a difference event (combination) that matches the event ID from past events of the same job, a suitability determination unit 1605 for the difference event, and a matching event is found.
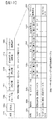
- FIG. 17 shows a monitoring screen 1700 when a baseline excess is detected as a result of baseline monitoring of services and related system performance for each business, and a differential event that does not appear at normal time is detected.
- the monitoring screen 1700 includes a business list display unit 1701, a display period designation unit 1702, a topology display unit 1703, a differential event list display unit 1704, and a graph display unit 1705.
- the business list display unit 1701 selects the business to be confirmed on the monitoring screen 1700.
- the display period designation unit 1702 designates the period
- the topology display unit 1703 confirms the service constituting the business and the operating status of the host in the system.
- the differential event list display unit 1704 displays events that appear only when there is an abnormality.
- the graph display unit 1705 confirms the performance trend of the abnormal part selected by the topology display unit 1703 and the occurrence status of the event selected by the difference event list within the period specified by the display period specifying unit 1702.
- the baseline of the response time of the day 1706 in which the event 2 occurs is The response time of the day 1707 with the closest number of accesses is taken as the baseline.
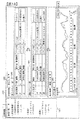
- a similar event is searched from past events related to a job having the same job or a similar system, and the search result is displayed in the similar event list 1804.
- the graph display unit 1805 compares the occurrence status and performance trend of similar events with the current time and the past, predicts the occurrence of a failure, and presents information that can be dealt with before the failure occurs.
- FIG. 19 is a diagram showing the configuration of the second embodiment. The difference from the first embodiment is that an incident management server 119 is added. In the incident management server 119, the incident management 120 program is stored in a storage resource and executed.
- FIG. 20 shows the configuration and processing flow when adding similar incident information to the configuration and processing flow of the service monitoring manager 114 in FIG. 4 in cooperation with the incident management 120 of the incident management server 119. It is.
- the similar event detection process 412 becomes an abnormality related to the business from the event information 307 when the service performance or the system operation performance exceeds the allowable range of the baseline.
- the difference event that appears only at the time of abnormality is detected by taking out and comparing the event in the normal time zone and the event in the normal time zone adopted for the baseline.
- incident management server 119 incident management 120, whether or not there is similar incident information in the incident information 2002 that has been registered based on the past events related to the business in question. Search for. If a similar incident is found as a result of the search, an incident information stream 2003 with business information is generated and stored in the similar incident information 2004.
- the incident information table 2102 includes a title 2108, an importance 2109, an incident ID 2110, a URL 2111 to the incident ID, a business name 502a, a service group name 502b, a system name 502c, an occurrence date 2112, and an event ID 2113 related to the incident.
- the incident search result output information 2103 has contents corresponding to the items in the incident information table 2102.
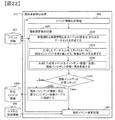
- FIG. 22 is a processing flow in which a similar fault search processing 2201 is added to the processing flow of the similar event detection processing 412 in FIG.
- the event information comparison process 1506 detects a differential event and stores it in the event information 307.
- the similar fault search processing 2201 searches whether there is an incident based on the related event similar to the difference event (combination).
- the similar fault search process 2201 generates a process 2202 that creates a data set including a search period, business information, and a difference event (combination), and generates a search command that uses the created data set as an input parameter and returns a similar incident as a return value.
- a process 2205 for determining whether or not a similar incident is found is performed. If a similar incident is found, a process 2206 for storing a similar incident information list in the similar incident information table is performed, and similar incident information is obtained. Store in 2004. If no incident is found, similar event search processing 1507 is executed.
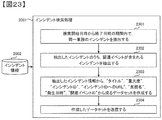
- FIG. 23 shows the flow of the incident search process 2001 in the incident management 120 in the incident management server 119.
- the incident search process 2001 includes a process 2301 for extracting incidents of the same business within the period from the search start date to the end date, a process 2302 for extracting incidents including related events from the extracted incidents, and an extracted incident A process 2303 for creating a data set including “title”, “severity”, “incident ID”, “URL to incident ID”, “business name”, “occurrence date / time”, and “related event ID” from the information; And processing 2304 for transmitting the created data set.
- FIG. 24 is a monitoring screen that is executed by the screen display processing unit 301 of the service monitoring manager 114 installed in the service monitoring server 113 and displayed on the Web browser 118 of the terminal 117.
- FIG. 24 is a monitoring screen 2400 that is a result of detecting a similar incident, unlike the monitoring screen 1800 that is a result of detecting a similar event with respect to a differential event in FIG.
- incident information 2407 is displayed in the incident screen 2406, and it can be determined whether or not an event that is currently occurring leads to a failure. Further, since the incident execution screen 2406 displays the contents entered by the service execution infrastructure administrator such as workarounds and solutions, the service execution infrastructure administrator can refer to the display information and trouble It is possible to deal with it before it occurs.
- the service performance that fluctuates indefinitely and the system internal processing such as the batch job that performs routine processing on a regular basis both are past performance information of similar usage conditions.
- it was difficult to find a baseline it finds a date that is close to the current throughput among the past service throughputs in the same time period. Now, you can find it accurately in a short time.
- the event transmitted from the event monitoring server 115 as a stream may be detected by the event monitoring server 115 when the event monitoring server 115 receives a message indicating the content of the event from the Web system 101.
- a method is also conceivable in which the event monitoring server 115 transmits a status acquisition request to the service execution base and performs event detection according to the received status.
- event detection may be realized by other methods.
Landscapes
- Engineering & Computer Science (AREA)
- General Engineering & Computer Science (AREA)
- Theoretical Computer Science (AREA)
- Computer Hardware Design (AREA)
- Quality & Reliability (AREA)
- General Physics & Mathematics (AREA)
- Physics & Mathematics (AREA)
- Computer Networks & Wireless Communication (AREA)
- Signal Processing (AREA)
- Computer Security & Cryptography (AREA)
- Data Mining & Analysis (AREA)
- Environmental & Geological Engineering (AREA)
- Computing Systems (AREA)
- Debugging And Monitoring (AREA)
Description
次に、所定時間内のスループット統計値と近い過去の統計値を検出して翌時間帯のベースラインを決定する処理1509は、所定時間(例えば1時間)分の性能要約情報が累積された時点で、同一業務のサービスグループの、過去同一時間帯のスループット統計値のうち、最も近い日にちを見つけて、翌時間帯のベースライン採用日として、ベースライン情報306に格納する。
Claims (15)
- 複数のコンポーネントを含み、前記コンポーネントを用いて所定のサービスを提供するサービス実行基盤と通信可能な通信インターフェースと、
記憶資源と、
前記サービス実行基盤から、前記所定のサービスの監視値であるサービス監視ストリームと、前記コンポーネントの監視値であるコンポーネント監視ストリームと、を受信処理するプロセッサと、
を有する監視システムであって、
前記プロセッサは、
(A)過去の所定の時間帯のコンポーネント監視ストリームに基づいてコンポーネントベースラインを作成し、
(B)過去の所定の時間帯のサービス測定ストリームの統計値を計算し、
(C)前記作成したコンポーネントベースラインを、前記所定の時間帯及び(B)で計算した統計値と対応付けて前記記憶資源に格納し、
(D)前記コンポーネントベースライン作成後、サービス監視ストリーム及びコンポーネント監視ストリームを新たに受信したら、当該新規受信したサービス監視ストリームに適するコンポーネントベースラインを選択し、前記選択したコンポーネントベースラインを基準に当該新規受信したコンポーネント監視ストリームの異常を判断する、
を処理する監視システム。 - 請求項1記載の監視システムであって、
前記監視システムは表示装置を有し、
前記プロセッサは、
前記新規受信したサービス監視値と、
前記新規受信したコンポーネント監視値と、
前記選択したコンポーネントベースラインと、
を前記表示装置に表示させる、
監視システム。 - 請求項2記載の監視システムであって、
前記プロセッサは、
(E)前記サービス実行基盤のイベントを検知し、検知した時間と共に記憶資源に格納し、
(F)(D)にて異常と判断した場合、(D)のコンポーネントベースラインに対応付けられた前記所定の時間帯を取得し、取得した時間帯内に検知したイベントを選択し、
(G)選択したイベントに基づいて、前記所定の時間帯では検知してなかった直近から所定期間前までのイベントを選択し、
(H)(G)で選択したイベントの内容を表示する、
監視システム。 - 請求項3記載の監視システムであって、
前記プロセッサは、
(I)(G)で選択したイベントを過去のイベントから検索することで、類似するイベントを当該類似イベントの検知時間と共に表示する、
監視システム。 - 請求項4記載の監視システムであって、
前記検索対象となる過去のイベントには、システム構成上類似する他のサービス実行基盤のイベントも含まれる、
監視システム。 - 請求項3記載の監視システムであって、
前記プロセッサは、
(J)(G)で選択したイベントをインシデント情報に含まれるイベントと比較することで、前記直近から所定期間前までに新たに検知したイベントに関連する可能性があるインシデントの内容を表示する、
監視システム。 - 複数のコンポーネントを含み、前記コンポーネントを用いて所定のサービスを提供するサービス実行基盤を監視する監視システムで実行する監視プログラムであって、
前記監視プログラムは、
前記サービス実行基盤から、前記所定のサービスの監視値であるサービス監視ストリームと、前記コンポーネントの監視値であるコンポーネント監視ストリームと、を受信し、
(A)過去の所定の時間帯のコンポーネント監視ストリームに基づいてコンポーネントベースラインを作成し、
(B)過去の所定の時間帯のサービス測定ストリームの統計値を計算し、
(C)前記作成したコンポーネントベースラインを、前記所定の時間帯及び(B)で計算した統計値と対応付けて前記監視システムの記憶資源に格納し、
(D)前記コンポーネントベースライン作成後、サービス監視ストリーム及びコンポーネント監視ストリームを新たに受信したら、当該新規受信したサービス監視ストリームに適するコンポーネントベースラインを選択し、前記選択したコンポーネントベースラインを基準に当該新規受信したコンポーネント監視ストリームの異常を判断する、
ステップを含む監視プログラム。 - 請求項7記載の監視プログラムであって、
前記監視プログラムは、
前記新規受信したサービス監視値と、
前記新規受信したコンポーネント監視値と、
前記選択したコンポーネントベースラインと、
を前記監視システムの表示装置に表示させる、
ステップを含む監視プログラム。 - 請求項8記載の監視プログラムであって、
前記監視プログラムは、
(E)前記サービス実行基盤のイベントを検知し、検知した時間と共に記憶資源に格納し、
(F)(D)にて異常と判断した場合、(D)のコンポーネントベースラインに対応付けられた前記所定の時間帯を取得し、取得した時間帯内に検知したイベントを選択し、
(G)選択したイベントに基づいて、前記所定の時間帯では検知してなかった直近から所定期間前までのイベントを選択し、
(H)(G)で選択したイベントの内容を表示する、
ステップを含む監視プログラム。 - 請求項9記載の監視プログラムであって、
前記監視プログラムは、
(I)(G)で選択したイベントを過去のイベントから検索することで、類似するイベントを当該類似イベントの検知時間と共に表示する、
ステップを含む監視プログラム。 - 請求項10記載の監視プログラムであって、
前記検索対象となる過去のイベントには、システム構成上類似する他のサービス実行基盤のイベントも含まれる、
監視プログラム。 - 請求項9記載の監視プログラムであって、
前記監視プログラムは、
(J)(G)で選択したイベントをインシデント情報に含まれるイベントと比較することで、前記直近から所定期間前までに新たに検知したイベントに関連する可能性があるインシデントの内容を表示する、
ステップを含む監視プログラム。 - 請求項3記載の監視システムであって、
前記イベントの検知とは、
前記監視システムが前記サービス実行基盤からイベントの内容を記した情報を受信すること、
または
前記サービス実行基盤の状態を取得することで、前記監視システムが前記サービス実行基盤にてイベントが発生したと判断する、
ことを特徴とする監視システム。 - 請求項9記載の監視プログラムであって、
前記イベントの検知とは、
前記監視システムが前記サービス実行基盤からイベントの内容を記した情報を受信すること、
または
前記サービス実行基盤の状態を取得することで、前記監視システムが前記サービス実行基盤にてイベントが発生したと判断する、
ことを特徴とする監視プログラム。 - 複数のコンポーネントを含み、前記コンポーネントを用いて所定のサービスを提供するサービス実行基盤と、
前記サービス実行基盤の監視値を含む監視ストリームを受信処理する監視システムと、
を有するシステムであって、
前記監視システムは、
(1)前記サービス実行基盤のイベントを検知し、検知した時間と共に記憶資源に格納し、
(2)過去の監視ストリームに基づいてベースラインを作成し、
(3)前記作成したベースラインを、基となった前記過去の監視ストリームの時間帯と関連付けて前記記憶資源に格納し、
(4)前記ベースライン作成後、監視ストリームを新たに受信したら、前記ベースラインを基準に当該新規受信した監視ストリームの異常を判断し、
(5)(4)にて異常と判断した場合、(4)のベースラインに対応付けられた時間帯を取得し、取得した時間帯内に検知したイベントを選択し、
(6)選択したイベントに基づいて、前記取得した時間帯では検知してなかった直近から所定期間前までのイベントを選択し、
(7)(G)で選択したイベントの内容を表示する、
システム。
Priority Applications (3)
| Application Number | Priority Date | Filing Date | Title |
|---|---|---|---|
| JP2014532665A JP5914669B2 (ja) | 2012-08-31 | 2012-08-31 | サービス性能監視方法 |
| PCT/JP2012/072097 WO2014033894A1 (ja) | 2012-08-31 | 2012-08-31 | サービス性能監視方法 |
| US14/400,499 US9509706B2 (en) | 2012-08-31 | 2012-08-31 | Service performance monitoring method |
Applications Claiming Priority (1)
| Application Number | Priority Date | Filing Date | Title |
|---|---|---|---|
| PCT/JP2012/072097 WO2014033894A1 (ja) | 2012-08-31 | 2012-08-31 | サービス性能監視方法 |
Publications (1)
| Publication Number | Publication Date |
|---|---|
| WO2014033894A1 true WO2014033894A1 (ja) | 2014-03-06 |
Family
ID=50182742
Family Applications (1)
| Application Number | Title | Priority Date | Filing Date |
|---|---|---|---|
| PCT/JP2012/072097 Ceased WO2014033894A1 (ja) | 2012-08-31 | 2012-08-31 | サービス性能監視方法 |
Country Status (3)
| Country | Link |
|---|---|
| US (1) | US9509706B2 (ja) |
| JP (1) | JP5914669B2 (ja) |
| WO (1) | WO2014033894A1 (ja) |
Cited By (1)
| Publication number | Priority date | Publication date | Assignee | Title |
|---|---|---|---|---|
| JP2021060733A (ja) * | 2019-10-04 | 2021-04-15 | 富士ゼロックス株式会社 | 監視装置及び監視プログラム |
Families Citing this family (75)
| Publication number | Priority date | Publication date | Assignee | Title |
|---|---|---|---|---|
| US10324779B1 (en) * | 2013-06-21 | 2019-06-18 | Amazon Technologies, Inc. | Using unsupervised learning to monitor changes in fleet behavior |
| US10255124B1 (en) | 2013-06-21 | 2019-04-09 | Amazon Technologies, Inc. | Determining abnormal conditions of host state from log files through Markov modeling |
| DE112016002999T5 (de) * | 2015-07-01 | 2018-03-15 | Mitsubishi Electric Corporation | Anomalie-detektionssystem für verteilte ausrüstungen |
| US10482231B1 (en) * | 2015-09-22 | 2019-11-19 | Amazon Technologies, Inc. | Context-based access controls |
| US9509710B1 (en) * | 2015-11-24 | 2016-11-29 | International Business Machines Corporation | Analyzing real-time streams of time-series data |
| US10504026B2 (en) | 2015-12-01 | 2019-12-10 | Microsoft Technology Licensing, Llc | Statistical detection of site speed performance anomalies |
| US10263833B2 (en) | 2015-12-01 | 2019-04-16 | Microsoft Technology Licensing, Llc | Root cause investigation of site speed performance anomalies |
| US10171335B2 (en) * | 2015-12-01 | 2019-01-01 | Microsoft Technology Licensing, Llc | Analysis of site speed performance anomalies caused by server-side issues |
| JP6622581B2 (ja) * | 2015-12-11 | 2019-12-18 | キヤノン株式会社 | 情報提示方法及び装置 |
| CN105391602B (zh) * | 2015-12-15 | 2019-02-26 | 北京奇虎科技有限公司 | 一种数据采集测试方法和装置 |
| EP3403187A4 (en) * | 2016-01-14 | 2019-07-31 | Sumo Logic | SINGLE CLICK DELTA ANALYSIS |
| US10708155B2 (en) * | 2016-06-03 | 2020-07-07 | Guavus, Inc. | Systems and methods for managing network operations |
| CN106250290A (zh) * | 2016-08-03 | 2016-12-21 | 广州唯品会信息科技有限公司 | 异常信息的分析方法及装置 |
| US10797964B2 (en) * | 2016-11-26 | 2020-10-06 | Amazon Technologies, Inc. | System event notification service |
| US11973784B1 (en) | 2017-11-27 | 2024-04-30 | Lacework, Inc. | Natural language interface for an anomaly detection framework |
| US11785104B2 (en) | 2017-11-27 | 2023-10-10 | Lacework, Inc. | Learning from similar cloud deployments |
| US12058160B1 (en) | 2017-11-22 | 2024-08-06 | Lacework, Inc. | Generating computer code for remediating detected events |
| US12457231B1 (en) | 2017-11-27 | 2025-10-28 | Fortinet, Inc. | Initiating and utilizing pedigree for content |
| US12348545B1 (en) | 2017-11-27 | 2025-07-01 | Fortinet, Inc. | Customizable generative artificial intelligence (‘AI’) assistant |
| US12401669B1 (en) | 2017-11-27 | 2025-08-26 | Fortinet, Inc. | Container vulnerability management by a data platform |
| US12034754B2 (en) | 2017-11-27 | 2024-07-09 | Lacework, Inc. | Using static analysis for vulnerability detection |
| US12549577B1 (en) | 2017-11-27 | 2026-02-10 | Fortinet, Inc. | Tracking and relating discovered security issues over time |
| US11792284B1 (en) | 2017-11-27 | 2023-10-17 | Lacework, Inc. | Using data transformations for monitoring a cloud compute environment |
| US12095796B1 (en) | 2017-11-27 | 2024-09-17 | Lacework, Inc. | Instruction-level threat assessment |
| US12284197B1 (en) | 2017-11-27 | 2025-04-22 | Fortinet, Inc. | Reducing amounts of data ingested into a data warehouse |
| US12580932B1 (en) | 2017-11-27 | 2026-03-17 | Fortinet, Inc. | Customer onboarding and integration with anomaly detection systems |
| US11741238B2 (en) | 2017-11-27 | 2023-08-29 | Lacework, Inc. | Dynamically generating monitoring tools for software applications |
| US20220232024A1 (en) | 2017-11-27 | 2022-07-21 | Lacework, Inc. | Detecting deviations from typical user behavior |
| US12463996B1 (en) | 2017-11-27 | 2025-11-04 | Fortinet, Inc. | Risk engine that utilizes key performance indicators |
| US12452272B1 (en) | 2017-11-27 | 2025-10-21 | Fortinet, Inc. | Reducing resource consumption spikes in an anomaly detection framework |
| US12309236B1 (en) | 2017-11-27 | 2025-05-20 | Fortinet, Inc. | Analyzing log data from multiple sources across computing environments |
| US12368745B1 (en) | 2017-11-27 | 2025-07-22 | Fortinet, Inc. | Using natural language queries to conduct an investigation of a monitored system |
| US12511110B1 (en) | 2017-11-27 | 2025-12-30 | Fortinet, Inc. | Development and distribution of components for an anomaly detection framework |
| US12126643B1 (en) | 2017-11-27 | 2024-10-22 | Fortinet, Inc. | Leveraging generative artificial intelligence (‘AI’) for securing a monitored deployment |
| US12407701B1 (en) | 2017-11-27 | 2025-09-02 | Fortinet, Inc. | Community-based generation of policies for a data platform |
| US12381901B1 (en) | 2017-11-27 | 2025-08-05 | Fortinet, Inc. | Unified storage for event streams in an anomaly detection framework |
| US10425437B1 (en) * | 2017-11-27 | 2019-09-24 | Lacework Inc. | Extended user session tracking |
| US12407702B1 (en) | 2017-11-27 | 2025-09-02 | Fortinet, Inc. | Gathering and presenting information related to common vulnerabilities and exposures |
| US12580935B1 (en) | 2017-11-27 | 2026-03-17 | Fortinet, Inc. | Scoring of events in an edge-based data platform |
| US12355793B1 (en) | 2017-11-27 | 2025-07-08 | Fortinet, Inc. | Guided interactions with a natural language interface |
| US12613930B1 (en) | 2017-11-27 | 2026-04-28 | Fortinet, Inc. | Ensuring exactly once data ingestion |
| US12537836B1 (en) | 2017-11-27 | 2026-01-27 | Fortinet, Inc. | Risk scoring based on entity correlation |
| US12309185B1 (en) | 2017-11-27 | 2025-05-20 | Fortinet, Inc. | Architecture for a generative artificial intelligence (AI)-enabled assistant |
| US12463995B1 (en) | 2017-11-27 | 2025-11-04 | Fortinet, Inc. | Tiered risk engine with user cohorts |
| US11770398B1 (en) | 2017-11-27 | 2023-09-26 | Lacework, Inc. | Guided anomaly detection framework |
| US12267345B1 (en) | 2017-11-27 | 2025-04-01 | Fortinet, Inc. | Using user feedback for attack path analysis in an anomaly detection framework |
| US12355626B1 (en) | 2017-11-27 | 2025-07-08 | Fortinet, Inc. | Tracking infrastructure as code (IaC) asset lifecycles |
| US12323449B1 (en) | 2017-11-27 | 2025-06-03 | Fortinet, Inc. | Code analysis feedback loop for code created using generative artificial intelligence (‘AI’) |
| US12463994B1 (en) | 2017-11-27 | 2025-11-04 | Fortinet, Inc. | Handling of certificates by intermediate actors |
| US20220224707A1 (en) | 2017-11-27 | 2022-07-14 | Lacework, Inc. | Establishing a location profile for a user device |
| US12549575B1 (en) | 2017-11-27 | 2026-02-10 | Fortinet, Inc. | Determining user risk based on user posture and activity |
| US11979422B1 (en) | 2017-11-27 | 2024-05-07 | Lacework, Inc. | Elastic privileges in a secure access service edge |
| US12526297B2 (en) | 2017-11-27 | 2026-01-13 | Fortinet, Inc. | Annotating changes in software across computing environments |
| US11765249B2 (en) | 2017-11-27 | 2023-09-19 | Lacework, Inc. | Facilitating developer efficiency and application quality |
| US20220232025A1 (en) | 2017-11-27 | 2022-07-21 | Lacework, Inc. | Detecting anomalous behavior of a device |
| US12563071B1 (en) | 2017-11-27 | 2026-02-24 | Fortinet, Inc. | Using generative artificial intelligence to interface with a knowledge graph |
| US12418555B1 (en) | 2017-11-27 | 2025-09-16 | Fortinet Inc. | Guiding query creation for a generative artificial intelligence (AI)-enabled assistant |
| US12495052B1 (en) | 2017-11-27 | 2025-12-09 | Fortinet, Inc. | Detecting package execution for threat assessments |
| US12335348B1 (en) | 2017-11-27 | 2025-06-17 | Fortinet, Inc. | Optimizing data warehouse utilization by a data ingestion pipeline |
| US11894984B2 (en) | 2017-11-27 | 2024-02-06 | Lacework, Inc. | Configuring cloud deployments based on learnings obtained by monitoring other cloud deployments |
| US11849000B2 (en) | 2017-11-27 | 2023-12-19 | Lacework, Inc. | Using real-time monitoring to inform static analysis |
| US12130878B1 (en) | 2017-11-27 | 2024-10-29 | Fortinet, Inc. | Deduplication of monitored communications data in a cloud environment |
| US12309182B1 (en) | 2017-11-27 | 2025-05-20 | Fortinet, Inc. | Customer onboarding and integration with anomaly detection systems |
| US12598205B1 (en) | 2017-11-27 | 2026-04-07 | Fortinet, Inc. | Browser-based detection of data exfiltration |
| US12563064B2 (en) | 2017-11-27 | 2026-02-24 | Fortinet, Inc. | Distinguishing user-initiated activity from application-initiated activity |
| US12489771B1 (en) | 2017-11-27 | 2025-12-02 | Fortinet, Inc. | Detecting anomalous behavior of nodes in a hierarchical cloud deployment |
| US11818156B1 (en) | 2017-11-27 | 2023-11-14 | Lacework, Inc. | Data lake-enabled security platform |
| US12261866B1 (en) | 2017-11-27 | 2025-03-25 | Fortinet, Inc. | Time series anomaly detection |
| US12556559B1 (en) | 2018-03-30 | 2026-02-17 | Fortinet, Inc. | Providing generative artificial intelligence (AI)-enabled notebook interfaces for a security framework |
| CN108667688A (zh) * | 2018-04-19 | 2018-10-16 | 北京搜狐新媒体信息技术有限公司 | 一种数据监控方法及装置 |
| US11201955B1 (en) | 2019-12-23 | 2021-12-14 | Lacework Inc. | Agent networking in a containerized environment |
| US11256759B1 (en) | 2019-12-23 | 2022-02-22 | Lacework Inc. | Hierarchical graph analysis |
| US11171853B2 (en) * | 2020-01-30 | 2021-11-09 | Ciena Corporation | Constraint-based event-driven telemetry |
| US11403157B1 (en) * | 2020-01-31 | 2022-08-02 | Splunk Inc. | Identifying a root cause of an error |
| EP4266179A1 (en) | 2022-02-16 | 2023-10-25 | Nokia Technologies Oy | Metrics in distributed computing |
Citations (3)
| Publication number | Priority date | Publication date | Assignee | Title |
|---|---|---|---|---|
| JP2001142746A (ja) * | 1999-11-11 | 2001-05-25 | Nec Software Chubu Ltd | 計算機システムの負荷監視装置 |
| JP2005316808A (ja) * | 2004-04-30 | 2005-11-10 | Nec Software Chubu Ltd | 性能監視装置および性能監視方法並びにプログラム |
| JP2011034208A (ja) * | 2009-07-30 | 2011-02-17 | Hitachi Ltd | 異常検出方法、装置、及びプログラム |
Family Cites Families (7)
| Publication number | Priority date | Publication date | Assignee | Title |
|---|---|---|---|---|
| US20020093527A1 (en) * | 2000-06-16 | 2002-07-18 | Sherlock Kieran G. | User interface for a security policy system and method |
| US7917647B2 (en) * | 2000-06-16 | 2011-03-29 | Mcafee, Inc. | Method and apparatus for rate limiting |
| US7287278B2 (en) * | 2003-08-29 | 2007-10-23 | Trend Micro, Inc. | Innoculation of computing devices against a selected computer virus |
| US6885907B1 (en) * | 2004-05-27 | 2005-04-26 | Dofasco Inc. | Real-time system and method of monitoring transient operations in continuous casting process for breakout prevention |
| CN102393735B (zh) * | 2005-04-04 | 2014-07-09 | 费舍-柔斯芒特系统股份有限公司 | 一种用于处理加工厂中收集的与过程参数有关的数据的方法 |
| US7760861B1 (en) * | 2005-10-31 | 2010-07-20 | At&T Intellectual Property Ii, L.P. | Method and apparatus for monitoring service usage in a communications network |
| US9037922B1 (en) * | 2012-05-01 | 2015-05-19 | Amazon Technololgies, Inc. | Monitoring and analysis of operating states in a computing environment |
-
2012
- 2012-08-31 US US14/400,499 patent/US9509706B2/en active Active
- 2012-08-31 WO PCT/JP2012/072097 patent/WO2014033894A1/ja not_active Ceased
- 2012-08-31 JP JP2014532665A patent/JP5914669B2/ja active Active
Patent Citations (3)
| Publication number | Priority date | Publication date | Assignee | Title |
|---|---|---|---|---|
| JP2001142746A (ja) * | 1999-11-11 | 2001-05-25 | Nec Software Chubu Ltd | 計算機システムの負荷監視装置 |
| JP2005316808A (ja) * | 2004-04-30 | 2005-11-10 | Nec Software Chubu Ltd | 性能監視装置および性能監視方法並びにプログラム |
| JP2011034208A (ja) * | 2009-07-30 | 2011-02-17 | Hitachi Ltd | 異常検出方法、装置、及びプログラム |
Cited By (2)
| Publication number | Priority date | Publication date | Assignee | Title |
|---|---|---|---|---|
| JP2021060733A (ja) * | 2019-10-04 | 2021-04-15 | 富士ゼロックス株式会社 | 監視装置及び監視プログラム |
| JP7367441B2 (ja) | 2019-10-04 | 2023-10-24 | 富士フイルムビジネスイノベーション株式会社 | 監視装置及び監視プログラム |
Also Published As
| Publication number | Publication date |
|---|---|
| JPWO2014033894A1 (ja) | 2016-08-08 |
| US9509706B2 (en) | 2016-11-29 |
| JP5914669B2 (ja) | 2016-05-11 |
| US20150135312A1 (en) | 2015-05-14 |
Similar Documents
| Publication | Publication Date | Title |
|---|---|---|
| JP5914669B2 (ja) | サービス性能監視方法 | |
| JP5416833B2 (ja) | 性能監視装置,方法,プログラム | |
| JP5546686B2 (ja) | 監視システム、及び監視方法 | |
| US20120030346A1 (en) | Method for inferring extent of impact of configuration change event on system failure | |
| US9514387B2 (en) | System and method of monitoring and measuring cluster performance hosted by an IAAS provider by means of outlier detection | |
| US9021077B2 (en) | Management computer and method for root cause analysis | |
| EP2874064B1 (en) | Adaptive metric collection, storage, and alert thresholds | |
| US20160378583A1 (en) | Management computer and method for evaluating performance threshold value | |
| US20150120914A1 (en) | Service monitoring system and service monitoring method | |
| KR101971013B1 (ko) | 빅데이터 기반의 클라우드 인프라 실시간 분석 시스템 및 그 제공방법 | |
| US20130036214A1 (en) | System and method for managing environment configuration using snapshots | |
| US9692654B2 (en) | Systems and methods for correlating derived metrics for system activity | |
| US9705772B2 (en) | Identification apparatus, identification method and identification program | |
| JP2013054402A (ja) | 運用監視装置、運用監視プログラム及び記録媒体 | |
| US9021078B2 (en) | Management method and management system | |
| US9645877B2 (en) | Monitoring apparatus, monitoring method, and recording medium | |
| US7734769B2 (en) | Monitoring system of apparatuses connected in a network, monitoring apparatus, monitoring method and program | |
| JP2012181744A (ja) | 分散ファイルシステムにおける運用監視システム及び運用監視方法 | |
| JP2018190205A (ja) | 事業者間一括サービス管理装置および事業者間一括サービス管理方法 | |
| EP3798955A1 (en) | Management of tickets and resolution processes for an industrial automation environment | |
| US20220414618A1 (en) | Management and aggregation of ticket data from multiple sources | |
| JP7167749B2 (ja) | 情報処理装置、情報処理システム、及び情報処理プログラム | |
| CN119149341A (zh) | 一种MongoDB数据库集群实例的监控方法以及装置 | |
| JP5624683B2 (ja) | 管理サーバ、管理システム、および、管理方法 |
Legal Events
| Date | Code | Title | Description |
|---|---|---|---|
| 121 | Ep: the epo has been informed by wipo that ep was designated in this application |
Ref document number: 12883862 Country of ref document: EP Kind code of ref document: A1 |
|
| WWE | Wipo information: entry into national phase |
Ref document number: 14400499 Country of ref document: US |
|
| ENP | Entry into the national phase |
Ref document number: 2014532665 Country of ref document: JP Kind code of ref document: A |
|
| NENP | Non-entry into the national phase |
Ref country code: DE |
|
| 122 | Ep: pct application non-entry in european phase |
Ref document number: 12883862 Country of ref document: EP Kind code of ref document: A1 |