US11792284B1 - Using data transformations for monitoring a cloud compute environment - Google Patents
Using data transformations for monitoring a cloud compute environment Download PDFInfo
- Publication number
- US11792284B1 US11792284B1 US17/589,361 US202217589361A US11792284B1 US 11792284 B1 US11792284 B1 US 11792284B1 US 202217589361 A US202217589361 A US 202217589361A US 11792284 B1 US11792284 B1 US 11792284B1
- Authority
- US
- United States
- Prior art keywords
- data
- user
- destination address
- address
- data packet
- Prior art date
- Legal status (The legal status is an assumption and is not a legal conclusion. Google has not performed a legal analysis and makes no representation as to the accuracy of the status listed.)
- Active
Links
- 238000012544 monitoring process Methods 0.000 title claims abstract description 64
- 238000013501 data transformation Methods 0.000 title description 2
- 238000000034 method Methods 0.000 claims abstract description 485
- 238000004590 computer program Methods 0.000 claims description 16
- 230000008569 process Effects 0.000 description 433
- 239000003795 chemical substances by application Substances 0.000 description 236
- 230000006399 behavior Effects 0.000 description 94
- 230000000694 effects Effects 0.000 description 89
- 238000004891 communication Methods 0.000 description 79
- 238000012545 processing Methods 0.000 description 43
- 230000008859 change Effects 0.000 description 39
- 238000013459 approach Methods 0.000 description 37
- 238000003860 storage Methods 0.000 description 36
- 230000009471 action Effects 0.000 description 22
- 238000004458 analytical method Methods 0.000 description 19
- 230000000875 corresponding effect Effects 0.000 description 19
- 230000001186 cumulative effect Effects 0.000 description 19
- 239000008186 active pharmaceutical agent Substances 0.000 description 18
- ZPUCINDJVBIVPJ-LJISPDSOSA-N cocaine Chemical compound O([C@H]1C[C@@H]2CC[C@@H](N2C)[C@H]1C(=O)OC)C(=O)C1=CC=CC=C1 ZPUCINDJVBIVPJ-LJISPDSOSA-N 0.000 description 16
- 230000006870 function Effects 0.000 description 16
- 230000002547 anomalous effect Effects 0.000 description 15
- 238000007726 management method Methods 0.000 description 14
- 238000001514 detection method Methods 0.000 description 13
- 230000003993 interaction Effects 0.000 description 13
- 230000037406 food intake Effects 0.000 description 12
- 238000005516 engineering process Methods 0.000 description 11
- 230000007246 mechanism Effects 0.000 description 11
- 230000004044 response Effects 0.000 description 11
- 238000013515 script Methods 0.000 description 11
- 241000533950 Leucojum Species 0.000 description 10
- 238000012800 visualization Methods 0.000 description 10
- 230000032297 kinesis Effects 0.000 description 9
- 238000012986 modification Methods 0.000 description 9
- 230000004048 modification Effects 0.000 description 9
- 230000009286 beneficial effect Effects 0.000 description 8
- 238000010801 machine learning Methods 0.000 description 8
- 238000012517 data analytics Methods 0.000 description 7
- 230000014509 gene expression Effects 0.000 description 7
- 238000005304 joining Methods 0.000 description 7
- 238000013507 mapping Methods 0.000 description 7
- 230000004224 protection Effects 0.000 description 7
- 230000002441 reversible effect Effects 0.000 description 7
- 230000008901 benefit Effects 0.000 description 6
- 238000013480 data collection Methods 0.000 description 6
- 230000007774 longterm Effects 0.000 description 6
- 239000000203 mixture Substances 0.000 description 6
- 230000008520 organization Effects 0.000 description 6
- 238000005067 remediation Methods 0.000 description 6
- 238000005070 sampling Methods 0.000 description 6
- 238000013499 data model Methods 0.000 description 5
- 238000013500 data storage Methods 0.000 description 5
- 238000001914 filtration Methods 0.000 description 5
- 230000002452 interceptive effect Effects 0.000 description 5
- 238000011835 investigation Methods 0.000 description 5
- 230000003068 static effect Effects 0.000 description 5
- 230000002776 aggregation Effects 0.000 description 4
- 238000004220 aggregation Methods 0.000 description 4
- 238000012550 audit Methods 0.000 description 4
- 230000003542 behavioural effect Effects 0.000 description 4
- 230000002085 persistent effect Effects 0.000 description 4
- 238000012913 prioritisation Methods 0.000 description 4
- 230000002829 reductive effect Effects 0.000 description 4
- 238000012546 transfer Methods 0.000 description 4
- 238000013475 authorization Methods 0.000 description 3
- 238000009826 distribution Methods 0.000 description 3
- 238000003780 insertion Methods 0.000 description 3
- 230000037431 insertion Effects 0.000 description 3
- 238000005457 optimization Methods 0.000 description 3
- 230000000737 periodic effect Effects 0.000 description 3
- 238000007637 random forest analysis Methods 0.000 description 3
- 230000009467 reduction Effects 0.000 description 3
- 230000001105 regulatory effect Effects 0.000 description 3
- 230000009466 transformation Effects 0.000 description 3
- 238000000844 transformation Methods 0.000 description 3
- 102100035606 Beta-casein Human genes 0.000 description 2
- 101000947120 Homo sapiens Beta-casein Proteins 0.000 description 2
- 230000001010 compromised effect Effects 0.000 description 2
- 238000010276 construction Methods 0.000 description 2
- 230000001419 dependent effect Effects 0.000 description 2
- 238000013461 design Methods 0.000 description 2
- 238000011161 development Methods 0.000 description 2
- 239000000284 extract Substances 0.000 description 2
- 230000036541 health Effects 0.000 description 2
- 208000018910 keratinopathic ichthyosis Diseases 0.000 description 2
- 238000002372 labelling Methods 0.000 description 2
- 230000000670 limiting effect Effects 0.000 description 2
- 238000012423 maintenance Methods 0.000 description 2
- 238000003058 natural language processing Methods 0.000 description 2
- 230000006855 networking Effects 0.000 description 2
- 230000002265 prevention Effects 0.000 description 2
- 238000011084 recovery Methods 0.000 description 2
- 210000000225 synapse Anatomy 0.000 description 2
- 230000007704 transition Effects 0.000 description 2
- 241000322338 Loeseliastrum Species 0.000 description 1
- 241000700605 Viruses Species 0.000 description 1
- 238000011949 advanced processing technology Methods 0.000 description 1
- 230000004931 aggregating effect Effects 0.000 description 1
- 238000013473 artificial intelligence Methods 0.000 description 1
- 230000001174 ascending effect Effects 0.000 description 1
- 238000013474 audit trail Methods 0.000 description 1
- 230000003190 augmentative effect Effects 0.000 description 1
- 238000003339 best practice Methods 0.000 description 1
- 210000004081 cilia Anatomy 0.000 description 1
- 239000003086 colorant Substances 0.000 description 1
- 230000006835 compression Effects 0.000 description 1
- 238000007906 compression Methods 0.000 description 1
- 235000014510 cooky Nutrition 0.000 description 1
- 230000002596 correlated effect Effects 0.000 description 1
- 238000007405 data analysis Methods 0.000 description 1
- 238000013079 data visualisation Methods 0.000 description 1
- 230000003247 decreasing effect Effects 0.000 description 1
- 230000007547 defect Effects 0.000 description 1
- 230000002950 deficient Effects 0.000 description 1
- 238000009795 derivation Methods 0.000 description 1
- 230000001747 exhibiting effect Effects 0.000 description 1
- 238000000605 extraction Methods 0.000 description 1
- 239000004744 fabric Substances 0.000 description 1
- 238000004374 forensic analysis Methods 0.000 description 1
- PCHJSUWPFVWCPO-UHFFFAOYSA-N gold Chemical compound [Au] PCHJSUWPFVWCPO-UHFFFAOYSA-N 0.000 description 1
- 230000003116 impacting effect Effects 0.000 description 1
- 230000008595 infiltration Effects 0.000 description 1
- 238000001764 infiltration Methods 0.000 description 1
- 239000003999 initiator Substances 0.000 description 1
- 238000009434 installation Methods 0.000 description 1
- 230000010354 integration Effects 0.000 description 1
- 238000002955 isolation Methods 0.000 description 1
- 238000011068 loading method Methods 0.000 description 1
- 230000014759 maintenance of location Effects 0.000 description 1
- 239000000463 material Substances 0.000 description 1
- 239000002184 metal Substances 0.000 description 1
- 230000003287 optical effect Effects 0.000 description 1
- 230000036961 partial effect Effects 0.000 description 1
- 230000035515 penetration Effects 0.000 description 1
- 238000012367 process mapping Methods 0.000 description 1
- 238000010223 real-time analysis Methods 0.000 description 1
- 230000000717 retained effect Effects 0.000 description 1
- 238000012552 review Methods 0.000 description 1
- 238000012954 risk control Methods 0.000 description 1
- 239000010979 ruby Substances 0.000 description 1
- 229910001750 ruby Inorganic materials 0.000 description 1
- 150000003839 salts Chemical class 0.000 description 1
- 238000013341 scale-up Methods 0.000 description 1
- 230000035945 sensitivity Effects 0.000 description 1
- 238000011524 similarity measure Methods 0.000 description 1
- 238000005549 size reduction Methods 0.000 description 1
- 239000007787 solid Substances 0.000 description 1
- 230000003319 supportive effect Effects 0.000 description 1
- 230000002123 temporal effect Effects 0.000 description 1
- 210000003813 thumb Anatomy 0.000 description 1
- 238000012549 training Methods 0.000 description 1
- 238000013519 translation Methods 0.000 description 1
- 238000012384 transportation and delivery Methods 0.000 description 1
Images


Classifications
-
- H—ELECTRICITY
- H04—ELECTRIC COMMUNICATION TECHNIQUE
- H04L—TRANSMISSION OF DIGITAL INFORMATION, e.g. TELEGRAPHIC COMMUNICATION
- H04L67/00—Network arrangements or protocols for supporting network services or applications
- H04L67/50—Network services
- H04L67/535—Tracking the activity of the user
-
- G—PHYSICS
- G06—COMPUTING; CALCULATING OR COUNTING
- G06F—ELECTRIC DIGITAL DATA PROCESSING
- G06F16/00—Information retrieval; Database structures therefor; File system structures therefor
- G06F16/90—Details of database functions independent of the retrieved data types
- G06F16/901—Indexing; Data structures therefor; Storage structures
- G06F16/9024—Graphs; Linked lists
-
- G—PHYSICS
- G06—COMPUTING; CALCULATING OR COUNTING
- G06F—ELECTRIC DIGITAL DATA PROCESSING
- G06F16/00—Information retrieval; Database structures therefor; File system structures therefor
- G06F16/90—Details of database functions independent of the retrieved data types
- G06F16/903—Querying
- G06F16/9038—Presentation of query results
-
- G—PHYSICS
- G06—COMPUTING; CALCULATING OR COUNTING
- G06F—ELECTRIC DIGITAL DATA PROCESSING
- G06F16/00—Information retrieval; Database structures therefor; File system structures therefor
- G06F16/90—Details of database functions independent of the retrieved data types
- G06F16/95—Retrieval from the web
- G06F16/953—Querying, e.g. by the use of web search engines
- G06F16/9535—Search customisation based on user profiles and personalisation
-
- G—PHYSICS
- G06—COMPUTING; CALCULATING OR COUNTING
- G06F—ELECTRIC DIGITAL DATA PROCESSING
- G06F16/00—Information retrieval; Database structures therefor; File system structures therefor
- G06F16/90—Details of database functions independent of the retrieved data types
- G06F16/95—Retrieval from the web
- G06F16/953—Querying, e.g. by the use of web search engines
- G06F16/9537—Spatial or temporal dependent retrieval, e.g. spatiotemporal queries
-
- G—PHYSICS
- G06—COMPUTING; CALCULATING OR COUNTING
- G06F—ELECTRIC DIGITAL DATA PROCESSING
- G06F21/00—Security arrangements for protecting computers, components thereof, programs or data against unauthorised activity
- G06F21/50—Monitoring users, programs or devices to maintain the integrity of platforms, e.g. of processors, firmware or operating systems
- G06F21/57—Certifying or maintaining trusted computer platforms, e.g. secure boots or power-downs, version controls, system software checks, secure updates or assessing vulnerabilities
-
- G—PHYSICS
- G06—COMPUTING; CALCULATING OR COUNTING
- G06F—ELECTRIC DIGITAL DATA PROCESSING
- G06F9/00—Arrangements for program control, e.g. control units
- G06F9/06—Arrangements for program control, e.g. control units using stored programs, i.e. using an internal store of processing equipment to receive or retain programs
- G06F9/44—Arrangements for executing specific programs
- G06F9/455—Emulation; Interpretation; Software simulation, e.g. virtualisation or emulation of application or operating system execution engines
-
- G—PHYSICS
- G06—COMPUTING; CALCULATING OR COUNTING
- G06F—ELECTRIC DIGITAL DATA PROCESSING
- G06F9/00—Arrangements for program control, e.g. control units
- G06F9/06—Arrangements for program control, e.g. control units using stored programs, i.e. using an internal store of processing equipment to receive or retain programs
- G06F9/46—Multiprogramming arrangements
- G06F9/54—Interprogram communication
- G06F9/542—Event management; Broadcasting; Multicasting; Notifications
-
- G—PHYSICS
- G06—COMPUTING; CALCULATING OR COUNTING
- G06F—ELECTRIC DIGITAL DATA PROCESSING
- G06F9/00—Arrangements for program control, e.g. control units
- G06F9/06—Arrangements for program control, e.g. control units using stored programs, i.e. using an internal store of processing equipment to receive or retain programs
- G06F9/46—Multiprogramming arrangements
- G06F9/54—Interprogram communication
- G06F9/545—Interprogram communication where tasks reside in different layers, e.g. user- and kernel-space
-
- H—ELECTRICITY
- H04—ELECTRIC COMMUNICATION TECHNIQUE
- H04L—TRANSMISSION OF DIGITAL INFORMATION, e.g. TELEGRAPHIC COMMUNICATION
- H04L41/00—Arrangements for maintenance, administration or management of data switching networks, e.g. of packet switching networks
- H04L41/04—Network management architectures or arrangements
- H04L41/046—Network management architectures or arrangements comprising network management agents or mobile agents therefor
-
- H—ELECTRICITY
- H04—ELECTRIC COMMUNICATION TECHNIQUE
- H04L—TRANSMISSION OF DIGITAL INFORMATION, e.g. TELEGRAPHIC COMMUNICATION
- H04L43/00—Arrangements for monitoring or testing data switching networks
- H04L43/04—Processing captured monitoring data, e.g. for logfile generation
- H04L43/045—Processing captured monitoring data, e.g. for logfile generation for graphical visualisation of monitoring data
-
- H—ELECTRICITY
- H04—ELECTRIC COMMUNICATION TECHNIQUE
- H04L—TRANSMISSION OF DIGITAL INFORMATION, e.g. TELEGRAPHIC COMMUNICATION
- H04L43/00—Arrangements for monitoring or testing data switching networks
- H04L43/06—Generation of reports
-
- H—ELECTRICITY
- H04—ELECTRIC COMMUNICATION TECHNIQUE
- H04L—TRANSMISSION OF DIGITAL INFORMATION, e.g. TELEGRAPHIC COMMUNICATION
- H04L63/00—Network architectures or network communication protocols for network security
- H04L63/10—Network architectures or network communication protocols for network security for controlling access to devices or network resources
-
- H—ELECTRICITY
- H04—ELECTRIC COMMUNICATION TECHNIQUE
- H04L—TRANSMISSION OF DIGITAL INFORMATION, e.g. TELEGRAPHIC COMMUNICATION
- H04L67/00—Network arrangements or protocols for supporting network services or applications
- H04L67/2866—Architectures; Arrangements
- H04L67/30—Profiles
- H04L67/306—User profiles
-
- G—PHYSICS
- G06—COMPUTING; CALCULATING OR COUNTING
- G06F—ELECTRIC DIGITAL DATA PROCESSING
- G06F16/00—Information retrieval; Database structures therefor; File system structures therefor
- G06F16/20—Information retrieval; Database structures therefor; File system structures therefor of structured data, e.g. relational data
- G06F16/24—Querying
- G06F16/245—Query processing
- G06F16/2455—Query execution
- G06F16/24553—Query execution of query operations
- G06F16/24558—Binary matching operations
- G06F16/2456—Join operations
-
- G—PHYSICS
- G06—COMPUTING; CALCULATING OR COUNTING
- G06F—ELECTRIC DIGITAL DATA PROCESSING
- G06F9/00—Arrangements for program control, e.g. control units
- G06F9/06—Arrangements for program control, e.g. control units using stored programs, i.e. using an internal store of processing equipment to receive or retain programs
- G06F9/44—Arrangements for executing specific programs
- G06F9/455—Emulation; Interpretation; Software simulation, e.g. virtualisation or emulation of application or operating system execution engines
- G06F9/45533—Hypervisors; Virtual machine monitors
- G06F9/45558—Hypervisor-specific management and integration aspects
- G06F2009/45591—Monitoring or debugging support
-
- H—ELECTRICITY
- H04—ELECTRIC COMMUNICATION TECHNIQUE
- H04L—TRANSMISSION OF DIGITAL INFORMATION, e.g. TELEGRAPHIC COMMUNICATION
- H04L41/00—Arrangements for maintenance, administration or management of data switching networks, e.g. of packet switching networks
- H04L41/14—Network analysis or design
- H04L41/145—Network analysis or design involving simulating, designing, planning or modelling of a network
-
- H—ELECTRICITY
- H04—ELECTRIC COMMUNICATION TECHNIQUE
- H04L—TRANSMISSION OF DIGITAL INFORMATION, e.g. TELEGRAPHIC COMMUNICATION
- H04L43/00—Arrangements for monitoring or testing data switching networks
- H04L43/20—Arrangements for monitoring or testing data switching networks the monitoring system or the monitored elements being virtualised, abstracted or software-defined entities, e.g. SDN or NFV
Definitions
- FIG. 1 A shows an illustrative configuration in which a data platform is configured to perform various operations with respect to a cloud environment that includes a plurality of compute assets.
- FIG. 1 B shows an illustrative implementation of the configuration of FIG. 1 A .
- FIG. 1 C illustrates an example computing device.
- FIG. 1 D illustrates an example of an environment in which activities that occur within datacenters are modeled.
- FIG. 2 A illustrates an example of a process, used by an agent, to collect and report information about a client.
- FIG. 2 B illustrates a 5-tuple of data collected by an agent, physically and logically.
- FIG. 2 C illustrates a portion of a polygraph.
- FIG. 2 D illustrates a portion of a polygraph.
- FIG. 2 E illustrates an example of a communication polygraph.
- FIG. 2 F illustrates an example of a polygraph.
- FIG. 2 G illustrates an example of a polygraph as rendered in an interface.
- FIG. 2 H illustrates an example of a portion of a polygraph as rendered in an interface.
- FIG. 2 I illustrates an example of a portion of a polygraph as rendered in an interface.
- FIG. 2 J illustrates an example of a portion of a polygraph as rendered in an interface.
- FIG. 2 K illustrates an example of a portion of a polygraph as rendered in an interface.
- FIG. 2 L illustrates an example of an insider behavior graph as rendered in an interface.
- FIG. 2 M illustrates an example of a privilege change graph as rendered in an interface.
- FIG. 2 N illustrates an example of a user login graph as rendered in an interface.
- FIG. 2 O illustrates an example of a machine server graph as rendered in an interface.
- FIG. 3 A illustrates an example of a process for detecting anomalies in a network environment.
- FIG. 3 B depicts a set of example processes communicating with other processes.
- FIG. 3 C depicts a set of example processes communicating with other processes.
- FIG. 3 D depicts a set of example processes communicating with other processes.
- FIG. 3 E depicts two pairs of clusters.
- FIG. 3 F is a representation of a user logging into a first machine, then into a second machine from the first machine, and then making an external connection.
- FIG. 3 G is an alternate representation of actions occurring in FIG. 3 F .
- FIG. 3 H illustrates an example of a process for performing extended user tracking.
- FIG. 3 I is a representation of a user logging into a first machine, then into a second machine from the first machine, and then making an external connection.
- FIG. 3 J illustrates an example of a process for performing extended user tracking.
- FIG. 3 K illustrates example records.
- FIG. 3 L illustrates example output from performing an ssh connection match.
- FIG. 3 M illustrates example records.
- FIG. 3 N illustrates example records.
- FIG. 3 O illustrates example records.
- FIG. 3 P illustrates example records.
- FIG. 3 Q illustrates an adjacency relationship between two login sessions.
- FIG. 3 R illustrates example records.
- FIG. 3 S illustrates an example of a process for detecting anomalies.
- FIG. 4 A illustrates a representation of an embodiment of an insider behavior graph.
- FIG. 4 B illustrates an embodiment of a portion of an insider behavior graph.
- FIG. 4 C illustrates an embodiment of a portion of an insider behavior graph.
- FIG. 4 D illustrates an embodiment of a portion of an insider behavior graph.
- FIG. 4 E illustrates a representation of an embodiment of a user login graph.
- FIG. 4 F illustrates an example of a privilege change graph.
- FIG. 4 G illustrates an example of a privilege change graph.
- FIG. 4 H illustrates an example of a user interacting with a portion of an interface.
- FIG. 4 I illustrates an example of a dossier for an event.
- FIG. 4 J illustrates an example of a dossier for a domain.
- FIG. 4 K depicts an example of an Entity Join graph by FilterKey and FilterKey Group (implicit join).
- FIG. 4 L illustrates an example of a process for dynamically generating and executing a query.
- FIGS. 5 A- 5 B illustrate example container systems in a cloud environment.
- FIGS. 6 - 7 illustrate example configurations for monitoring a container system in a cloud environment.
- FIG. 8 illustrates an example method of monitoring a container system in a cloud environment.
- FIG. 1 A shows an illustrative configuration 10 in which a data platform 12 is configured to perform various operations with respect to a cloud environment 14 that includes a plurality of compute assets 16 - 1 through 16 -N (collectively “compute assets 16 ).
- data platform 12 may include data ingestion resources 18 configured to ingest data from cloud environment 14 into data platform 12 , data processing resources 20 configured to perform data processing operations with respect to the data, user interface resources 22 configured to provide one or more external users and/or compute resources (e.g., computing device 24 ) with access to an output of data processing resources 20 .
- data ingestion resources 18 configured to ingest data from cloud environment 14 into data platform 12
- data processing resources 20 configured to perform data processing operations with respect to the data
- user interface resources 22 configured to provide one or more external users and/or compute resources (e.g., computing device 24 ) with access to an output of data processing resources 20 .
- compute resources e.g., computing device 24
- Cloud environment 14 may include any suitable network-based computing environment as may serve a particular application.
- cloud environment 14 may be implemented by one or more compute resources provided and/or otherwise managed by one or more cloud service providers, such as Amazon Web Services (AWS), Google Cloud Platform (GCP), Microsoft Azure, and/or any other cloud service provider configured to provide public and/or private access to network-based compute resources.
- AWS Amazon Web Services
- GCP Google Cloud Platform
- Azure Microsoft Azure
- Compute assets 16 may include, but are not limited to, containers (e.g., container images, deployed and executing container instances, etc.), virtual machines, workloads, applications, processes, physical machines, compute nodes, clusters of compute nodes, software runtime environments (e.g., container runtime environments), and/or any other virtual and/or physical compute resource that may reside in and/or be executed by one or more computer resources in cloud environment 14 .
- containers e.g., container images, deployed and executing container instances, etc.
- virtual machines e.g., container images, deployed and executing container instances, etc.
- workloads e.g., applications, processes, physical machines, compute nodes, clusters of compute nodes
- software runtime environments e.g., container runtime environments
- any other virtual and/or physical compute resource may reside in and/or be executed by one or more computer resources in cloud environment 14 .
- one or more compute assets 16 may reside in one or more datacenters.
- a compute asset 16 may be associated with (e.g., owned, deployed, or managed by) a particular entity, such as a customer or client of cloud environment 14 and/or data platform 12 . Accordingly, for purposes of the discussion herein, cloud environment 14 may be used by one or more entities.
- Data platform 12 may be configured to perform one or more data security monitoring and/or remediation services, compliance monitoring services, anomaly detection services, DevOps services, compute asset management services, and/or any other type of data analytics service as may serve a particular implementation.
- Data platform 12 may be managed or otherwise associated with any suitable data platform provider, such as a provider of any of the data analytics services described herein.
- the various resources included in data platform 12 may reside in the cloud and/or be located on-premises and be implemented by any suitable combination of physical and/or virtual compute resources, such as one or more computing devices, microservices, applications, etc.
- Data ingestion resources 18 may be configured to ingest data from cloud environment 14 into data platform 12 . This may be performed in various ways, some of which are described in detail herein. For example, as illustrated by arrow 26 , data ingestion resources 18 may be configured to receive the data from one or more agents deployed within cloud environment 14 , utilize an event streaming platform (e.g., Kafka) to obtain the data, and/or pull data (e.g., configuration data) from cloud environment 14 . In some examples, data ingestion resources 18 may obtain the data using one or more agentless configurations.
- event streaming platform e.g., Kafka
- data ingestion resources 18 may obtain the data using one or more agentless configurations.
- the data ingested by data ingestion resources 18 from cloud environment 14 may include any type of data as may serve a particular implementation.
- the data may include data representative of configuration information associated with compute assets 16 , information about one or more processes running on compute assets 16 , network activity information, information about events (creation events, modification events, communication events, user-initiated events, etc.) that occur with respect to compute assets 16 , etc.
- the data may or may not include actual customer data processed or otherwise generated by compute assets 16 .
- data ingestion resources 18 may be configured to load the data ingested from cloud environment 14 into a data store 30 .
- Data store 30 is illustrated in FIG. 1 A as being separate from and communicatively coupled to data platform 12 . However, in some alternative embodiments, data store 30 is included within data platform 12 .
- Data store 30 may be implemented by any suitable data warehouse, data lake, data mart, and/or other type of database structure as may serve a particular implementation. Such data stores may be proprietary or may be embodied as vendor provided products or services such as, for example, Snowflake, Google BigQuery, Druid, Amazon Redshift, IBM db2, Dremio, Databricks Lakehouse Platform, Cloudera, Azure Synapse Analytics, and others.
- data that is collected from agents and other sources may be stored in different ways.
- data that is collected from agents and other sources may be stored in a data warehouse, data lake, data mart, and/or any other data store.
- a data warehouse may be embodied as an analytic database (e.g., a relational database) that is created from two or more data sources. Such a data warehouse may be leveraged to store historical data, often on the scale of petabytes. Data warehouses may have compute and memory resources for running complicated queries and generating reports. Data warehouses may be the data sources for business intelligence (‘BI’) systems, machine learning applications, and/or other applications. By leveraging a data warehouse, data that has been copied into the data warehouse may be indexed for good analytic query performance, without affecting the write performance of a database (e.g., an Online Transaction Processing (‘OLTP’) database). Data warehouses also enable the joining data from multiple sources for analysis. For example, a sales OLTP application probably has no need to know about the weather at various sales locations, but sales predictions could take advantage of that data. By adding historical weather data to a data warehouse, it would be possible to factor it into models of historical sales data.
- OLTP Online Transaction Processing
- Data lakes which store files of data in their native format, may be considered as “schema on read” resources.
- any application that reads data from the lake may impose its own types and relationships on the data.
- Data warehouses are “schema on write,” meaning that data types, indexes, and relationships are imposed on the data as it is stored in an enterprise data warehouse (EDW).
- EDW enterprise data warehouse
- “Schema on read” resources may be beneficial for data that may be used in several contexts and poses little risk of losing data.
- “Schema on write” resources may be beneficial for data that has a specific purpose, and good for data that must relate properly to data from other sources.
- Such data stores may include data that is encrypted using homomorphic encryption, data encrypted using privacy-preserving encryption, smart contracts, non-fungible tokens, decentralized finance, and other techniques.
- Data marts may contain data oriented towards a specific business line whereas data warehouses contain enterprise-wide data. Data marts may be dependent on a data warehouse, independent of the data warehouse (e.g., drawn from an operational database or external source), or a hybrid of the two. In embodiments described herein, different types of data stores (including combinations thereof) may be leveraged.
- Data processing resources 20 may be configured to perform various data processing operations with respect to data ingested by data ingestion resources 18 , including data ingested and stored in data store 30 .
- data processing resources 20 may be configured to perform one or more data security monitoring and/or remediation operations, compliance monitoring operations, anomaly detection operations, DevOps operations, compute asset management operations, and/or any other type of data analytics operation as may serve a particular implementation.
- data security monitoring and/or remediation operations compliance monitoring operations, anomaly detection operations, DevOps operations, compute asset management operations, and/or any other type of data analytics operation as may serve a particular implementation.
- DevOps operations compute asset management operations
- any other type of data analytics operation as may serve a particular implementation.
- data processing resources 20 may be configured to access data in data store 30 to perform the various operations described herein. In some examples, this may include performing one or more queries with respect to the data stored in data store 30 . Such queries may be generated using any suitable query language.
- the queries provided by data processing resources 20 may be configured to direct data store 30 to perform one or more data analytics operations with respect to the data stored within data store 30 .
- These data analytics operations may be with respect to data specific to a particular entity (e.g., data residing in one or more silos within data store 30 that are associated with a particular customer) and/or data associated with multiple entities.
- data processing resources 20 may be configured to analyze data associated with a first entity and use the results of the analysis to perform one or more operations with respect to a second entity.
- One or more operations performed by data processing resources 20 may be performed periodically according to a predetermined schedule. For example, one or more operations may be performed by processing resources 20 every hour or any other suitable time interval. Additionally or alternatively, one or more operations performed by data processing resources 20 may be performed in substantially real-time (or near real-time) as data is ingested into data platform 12 . In this manner, the results of such operations (e.g., one or more detected anomalies in the data) may be provided to one or more external entities (e.g., computing device 24 and/or one or more users) in substantially real-time and/or in near real-time.
- one or more external entities e.g., computing device 24 and/or one or more users
- User interface resources 22 may be configured to perform one or more user interface operations, examples of which are described herein.
- user interface resources 22 may be configured to present one or more results of the data processing performed by data processing resources 20 to one or more external entities (e.g., computing device 24 and/or one or more users), as illustrated by arrow 34 .
- user interface resources 22 may access data in data store 30 to perform the one or more user interface operations
- FIG. 1 B illustrates an implementation of configuration 10 in which an agent 38 (e.g., agent 38 - 1 through agent 38 -N) is installed on each of compute assets 16 .
- an agent may include a self-contained binary and/or other type of code or application that can be run on any appropriate platforms, including within containers and/or other virtual compute assets.
- Agents 38 may monitor the nodes on which they execute for a variety of different activities, including but not limited to, connection, process, user, machine, and file activities.
- agents 38 can be executed in user space, and can use a variety of kernel modules (e.g., auditd, iptables, netfilter, pcap, etc.) to collect data.
- Agents can be implemented in any appropriate programming language, such as C or Golang, using applicable kernel APIs.
- Agents 38 may be deployed in any suitable manner.
- an agent 38 may be deployed as a containerized application or as part of a containerized application.
- agents 38 may selectively report information to data platform 12 in varying amounts of detail and/or with variable frequency.
- load balancer 40 configured to perform one or more load balancing operations with respect to data ingestion operations performed by data ingestion resources 18 and/or user interface operations performed by user interface resources 22 .
- Load balancer 40 is shown to be included in data platform 12 . However, load balancer 40 may alternatively be located external to data platform 12 . Load balancer 40 may be implemented by any suitable microservice, application, and/or other computing resources. In some alternative examples, data platform 12 may not utilize a load balancer such as load balancer 40 .
- Long term storage 42 with which data ingestion resources may interface, as illustrated by arrow 44 .
- Long term storage 42 may be implemented by any suitable type of storage resources, such as cloud-based storage (e.g., AWS S3, etc.) and/or on-premises storage and may be used by data ingestion resources 18 as part of the data ingestion process. Examples of this are described herein.
- data platform 12 may not utilize long term storage 42 .
- a component such as a processor or a memory described as being configured to perform a task may be implemented as a general component that is temporarily configured to perform the task at a given time or a specific component that is manufactured to perform the task.
- processor refers to one or more devices, circuits, and/or processing cores configured to process data, such as computer program instructions.
- a non-transitory computer-readable medium storing computer-readable instructions may be provided in accordance with the principles described herein.
- the instructions when executed by a processor of a computing device, may direct the processor and/or computing device to perform one or more operations, including one or more of the operations described herein.
- Such instructions may be stored and/or transmitted using any of a variety of known computer-readable media.
- a non-transitory computer-readable medium as referred to herein may include any non-transitory storage medium that participates in providing data (e.g., instructions) that may be read and/or executed by a computing device (e.g., by a processor of a computing device).
- a non-transitory computer-readable medium may include, but is not limited to, any combination of non-volatile storage media and/or volatile storage media.
- Exemplary non-volatile storage media include, but are not limited to, read-only memory, flash memory, a solid-state drive, a magnetic storage device (e.g.
- RAM ferroelectric random-access memory
- optical disc e.g., a compact disc, a digital video disc, a Blu-ray disc, etc.
- RAM e.g., dynamic RAM
- FIG. 1 C illustrates an example computing device 50 that may be specifically configured to perform one or more of the processes described herein. Any of the systems, microservices, computing devices, and/or other components described herein may be implemented by computing device 50 .
- computing device 50 may include a communication interface 52 , a processor 54 , a storage device 56 , and an input/output (“I/O”) module 58 communicatively connected one to another via a communication infrastructure 60 . While an exemplary computing device 50 is shown in FIG. 1 C , the components illustrated in FIG. 1 C are not intended to be limiting. Additional or alternative components may be used in other embodiments. Components of computing device 50 shown in FIG. 1 C will now be described in additional detail.
- Communication interface 52 may be configured to communicate with one or more computing devices.
- Examples of communication interface 52 include, without limitation, a wired network interface (such as a network interface card), a wireless network interface (such as a wireless network interface card), a modem, an audio/video connection, and any other suitable interface.
- Processor 54 generally represents any type or form of processing unit capable of processing data and/or interpreting, executing, and/or directing execution of one or more of the instructions, processes, and/or operations described herein. Processor 54 may perform operations by executing computer-executable instructions 62 (e.g., an application, software, code, and/or other executable data instance) stored in storage device 56 .
- computer-executable instructions 62 e.g., an application, software, code, and/or other executable data instance
- Storage device 56 may include one or more data storage media, devices, or configurations and may employ any type, form, and combination of data storage media and/or device.
- storage device 56 may include, but is not limited to, any combination of the non-volatile media and/or volatile media described herein.
- Electronic data, including data described herein, may be temporarily and/or permanently stored in storage device 56 .
- data representative of computer-executable instructions 62 configured to direct processor 54 to perform any of the operations described herein may be stored within storage device 56 .
- data may be arranged in one or more databases residing within storage device 56 .
- I/O module 58 may include one or more I/O modules configured to receive user input and provide user output.
- I/O module 58 may include any hardware, firmware, software, or combination thereof supportive of input and output capabilities.
- I/O module 58 may include hardware and/or software for capturing user input, including, but not limited to, a keyboard or keypad, a touchscreen component (e.g., touchscreen display), a receiver (e.g., an RF or infrared receiver), motion sensors, and/or one or more input buttons.
- I/O module 58 may include one or more devices for presenting output to a user, including, but not limited to, a graphics engine, a display (e.g., a display screen), one or more output drivers (e.g., display drivers), one or more audio speakers, and one or more audio drivers.
- I/O module 58 is configured to provide graphical data to a display for presentation to a user.
- the graphical data may be representative of one or more graphical user interfaces and/or any other graphical content as may serve a particular implementation.
- FIG. 1 D illustrates an example implementation 100 of configuration 10 .
- one more components shown in FIG. 1 D may implement one or more components shown in FIG. 1 A and/or FIG. 1 B .
- implementation 100 illustrates an environment in which activities that occur within datacenters are modeled using data platform 12 .
- a baseline of datacenter activity can be modeled, and deviations from that baseline can be identified as anomalous.
- Anomaly detection can be beneficial in a security context, a compliance context, an asset management context, a DevOps context, and/or any other data analytics context as may serve a particular implementation.
- a datacenter may include dedicated equipment (e.g., owned and operated by entity A, or owned/leased by entity A and operated exclusively on entity A's behalf by a third party).
- a datacenter can also include cloud-based resources, such as infrastructure as a service (IaaS), platform as a service (PaaS), and/or software as a service (SaaS) elements.
- IaaS infrastructure as a service
- PaaS platform as a service
- SaaS software as a service
- Both datacenter 104 and datacenter 106 include a plurality of nodes, depicted collectively as set of nodes 108 and set of nodes 110 , respectively, in FIG. 1 D . These nodes may implement compute assets 16 . Installed on each of the nodes are in-server/in-virtual machine (VM)/embedded in IoT device agents (e.g., agent 112 ), which are configured to collect data and report it to data platform 12 for analysis. As described herein, agents may be small, self-contained binaries that can be run on any appropriate platforms, including virtualized ones (and, as applicable, within containers). Agents may monitor the nodes on which they execute for a variety of different activities, including: connection, process, user, machine, and file activities.
- VM in-server/in-virtual machine
- agent 112 IoT device agents
- agents may be small, self-contained binaries that can be run on any appropriate platforms, including virtualized ones (and, as applicable, within containers). Agents may monitor the
- Agents can be executed in user space, and can use a variety of kernel modules (e.g., auditd, iptables, netfilter, pcap, etc.) to collect data. Agents can be implemented in any appropriate programming language, such as C or Golang, using applicable kernel APIs.
- kernel modules e.g., auditd, iptables, netfilter, pcap, etc.
- Agents can be implemented in any appropriate programming language, such as C or Golang, using applicable kernel APIs.
- agents can selectively report information to data platform 12 in varying amounts of detail and/or with variable frequency.
- the data collected by agents may be used by data platform 12 to create polygraphs, which are graphs of logical entities, connected by behaviors.
- agents report information directly to data platform 12 .
- at least some agents provide information to a data aggregator, such as data aggregator 114 , which in turn provides information to data platform 12 .
- a data aggregator can be implemented as a separate binary or other application (distinct from an agent binary), and can also be implemented by having an agent execute in an “aggregator mode” in which the designated aggregator node acts as a Layer 7 proxy for other agents that do not have access to data platform 12 . Further, a chain of multiple aggregators can be used, if applicable (e.g., with agent 112 providing data to data aggregator 114 , which in turn provides data to another aggregator (not pictured) which provides data to data platform 12 ).
- An example way to implement an aggregator is through a program written in an appropriate language, such as C or Golang.
- Use of an aggregator can be beneficial in sensitive environments (e.g., involving financial or medical transactions) where various nodes are subject to regulatory or other architectural requirements (e.g., prohibiting a given node from communicating with systems outside of datacenter 104 ). Use of an aggregator can also help to minimize security exposure more generally. As one example, by limiting communications with data platform 12 to data aggregator 114 , individual nodes in nodes 108 need not make external network connections (e.g., via Internet 124 ), which can potentially expose them to compromise (e.g., by other external devices, such as device 118 , operated by a criminal). Similarly, data platform 12 can provide updates, configuration information, etc., to data aggregator 114 (which in turn distributes them to nodes 108 ), rather than requiring nodes 108 to allow incoming connections from data platform 12 directly.
- data platform 12 can provide updates, configuration information, etc., to data aggregator 114 (which in turn distributes them to nodes 108 ), rather than requiring nodes
- Another benefit of an aggregator model is that network congestion can be reduced (e.g., with a single connection being made at any given time between data aggregator 114 and data platform 12 , rather than potentially many different connections being open between various of nodes 108 and data platform 12 ). Similarly, network consumption can also be reduced (e.g., with the aggregator applying compression techniques/bundling data received from multiple agents).
- agent 112 e.g., agent 112 , installed on node 116
- data serialization protocols such as Apache Avro.
- agent 112 to data aggregator 114 One example type of information sent by agent 112 to data aggregator 114 is status information. Status information may be sent by an agent periodically (e.g., once an hour or once any other predetermined amount of time). Alternatively, status information may be sent continuously or in response to occurrence of one or more events. The status information may include, but is not limited to, a. an amount of event backlog (in bytes) that has not yet been transmitted, b. configuration information, c. any data loss period for which data was dropped, d. a cumulative count of errors encountered since the agent started, e. version information for the agent binary, and/or f. cumulative statistics on data collection (e.g., number of network packets processed, new processes seen, etc.).
- a second example type of information that may be sent by agent 112 to data aggregator 114 is event data (described in more detail herein), which may include a UTC timestamp for each event.
- the agent can control the amount of data that it sends to the data aggregator in each call (e.g., a maximum of 10 MB) by adjusting the amount of data sent to manage the conflicting goals of transmitting data as soon as possible, and maximizing throughput.
- Data can also be compressed or uncompressed by the agent (as applicable) prior to sending the data.
- Each data aggregator may run within a particular customer environment.
- a data aggregator (e.g., data aggregator 114 ) may facilitate data routing from many different agents (e.g., agents executing on nodes 108 ) to data platform 12 .
- data aggregator 114 may implement a SOCKS 5 caching proxy through which agents can connect to data platform 12 .
- data aggregator 114 can encrypt (or otherwise obfuscate) sensitive information prior to transmitting it to data platform 12 , and can also distribute key material to agents which can encrypt the information (as applicable).
- Data aggregator 114 may include a local storage, to which agents can upload data (e.g., pcap packets).
- the storage may have a key-value interface.
- the local storage can also be omitted, and agents configured to upload data to a cloud storage or other storage area, as applicable.
- Data aggregator 114 can, in some embodiments, also cache locally and distribute software upgrades, patches, or configuration information (e.g., as received from data platform 12 ).
- user A may access a web frontend (e.g., web app 120 ) using a computer 126 and enrolls (on behalf of entity A) an account with data platform 12 .
- a web frontend e.g., web app 120
- user A may be presented with a set of installers, pre-built and customized for the environment of entity A, that user A can download from data platform 12 and deploy on nodes 108 .
- installers include, but are not limited to, a Windows executable file, an iOS app, a Linux package (e.g., .deb or .rpm), a binary, or a container (e.g., a Docker container).
- a user e.g., a network administrator
- user B may be similarly presented with a set of installers that are pre-built and customized for the environment of entity B.
- Agent deployment can also be performed using one or more appropriate automation tools, such as Chef, Puppet, Salt, and Ansible. Deployment can also be performed using managed/hosted container management/orchestration frameworks such as Kubernetes, Mesos, and/or Docker Swarm.
- the agent may be installed in the user space (i.e., is not a kernel module), and the same binary is executed on each node of the same type (e.g., all Windows-based platforms have the same Windows-based binary installed on them).
- An illustrative function of an agent, such as agent 112 is to collect data (e.g., associated with node 116 ) and report it (e.g., to data aggregator 114 ).
- Other tasks that can be performed by agents include data configuration and upgrading.
- One approach to collecting data as described herein is to collect virtually all information available about a node (and, e.g., the processes running on it).
- the agent may monitor for network connections, and then begin collecting information about processes associated with the network connections, using the presence of a network packet associated with a process as a trigger for collecting additional information about the process.
- an application such as a calculator application, which does not typically interact with the network
- no information about use of that application may be collected by agent 112 and/or sent to data aggregator 114 .
- agent 112 may collect information about the process and provide associated information to data aggregator 114 .
- the agent may always collect/report information about certain events, such as privilege escalation, irrespective of whether the event is associated with network activity.
- An approach to collecting information is as follows, and described in conjunction with process 200 depicted in FIG. 2 A .
- An agent e.g., agent 112
- monitors its node e.g., node 116
- node 116 e.g., node 116
- a network packet capture tool e.g., listening using libpcap
- the agent obtains and maintains (e.g., in an in-memory cache) connection information associated with the network activity ( 202 ). Examples of such information include DNS query/response, TCP, UDP, and IP information.
- the agent may also determine a process associated with the network connection ( 203 ).
- a kernel network diagnostic API e.g., netlink_diag
- netstat e.g., on /proc/net/tcp, /proc/net/tcp6, /proc/net/udp, and/proc/net/udp6
- Information such as socket state (e.g., whether a socket is connected, listening, etc.) can also be collected by the agent.
- One way an agent can obtain a mapping between a given inode and a process identifier is to scan within the /proc/pid directory. For each of the processes currently running, the agent examines each of their file descriptors. If a file descriptor is a match for the inode, the agent can determine that the process associated with the file descriptor owns the inode. Once a mapping is determined between an inode and a process identifier, the mapping is cached. As additional packets are received for the connection, the cached process information is used (rather than a new search being performed).
- searching through file descriptors is accordingly optimized.
- User filtering is one example of such an optimization.
- a given socket is owned by a user. Any processes associated with the socket will be owned by the same user as the socket.
- the agent can filter through the processes and only examine the file descriptors of processes sharing the same user owner as the socket.
- processes owned by root are always searched against (e.g., even when user filtering is employed).
- Another example of an optimization is to prioritize searching the file descriptors of certain processes over others.
- One such prioritization is to search through the subdirectories of /proc/ starting with the youngest process.
- One approximation of such a sort order is to search through /proc/ in reverse order (e.g., examining highest numbered processes first). Higher numbered processes are more likely to be newer (i.e., not long-standing processes), and thus more likely to be associated with new connections (i.e., ones for which inode-process mappings are not already cached).
- the most recently created process may not have the highest process identifier (e.g., due to the kernel wrapping through process identifiers).
- Another example prioritization is to query the kernel for an identification of the most recently created process and to search in a backward order through the directories in /proc/ (e.g., starting at the most recently created process and working backwards, then wrapping to the highest value (e.g., 32768) and continuing to work backward from there).
- An alternate approach is for the agent to keep track of the newest process that it has reported information on (e.g., to data aggregator 114 ), and begin its search of /proc/ in a forward order starting from the PID of that process.
- Another example prioritization is to maintain, for each user actively using node 116 , a list of the five (or any other number) most recently active processes. Those processes are more likely than other processes (less active, or passive) on node 116 to be involved with new connections, and can thus be searched first. For many processes, lower valued file descriptors tend to correspond to non-sockets (e.g., stdin, stdout, stderr). Yet another optimization is to preferentially search higher valued file descriptors (e.g., across processes) over lower valued file descriptors (that are less likely to yield matches).
- an agent may encounter a socket that does not correspond to the inode being matched against and is not already cached. The identity of that socket (and its corresponding inode) can be cached, once discovered, thus removing a future need to search for that pair.
- a connection may terminate before the agent is able to determine its associated process (e.g., due to a very short-lived connection, due to a backlog in agent processing, etc.).
- One approach to addressing such a situation is to asynchronously collect information about the connection using the audit kernel API, which streams information to user space.
- the information collected from the audit API (which can include PID/inode information) can be matched by the agent against pcap/inode information.
- the audit API is always used, for all connections. However, due to CPU utilization considerations, use of the audit API can also be reserved for short/otherwise problematic connections (and/or omitted, as applicable).
- the agent can then collect additional information associated with the process ( 204 ).
- some of the collected information may include attributes of the process (e.g., a process parent hierarchy, and an identification of a binary associated with the process).
- other of the collected information is derived (e.g., session summarization data and hash values).
- the collected information is then transmitted ( 205 ), e.g., by an agent (e.g., agent 112 ) to a data aggregator (e.g., data aggregator 114 ), which in turn provides the information to data platform 12 .
- agent e.g., agent 112
- data aggregator e.g., data aggregator 114
- all information collected by an agent may be transmitted (e.g., to a data aggregator and/or to data platform 12 ).
- the amount of data transmitted may be minimized (e.g., for efficiency reasons), using various techniques.
- One approach to minimizing the amount of data flowing from agents (such as agents installed on nodes 108 ) to data platform 12 is to use a technique of implicit references with unique keys.
- the keys can be explicitly used by data platform 12 to extract/derive relationships, as necessary, in a data set at a later time, without impacting performance.
- Constant data can be transmitted ( 210 ) once, when the agent first becomes aware of the process. And, if any changes to the constant data are detected (e.g., a process changes its parent), a refreshed version of the data can be transmitted ( 210 ) as applicable.
- variable data e.g., data that may change over the lifetime of the process.
- variable data can be transmitted ( 210 ) at periodic (or other) intervals.
- variable data may be transmitted in substantially real time as it is collected.
- the variable data may indicate a thread count for a process, a total virtual memory used by the process, the total resident memory used by the process, the total time spent by the process executing in user space, and/or the total time spent by the process executing in kernel space.
- the data may include a hash that may be used within data platform 12 to join process creation time attributes with runtime attributes to construct a full dataset.
- agent 112 can collect and provide to data platform 12 .
- Core User Data user name, UID (user ID), primary group, other groups, home directory.
- User Login Data user name, hostname, IP address, start time, TTY (terminal), UID (user ID), GID (group ID), process, end time.
- Dropped Packet Data source IP address, destination IP address, destination port, protocol, count.
- Machine Data hostname, domain name, architecture, kernel, kernel release, kernel version, OS, OS version, OS description, CPU, memory, model number, number of cores, last boot time, last boot reason, tags (e.g., Cloud provider tags such as AWS, GCP, or Azure tags), default router, interface name, interface hardware address, interface IP address and mask, promiscuous mode.
- tags e.g., Cloud provider tags such as AWS, GCP, or Azure tags
- Network Connection Data source IP address, destination IP address, source port, destination port, protocol, start time, end time, incoming and outgoing bytes, source process, destination process, direction of connection, histograms of packet length, inter packet delay, session lengths, etc.
- Listening Ports in Server source IP address, port number, protocol, process.
- Dropped Packet Data source IP address, destination IP address, destination port, protocol, count.
- Arp Data source hardware address, source IP address, destination hardware address, destination IP address.
- DNS Data source IP address, response code, response string, question (request), packet length, final answer (response).
- Package Data exe path, package name, architecture, version, package path, checksums (MD5, SHA-1, SHA-256), size, owner, owner ID.
- Application Data command line, PID (process ID), start time, UID (user ID), EUID (effective UID), PPID (parent process ID), PGID (process group ID), SID (session ID), exe path, username, container ID.
- Container Image Data image creation time, parent ID, author, container type, repo, (AWS) tags, size, virtual size, image version.
- Container Data container start time, container type, container name, container ID, network mode, privileged, PID mode, IP addresses, listening ports, volume map, process ID.
- File path file data hash, symbolic links, file creation data, file change data, file metadata, file mode.
- an agent such as agent 112
- can be deployed in a container e.g., a Docker container
- Collection about a container can be performed by an agent irrespective of whether the agent is itself deployed in a container or not (as the agent can be deployed in a container running in a privileged mode that allows for monitoring).
- Agents can discover containers (e.g., for monitoring) by listening for container create events (e.g., provided by Docker), and can also perform periodic ordered discovery scans to determine whether containers are running on a node.
- container create events e.g., provided by Docker
- the agent can obtain attributes of the container, e.g., using standard Docker API calls (e.g., to obtain IP addresses associated with the container, whether there's a server running inside, what port it is listening on, associated PIDs, etc.).
- Information such as the parent process that started the container can also be collected, as can information about the image (which comes from the Docker repository).
- agents may use namespaces to determine whether a process is associated with a container.
- Namespaces are a feature of the Linux kernel that can be used to isolate resources of a collection of processes. Examples of namespaces include process ID (PID) namespaces, network namespaces, and user namespaces. Given a process, the agent can perform a fast lookup to determine whether the process is part of the namespace the container claims to be its namespace.
- PID process ID
- agents can be configured to report certain types of information (e.g., attribute information) once, when the agent first becomes aware of a process.
- information e.g., attribute information
- static information is not reported again (or is reported once a day, every twelve hours, etc.), unless it changes (e.g., a process changes its parent, changes its owner, or a SHA-1 of the binary associated with the process changes).
- agents are configured to report a list of current connections every minute (or other appropriate time interval). In that connection list will be connections that started in that minute interval, connections that ended in that minute interval, and connections that were ongoing throughout the minute interval (e.g., a one minute slice of a one hour connection).
- agents are configured to collect/compute statistical information about connections (e.g., at the one minute level of granularity and or at any other time interval). Examples of such information include, for the time interval, the number of bytes transferred, and in which direction. Another example of information collected by an agent about a connection is the length of time between packets. For connections that span multiple time intervals (e.g., a seven minute connection), statistics may be calculated for each minute of the connection. Such statistical information (for all connections) can be reported (e.g., to a data aggregator) once a minute.
- agents are also configured to maintain histogram data for a given network connection, and provide the histogram data (e.g., in the Apache Avro data exchange format) under the Connection event type data.
- histograms include: 1. a packet length histogram (packet len_hist), which characterizes network packet distribution; 2. a session length histogram (session_len_hist), which characterizes a network session length; 3. a session time histogram (session_time_hist), which characterizes a network session time; and 4. a session switch time histogram (session_switch_time_hist), which characterizes network session switch time (i.e., incoming ⁇ outgoing and vice versa).
- histogram data may include one or more of the following fields: 1. count, which provides a count of the elements in the sampling; 2. sum, which provides a sum of elements in the sampling; 3. max, which provides the highest value element in the sampling; 4. std_dev, which provides the standard deviation of elements in the sampling; and 5. buckets, which provides a discrete sample bucket distribution of sampling data (if applicable).
- a connection is opened, a string is sent, a string is received, and the connection is closed.
- both sides of the connection engage in a constant chatter. Histograms allow data platform 12 to model application behavior (e.g., using machine learning techniques), for establishing baselines, and for detecting deviations.
- application behavior e.g., using machine learning techniques
- a connection generates 500 bytes of traffic, or 2,000 bytes of traffic, such connections would be considered within the typical usage pattern of the server.
- a connection is made that results in 10G of traffic. Such a connection is anomalous and can be flagged accordingly.
- load balancer 130 is a reverse proxy that load balances accepted connections internally to various microservices (described in more detail below), allowing for services provided by data platform 12 to scale up as more agents are added to the environment and/or as more entities subscribe to services provided by data platform 12 .
- Example ways to implement load balancer 130 include, but are not limited to, using HaProxy, using nginx, and using elastic load balancing (ELB) services made available by Amazon.
- ELB elastic load balancing
- Agent service 132 is a microservice that is responsible for accepting data collected from agents (e.g., provided by aggregator 114 ).
- agent service 132 uses a standard secure protocol, such as HTTPS to communicate with aggregators (and as applicable agents), and receives data in an appropriate format such as Apache Avro.
- HTTPS HyperText Transfer Protocol
- agent service 132 can perform a variety of checks, such as to see whether the data is being provided by a current customer, and whether the data is being provided in an appropriate format. If the data is not appropriately formatted (and/or is not provided by a current customer), it may be rejected.
- agent service 132 may facilitate copying the received data to a streaming data stable storage using a streaming service (e.g., Amazon Kinesis and/or any other suitable streaming service.
- a streaming service e.g., Amazon Kinesis and/or any other suitable streaming service.
- service 132 may send an acknowledgement to the data provider (e.g., data aggregator 114 ). If the agent does not receive such an acknowledgement, it is configured to retry sending the data to data platform 12 .
- One way to implement agent service 132 is as a REST API server framework (e.g., Java DropWizard), configured to communicate with Kinesis (e.g., using a Kinesis library).
- data platform 12 uses one or more streams (e.g., Kinesis streams) for all incoming customer data (e.g., including data provided by data aggregator 114 and data aggregator 128 ), and the data is sharded based on the node (also referred to herein as a “machine”) that originated the data (e.g., node 116 vs. node 122 ), with each node having a globally unique identifier within data platform 12 .
- Multiple instances of agent service 132 can write to multiple shards.
- Kinesis is a streaming service with a limited period (e.g., 1-7 days). To persist data longer than a day, the data may be copied to long term storage 42 (e.g., S3).
- Data loader 136 is a microservice that is responsible for picking up data from a data stream (e.g., a Kinesis stream) and persisting it in long term storage 42 .
- files collected by data loader 136 from the Kinesis stream are placed into one or more buckets, and segmented using a combination of a customer identifier and time slice.
- DB loader 140 is a microservice that is responsible for loading data into an appropriate data store 30 , such as SnowflakeDB or Amazon Redshift, using individual per-customer databases.
- DB loader 140 is configured to periodically load data into a set of raw tables from files created by data loader 136 as per above.
- DB loader 140 manages throughput, errors, etc., to make sure that data is loaded consistently and continuously.
- DB loader 140 can read incoming data and load into data store 30 data that is not already present in tables of data store 30 (also referred to herein as a database).
- DB loader 140 can be implemented in any appropriate programming language, such as Java or C, and an SQL framework such as jOOQ (e.g., to manage SQLs for insertion of data), and SQL/JDBC libraries.
- DB loader 140 may use Amazon S3 and Amazon Simple Queue Service (SQS) to manage files being transferred to and from data store 30 .
- SQL Amazon Simple Queue Service
- data platform 12 can model activities that occur within datacenters, such as datacenters 104 and 106 .
- the model may be stable over time, and differences, even subtle ones (e.g., between a current state of the datacenter and the model) can be surfaced.
- the ability to surface such anomalies can be particularly beneficial in datacenter environments where rogue employees and/or external attackers may operate slowly (e.g., over a period of months), hoping that the elastic nature of typical resource use (e.g., virtualized servers) will help conceal their nefarious activities.
- Communication is one example of a behavior.
- a model of communications between processes is an example of a behavioral model.
- the launching of applications is another example of a behavior that can be modeled.
- the baselines may be periodically updated (e.g., hourly) for every entity. Additionally or alternatively, the baselines may be continuously updated in substantially real-time as data is collected by agents. Deviations from the expected normal behavior can then be detected and automatically reported (e.g., as anomalies or threats detected). Such deviations may be due to a desired change, a misconfiguration, or malicious activity. As applicable, data platform 12 can score the detected deviations (e.g., based on severity and threat posed). Additional examples of analysis groups include models of machine communications, models of privilege changes, and models of insider behaviors (monitoring the interactive behavior of human users as they operate within the datacenter).
- agents may collect information about every connection involving their respective nodes. And, for each connection, information about both the server and the client may be collected (e.g., using the connection-to-process identification techniques described above). DNS queries and responses may also be collected.
- the DNS query information can be used in logical entity graphing (e.g., collapsing many different IP addresses to a single service—e.g., s3.amazon.com).
- process level information collected by agents include attributes (user ID, effective user ID, and command line). Information such as what user/application is responsible for launching a given process and the binary being executed (and its SHA-256 values) may also provided by agents.
- the dataset collected by agents across a datacenter can be very large, and many resources (e.g., virtual machines, IP addresses, etc.) are recycled very quickly.
- resources e.g., virtual machines, IP addresses, etc.
- an IP address and port number used at a first point in time by a first process on a first virtual machine may very rapidly be used (e.g., an hour later) by a different process/virtual machine.
- FIG. 2 B illustrates an example 5-tuple of data 210 collected by an agent, represented physically ( 216 ) and logically ( 217 ).
- the 5-tuple includes a source address 211 , a source port 212 , a destination address 213 , a destination port 214 , and a protocol 215 .
- port numbers e.g., 212 , 214
- port usage is ephemeral.
- a Docker container can listen on an ephemeral port, which is unrelated to the service it will run. When another Docker container starts (for the same service), the port may well be different. Similarly, particularly in a virtualized environment, IP addresses may be recycled frequently (and are thus also potentially ephemeral) or could be NATed, which makes identification difficult.
- a physical representation of the 5-tuple is depicted in region 216 .
- a process 218 (executing on machine 219 ) has opened a connection to machine 220 .
- process 218 is in communication with process 221 .
- Information such as the number of packets exchanged between the two machines over the respective ports can be recorded.
- portions of the 5-tuple may change—potentially frequently—but still be associated with the same behavior.
- one application e.g., Apache
- another application e.g., Oracle
- either/both of Apache and Oracle may be multi-homed.
- This can lead to potentially thousands of 5-tuples (or more) that all correspond to Apache communicating with Oracle within a datacenter.
- Apache could be executed on a single machine, and could also be executed across fifty machines, which are variously spun up and down (with different IP addresses each time).
- An alternate representation of the 5-tuple of data 210 is depicted in region 217 , and is logical.
- the logical representation of the 5-tuple aggregates the 5-tuple (along with other connections between Apache and Oracle having other 5-tuples) as logically representing the same connection.
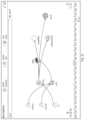
- FIG. 2 C depicts a portion of a logical polygraph.
- a datacenter has seven instances of the application update_engine 225 , executing as seven different processes on seven different machines, having seven different IP addresses, and using seven different ports.
- the instances of update_engine variously communicate with update.core-os.net 226 , which may have a single IP address or many IP addresses itself, over the one hour time period represented in the polygraph.
- update_engine is a client, connecting to the server update.core-os.net, as indicated by arrow 228 .
- Behaviors of the seven processes are clustered together, into a single summary. As indicated in region 227 , statistical information about the connections is also maintained (e.g., number of connections, histogram information, etc.).
- a polygraph such as is depicted in FIG. 2 C can be used to establish a baseline of behavior (e.g., at the one-hour level), allowing for the future detection of deviations from that baseline.
- a baseline of behavior e.g., at the one-hour level
- FIG. 2 D illustrates a portion of a polygraph for a service that evidences more complex behaviors than are depicted in FIG. 2 C .
- FIG. 2 D illustrates the behaviors of S3 as a service (as used by a particular customer datacenter).
- Clients within the datacenter variously connect to the S3 service using one of five fully qualified domains (listed in region 230 ).
- Contact with any of the domains is aggregated as contact with S3 (as indicated in region 231 ).
- Depicted in region 232 are various containers which (as clients) connect with S3. Other containers (which do not connect with S3) are not included.
- statistical information about the connections is known and summarized, such as the number of bytes transferred, histogram information, etc.
- FIG. 2 E illustrates a communication polygraph for a datacenter.
- the polygraph indicates a one hour summary of approximately 500 virtual machines, which collectively run one million processes, and make 100 million connections in that hour.
- a polygraph represents a drastic reduction in size (e.g., from tracking information on 100 million connections in an hour, to a few hundred nodes and a few hundred edges).
- the polygraph for the datacenter will tend to stay the same size (with the 100 virtual machines clustering into the same nodes that the 10 virtual machines previously clustered into).
- the polygraph may automatically scale to include behaviors involving those applications.
- nodes generally correspond to workers, and edges correspond to communications the workers engage in (with connection activity being the behavior modeled in polygraph 235 ).
- Another example polygraph could model other behavior, such as application launching.
- the communications graphed in FIG. 2 E include traffic entering the datacenter, traffic exiting the datacenter, and traffic that stays wholly within the datacenter (e.g., traffic between workers).
- One example of a node included in polygraph 235 is the sshd application, depicted as node 236 . As indicated in FIG. 2 E, 421 instances of sshd were executing during the one hour time period of data represented in polygraph 235 .
- nodes within the datacenter communicated with a total of 1349 IP addresses outside of the datacenter (and not otherwise accounted for, e.g., as belonging to a service such as Amazon AWS 238 or Slack 239 ).
- polygraph user B an administrator of datacenter 106
- data platform 12 For example, suppose that user B, an administrator of datacenter 106 , is interacting with data platform 12 to view visualizations of polygraphs in a web browser (e.g., as served to user B via web app 120 ).
- One type of polygraph user B can view is an application-communication polygraph, which indicates, for a given one hour window (or any other suitable time interval), which applications communicated with which other applications.
- Another type of polygraph user B can view is an application launch polygraph.
- User B can also view graphs related to user behavior, such as an insider behavior graph which tracks user connections (e.g., to internal and external applications, including chains of such behavior), a privilege change graph which tracks how privileges change between processes, and a user login graph, which tracks which (logical) machines a user logs into.
- FIG. 2 F illustrates an example of an application-communication polygraph for a datacenter (e.g., datacenter 106 ) for the one hour period of 9 am-10 am on June 5.
- the time slice currently being viewed is indicated in region 240 . If user B clicks his mouse in region 241 , user B will be shown a representation of the application-communication polygraph as generated for the following hour (10 am-11 am on June 5).
- FIG. 2 G depicts what is shown in user B's browser after he has clicked on region 241 , and has further clicked on region 242 .
- the selection in region 242 turns on and off the ability to compare two time intervals to one another.
- User B can select from a variety of options when comparing the 9 am-10 am and 10 am-11 am time intervals.
- region 248 By clicking region 248 , user B will be shown the union of both graphs (i.e., any connections that were present in either time interval).
- region 249 user B will be shown the intersection of both graphs (i.e., only those connections that were present in both time intervals).
- connection was made from a known bad external IP to nginx ( 255 ). The connection was not present during the 9 am-10 am time slice and thus is depicted in the second color.
- two different connections were made to a Slack service between 9 am and 11 am. However, the first was made by a first client during the 9 am-10 am time slice ( 256 ) and the second was made by a different client during the 10 am-11 am slice ( 257 ), and so the two connections are depicted respectively in the first and second colors and blue.
- FIG. 2 H illustrates the interface illustrated in FIG. 2 H .
- three applications containing the term “etcd” were engaged in communications during the 9 am-10 am window.
- One application is etcdctl, a command line client for etcd.
- a total of three different etcdctl processes were executed during the 9 am-10 am window, and were clustered together ( 260 ).
- FIG. 2 H also depicts two different clusters that are both named etcd2.
- the first cluster includes (for the 9 am-10 am window) five members ( 261 ) and the second cluster includes (for the same window) eight members ( 262 ).
- the reason for these two distinct clusters is that the two groups of applications behave differently (e.g., they exhibit two distinct sets of communication patterns). Specifically, the instances of etcd2 in cluster 261 only communicate with locksmithctl ( 263 ) and other etcd2 instances (in both clusters 261 and 262 ). The instances of etcd2 in cluster 262 communicate with additional entities, such as etcdctl and Docker containers.
- user B can click on one of the clusters (e.g., cluster 261 ) and be presented with summary information about the applications included in the cluster, as is shown in FIG. 2 I (e.g., in region 265 ). User B can also double click on a given cluster (e.g., cluster 261 ) to see details on each of the individual members of the cluster broken out.
- FIG. 2 J illustrates an example of a portion of a launch polygraph.
- user B has typed “find” into region 266 , to see how the “find” application is being launched.
- find applications 267
- bash 268
- systemd 269
- FIG. 2 K illustrates another example of a portion of an application launch polygraph.
- user B has searched ( 270 ) for “python ma” to see how “python marathon_lb” ( 271 ) is launched.
- python marathon_lb is launched as a result of a chain of the same seven applications each time. If python marathon_lb is ever launched in a different manner, this indicates anomalous behavior. The behavior could be indicative of malicious activities, but could also be due to other reasons, such as a misconfiguration, a performance-related issue, and/or a failure, etc.
- the insider behavior graph tracks information about behaviors such as processes started by a user interactively using protocols such as ssh or telnet, and any processes started by those processes.
- a first virtual machine in datacenter 106 e.g., using sshd via an external connection he makes from a hotel
- a first set of credentials e.g., first.last@example.com and an appropriate password
- the administrator connects to a second virtual machine (e.g., using the same credentials), then uses the sudo command to change identities to those of another user, and then launches a program.
- graphs built by data platform 12 can be used to associate the administrator with each of his actions, including launching the program using the identity of another user.
- FIG. 2 L illustrates an example of a portion of an insider behavior graph.
- user B is viewing a graph that corresponds to the time slice of 3 pm-4 pm on June 1.
- FIG. 2 L illustrates the internal/external applications that users connected to during the one hour time slice. If a user typically communicates with particular applications, that information will become part of a baseline. If the user deviates from his baseline behavior (e.g., using new applications, or changing privilege in anomalous ways), such anomalies can be surfaced.
- FIG. 2 M illustrates an example of a portion of a privilege change graph, which identifies how privileges are changed between processes.
- a process e.g., “ls”
- the process inherits the same privileges that the user has.
- a process can have fewer privileges than the user (i.e., go down in privilege), it is rare (and generally undesirable) for a user to escalate in privilege.
- Information included in the privilege change graph can be determined by examining the parent of each running process, and determining whether there is a match in privilege between the parent and the child. If the privileges are different, a privilege change has occurred (whether a change up or a change down).
- the application ntpd is one rare example of a scenario in which a process escalates ( 272 ) to root, and then returns back ( 273 ).
- the sudo command is another example (e.g., used by an administrator to temporarily have a higher privilege).
- ntpd's privilege change actions, and the legitimate actions of various administrators (e.g., using sudo) will be incorporated into a baseline model by data platform 12 .
- deviations occur such as where a new application that is not ntpd escalates privilege, or where an individual that has not previously/does not routinely use sudo does so, such behaviors can be identified as anomalous.
- FIG. 2 N illustrates an example of a portion of a user login graph, which identifies which users log into which logical nodes.
- Physical nodes (whether bare metal or virtualized) are clustered into a logical machine cluster, for example, using yet another graph, a machine-server graph, an example of which is shown in FIG. 2 O .
- a determination is made as to what type of machine it is, based on what kind(s) of workflows it runs.
- some machines run as master nodes (having a typical set of workflows they run, as master nodes) and can thus be clustered as master nodes.
- Worker nodes are different from master nodes, for example, because they run Docker containers, and frequently change as containers move around. Worker nodes can similarly be clustered.
- the polygraph depicted in FIG. 2 E corresponds to activities in a datacenter in which, in a given hour, approximately 500 virtual machines collectively run one million processes, and make 100 million connections in that hour.
- the polygraph represents a drastic reduction in size (e.g., from tracking information on 100 million connections in an hour, to a few hundred nodes and a few hundred edges).
- such a polygraph can be constructed (e.g., using commercially available computing infrastructure) in less than an hour (e.g., within a few minutes).
- ongoing hourly snapshots of a datacenter can be created within a two hour moving window (i.e., collecting data for the time period 8 am-9 am, while also generating a snapshot for the time previous time period 7 am-8 am).
- the following describes various example infrastructure that can be used in polygraph construction, and also describes various techniques that can be used to construct polygraphs.
- embodiments of data platform 12 may be built using any suitable infrastructure as a service (IaaS) (e.g., AWS).
- IaaS infrastructure as a service
- data platform 12 can use Simple Storage Service (S3) for data storage, Key Management Service (KMS) for managing secrets, Simple Queue Service (SQS) for managing messaging between applications, Simple Email Service (SES) for sending emails, and Route 53 for managing DNS.
- S3 Simple Storage Service
- KMS Key Management Service
- SQL Simple Queue Service
- SES Simple Email Service
- Route 53 for managing DNS.
- Other infrastructure tools can also be used.
- Examples include: orchestration tools (e.g., Kubernetes or Mesos/Marathon), service discovery tools (e.g., Mesos-DNS), service load balancing tools (e.g., marathon-LB), container tools (e.g., Docker or rkt), log/metric tools (e.g., collectd, fluentd, kibana, etc.), big data processing systems (e.g., Spark, Hadoop, AWS Redshift, Snowflake etc.), and distributed key value stores (e.g., Apache Zookeeper or etcd2).
- orchestration tools e.g., Kubernetes or Mesos/Marathon
- service discovery tools e.g., Mesos-DNS
- service load balancing tools e.g., marathon-LB
- container tools e.g., Docker or rkt
- log/metric tools e.g., collectd, fluentd, kibana, etc.
- big data processing systems e.g.
- data platform 12 may make use of a collection of microservices.
- Each microservice can have multiple instances, and may be configured to recover from failure, scale, and distribute work amongst various such instances, as applicable.
- microservices are auto-balancing for new instances, and can distribute workload if new instances are started or existing instances are terminated.
- microservices may be deployed as self-contained Docker containers.
- a Mesos-Marathon or Spark framework can be used to deploy the microservices (e.g., with Marathon monitoring and restarting failed instances of microservices as needed).
- the service etcd2 can be used by microservice instances to discover how many peer instances are running, and used for calculating a hash-based scheme for workload distribution.
- Microservices may be configured to publish various health/status metrics to either an SQS queue, or etcd2, as applicable.
- Amazon DynamoDB can be used for state management.
- Graph generator 146 is a microservice that may be responsible for generating raw behavior graphs on a per customer basis periodically (e.g., once an hour). In particular, graph generator 146 may generate graphs of entities (as the nodes in the graph) and activities between entities (as the edges). In various embodiments, graph generator 146 also performs other functions, such as aggregation, enrichment (e.g., geolocation and threat), reverse DNS resolution, TF-IDF based command line analysis for command type extraction, parent process tracking, etc.
- Graph generator 146 may perform joins on data collected by the agents, so that both sides of a behavior are linked. For example, suppose a first process on a first virtual machine (e.g., having a first IP address) communicates with a second process on a second virtual machine (e.g., having a second IP address). Respective agents on the first and second virtual machines may each report information on their view of the communication (e.g., the PID of their respective processes, the amount of data exchanged and in which direction, etc.).
- the graph When graph generator performs a join on the data provided by both agents, the graph will include a node for each of the processes, and an edge indicating communication between them (as well as other information, such as the directionality of the communication—i.e., which process acted as the server and which as the client in the communication).
- connections are process to process (e.g., from a process on one virtual machine within the cloud environment associated with entity A to another process on a virtual machine within the cloud environment associated with entity A).
- a process may be in communication with a node (e.g., outside of entity A) which does not have an agent deployed upon it.
- a node within entity A might be in communication with node 172 , outside of entity A.
- communications with node 172 are modeled (e.g., by graph generator 146 ) using the IP address of node 172 .
- the IP address of the node can be used by graph generator in modeling.
- Graphs created by graph generator 146 may be written to data store 30 and cached for further processing.
- a graph may be a summary of all activity that happened in a particular time interval. As each graph corresponds to a distinct period of time, different rows can be aggregated to find summary information over a larger timestamp. In some examples, picking two different graphs from two different timestamps can be used to compare different periods. If necessary, graph generator can parallelize its workload (e.g., where its backlog cannot otherwise be handled within a particular time period, such as an hour, or if is required to process a graph spanning a long time period).
- Graph generator 146 can be implemented in any appropriate programming language, such as Java or C, and machine learning libraries, such as Spark's MLLib.
- Example ways that graph generator computations can be implemented include using SQL or Map-R, using Spark or Hadoop.
- SSH tracker 148 is a microservice that may be responsible for following ssh connections and process parent hierarchies to determine trails of user ssh activity. Identified ssh trails are placed by the SSH tracker 148 into data store 30 and cached for further processing.
- SSH tracker 148 can be implemented in any appropriate programming language, such as Java or C, and machine libraries, such as Spark's MLLib.
- Example ways that SSH tracker computations can be implemented include using SQL or Map-R, using Spark or Hadoop.
- Threat aggregator 150 is a microservice that may be responsible for obtaining third party threat information from various applicable sources, and making it available to other microservices. Examples of such information include reverse DNS information, GeoIP information, lists of known bad domains/IP addresses, lists of known bad files etc. As applicable, the threat information is normalized before insertion into data store 30 . Threat aggregator 150 can be implemented in any appropriate programming language, such as Java or C, using SQL/JDBC libraries to interact with data store 30 (e.g., for insertions and queries).
- Scheduler 152 is a microservice that may act as a scheduler and that may run arbitrary jobs organized as a directed graph. In some examples, scheduler 152 ensures that all jobs for all customers are able to run during at a given time interval (e.g., every hour). Scheduler 152 may handle errors and retrying for failed jobs, track dependencies, manage appropriate resource levels, and/or scale jobs as needed. Scheduler 152 can be implemented in any appropriate programming language, such as Java or C. A variety of components can also be used, such as open source scheduler frameworks (e.g., Airflow), or AWS services (e.g., the AWS Data pipeline) which can be used for managing schedules.
- open source scheduler frameworks e.g., Airflow
- AWS services e.g., the AWS Data pipeline
- Graph Behavior Modeler (GBM) 154 is a microservice that may compute polygraphs.
- GBM 154 can be used to find clusters of nodes in a graph that should be considered similar based on some set of their properties and relationships to other nodes. As described herein, the clusters and their relationships can be used to provide visibility into a datacenter environment without requiring user specified labels. GBM 154 may track such clusters over time persistently, allowing for changes to be detected and alerts to be generated.
- GBM 154 may take as input a raw graph (e.g., as generated by graph generator 146 ).
- Nodes are actors of a behavior, and edges are the behavior relationship itself.
- example actors include processes, which communicate with other processes.
- the GBM 154 clusters the raw graph based on behaviors of actors and produces a summary (the polygraph).
- the polygraph summarizes behavior at a datacenter level.
- the GBM also produces “observations” that represent changes detected in the datacenter. Such observations may be based on differences in cumulative behavior (e.g., the baseline) of the datacenter with its current behavior.
- the GBM 154 can be implemented in any appropriate programming language, such as Java, C, or Golang, using appropriate libraries (as applicable) to handle distributed graph computations (handling large amounts of data analysis in a short amount of time).
- Apache Spark is another example tool that can be used to compute polygraphs.
- the GBM can also take feedback from users and adjust the model according to that feedback. For example, if a given user is interested in relearning behavior for a particular entity, the GBM can be instructed to “forget” the implicated part of the polygraph.
- GBM runner 156 is a microservice that may be responsible for interfacing with GBM 154 and providing GBM 154 with raw graphs (e.g., using a query language, such as SQL, to push any computations it can to data store 30 ). GBM runner 156 may also insert polygraph output from GBM 154 to data store 30 . GBM runner 156 can be implemented in any appropriate programming language, such as Java or C, using SQL/JDBC libraries to interact with data store 30 to insert and query data.
- a query language such as SQL
- Alert generator 158 is a microservice that may be responsible for generating alerts. Alert generator 158 may examine observations (e.g., produced by GBM 154 ) in aggregate, deduplicate them, and score them. Alerts may be generated for observations with a score exceeding a threshold. Alert generator 158 may also compute (or retrieves, as applicable) data that a customer (e.g., user A or user B) might need when reviewing the alert. Examples of events that can be detected by data platform 12 (and alerted on by alert generator 158 ) include, but are not limited to the following:
- This event may be created the first time a user (e.g., of node 116 ) is first observed by an agent within a datacenter.
- This event may be generated when an interactive user launches an application for the first time.
- This event may be generated when user privileges are escalated and a new application is run.
- This event may be generated when an application or container is seen for the first time.
- This event may be generated when a connection to an external IP/domain is made from a new application.
- This event may be generated when a new external host or IP is involved in a connection with a datacenter.
- This event may be generated when a connection between internal-only applications is seen for the first time.
- This event may be generated when a new external connection is seen for an application which typically does not have external connections.
- This event may be generated when an application is launched by a different parent.
- Data platform 12 maintains (or can otherwise access) one or more reputation feeds. If an environment makes a connection to a known bad IP or domain, an event will be generated.
- An event may be generated when a successful connection to a datacenter from a known bad IP is observed by data platform 12 .
- Alert generator 158 can be implemented in any appropriate programming language, such as Java or C, using SQL/JDBC libraries to interact with data store 30 to insert and query data. In various embodiments, alert generator 158 also uses one or more machine learning libraries, such as Spark's MLLib (e.g., to compute scoring of various observations). Alert generator 158 can also take feedback from users about which kinds of events are of interest and which to suppress.
- any appropriate programming language such as Java or C
- SQL/JDBC libraries to interact with data store 30 to insert and query data.
- alert generator 158 also uses one or more machine learning libraries, such as Spark's MLLib (e.g., to compute scoring of various observations). Alert generator 158 can also take feedback from users about which kinds of events are of interest and which to suppress.
- QsJobServer 160 is a microservice that may look at all the data produced by data platform 12 for an hour, and compile a materialized view (MV) out of the data to make queries faster.
- the MV helps make sure that the queries customers most frequently run, and data that they search for, can be easily queried and answered.
- QsJobServer 160 may also precompute and cache a variety of different metrics so that they can quickly be provided as answers at query time.
- QsJobServer 160 can be implemented using any appropriate programming language, such as Java or C, using SQL/JDBC libraries.
- QsJobServer 160 is able to compute an MV efficiently at scale, where there could be a large number of joins.
- An SQL engine such as Oracle, can be used to efficiently execute the SQL, as applicable.
- Alert notifier 162 is a microservice that may take alerts produced by alert generator 158 and send them to customers' integrated Security Information and Event Management (SIEM) products (e.g., Splunk, Slack, etc.).
- SIEM Security Information and Event Management
- Alert notifier 162 can be implemented using any appropriate programming language, such as Java or C.
- Alert notifier 162 can be configured to use an email service (e.g., AWS SES or pagerduty) to send emails.
- Alert notifier 162 may also provide templating support (e.g., Velocity or Moustache) to manage templates and structured notifications to SIEM products.
- Reporting module 164 is a microservice that may be responsible for creating reports out of customer data (e.g., daily summaries of events, etc.) and providing those reports to customers (e.g., via email). Reporting module 164 can be implemented using any appropriate programming language, such as Java or C. Reporting module 164 can be configured to use an email service (e.g., AWS SES or pagerduty) to send emails. Reporting module 164 may also provide templating support (e.g., Velocity or Moustache) to manage templates (e.g., for constructing HTML-based email).
- templating support e.g., Velocity or Moustache
- Web app 120 is a microservice that provides a user interface to data collected and processed on data platform 12 .
- Web app 120 may provide login, authentication, query, data visualization, etc. features.
- Web app 120 may, in some embodiments, include both client and server elements.
- Example ways the server elements can be implemented are using Java DropWizard or Node.Js to serve business logic, and a combination of JSON/HTTP to manage the service.
- Example ways the client elements can be implemented are using frameworks such as React, Angular, or Backbone. JSON, jQuery, and JavaScript libraries (e.g., underscore) can also be used.
- Query service 166 is a microservice that may manage all database access for web app 120 .
- Query service 166 abstracts out data obtained from data store 30 and provides a JSON-based REST API service to web app 120 .
- Query service 166 may generate SQL queries for the REST APIs that it receives at run time.
- Query service 166 can be implemented using any appropriate programming language, such as Java or C and SQL/JDBC libraries, or an SQL framework such as jOOQ.
- Query service 166 can internally make use of a variety of types of databases, including a relational database engine 168 (e.g., AWS Aurora) and/or data store 30 to manage data for clients. Examples of tables that query service 166 manages are OLTP tables and data warehousing tables.
- Cache 170 may be implemented by Redis and/or any other service that provides a key-value store.
- Data platform 12 can use cache 170 to keep information for frontend services about users. Examples of such information include valid tokens for a customer, valid cookies of customers, the last time a customer tried to login, etc.
- FIG. 3 A illustrates an example of a process for detecting anomalies in a network environment.
- process 300 is performed by data platform 12 .
- the process begins at 301 when data associated with activities occurring in a network environment (such as entity A's datacenter) is received.
- data associated with activities occurring in a network environment such as entity A's datacenter
- agent-collected data described above (e.g., in conjunction with process 200 ).
- a logical graph model is generated, using at least a portion of the monitored activities.
- a variety of approaches can be used to generate such logical graph models, and a variety of logical graphs can be generated (whether using the same, or different approaches).
- the following is one example of how data received at 301 can be used to generate and maintain a model.
- data platform 12 creates an aggregate graph of physical connections (also referred to herein as an aggregated physical graph) by matching connections that occurred in the first hour into communication pairs. Clustering is then performed on the communication pairs. Examples of such clustering, described in more detail below, include performing Matching Neighbor clustering and similarity (e.g., SimRank) clustering. Additional processing can also be performed (and is described in more detail below), such as by splitting clusters based on application type, and annotating nodes with DNS query information.
- the resulting graph (also referred to herein as a base graph or common graph) can be used to generate a variety of models, where a subset of node and edge types (described in more detail below) and their properties are considered in a given model.
- UID to UID model also referred to herein as a Uid2Uid model
- CType model which clusters together processes that share command line similarity
- PType model which clusters together processes that share behaviors over time.
- the cumulative graph (also referred to herein as a cumulative PType graph and a polygraph) is a running model of how processes behave over time. Nodes in the cumulative graph are PType nodes, and provide information such as a list of all active processes and PIDs in the last hour, the number of historic total processes, the average number of active processes per hour, the application type of the process (e.g., the CType of the PType), and historic CType information/frequency.
- Edges in the cumulative graph can represent connectivity and provide information such as connectivity frequency.
- the edges can be weighted (e.g., based on number of connections, number of bytes exchanged, etc.).
- Edges in the cumulative graph (and snapshots) can also represent transitions.
- One approach to merging a snapshot of the activity of the last hour into a cumulative graph is as follows. An aggregate graph of physical connections is made for the connections included in the snapshot (as was previously done for the original snapshot used during bootstrap). And, clustering/splitting is similarly performed on the snapshot's aggregate graph. Next, PType clusters in the snapshot's graph are compared against PType clusters in the cumulative graph to identify commonality.
- One approach to determining commonality is, for any two nodes that are members of a given CmdType (described in more detail below), comparing internal neighbors and calculating a set membership Jaccard distance. The pairs of nodes are then ordered by decreasing similarity (i.e., with the most similar sets first). For nodes with a threshold amount of commonality (e.g., at least 66% members in common), any new nodes (i.e., appearing in the snapshot's graph but not the cumulative graph) are assigned the same PType identifier as is assigned to the corresponding node in the cumulative graph.
- a threshold amount of commonality e.g., at least 66% members in common
- a network signature is generated (i.e., indicative of the kinds of network connections the node makes, who the node communicates with, etc.). The following processing is then performed until convergence. If a match of the network signature is found in the cumulative graph, the unclassified node is assigned the PType identifier of the corresponding node in the cumulative graph. Any nodes which remain unclassified after convergence are new PTypes and are assigned new identifiers and added to the cumulative graph as new. As applicable, the detection of a new PType can be used to generate an alert. If the new PType has a new CmdType, a severity of the alert can be increased.
- any surviving nodes i.e., present in both the cumulative graph and the snapshot graph
- PTypes change is noted as a transition, and an alert can be generated.
- a surviving node changes PType and also changes CmdType, a severity of the alert can be increased.
- Changes to the cumulative graph can be used (e.g., at 303 ) to detect anomalies (described in more detail below).
- anomalies Two example kinds of anomalies that can be detected by data platform 12 include security anomalies (e.g., a user or process behaving in an unexpected manner) and devops/root cause anomalies (e.g., network congestion, application failure, etc.).
- Detected anomalies can be recorded and surfaced (e.g., to administrators, auditors, etc.), such as through alerts which are generated at 304 based on anomaly detection.
- an aggregated physical graph can be generated on a per customer basis periodically (e.g., once an hour) from raw physical graph information, by matching connections (e.g., between two processes on two virtual machines).
- a deterministic fixed approach is used to cluster nodes in the aggregated physical graph (e.g., representing processes and their communications).
- Matching Neighbors Clustering MNC can be performed on the aggregated physical graph to determine which entities exhibit identical behavior and cluster such entities together.
- FIG. 3 B depicts a set of example processes (p1, p2, p3, and p4) communicating with other processes (p10 and p11).
- FIG. 3 B is a graphical representation of a small portion of an aggregated physical graph showing (for a given time period, such as an hour) which processes in a datacenter communicate with which other processes.
- processes p1, p2, and p3 will be clustered together ( 305 ), as they exhibit identical behavior (they communicate with p10 and only p10).
- Process p4 which communicates with both p10 and p11, will be clustered separately.
- MNC massive Network Control Network
- an alternate clustering approach can also/instead be used, which uses a similarity measure (e.g., constrained by a threshold value, such as a 60% similarity) to cluster items.
- a similarity measure e.g., constrained by a threshold value, such as a 60% similarity
- the output of MNC is used as input to SimRank, in other embodiments, MNC is omitted.
- FIG. 3 C depicts a set of example processes (p4, p5, p6) communicating with other processes (p7, p8, p9).
- process p4 communicates with process p7 ( 310 ), process p8 ( 311 ), and process p9 ( 312 ).
- An exception is process p6, which communicates with processes p7 and p8, but does not communicate with process p9 (as indicated by dashed line 313 ). If MNC were applied to the nodes depicted in FIG. 3 C , nodes p4 and p5 would be clustered (and node p6 would not be included in their cluster).
- One approach to similarity clustering is to use SimRank.
- I(v) and O(v) denote the respective set of in-neighbors and out-neighbors of v.
- Individual in-neighbors are denoted as I i (v), for 1 ⁇ i ⁇
- the similarity between two objects a and b can be denoted by s(a,b) ⁇ [1,0].
- the SimRank equations for a graph G can be solved by iteration to a fixed point.
- n is the number of nodes in G.
- s k (*,*) are kept, where s k (a,b) gives the score between a and b on iteration k.
- Successive computations of s k+1 (*,*) are made based on s k (*,*). Starting with so(*,*), where each so(a,b) is a lower bound on the actual SimRank score
- the similarity of (a,b) is updated using the similarity scores of the neighbors of (a,b) from the previous iteration k according to the SimRank equation.
- the values s k (*,*) are nondecreasing as k increases.
- FIG. 3 D depicts a set of processes, and in particular server processes s1 and s2, and client processes c1, c2, c3, c4, c5, and c6.
- server processes s1 and s2 and client processes c1, c2, c3, c4, c5, and c6.
- client processes c1, c2, c3, c4, c5, and c6 are present in the graph depicted in FIG. 3 D (and the other nodes depicted are omitted from consideration).
- nodes s1 and s2 would be clustered together, as would nodes c1 and c2.
- SimRank clustering as described above would also result in those two clusters (s1 and s2, and c1 and c2).
- identical behavior is required.
- MNC would not include c3 in a cluster with c2 and c1 because node c3 only communicates with node s2 and not node s1.
- a SimRank clustering of a graph that includes nodes s1, s2, c1, c2, and c3 would result (based, e.g., on an applicable selected decay value and number of iterations) in a first cluster comprising nodes s1 and s2, and a second cluster of c1, c2, and c3.
- nodes s1 and s2 will become decreasingly similar (i.e., their intersection is reduced).
- SimRank is modified (from what is described above) to accommodate differences between the asymmetry of client and server connections.
- SimRank can be modified to use different thresholds for client communications (e.g., an 80% match among nodes c1-c6) and for server communications (e.g., a 60% match among nodes s1 and s2).
- client communications e.g., an 80% match among nodes c1-c6
- server communications e.g., a 60% match among nodes s1 and s2
- Such modification can also help achieve convergence in situations such as where a server process dies on one node and restarts on another node.
- MNC/SimRank to an aggregated physical graph results in a smaller graph, in which processes which are determined to be sufficiently similar are clustered together.
- clusters generated as output of MNC will be underinclusive.
- process p6 will not be included in a cluster with processes p4 and p5, despite substantial similarity in their communication behaviors.
- SimRank e.g., to the output of MNC helps mitigate the underinclusiveness of MNC, but can result in overly inclusive clusters. As one example, suppose (returning to the nodes depicted in FIG.
- nodes p1-p4 are all included in a single cluster.
- Both MNC and SimRank operate agnostically of which application a given process belongs to.
- processes p1-p3 each correspond to a first application (e.g., an update engine), and process p4 corresponds to a second application (e.g., sshd).
- process p10 corresponds to contact with AWS.
- Clustering all four of the processes together could be problematic, particularly in a security context (e.g., where granular information useful in detecting threats would be lost).
- data platform 12 may maintain a mapping between processes and the applications to which they belong.
- the output of SimRank e.g., SimRank clusters
- SimRank clusters is split based on the applications to which cluster members belong (such a split is also referred to herein as a “CmdType split”). If all cluster members share a common application, the cluster remains. If different cluster members originate from different applications, the cluster members are split along application-type (CmdType) lines.
- CmdType application-type
- node c4 belongs to “ssh,” and suppose that node c6 belongs to “bash.”
- all six nodes (c1-c6) might be clustered into a single cluster.
- the single cluster will be broken into three clusters (c1, c2, c3, c5; c4; and c6).
- the resulting clusters comprise processes associated with the same type of application, which exhibit similar behaviors (e.g., communication behaviors).
- Each of the three clusters resulting from the CmdType split represents, respectively, a node (also referred to herein as a PType) of a particular CmdType.
- Each PType is given a persistent identifier and stored persistently as a cumulative graph.
- a variety of approaches can be used to determine a CmdType for a given process.
- a one-to-one mapping exists between the CmdType and the application/binary name.
- processes corresponding to the execution of sshd will be classified using a CmdType of sshd.
- a list of common application/binary names e.g., sshd, apache, etc. is maintained by data platform 12 and manually curated as applicable.
- command line/execution path information can be used in determining a CmdType.
- the subapplication can be used as the CmdType of the application, and/or term frequency analysis (e.g., TF/IDF) can be used on command line information to group, for example, any marathon related applications together (e.g., as a python.marathon CmdType) and separately from other Python applications (e.g., as a python.airflow CmdType).
- TF/IDF term frequency analysis
- machine learning techniques are used to determine a CmdType.
- the CmdType model is constrained such that the execution path for each CmdType is unique.
- One example approach to making a CmdType model is a random forest based approach.
- An initial CmdType model is bootstrapped using process parameters (e.g., available within one minute of process startup) obtained using one hour of information for a given customer (e.g., entity A). Examples of such parameters include the command line of the process, the command line of the process's parent(s) (if applicable), the uptime of the process, UID/EUID and any change information, TTY and any change information, listening ports, and children (if any).
- Another approach is to perform term frequency clustering over command line information to convert command lines into cluster identifiers.
- the random forest model can be used (e.g., in subsequent hours) to predict a CmdType for a process (e.g., based on features of the process). If a match is found, the process can be assigned the matching CmdType. If a match is not found, a comparison between features of the process and its nearest CmdType (e.g., as determined using a Levenstein distance) can be performed.
- the existing CmdType can be expanded to include the process, or, as applicable, a new CmdType can be created (and other actions taken, such as generating an alert).
- Another approach to handling processes which do not match an existing CmdType is to designate such processes as unclassified, and once an hour, create a new random forest seeded with process information from a sampling of classified processes (e.g., 10 or 100 processes per CmdType) and the new processes. If a given new process winds up in an existing set, the process is given the corresponding CmdType. If a new cluster is created, a new CmdType can be created.
- a sampling of classified processes e.g. 10 or 100 processes per CmdType
- a polygraph represents the smallest possible graph of clusters that preserve a set of rules (e.g., in which nodes included in the cluster must share a CmdType and behavior).
- SimRank and cluster splitting (e.g., CmdType splitting) many processes are clustered together based on commonality of behavior (e.g., communication behavior) and commonality of application type.
- Such clustering represents a significant reduction in graph size (e.g., compared to the original raw physical graph). Nonetheless, further clustering can be performed (e.g., by iterating on the graph data using the GBM to achieve such a polygraph). As more information within the graph is correlated, more nodes can be clustered together, reducing the size of the graph, until convergence is reached and no further clustering is possible.
- FIG. 3 E depicts two pairs of clusters.
- cluster 320 represents a set of client processes sharing the same CmdType (“a1”), communicating (collectively) with a server process having a CmdType (“a2”).
- Cluster 322 also represents a set of client processes having a CmdType a1 communicating with a server process having a CmdType a2.
- the nodes in clusters 320 and 322 (and similarly nodes in 321 and 323 ) remain separately clustered (as depicted) after MNC/SimRank/CmdType splitting—isolated islands.
- server process 321 corresponds to processes executing on a first machine (having an IP address of 1.1.1.1).
- the machine fails and a new server process 323 starts, on a second machine (having an IP address of 2.2.2.2) and takes over for process 321 .
- Communications between a cluster of nodes (e.g., nodes of cluster 320 ) and the first IP address can be considered different behavior from communications between the same set of nodes and the second IP address, and thus communications 324 and 325 will not be combined by MNC/SimRank in various embodiments. Nonetheless, it could be desirable for nodes of clusters 320 / 322 to be combined (into cluster 326 ), and for nodes of clusters 321 / 323 to be combined (into cluster 327 ), as representing (collectively) communications between a1 and a2.
- One task that can be performed by data platform 12 is to use DNS query information to map IP addresses to logical entities.
- GBM 154 can make use of the DNS query information to determine that graph nodes of cluster 320 and graph nodes of cluster 322 both made DNS queries for “appserverabc.example.com,” which first resolved to 1.1.1.1 and then to 2.2.2.2, and to combine nodes 320 / 322 and 321 / 323 together into a single pair of nodes ( 326 communicating with 327 ).
- GBM 154 operates in a batch manner in which it receives as input the nodes and edges of a graph for a particular time period along with its previous state, and generates as output clustered nodes, cluster membership edges, cluster-to-cluster edges, events, and its next state.
- GBM 154 may not try to consider all types of entities and their relationships that may be available in a conceptual common graph all at once. Instead, GBM uses a concept of models where a subset of node and edge types and their properties are considered in a given model. Such an approach is helpful for scalability, and also to help preserve detailed information (of particular importance in a security context)—as clustering entities in a more complex and larger graph could result in less useful results. In particular, such an approach allows for different types of relationships between entities to be preserved/more easily analyzed.
- GBM 154 can be used with different models corresponding to different subgraphs, core abstractions remain the same across types of models.
- each node type in a GBM model is considered to belong to a class.
- the class can be thought of as a way for the GBM to split nodes based on the criteria it uses for the model.
- the class for a node is represented as a string whose value is derived from the node's key and properties depending on the GBM Model. Note that different GBM models may create different class values for the same node.
- GBM 154 can generate clusters of nodes for that type.
- a GBM generated cluster for a given member node type cannot span more than one class for that node type.
- GBM 154 generates edges between clusters that have the same types as the edges between source and destination cluster node types.
- the node types and the edge types may correspond to existing types in the common graph node and edge tables but this is not necessary. Even when there is a correspondence, the properties provided to GBM 154 are not limited to the properties that are stored in the corresponding graph table entries. They can be enriched with additional information before being passed to GBM 154 .
- Edge triplets can be expressed, for example, as an array of source node type, edge type, and destination node type. And, each node type is associated with node properties, and each edge type is associated with edge properties. Other edge triplets can also be used (and/or edge triplets can be extended) in accordance with various embodiments.
- the physical input to the GBM model need not (and does not, in various embodiments) conform to the logical input.
- the edges in the PtypeConn model correspond to edges between Matching Neighbors (MN) clusters, where each process node has an MN cluster identifier property.
- MN Matching Neighbors
- Uid2Uid model edges are not explicitly provided separately from nodes (as the euid array in the node properties serves the same purpose). In both cases, however, the physical information provides the applicable information necessary for the logical input.
- the state input for a particular GBM model can be stored in a file, a database, or other appropriate storage.
- the state file (from a previous run) is provided, along with graph data, except for when the first run for a given model is performed, or the model is reset. In some cases, no data may be available for a particular model in a given time period, and GBM may not be run for that time period. As data becomes available at a future time, GBM can run using the latest state file as input.
- GBM 154 outputs cluster nodes, cluster membership edges, and inter-cluster relationship edges that are stored (in some embodiments) in the graph node tables: node_c, node_cm, and node_icr, respectively.
- the type names of nodes and edges may conform to the following rules:
- GBM 154 can generate: new class, new cluster, new edge from class to class, split class (the notion that GBM 154 considers all nodes of a given type and class to be in the same cluster initially and if GBM 154 splits them into multiple clusters, it is splitting a class), new edge from cluster and class, new edge between cluster and cluster, and/or new edge from class to cluster.
- split class the notion that GBM 154 considers all nodes of a given type and class to be in the same cluster initially and if GBM 154 splits them into multiple clusters, it is splitting a class
- new edge from cluster and class new edge between cluster and cluster, and/or new edge from class to cluster.
- One underlying node or edge in the logical input can cause multiple types of events to be generated. Conversely, one event can correspond to multiple nodes or edges in the input. Not every model generates every event type.
- a PTypeConn Model clusters nodes of the same class that have similar connectivity relationships. For example, if two processes had similar incoming neighbors of the same class and outgoing neighbors of the same class, they could be clustered.
- the node input to the PTypeConn model for a given time period includes non-interactive (i.e., not associated with tty) process nodes that had connections in the time period and the base graph nodes of other types (IP Service Endpoint (IPSep) comprising an IP address and a port), DNS Service Endpoint (DNSSep) and IPAddress) that have been involved in those connections.
- IP Service Endpoint IP Service Endpoint
- DNSSep DNS Service Endpoint
- IPAddress IP Address Resolution Protocol
- the edge inputs to this model are the ConnectedTo edges from the MN cluster, instead of individual node-to-node ConnectedTo edges from the base graph.
- the membership edges created by this model refer to the base graph node type provided in the input.
- nodes are determined as follows depending on the node type (e.g., Process nodes, IPSep nodes, DNSSep nodes, and IP Address nodes).
- node type e.g., Process nodes, IPSep nodes, DNSSep nodes, and IP Address nodes.
- IPAddress nodes (will appear only on client side):
- IPIntC IPIntC
- a new class event in this model for a process node is equivalent to seeing a new CType being involved in a connection for the first time. Note that this does not mean the CType was not seen before. It is possible that it was previously seen but did not make a connection at that time.
- a new class event in this model for a DNSSep node is equivalent to seeing a connection to a new domain for the first time.
- a new class to class to edge from a class for a process node to a class for a process node is equivalent to seeing a communication from the source CType making a connection to the destination CType for the first time.
- a new class to class to edge from a class for a process node to a class for a DNSSep node is equivalent to seeing a communication from the source CType making a connection to the destination domain name for the first time.
- An IntPConn Model may be similar to the PtypeConn Model, except that connection edges between parent/child processes and connections between processes where both sides are not interactive are filtered out.
- a Uid2Uid Model may cluster processes with the same username that show similar privilege change behavior. For instance, if two processes with the same username had similar effective user values, launched processes with similar usernames, and were launched by processes with similar usernames, then they could be clustered.
- An edge between a source cluster and destination cluster generated by this model means that all of the processes in the source cluster had a privilege change relationship to at least one process in the destination cluster.
- the node input to this model for a given time period includes process nodes that are running in that period.
- the value of a class of process nodes is “ ⁇ username>”.
- the base relationship that is used for clustering is privilege change, either by the process changing its effective user ID, or by launching a child process which runs with a different user.
- the physical input for this model includes process nodes (only), with the caveat that the complete ancestor hierarchy of process nodes active (i.e., running) for a given time period is provided as input even if an ancestor is not active in that time period.
- process nodes only
- the complete ancestor hierarchy of process nodes active i.e., running
- effective user IDs of a process are represented as an array in the process node properties, and launch relationships are available from ppid_hash fields in the properties as well.
- a new class event in this model is equivalent to seeing a user for the first time.
- a new class to class edge event is equivalent to seeing the source user making a privilege change to the destination user for the first time.
- a Ct2Ct Model may cluster processes with the same CType that show similar launch behavior. For instance, if two processes with the same CType have launched processes with similar CTypes, then they could be clustered.
- the node input to this model for a given time period includes process nodes that are running in that period.
- the value class of process nodes is CType (similar to how it is created for the PtypeConn Model).
- the base relationship that is used for clustering is a parent process with a given CType launching a child process with another given destination CType.
- the physical input for this model includes process nodes (only) with the caveat that the complete ancestor hierarchy active process nodes (i.e., that are running) for a given time period is provided as input even if an ancestor is not active in that time period. Note that launch relationships are available from ppid_hash fields in the process node properties.
- An edge between a source cluster and destination cluster generated by this model means that all of the processes in the source cluster launched at least one process in the destination cluster.
- a new class event in this model is equivalent to seeing a CType for the first time. Note that the same type of event will be generated by the PtypeConn Model as well.
- a new class to class edge event is equivalent to seeing the source CType launching the destination CType for the first time.
- An MTypeConn Model may cluster nodes of the same class that have similar connectivity relationships. For example, if two machines had similar incoming neighbors of the same class and outgoing neighbors of the same class, they could be clustered.
- a new class event in this model will be generated for external IP addresses or (as applicable) domain names seen for the first time. Note that a new class to class to edge Machine, class to class for an IPSep or DNSName node will also be generated at the same time.
- the membership edges generated by this model will refer to Machine, IPAddress, DNSName, and IPSep nodes in the base graph. Though the nodes provided to this model are IPAddress nodes instead of IPSep nodes, the membership edges it generates will refer to IPSep type nodes. Alternatively, the base graph can generate edges between Machine and IPSep node types. Note that the Machine to IPAddress edges have tcp_dst_ports/udp_dst_ports properties that can be used for this purpose.
- the node input to this model for a given time period includes machine nodes that had connections in the time period and the base graph nodes of other types (IPAddress and DNSName) that were involved in those connections.
- the base relationship is the connectivity relationship for the following type triplets:
- the edge inputs to this model are the corresponding ConnectedTo edges in the base graph.
- the class value for all Machine nodes is “Machine.”
- the machine_terms property in the Machine nodes is used, in various embodiments, for labeling machines that are clustered together. If a majority of the machines clustered together share a term in the machine_terms, that term can be used for labeling the cluster.
- the class value for IPSep nodes is determined as follows:
- the class value for IpAddress nodes is determined as follows:
- the class value for DNSName nodes is determined as follows:
- the key field for this event type looks as follows (using the PtypeConn model as an example):
- GBM 154 generates multiple events of this type for the same class value.
- the set_size indicates the size of the cluster referenced in the keys field.
- NewClass events can be generated if there is more than one cluster in that class. NewNode events will not be generated separately in this case.
- the key field for this event type looks as follows (using the PtypeConn model as an example):
- the key field contains source and destination class values and also source and destination cluster identifiers (i.e., the src/dst_node:key.cid represents the src/dst cluster identifier).
- an event of this type could involve multiple edges between different cluster pairs that have the same source and destination class values.
- GBM 154 can generate multiple events in this case with different source and destination cluster identifiers.
- the source and destination sizes represent the sizes of the clusters given in the keys field.
- NewClassToClass events can be generated if there are more than one pair of clusters in that class pair. NewNodeToNode events are not generated separately in this case.
- NewClass events with the same model and class can be output if there are multiple clusters in that new class.
- Multiple NewEdgeNodeToClass events with the same model and destination class can be output if there are multiple new edges from the source cluster to the destination clusters in that destination class (the first time seeing this class as a destination cluster class for the source cluster).
- Multiple NewEdgeClassToNode events with the same model and source class can be output if there are multiple new edges from source clusters to the destination clusters in that source class (the first time seeing this class as a source cluster class for the destination cluster).
- These events may be combined at the class level and treated as a single event when it is desirable to view changes at the class level, e.g., when one wants to know when there is a new CType.
- different models may have partial overlap in the types of nodes they use from the base graph. Therefore, they can generate NewClass type events for the same class. NewClass events can also be combined across models when it is desirable to view changes at the class level.
- actions can be associated with processes and (e.g., by associating processes with users) actions can thus also be associated with extended user sessions.
- Extended user session tracking can also be useful in operational use cases without malicious intent, e.g., where users make original logins with distinct usernames (e.g., “charlie” or “dave”) but then perform actions under a common username (e.g., “admin” or “support”).
- users with administrator privileges exist, and they need to gain superuser privilege to perform a particular type of maintenance.
- extended user session tracking It may be desirable to know which operations are performed (as the superuser) by which original user when debugging issues.
- ssh secure shell
- extended user session tracking is not limited to the ssh protocol or a particular limitation and the techniques described herein can be extended to other login mechanisms.
- any given machine there will be a process that listens for and accepts ssh connections on a given port.
- This process can run the openssh server program running in daemon mode or it could be running another program (e.g., initd on a Linux system). In either case, a new process running openssh will be created for every new ssh login session and this process can be used to identify an ssh session on that machine. This process is called the “privileged” process in openssh.
- each process has a parent process (except for the very first process) and when a new process is created the parent process is known.
- parent-child hierarchy of processes By tracking the parent-child hierarchy of processes, one can determine if a particular process is a descendant of a privileged openssh process and thus if it is associated with an ssh login session.
- FIG. 3 F is a representation of a user logging into a first machine and then into a second machine from the first machine, as well as information associated with such actions.
- a user Charlie logs into Machine A ( 331 ) from a first IP address ( 332 ).
- a username 333
- an openssh privileged process 334
- a terminal session is created and a bash process ( 335 ) is created as a child.
- Charlie launches an ssh client ( 336 ) from the shell, and uses it to connect ( 337 ) to Machine B ( 338 ).
- FIG. 3 G is an alternate representation of actions occurring in FIG. 3 F , where events occurring on Machine A are indicated along line 350 , and events occurring on Machine B are indicated along line 351 .
- an incoming ssh connection is received at Machine A ( 352 ).
- Charlie logs in (as user “x”) and an ssh privileged process is created to handle Charlie's connection ( 353 ).
- a terminal session is created and a bash process is created ( 354 ) as a child of process 353 .
- Charlie logs into Machine B, and an ssh privileged process is created to handle Charlie's connection ( 357 ).
- a terminal session is created and a bash process is created ( 358 ) as a child of process 357 .
- Charlie then executes curl ( 359 ) to download content from an external domain (via connection 360 ).
- the external domain could be a malicious domain, or it could be benign.
- the external domain is malicious (and, e.g., Charlie has malicious intent). It would be advantageous (e.g., for security reasons) to be able to trace the contact with the external domain back to Machine A, and then back to Charlie's IP address.
- Using techniques described herein e.g., by correlating process information collected by various agents), such tracking of Charlie's activities back to his original login ( 330 ) can be accomplished.
- an extended user session can be tracked that associates Charlie's ssh processes together with a single original login and thus original user.
- software agents may run on machines (such as a machine that implements one of nodes 116 ) and detect new connections, processes, and/or logins.
- machines such as a machine that implements one of nodes 116
- agents send associated records to data platform 12 which includes one or more datastores (e.g., data store 30 ) for persistently storing such data.
- datastores e.g., data store 30
- Such data can be modeled using logical tables, also persisted in datastores (e.g., in a relational database that provides an SQL interface), allowing for querying of the data.
- Other datastores such as graph oriented databases and/or hybrid schemes can also be used.
- An ssh login session can be identified uniquely by an (MID, PID_hash) tuple.
- the MID is a machine identifier that is unique to each machine, whether physical or virtual, across time and space.
- Operating systems use numbers called process identifiers (PIDs) to identify processes running at a given time. Over time processes may die and new processes may be started on a machine or the machine itself may restart.
- PID process identifiers
- Over time processes may die and new processes may be started on a machine or the machine itself may restart.
- the PID is not necessarily unique across time in that the same PID value can be reused for different processes at different times. In order to track process descendants across time, one should therefore account for time as well.
- another number called a PID_hash is generated for the process.
- the PID_hash is generated using a collision-resistant hash function that takes the PID, start time, and (in various embodiments, as applicable) other properties of a process.
- Input data collected by agents comprises the input data model and is represented by the following logical tables:
- a connections table may maintain records of TCP/IP connections observed on each machine.
- Example columns included in a connections table are as follows:
- the source fields correspond to the side from which the connection was initiated.
- the agent associates an ssh connection with the privileged ssh process that is created for that connection.
- a processes table maintains records of processes observed on each machine. It may have the following columns:
- a logins table may maintain records of logins to machines. It may have the following columns:
- Output data generated by session tracking is represented with the following logical tables:
- a login-local-descendant table maintains the local (i.e., on the same machine) descendant processes of each ssh login session. It may have the following columns:
- a login-connections table may maintain the connections associated with ssh logins. It may have the following columns:
- sshd_PID_hash Identifier of the sshd privileged process associated with the login. login_time Time of login. login_username The username used in the login. src_IP_addr Source IP address (connection was initiated from this IP address). src_port Source port. dst_IP_addr Destination IP address (connection was made to this IP address). dst_port Destination port.
- a login-lineage table may maintain the lineage of ssh login sessions. It may have the following columns:
- FIG. 3 H illustrates an example of a process for performing extended user tracking.
- process 361 is performed by data platform 12 .
- the process begins at 362 when data associated with activities occurring in a network environment (such as entity A's datacenter) is received.
- a network environment such as entity A's datacenter
- agent-collected data described above (e.g., in conjunction with process 200 ).
- the received network activity is used to identify user login activity.
- a logical graph that links the user login activity to at least one user and at least one process is generated (or updated, as applicable). Additional detail regarding process 361 , and in particular, portions 363 and 364 of process 361 are described in more detail below (e.g., in conjunction with discussion of FIG. 3 J ).
- FIG. 3 I depicts a representation of a user logging into a first machine, then into a second machine from the first machine, and then making an external connection.
- the scenario depicted in FIG. 3 I is used to describe an example of processing that can be performed on data collected by agents to generate extended user session tracking information.
- FIG. 3 I is an alternate depiction of the information shown in FIGS. 3 F and 3 G .
- a first ssh connection is made to Machine A ( 366 ) from an external source ( 367 ) by a user having a username of “X.”
- the external source has an IP address of 1.1.1.10 and uses source port 10000 to connect to Machine A (which has an IP address of 2.2.2.20 and a destination port 22).
- External source 367 is considered an external source because its IP address is outside of the environment being monitored (e.g., is a node outside of entity A's datacenter, connecting to a node inside of entity A's datacenter).
- a first ssh login session LS1 is created on machine A for user X.
- the privileged openssh process for this login is A1 ( 368 ).
- the user creates a bash shell process with PID_hash A2 ( 369 ).
- the user runs an ssh program under a new process A3 ( 371 ) to log in to machine B ( 372 ) with a different username (“Y”).
- Y a different username
- an ssh connection is made from source IP address 2.2.2.20 and source port 10001 (Machine A's source information) to destination IP address 2.2.2.21 and destination port 22 (Machine B's destination information).
- a second ssh login session LS2 is created on machine B for user Y.
- the privileged openssh process for this login is B1 ( 373 ).
- the user creates a bash shell process with PID_hash B2 ( 374 ).
- the user runs a curl command under a new process B3 ( 377 ) to download a file from an external destination ( 378 ).
- an HTTPS connection is made from source IP address 2.2.2.21 and source port 10002 (Machine B's source information) to external destination IP address 3.3.3.30 and destination port 443 (the external destination's information).
- An association between A3 and LS2 can be established based on the fact that LS2 was created based on an ssh connection initiated from A3. Accordingly, it can be determined that LS2 is a child of LS1.
- the process that made the connection would be traced, i.e., from B3 to LS2.
- LS2 would be traced to LS1 (i.e., LS1 is the origin login session for LS2).
- LS1 is the origin login session for LS2.
- the user for this connection is the user for LS1, i.e., X.
- FIG. 3 I one can visualize the tracing by following the links (in the reverse direction of arrows) from external destination 378 to A1 ( 368 ).
- FIG. 3 J illustrates an example of a process for performing extended user tracking.
- process 380 is performed periodically (e.g., once an hour in a batch fashion) by ssh tracker 148 to generate new output data.
- batch processing allows for efficient analysis of large volumes of data.
- the approach can be adapted, as applicable, to process input data on a record-by-record fashion while maintaining the same logical data processing flow.
- the results of a given portion of process 380 are stored for use in a subsequent portion.
- the process begins at 381 when new ssh connection records are identified.
- new ssh connections started during the current time period are identified by querying the connections table.
- the query uses filters on the start_time and dst_port columns.
- the values of the range filter on the start_time column are based on the current time period.
- the dst_port column is checked against ssh listening port(s).
- the ssh listening port number is 22.
- the port(s) that openssh servers are listening to in the environment can be determined by data collection agents dynamically and used as the filter value for the dst_port as applicable.
- the query result will generate the records shown in FIG.
- ssh connection records reported from source and destination sides of the same connection are matched.
- the ssh connection records (e.g., returned from the query at 381 ) are matched based on the following criteria:
- Example output of portion 382 of process 380 is shown in FIG. 3 L .
- the values in the dst_PID_hash column ( 391 ) are that of the sshd privileged process associated with ssh logins.
- new logins during the current time period are identified by querying the logins table.
- the query uses a range filter on the login_time column with values based on the current time period.
- the query result will generate the records depicted in FIG. 3 M .
- matched ssh connection records created at 382 and new login records created at 383 are joined to create new records that will eventually be stored in the login-connection table.
- the join condition is that dst_MID of the matched connection record is equal to the MID of the login record and the dst_PID_hash of the matched connection record is equal to the sshd_PID_hash of the login record.
- the processing performed at 384 will generate the records depicted in FIG. 3 N .
- login-local-descendant records in the lookback time period are identified. It is possible that a process that is created in a previous time period makes an ssh connection in the current analysis batch period. Although not depicted in the example illustrated in FIG. 3 I , consider a case where bash process A2 does not create ssh process A3 right away but instead that the ssh connection A3 later makes to machine B is processed in a subsequent time period than the one where A2 was processed.
- the time period for which look back is performed can be limited to reduce the amount of historical data that is considered. However, this is not a requirement (and the amount of look back can be determined, e.g., based on available processing resources).
- the login local descendants in the lookback time period can be identified by querying the login-local-descendant table.
- the query uses a range filter on the login time column where the range is from start_time_of_current_period ⁇ lookback_time to start_time_of_current_period. (No records as a result of performing 385 on the scenario depicted in FIG. 3 I are obtained, as only a single time period is applicable in the example scenario.)
- new processes that are started in the current time period are identified by querying the processes table.
- the query uses a range filter on the start_time column with values based on the current time period.
- the processing performed at 386 will generate the records depicted in FIG. 3 O .
- new login-local-descendant records are identified. The purpose is to determine whether any of the new processes in the current time period are descendants of an ssh login process and if so to create records that will be stored in the login-local-descendant table for them. In order to do so, the parent-child relationships between the processes are recursively followed. Either a top down or bottom up approach can be used. In a top down approach, the ssh local descendants in the lookback period identified at 385 , along with new ssh login processes in the current period identified at 384 are considered as possible ancestors for the new processes in the current period identified at 386 .
- the recursive approach can be considered to include multiple sub-steps where new processes that are identified to be ssh local descendants in the current sub-step are considered as ancestors for the next step.
- the following descendancy relationships will be established in two sub-steps:
- Process A3 is a local descendant of LS1 because it is a child of process A2 which is associated to LS1 in sub-step 1.
- Process B3 is a local descendant of LS2 because it is a child of process B1 which is associated to LS2 in sub-step 1.
- Implementation portion 387 can use a datastore that supports recursive query capabilities, or, queries can be constructed to process multiple conceptual sub-steps at once. In the example depicted in FIG. 3 I , the processing performed at 387 will generate the records depicted in FIG. 3 P . Note that the ssh privileged processes associated with the logins are also included as they are part of the login session.
- the lineage of new ssh logins created in the current time period is determined by associating their ssh connections to source processes that may be descendants of other ssh logins (which may have been created in the current period or previous time periods). In order to do so, first an attempt is made to join the new ssh login connections in the current period (identified at 384 ) with the combination of the login local descendants in the lookback period (identified at 385 ) and the login local descendants in the current time period (identified at 386 ). This will create adjacency relationships between child and parent logins. In the example depicted in FIG. 3 I , the second ssh login connection will be associated with process A3 and an adjacency relationship between the two login sessions will be created (as illustrated in FIG. 3 Q ).
- the adjacency relationships are used to find the original login sessions. While not shown in the sample scenario, there could be multiple ssh logins in a chain in the current time period, in which case a recursive approach (as in 387 ) could be used. At the conclusion of portion 388 , the login lineage records depicted in FIG. 3 R will be generated.
- output data is generated.
- the new login-connection, login-local-descendant, and login-lineage records generated at 384 , 387 , and 388 are inserted into their respective output tables (e.g., in a transaction manner).
- connection GUID e.g., the SYN packet
- server e.g., the client and server
- the client and server will store the GUID (if if exists) in the connection records they maintain and report.
- the agent can configure the network stack (e.g. using IP tables functionality on Linux) to intercept an outgoing TCP SYN packet and modify it to add the generated GUID as a TCP option.
- the agent already extracts TCP SYN packets and thus can look for this option and extract the GUID if it exists.
- Joe performs various tasks as himself (e.g., answering emails, generating status reports, writing code, etc.).
- Joe may require different/additional permission than his individual account has (e.g., root privileges
- Joe can gain access to such permissions is by using sudo, which will allow Joe to run a single command with root privileges.
- Another way Joe can gain access to such permissions is by su or otherwise logging into a shell as root.
- Another thing that Joe can do is switch identities.
- Joe may use “su help” or “su database-admin” to become (respectively) the help user or the database-admin user on a system. He may also connect from one machine to another, potentially changing identities along the way (e.g., logging in as joe.smith at a first console, and connecting to a database server as database-admin).
- Joe can relinquish his root privileges by closing out of any additional shells created, reverting back to a shell created for user joe.smith.
- Joe While there are many legitimate reasons for Joe to change his identity throughout the day, such changes may also correspond to nefarious activity. Joe himself may be nefarious, or Joe's account (joe.smith) may have been compromised by a third party (whether an “outsider” outside of entity A's network, or an “insider”).
- Joe's account Joe.smith
- Joe's account Joe.smith
- the behavior of users of the environment can be tracked (including across multiple accounts and/or multiple machines) and modeled (e.g., using various graphs described herein). Such models can be used to generate alerts (e.g., to anomalous user behavior).
- Such models can also be used forensically, e.g., helping an investigator visualize various aspects of a network and activities that have occurred, and to attribute particular types of actions (e.g., network connections or file accesses) to specific users.
- a user In a typical day in a datacenter, a user (e.g., Joe Smith) will log in, run various processes, and (optionally) log out. The user will typically log in from the same set of IP addresses, from IP addresses within the same geographical area (e.g., city or country), or from historically known IP addresses/geographical areas (i.e., ones the user has previously/occasionally used). A deviation from the user's typical (or historical) behavior indicates a change in login behavior. However, it does not necessarily mean that a breach has occurred.
- a user may take a variety of actions. As a first example, a user might execute a binary/script.
- Such binary/script might communicate with other nodes in the datacenter, or outside of the datacenter, and transfer data to the user (e.g., executing “curl” to obtain data from a service external to the datacenter).
- the user can similarly transfer data (e.g., out of the datacenter), such as by using POST.
- a user might change privilege (one or more times), at which point the user can send/receive data as per above.
- a user might connect to a different machine within the datacenter (one or more times), at which point the user can send/receive data as per the above.
- the above information associated with user behavior is broken into four tiers.
- the tiers represent example types of information that data platform 12 can use in modeling user behavior:
- the user's entry point e.g., domains, IP addresses, and/or geolocation information such as country/city
- the user executes a script (“collect_data.sh”) on Machine03.
- the script internally communicates (as root) to a MySQL-based service internal to the datacenter, and downloads data from the MySQL-based service.
- the user externally communicates with a server outside the datacenter (“External01”), using a POST command.
- the source/entry point is IP01.
- Data is transferred to an external server External01.
- the machine performing the transfer to External01 is Machine03.
- the user transferring the data is “root” (on Machine03), while the actual user (hiding behind root) is UserA.
- the “original user” (ultimately responsible for transmitting data to External01) is UserA, who logged in from IP01.
- Each of the processes ultimately started by UserA whether started at the command line (tty) such as “runnable.sh” or started after an ssh connection such as “new_runnable.sh,” and whether as UserA, or as a subsequent identity, are all examples of child processes which can be arranged into a process hierarchy.
- machines can be clustered together logically into machine clusters.
- One approach to clustering is to classify machines based on information such as the types of services they provide/binaries they have installed upon them/processes they execute. Machines sharing a given machine class (as they share common binaries/services/etc.) will behave similarly to one another.
- Each machine in a datacenter can be assigned to a machine cluster, and each machine cluster can be assigned an identifier (also referred to herein as a machine class).
- One or more tags can also be assigned to a given machine class (e.g., database_servers_west or prod_web_frontend).
- One approach to assigning a tag to a machine class is to apply term frequency analysis (e.g., TF/IDF) to the applications run by a given machine class, selecting as tags those most unique to the class.
- Data platform 12 can use behavioral baselines taken for a class of machines to identify deviations from the baseline (e.g., by a particular machine in the class).
- FIG. 3 S illustrates an example of a process for detecting anomalies.
- process 392 is performed by data platform 12 .
- a given session will have an original user. And, each action taken by the original user can be tied back to the original user, despite privilege changes and/or lateral movement throughout a datacenter.
- Process 392 begins at 393 when log data associated with a user session (and thus an original user) is received.
- a logical graph is generated, using at least a portion of the collected data.
- an anomaly is detected ( 395 ) it can be recorded, and as applicable, an alert is generated ( 396 ).
- the following are examples of graphs that can be generated (e.g., at 394 ), with corresponding examples of anomalies that can be detected (e.g., at 395 ) and alerted upon (e.g., at 396 ).
- FIG. 4 A illustrates a representation of an embodiment of an insider behavior graph.
- each node in the graph can be: (1) a cluster of users; (2) a cluster of launched processes; (3) a cluster of processes/servers running on a machine class; (4) a cluster of external IP addresses (of incoming clients); or (5) a cluster of external servers based on DNS/IP/etc.
- graph data is vertically tiered into four tiers.
- Tier 0 ( 400 ) corresponds to entry point information (e.g., domains, IP addresses, and/or geolocation information) associated with a client entering the datacenter from an external entry point. Entry points are clustered together based on such information.
- Tier 1 corresponds to a user on a machine class, with a given user on a given machine class represented as a node.
- Tier 2 corresponds to launched processes, child processes, and/or interactive processes. Processes for a given user and having similar connectivity (e.g., sharing the processes they launch and the machines with which they communicate) are grouped into nodes.
- Tier 3 corresponds to the services/servers/domains/IP addresses with which processes communicate.
- Tier 0 nodes log in to tier 1 nodes.
- Tier 1 nodes launch tier 2 nodes.
- Tier 2 nodes connect to tier 3 nodes.
- Horizontal tiering also helps in establishing baseline insider behavior. For example, by building an hourly insider behavior graph, new edges/changes in edges between nodes in Tier 1 and Tier 2 can be identified. Any such changes correspond to a change associated with the original user. And, any such changes can be surfaced as anomalous and alerts can be generated.
- Tier 1 corresponds to a user (e.g., user “U”) logging into a machine having a particular machine class (e.g., machine class “M”).
- Tier 2 is a cluster of processes having command line similarity (e.g., CType “C”), having an original user “U,” and running as a particular effective user (e.g., user “U1”).
- the effective user in the Tier 2 node may or may not match the original user (while the original user in the Tier 2 node will match the original user in the Tier 1 node).
- a change from a user U into a user U1 can take place in a variety of ways. Examples include where U becomes U1 on the same machine (e.g., via su), and also where U sshes to other machine(s). In both situations, U can perform multiple changes, and can combine approaches. For example, U can become U1 on a first machine, ssh to a second machine (as U1), become U2 on the second machine, and ssh to a third machine (whether as user U2 or user U3).
- the complexity of how user U ultimately becomes U3 (or U5, etc.) is hidden from a viewer of an insider behavior graph, and only an original user (e.g., U) and the effective user of a given node (e.g., U5) are depicted.
- additional detail about the path e.g., an end-to-end path of edges from user U to user U5 can be surfaced (e.g., via user interactions with nodes).
- FIG. 4 B illustrates an example of a portion of an insider behavior graph (e.g., as rendered in a web browser).
- node 405 (the external IP address, 52.32.40.231) is an example of a Tier 0 node, and represents an entry point into a datacenter.
- two users “aruneli_prod” and “harish_prod,” both made use of the source IP 52.32.40.231 when logging in between 5 pm and 6 pm on Sunday July 30 ( 408 ).
- Nodes 409 and 410 are examples of Tier 1 nodes, having aruneli_prod and harish_prod as associated respective original users.
- Tier 1 nodes correspond to a combination of a user and a machine class.
- the machine class associated with nodes 409 and 410 is hidden from view to simplify visualization, but can be surfaced to a viewer of interface 404 (e.g., when the user clicks on node 409 or 410 ).
- Nodes 414 - 423 are examples of Tier 2 nodes—processes that are launched by users in Tier 1 and their child, grandchild, etc. processes. Note that also depicted in FIG. 4 B is a Tier 1 node 411 that corresponds to a user, “root,” that logged in to a machine cluster from within the datacenter (i.e., has an entry point within the datacenter). Nodes 425 - 1 and 425 - 2 are examples of Tier 3 nodes—internal/external IP addresses, servers, etc., with which Tier 2 nodes communicate.
- a viewer of interface 404 has clicked on node 423 .
- the user running the marathon container is “root.”
- the viewer can determine that the original user, responsible for node 423 , is “aruneli_prod,” who logged into the datacenter from IP 52.32.40.231.
- Such changes can be surfaced as alerts, e.g., to help an administrator determine when/what anomalous behavior occurs within a datacenter.
- the behavior graph model can be used (e.g., during forensic analysis) to answer questions helpful during an investigation. Examples of such questions include:
- FIG. 4 C depicts a baseline of behavior for a user, “Bill.”
- Bill typically logs into a datacenter from the IP address, 71.198.44.40 ( 427 ). He typically makes use of ssh ( 428 ), and sudo ( 429 ), makes use of a set of typical applications ( 430 ) and connects (as root) with the external service, api.lacework.net ( 431 ).
- FIG. 4 D depicts an embodiment of how the graph depicted in FIG. 4 C would appear once Eve begins exfiltrating data from the datacenter.
- Eve logs into the datacenter (using Bill's credentials) from 52.5.66.8 ( 432 ).
- As Bill Eve escalates her privilege to root (e.g., via su), and then becomes a different user, Alex (e.g., via su alex).
- Alex e.g., via su alex
- Alex e.g., via su alex
- Alex e.g., via su alex
- Alex executes a script, “sneak.sh” ( 433 ), which launches another script, “post.sh” ( 434 ), which contacts external server 435 which has an IP address of 52.5.66.7, and transmits data to it.
- Edges 436 - 439 each represent changes in Bill's behavior. As previously mentioned, such changes can be detected as anomalies and associated alerts can be generated. As a first example, Bill logging in from an IP address he has not previously logged in from ( 436 ) can generate an alert. As a second example, while Bill does typically make use of sudo ( 429 ), he has not previously executed sneak.sh ( 433 ) or post.sh ( 434 ) and the execution of those scripts can generate alerts as well. As a third example, Bill has not previously communicated with server 435 , and an alert can be generated when he does so ( 439 ). Considered individually, each of edges 436 - 439 may indicate nefarious behavior, or may be benign.
- a benign edge suppose Bill begins working from a home office two days a week. The first time he logs in from his home office (i.e., from an IP address that is not 71.198.44.40), an alert can be generated that he has logged in from a new location. Over time, however, as Bill continues to log in from his home office but otherwise engages in typical activities, Bill's graph will evolve to include logins from both 71.198.44.40 and his home office as baseline behavior. Similarly, if Bill begins using a new tool in his job, an alert can be generated the first time he executes the tool, but over time will become part of his baseline.
- a single edge can indicate a serious threat.
- edge 436 (or 439 ) indicates compromise.
- An alert that includes an appropriate severity level e.g., “threat level high” can be generated.
- a combination of edges could indicate a threat (where a single edge might otherwise result in a lesser warning).
- the presence of multiple new edges is indicative of a serious threat.
- FIG. 4 E illustrates a representation of an embodiment of a user login graph.
- tier 0 440
- Tier 1 441
- tier 2 442
- the user login graph tracks the typical login behavior of users.
- a graph can be constructed (also referred to herein as a privilege change graph) which models privilege changes.
- a graph can be constructed which identifies where a process P1 launches a process P2, where P1 and P2 each have an associated user U1 and U2, with U1 being an original user, and U2 being an effective user.
- each node is a cluster of processes (sharing a CType) executed by a particular (original) user. As all the processes in the cluster belong to the same user, a label that can be used for the cluster is the user's username.
- An edge in the graph from a first node to a second node, indicates that a user of the first node changed its privilege to the user of the second node.
- FIG. 4 F illustrates an example of a privilege change graph.
- each node e.g., nodes 444 and 445
- Privilege changes are indicated by edges, such as edge 446 .
- anomalies in graph 443 can be used to generate alerts.
- Three examples of such alerts are as follows:
- An example of an anomalous privilege change and an example of an anomalous privilege escalation are each depicted in graph 450 of FIG. 4 G .
- two alerts for the time period 2 pm-3 pm on June 8 were generated (corresponding to the detection of the two anomalous events).
- root has changed privilege to the user “daemon,” which root has not previously done.
- This anomaly is indicated to the user by highlighting the daemon node (e.g., outlining it in a particular color, e.g., red).
- Bill has escalated his privilege to the user root (which can similarly be highlighted in region 454 ). This action by Bill represents a privilege escalation.
- datacenters are highly dynamic environments.
- different customers of data platform 12 e.g., entity A vs. entity B
- entity A may have different/disparate needs/requirements of data platform 12 , e.g., due to having different types of assets, different applications, etc.
- data platform 12 makes use of predefined relational schema (including by having different predefined relational schema for different customers).
- predefined relational schema including by having different predefined relational schema for different customers.
- the complexity and cost of maintaining/updating such predefined relational schema can rapidly become problematic—particularly where the schema includes a mix of relational, nested, and hierarchical (graph) datasets.
- data platform 12 supports dynamic query generation by automatic discovery of join relations via static or dynamic filtering key specifications among composable data sets. This allows a user of data platform 12 to be agnostic to modifications made to existing data sets as well as creation of new data sets.
- the extensible query interface also provides a declarative and configurable specification for optimizing internal data generation and derivations.
- data platform 12 is configured to dynamically translate user interactions (e.g., received via web app 120 ) into SQL queries (and without the user needing to know how to write queries). Such queries can then be performed (e.g., by query service 166 ) against any compatible backend (e.g., data store 30 ).
- query service 166 any compatible backend (e.g., data store 30 ).
- FIG. 4 H illustrates an example of a user interacting with a portion of an interface.
- data platform 12 e.g., via web app 120 using a browser
- data is extracted from data store 30 as needed (e.g., by query service 166 ), to provide the user with information, such as the visualizations depicted variously herein).
- query service 166 e.g., clicking on graph nodes, entering text into search boxes, navigating between tabs (e.g., tab 455 vs. 465 )
- such interactions act as triggers that cause query service 166 to continue to obtain information from data store 30 as needed (and as described in more detail below).
- user A is viewing a dashboard that provides various information about entity A users ( 455 ), during the time period March 2 at midnight—March 25 at 7 pm (which she selected by interacting with region 456 ).
- Various statistical information is presented to user A in region 457 .
- Region 458 presents a timeline of events that occurred during the selected time period.
- User A has opted to list only the critical, high, and medium events during the time period by clicking on the associated boxes ( 459 - 461 ).
- a total of 55 low severity, and 155 info-only events also occurred during the time period.
- Each time user A interacts with an element in FIG.
- her actions are translated/formalized into filters on the data set and used to dynamically generate SQL queries.
- the SQL queries are generated transparently to user A (and also to a designer of the user interface shown in FIG. 4 H ).
- User A notes in the timeline ( 462 ) that a user, Harish, connected to a known bad server (examplebad.com) using wget, an event that has a critical severity level.
- User A can click on region 463 to expand details about the event inline (which will display, for example, the text “External connection made to known bad host examplebad.com at port 80 from application ‘wget’ running on host dev1.lacework.internal as user harish”) directly below line 462 .
- User A can also click on link 464 - 1 , which will take her to a dossier for the event (depicted in FIG. 4 I ).
- a dossier is a template for a collection of visualizations.
- the event of Harish using wget to contact examplebad.com on March 16 was assigned an event ID of 9291 by data platform 12 ( 467 ).
- the event is also added to her dashboard in region 476 as a bookmark ( 468 ).
- a summary of the event is depicted in region 469 .
- user A can see a timeline of related events. In this case, user A has indicated that she would like to see other events involving the wget application (by clicking box 471 ). Events of critical and medium security involving wget occurred during the one hour window selected in region 472 .
- Region 473 automatically provides user A with answers to questions that may be helpful to have answers to while investigating event 9291 . If user A clicks on any of the links in the event description ( 474 ), she will be taken to a corresponding dossier for the link. As one example, suppose user A clicks on link 475 . She will then be presented with interface 477 shown in FIG. 4 J .
- Interface 477 is an embodiment of a dossier for a domain.
- the domain is “examplebad.com,” as shown in region 478 .
- user A would like to track down more information about interactions entity A resources have made with examplebad.com between January 1 and March 20. She selects the appropriate time period in region 479 and information in the other portions of interface 477 automatically update to provide various information corresponding to the selected time frame.
- user A can see that contact was made with examplebad.com a total of 17 times during the time period ( 480 ), as well as a list of each contact ( 481 ).
- Various statistical information is also included in the dossier for the time period ( 482 ). If she scrolls down in interface 477 , user A will be able to view various polygraphs associated with examplebad.com, such as an application-communication polygraph ( 483 ).
- Data stored in data store 30 can be internally organized as an activity graph.
- nodes are also referred to as Entities. Activities generated by Entities are modeled as directional edges between nodes. Thus, each edge is an activity between two Entities.
- An Activity is a “login” Activity, in which a user Entity logs into a machine Entity (with a directed edge from the user to the machine).
- a second example of an Activity is a “launch” Activity, in which a parent process launches a child process (with a directed edge from the parent to the child).
- a third example of an Activity is a “DNS query” Activity, in which either a process or a machine performs a query (with a directed edge from the requestor to the answer, e.g., an edge from a process to www.example.com).
- a fourth example of an Activity is a network “connected to” Activity, in which processes, IP addresses, and listen ports can connect to each other (with a directed edge from the initiator to the server).
- query service 166 provides either relational views or graph views on top of data stored in data store 30 .
- a user will to see want to see data filtered using the activity graph. For example, if an entity was not involved in an activity in a given time period, that entity should be filtered out of query results. Thus, a request to show “all machines” in a given time frame will be interpreted as “show distinct machines that were active” during the time frame.
- Query service 166 relies on three main data model elements: fields, entities, and filters.
- a field is a collection of values with the same type (logical and physical).
- a field can be represented in a variety of ways, including: 1. a column of relations (table/view), 2. a return field from another entity, 3. an SQL aggregation (e.g., COUNT, SUM, etc.), 4. an SQL expression with the references of other fields specified, and 5. a nested field of a JSON object.
- an entity is a collection of fields that describe a data set.
- the data set can be composed in a variety of ways, including: 1. a relational table, 2. a parameterized SQL statement, 3.
- DynamicSQL created by a Java function and 4. join/project/aggregate/subclass of other entities.
- Some fields are common for all entities.
- One example of such a field is a “first observed” timestamp (when first use of the entity was detected).
- a second example of such a field is the entity classification type (e.g., one of: 1. Machine (on which an agent is installed), 2. Process, 3. Binary, 4. UID, 5. IP, 6. DNS Information, 7. ListenPort, and 8. PType).
- a third example of such a field is a “last observed” timestamp.
- a filter is an operator that: 1. takes an entity and field values as inputs, 2. a valid SQL expression with specific reference(s) of entity fields, or 3. is a conjunct/disjunct of filters.
- filters can be used to filter data in various ways, and limit data returned by query service 166 without changing the associated data set.
- a dossier is a template for a collection of visualizations.
- Each visualization e.g., the box including chart 484
- has a corresponding card which identifies particular target information needed (e.g., from data store 30 ) to generate the visualization.
- data platform 12 maintains a global set of dossiers/cards. Users of data platform 12 such as user A can build their own dashboard interfaces using preexisting dossiers/cards as components, and/or they can make use of a default dashboard (which incorporates various of such dossiers/cards).
- a JSON file can be used to store multiple cards (e.g., as part of a query service catalog).
- a particular card is represented by a single JSON object with a unique name as a field name.
- TYPE the type of the card.
- Example values include:
- PARAMETERS a JSON array object that contains an array of parameter objects with the following fields:
- SOURCES a JSON array object explicitly specifying references of input entities. Each source reference has the following attributes:
- RETURNS a required JSON array object of a return field object.
- a return field object can be described by the following attributes:
- PROPS generic JSON objects for other entity properties
- SQL a JSON array of string literals for SQL statements. Each string literal can contain parameterized expressions $ ⁇ ParameterName ⁇ and/or composable entity by # ⁇ EntityName ⁇
- GRAPH required for graph entity. Has the following required fields:
- JOINS a JSON array of join operators. Possible fields for a join operator include:
- FKEYS a JSON array of FilterKey(s).
- the fields for a FilterKey are:
- FILTERS a JSON array of filters (conjunct). Possible fields for a filter include:
- ORDERS a JSON array of ORDER BY for returning fields. Possible attributes for the ORDER BY clause include:
- GROUPS a JSON array of GROUP BY for returning fields.
- Field attributes are:
- LIMIT a limit for the number of records to be returned
- OFFSET an offset of starting position of returned data. Used in combination with limit for pagination.
- customers of data platform 12 e.g., entity A and entity B
- new data transformations or a new aggregation of data from an existing data set (as well as a corresponding visualization for the newly defined data set).
- the data models and filtering applications used by data platform 12 are extensible.
- two example scenarios of extensibility are (1) extending the filter data set, and (2) extending a FilterKey in the filter data set.
- Data platform 12 includes a query service catalog that enumerates cards available to users of data platform 12 .
- New cards can be included for use in data platform 12 by being added to the query service catalog (e.g., by an operator of data platform 12 ).
- a single external-facing card e.g., available for use in a dossier
- Each newly added card (whether external or internal) will also have associated FilterKey(s) defined.
- a user interface (UI) developer can then develop a visualization for the new data set in one or more dossier templates.
- the same external card can be used in multiple dossier templates, and a given external card can be used multiple times in the same dossier (e.g., after customization).
- Examples of external card customization include customization via parameters, ordering, and/or various mappings of external data fields (columns).
- a second extensibility scenario is one in which a FilterKey in the filter data set is extended (i.e., existing template functions are used to define a new data set).
- data sets used by data platform 12 are composable/reusable/extensible, irrespective of whether the data sets are relational or graph data sets.
- One example data set is the User Tracking polygraph, which is generated as a graph data set (comprising nodes and edges). Like other polygraphs, User Tracking is an external data set that can be visualized both as a graph (via the nodes and edges) and can also be used as a filter data set for other cards, via the cluster identifier (CID) field.
- CID cluster identifier
- Dynamic composition of filter datasets can be implemented using FilterKeys and FilterKey Types.
- a FilterKey can be defined as a list of columns and/or fields in a nested structure (e.g., JSON). Instances of the same FilterKey Type can be formed as an Implicit Join Group. The same instance of a FilterKey can participate in different Implicit Join Groups.
- a list of relationships among all possible Implicit Join Groups is represented as a Join graph for the entire search space to create a final data filter set by traversing edges and producing Join Path(s).
- Each card (e.g., as stored in the query service catalog and used in a dossier) can be introspected by a/card/describe/CardID REST request.
- a Join graph (an example of which is depicted in FIG. 4 K ) comprises a list of Join Link(s).
- a Join Link represents each implicit join group by the same FilterKey type.
- a Join Link maintains a reverse map (Entity-to-FilterKey) of FilterKeys and their Entities. As previously mentioned, Entities can have more than one FilterKey defined. The reverse map guarantees one FilterKey per Entity can be used for each JoinLink.
- Each JoinLink also maintains a list of entities for the priority order of joins.
- Each JoinLink is also responsible for creating and adding directional edge(s) to graphs. An edge represents a possible join between two Entities.
- each Implicit Join uses the Join graph to find all possible join paths.
- the search of possible join paths starts with the outer FilterKey of an implicit join.
- One approach is to use a shortest path approach, with breadth first traversal and subject to the following criteria:
- FIG. 4 L illustrates an example of a process for dynamically generating and executing a query.
- process 485 is performed by data platform 12 .
- the process begins at 486 when a request is received to filter information associated with activities within a network environment.
- a request is received to filter information associated with activities within a network environment.
- One example of such a request occurs in response to user A clicking on tab 465 .
- Another example of such a request occurs in response to user A clicking on link 464 - 1 .
- Yet another example of such a request occurs in response to user A clicking on link 464 - 2 and selecting (e.g., from a dropdown) an option to filter (e.g., include, exclude) based on specific criteria that she provides (e.g., an IP address, a username, a range of criteria, etc.).
- a query is generated based on an implicit join.
- processing that can be performed at 487 is as follows. As explained above, one way dynamic composition of filter datasets can be implemented is by using FilterKeys and FilterKey Types. And, instances of the same FilterKey Type can be formed as an Implicit Join Group. A Join graph for the entire search space can be constructed from a list of all relationships among all possible Join Groups. And, a final data filter set can be created by traversing edges and producing one or more Join Paths. Finally, the shortest path in the join paths is used to generate an SQL query string.
- a common interface “sqlGen” may be used in conjunction with process 485 is as follows.
- a card/entity is composed by a list of input cards/entities, where each input card recursively is composed by its own list of input cards.
- This nested structure can be visualized as a tree of query blocks(SELECT) in standard SQL constructs. SQL generation can be performed as the traversal of the tree from root to leaf entities (top-down), calling the sqlGen of each entity.
- Each entity can be treated as a subclass of the Java class(Entity).
- An implicit join filter (EntityFilter) is implemented as a subclass of Entity, similar to the right hand side of a SQL semi-join operator. Unlike the static SQL semi-join construct, it is conditionally and recursively generated even if it is specified in the input sources of the JSON specification.
- Another recursive interface can also be used in conjunction with process 485 , preSQLGen, which is primarily the entry point for EntityFilter to run a search and generate nested implicit join filters.
- preSQLGen is primarily the entry point for EntityFilter to run a search and generate nested implicit join filters.
- Another top-down traversal, pullUpCachable can be used to pull up common sub-query blocks, including those dynamically generated by preSQLGen, such that SELECT statements of those cacheable blocks are generated only once at top-level WITH clauses.
- a recursive interface, sqlWith is used to generate nested subqueries inside WITH clauses.
- the recursive calls of a sqlWith function can generate nested WITH clauses as well.
- An sqlFrom function can be used to generate SQL FROM clauses by referencing those subquery blocks in the WITH clauses. It also produces INNER/OUTER join operators based on the joins in the specification.
- sqlWhere Another recursive interface, sqlWhere, can be used to generate conjuncts and disjuncts of local predicates and semi-join predicates based on implicit join transformations.
- sqlProject, sqlGroupBy, sqlOrderBy, and sqlLimitOffset can respectively be used to translate the corresponding directives in JSON spec to SQL SELECT list, GROUP BY, ORDER BY, and LIMIT/OFFSET clauses.
- the query (generated at 487 ) is used to respond to the request.
- the generated query is used to query data store 30 and provide (e.g., to web app 120 ) fact data formatted in accordance with a schema (e.g., as associated with a card associated with the request received at 486 ).
- data that is collected from agents and other sources may be stored in different ways.
- data that is collected from agents and other sources may be stored in a data warehouse, data lake, data mart, and/or any other data store.
- a data warehouse may be embodied as an analytic database (e.g., a relational database) that is created from two or more data sources. Such a data warehouse may be leveraged to store historical data, often on the scale of petabytes. Data warehouses may have compute and memory resources for running complicated queries and generating reports. Data warehouses may be the data sources for business intelligence (‘BI’) systems, machine learning applications, and/or other applications. By leveraging a data warehouse, data that has been copied into the data warehouse may be indexed for good analytic query performance, without affecting the write performance of a database (e.g., an Online Transaction Processing (‘OLTP’) database). Data warehouses also enable the joining data from multiple sources for analysis. For example, a sales OLTP application probably has no need to know about the weather at various sales locations, but sales predictions could take advantage of that data. By adding historical weather data to a data warehouse, it would be possible to factor it into models of historical sales data.
- OLTP Online Transaction Processing
- Data lakes which store files of data in their native format, may be considered as “schema on read” resources.
- any application that reads data from the lake may impose its own types and relationships on the data.
- Data warehouses are “schema on write,” meaning that data types, indexes, and relationships are imposed on the data as it is stored in the EDW.
- “Schema on read” resources may be beneficial for data that may be used in several contexts and poses little risk of losing data.
- “Schema on write” resources may be beneficial for data that has a specific purpose, and good for data that must relate properly to data from other sources.
- Such data stores may include data that is encrypted using homomorphic encryption, data encrypted using privacy-preserving encryption, smart contracts, non-fungible tokens, decentralized finance, and other techniques.
- Data marts may contain data oriented towards a specific business line whereas data warehouses contain enterprise-wide data. Data marts may be dependent on a data warehouse, independent of the data warehouse (e.g., drawn from an operational database or external source), or a hybrid of the two. In embodiments described herein, different types of data stores (including combinations thereof) may be leveraged. Such data stores may be proprietary or may be embodied as vendor provided products or services such as, for example, Google BigQuery, Druid, Amazon Redshift, IBM db2, Dremio, Databricks Lakehouse Platform, Cloudera, Azure Synapse Analytics, and others.
- the deployments (e.g., a customer's cloud deployment) that are analyzed, monitored, evaluated, or otherwise observed by the systems described herein (e.g., systems that include components such as the platform 12 of FIG. 1 D , the data collection agents described herein, and/or other components) may be provisioned, deployed, and/or managed using infrastructure as code (‘IaC’).
- IaC infrastructure as code
- IaC involves the managing and/or provisioning of infrastructure through code instead of through manual processes.
- configuration files may be created that include infrastructure specifications. IaC can be beneficial as configurations may be edited and distributed, while also ensuring that environments are provisioned in a consistent manner.
- IaC approaches may be enabled in a variety of ways including, for example, using IaC software tools such as Terraform by HashiCorp. Through the usage of such tools, users may define and provide data center infrastructure using JavaScript Object Notation (‘JSON’), YAML, proprietary formats, or some other format.
- JSON JavaScript Object Notation
- YAML YAML
- proprietary formats or some other format.
- the configuration files may be used to emulate a cloud deployment for the purposes of analyzing the emulated cloud deployment using the systems described herein.
- the configuration files themselves may be used as inputs to the systems described herein, such that the configuration files may be inspected to identify vulnerabilities, misconfigurations, violations of regulatory requirements, or other issues.
- configuration files for multiple cloud deployments may even be used by the systems described herein to identify best practices, to identify configuration files that deviate from typical configuration files, to identify configuration files with similarities to deployments that have been determined to be deficient in some way, or the configuration files may be leveraged in some other ways to detect vulnerabilities, misconfigurations, violations of regulatory requirements, or other issues prior to deploying an infrastructure that is described in the configuration files.
- the techniques described herein may be use in multi-cloud, multi-tenant, cross-cloud, cross-tenant, cross-user, industry cloud, digital platform, and other scenarios depending on specific need or situation.
- the deployments that are analyzed, monitored, evaluated, or otherwise observed by the systems described herein may be monitored to determine the extent to which a particular component has experienced “drift” relative to its associated IaC configuration.
- Discrepancies between how cloud resources were defined in an IaC configuration file and how they are currently configured in runtime may be identified and remediation workflows may be initiated to generate an alert, reconfigure the deployment, or take some other action. Such discrepancies may occur for a variety of reasons. Such discrepancies may occur, for example, due to maintenance operations being performed, due to incident response tasks being carried out, or for some other reason.
- IaC helps avoid initial misconfigurations of a deployment by codifying and enforcing resource creation, resource configuration, security policies, and so on
- the systems described herein may prevent unwanted drift from occurring during runtime and after a deployment has been created in accordance with an IaC configuration.
- the deployments e.g., a customer's cloud deployment
- the systems described herein e.g., systems that include components such as the platform 12 of FIG. 1 D , the data collection agents described herein, and/or other components
- SaC security as code
- SaC can automate policy implementation and cloud deployments may even be compared with the policies to prevent “drift.” For example, if a policy is created where all personally identifiable information (‘PII’) or personal health information (‘PHI’) must be encrypted when it is stored, that policy is translated into a process that is automatically launched whenever a developer submits code, and code that violates the policy may be automatically rejected.
- PII personally identifiable information
- PHI personal health information
- SaC may be implemented by initially classifying workloads (e.g., by sensitivity, by criticality, by deployment model, by segment). Policies that can be instantiated as code may subsequently be designed. For example, compute-related policies may be designed, access-related policies may be designed, application-related policies may be designed, network-related policies may be designed, data-related policies may be designed, and so on. Security as code may then be instantiated through architecture and automation, as successful implementation of SaC can benefit from making key architectural-design decisions and executing the right automation capabilities. Next, operating model protections may be built and supported.
- an operating model may “shift left” to maximize self-service and achieve full-life-cycle security automation (e.g., by standardizing common development toolchains, CI/CD pipelines, and the like).
- security policies and access controls may be part of the pipeline, automatic code review and bug/defect detection may be performed, automated build processes may be performed, vulnerability scanning may be performed, checks against a risk-control framework may be made, and other tasks may be performed all before deploying an infrastructure or components thereof.
- GitOps may be viewed as the one and only source of truth.
- GitOps may require that the desired state of infrastructure (e.g., a customer's cloud deployment) be stored in version control such that the entire audit trail of changes to such infrastructure can be viewed or audited.
- desired state of infrastructure e.g., a customer's cloud deployment
- version control such that the entire audit trail of changes to such infrastructure can be viewed or audited.
- all changes to infrastructure are embodied as fully traceable commits that are associated with committer information, commit IDs, time stamps, and/or other information.
- both an application and the infrastructure e.g., a customer's cloud deployment
- the infrastructure e.g., a customer's cloud deployment
- the systems described herein are described as analyzing, monitoring, evaluating, or otherwise observing a GitOps environment, in other embodiments other source control mechanisms may be utilized for creating infrastructure, making changes to infrastructure, and so on. In these embodiments, the systems described herein may similarly be used for analyzing, monitoring, evaluating, or otherwise observing such environments.
- the systems described herein may be used to analyze, monitor, evaluate, or otherwise observe a customer's cloud deployment. While securing traditional datacenters requires managing and securing an IP-based perimeter with networks and firewalls, hardware security modules (‘HSMs’), security information and event management (‘SIEM’) technologies, and other physical access restrictions, such solutions are not particularly useful when applied to cloud deployments. As such, the systems described herein may be configured to interact with and even monitor other solutions that are appropriate for cloud deployments such as, for example, “zero trust” solutions.
- HSMs hardware security modules
- SIEM security information and event management
- a zero trust security model (a.k.a., zero trust architecture) describes an approach to the design and implementation of IT systems.
- a primary concept behind zero trust is that devices should not be trusted by default, even if they are connected to a managed corporate network such as the corporate LAN and even if they were previously verified.
- Zero trust security models help prevent successful breaches by eliminating the concept of trust from an organization's network architecture.
- Zero trust security models can include multiple forms of authentication and authorization (e.g., machine authentication and authorization, human/user authentication and authorization) and can also be used to control multiple types of accesses or interactions (e.g., machine-to-machine access, human-to-machine access).
- the systems described herein may be configured to interact with zero trust solutions in a variety of ways.
- agents that collect input data for the systems described herein may be configured to access various machines, applications, data sources, or other entity through a zero trust solution, especially where local instances of the systems described herein are deployed at edge locations.
- the zero trust solution itself may be monitored to identify vulnerabilities, anomalies, and so on. For example, network traffic to and from the zero trust solution may be analyzed, the zero trust solution may be monitored to detect unusual interactions, log files generated by the zero trust solution may be gathered and analyzed, and so on.
- the systems described herein may leverage various tools and mechanisms in the process of performing its primary tasks (e.g., monitoring a cloud deployment).
- Linux eBPF is mechanism for writing code to be executed in the Linux kernel space.
- user mode processes can hook into specific trace points in the kernel and access data structures and other information.
- eBPF may be used to gather information that enables the systems described herein to attribute the utilization of networking resources or network traffic to specific processes. This may be useful in analyzing the behavior of a particular process, which may be important for observability/SIEM.
- the systems described may be configured to collect security event logs (or any other type of log or similar record of activity) and telemetry in real time for threat detection, for analyzing compliance requirements, or for other purposes.
- the systems described herein may analyze telemetry in real time (or near real time), as well as historical telemetry, to detect attacks or other activities of interest.
- the attacks or activities of interest may be analyzed to determine their potential severity and impact on an organization. In fact, the attacks or activities of interest may be reported, and relevant events, logs, or other information may be stored for subsequent examination.
- systems described herein may be configured to collect security event logs (or any other type of log or similar record of activity) and telemetry in real time to provide customers with a SIEM or SIEM-like solution.
- SIEM technology aggregates event data produced by security devices, network infrastructure, systems, applications, or other source. Centralizing all of the data that may be generated by a cloud deployment may be challenging for a traditional STEM, however, as each component in a cloud deployment may generate log data or other forms of machine data, such that the collective amount of data that can be used to monitor the cloud deployment can grow to be quite large.
- a traditional SIEM architecture where data is centralized and aggregated, can quickly result in large amounts of data that may be expensive to store, process, retain, and so on. As such, SIEM technologies may frequently be implemented such that silos are created to separate the data.
- data that is ingested by the systems described herein may be stored in a cloud-based data warehouse such as those provided by Snowflake and others.
- a cloud-based data warehouse such as those provided by Snowflake and others.
- companies like Snowflake offer data analytics and other services to operate on data that is stored in their data warehouses
- one or more of the components of the systems described herein may be deployed in or near Snowflake as part of a secure data lake architecture (a.k.a., a security data lake architecture, a security data lake/warehouse).
- components of the systems described herein may be deployed in or near Snowflake to collect data, transform data, analyze data for the purposes of detecting threats or vulnerabilities, initiate remediation workflows, generate alerts, or perform any of the other functions that can be performed by the systems described herein.
- data may be received from a variety of sources (e.g., EDR or EDR-like tools that handle endpoint data, cloud access security broker (‘CASB’) or CASB-like tools that handle data describing interactions with cloud applications, Identity and Access Management (‘IAM’) or IAM-like tools, and many others), normalized for storage in a data warehouse, and such normalized data may be used by the systems described herein.
- sources e.g., EDR or EDR-like tools that handle endpoint data, cloud access security broker (‘CASB’) or CASB-like tools that handle data describing interactions with cloud applications, Identity and Access Management (‘IAM’) or IAM-like tools, and many others
- EDR EDR
- EDR-like tools that handle end
- one data source that is ingested by the systems described herein is log data, although other forms of data such as network telemetry data (flows and packets) and/or many other forms of data may also be utilized.
- event data can be combined with contextual information about users, assets, threats, vulnerabilities, and so on, for the purposes of scoring, prioritization and expediting investigations.
- input data may be normalized, so that events, data, contextual information, or other information from disparate sources can be analyzed more efficiently for specific purposes (e.g., network security event monitoring, user activity monitoring, compliance reporting).
- the embodiments described here offer real-time analysis of events for security monitoring, advanced analysis of user and entity behaviors, querying and long-range analytics for historical analysis, other support for incident investigation and management, reporting (for compliance requirements, for example), and other functionality.
- the systems described herein may be part of an application performance monitoring (‘APM’) solution.
- APM software and tools enable the observation of application behavior, observation of its infrastructure dependencies, observation of users and business key performance indicators (‘KPIs’) throughout the application's life cycle, and more.
- KPIs business key performance indicators
- the applications being observed may be developed internally, as packaged applications, as software as a service (‘SaaS’), or embodied in some other ways.
- the systems described herein may provide one or more of the following capabilities:
- VDI virtual desktop infrastructure
- the systems described herein may be part of a solution for developing and/or managing artificial intelligence (‘AI’) or machine learning (‘ML’) applications.
- AI artificial intelligence
- ML machine learning
- the systems described herein may be part of an AutoML tool that automate the tasks associated with developing and deploying ML models.
- the systems described herein may perform various functions as part of an AutoML tool such as, for example, monitoring the performance of a series of processes, microservices, and so on that are used to collectively form the AutoML tool.
- the systems described herein may perform other functions as part of an AutoML tool or may be used to monitor, analyze, or otherwise observe an environment that the AutoML tool is deployed within.
- the systems described herein may be used to manage, analyze, or otherwise observe deployments that include other forms of AI/ML tools.
- the systems described herein may manage, analyze, or otherwise observe deployments that include AI services.
- AI services are, like other resources in an as-a-service model, ready-made models and AI applications that are consumable as services and made available through APIs.
- organizations may access pre-trained models that accomplish specific tasks. Whether an organization needs natural language processing (‘NLP’), automatic speech recognition (‘ASR’), image recognition, or some other capability, AI services simply plug-and-play into an application through an API.
- NLP natural language processing
- ASR automatic speech recognition
- image recognition or some other capability
- the systems described herein may be used to manage, analyze, or otherwise observe deployments that include other forms of AI/ML tools such as Amazon Sagemaker (or other cloud machine-learning platform that enables developers to create, train, and deploy ML models) and related services such as Data Wrangler (a service to accelerate data prep for ML) and Pipelines (a CI/CD service for ML).
- AI/ML tools such as Amazon Sagemaker (or other cloud machine-learning platform that enables developers to create, train, and deploy ML models) and related services such as Data Wrangler (a service to accelerate data prep for ML) and Pipelines (a CI/CD service for ML).
- data services may include secure data sharing services, data marketplace services, private data exchanges services, and others.
- Secure data sharing services can allow access to live data from its original location, where those who are granted access to the data simply reference the data in a controlled and secure manner, without latency or contention from concurrent users. Because changes to data are made to a single version, data remains up-to-date for all consumers, which ensures data models are always using the latest version of such data.
- Data marketplace services operate as a single location to access live, ready-to-query data (or data that is otherwise ready for some other use).
- a data marketplace can even include a “feature stores,” which can allow data scientists to repurpose existing work. For example, once a data scientist has converted raw data into a metric (e.g., costs of goods sold), this universal metric can be found quickly and used by other data scientists for quick analysis against that data.
- a metric e.g., costs of goods sold
- the systems described herein may be used to manage, analyze, or otherwise observe deployments that include distributed training engines or similar mechanisms such as, for example, such as tools built on Dask.
- Dask is an open source library for parallel computing that is written in Python.
- Dask is designed to enable data scientists to improve model accuracy faster, as Dask enables data scientists can do everything in Python end-to-end, which means that they no longer need to convert their code to execute in environments like Apache Spark. The result is reduced complexity and increased efficiency.
- the systems described herein may also be used to manage, analyze, or otherwise observe deployments that include technologies such as RAPIDS (an open source Python framework which is built on top of Dask).
- RAPIDS an open source Python framework which is built on top of Dask.
- RAPIDS optimizes compute time and speed by providing data pipelines and executing data science code entirely on graphics processing units (GPUs) rather than CPUs.
- GPUs graphics processing units
- Multi-cluster, shared data architecture, DataFrames, Java user-defined functions (UDF) are supported to enable trained models to run within a data warehouse.
- the systems described herein may be leveraged for the specific use case of detecting and/or remediating ransomware attacks and/or other malicious action taken with respect to data, systems, and/or other resources associated with one or more entities.
- Ransomware is a type of malware from cryptovirology that threatens to publish the victim's data or perpetually block access to such data unless a ransom is paid.
- ransomware attacks may be carried out in a manner such that patterns (e.g., specific process-to-process communications, specific data access patterns, unusual amounts of encryption/re-encryption activities) emerge, where the systems described herein may monitor for such patterns.
- ransomware attacks may involve behavior that deviates from normal behavior of a cloud deployment that is not experiencing a ransomware attack, such that the mere presence of unusual activity may trigger the systems described herein to generate alerts or take some other action, even without explicit knowledge that the unusual activity is associated with a ransomware attack.
- policies may be put in place the systems described herein may be configured to enforce such policies as part of an effort to thwart ransomware attacks.
- particular network sharing protocols e.g., Common Internet File System (‘CIFS’), Network File System (‘NFS’)
- CIFS Common Internet File System
- NFS Network File System
- policies that protect backup systems may be implemented and enforced to ensure that usable backups are always available
- multifactor authentication for particular accounts may be utilized and accounts may be configured with the minimum privilege required to function
- isolated recovery environments may be created and isolation may be monitored and enforced to ensure the integrity of the recovery environment, and so on.
- the systems described herein may be configured to explicitly enforce such policies or may be configured to detect unusual activity that represents a violation of such policies, such that the mere presence of unusual activity may trigger the systems described herein to generate alerts or take some other action, even without explicit knowledge that the unusual activity is associated with a violation of a particular policy.
- ransomware attacks are often deployed as part of a larger attack that may involve, for example:
- embodiments of the present disclosure may be configured as follows:
- the systems may include one or more components that detect malicious activity based on the behavior of a process.
- the systems may include one or more components that store indicator of compromise (‘IOC’) or indicator of attack (‘IOA’) data for retrospective analysis.
- IOC indicator of compromise
- IOA indicator of attack
- the systems may include one or more components that detect and block fileless malware attacks.
- the systems may include one or more components that remove malware automatically when detected.
- the systems may include a cloud-based, SaaS-style, multitenant infrastructure.
- the systems may include one or more components that identify changes made by malware and provide the recommended remediation steps or a rollback capability.
- the systems may include one or more components that detect various application vulnerabilities and memory exploit techniques.
- the systems may include one or more components that continue to collect suspicious event data even when a managed endpoint is outside of an organization's network.
- the systems may include one or more components that perform static, on-demand malware detection scans of folders, drives, devices, or other entities.
- the systems may include data loss prevention (DLP) functionality.
- DLP data loss prevention
- the systems described herein may manage, analyze, or otherwise observe deployments that include deception technologies.
- Deception technologies allow for the use of decoys that may be generated based on scans of true network areas and data. Such decoys may be deployed as mock networks running on the same infrastructure as the real networks, but when an intruder attempts to enter the real network, they are directed to the false network and security is immediately notified. Such technologies may be useful for detecting and stopping various types of cyber threats such as, for example, Advanced Persistent Threats (‘APTs’), malware, ransomware, credential dumping, lateral movement and malicious insiders. To continue to outsmart increasingly sophisticated attackers, these solutions may continuously deploy, support, refresh and respond to deception alerts.
- APIs Advanced Persistent Threats
- the systems described herein may manage, analyze, or otherwise observe deployments that include various authentication technologies, such as multi-factor authentication and role-based authentication.
- the authentication technologies may be included in the set of resources that are managed, analyzed, or otherwise observed as interactions with the authentication technologies may monitored.
- log files or other information retained by the authentication technologies may be gathered by one or more agents and used as input to the systems described herein.
- the systems described herein may be leveraged for the specific use case of detecting supply chain attacks. More specifically, the systems described herein may be used to monitor a deployment that includes software components, virtualized hardware components, and other components of an organization's supply chain such that interactions with an outside partner or provider with access to an organization's systems and data can be monitored. In such embodiments, supply chain attacks may be carried out in a manner such that patterns (e.g., specific interactions between internal and external systems) emerge, where the systems described herein may monitor for such patterns.
- patterns e.g., specific interactions between internal and external systems
- supply chain attacks may involve behavior that deviates from normal behavior of a cloud deployment that is not experiencing a supply chain attack, such that the mere presence of unusual activity may trigger the systems described herein to generate alerts or take some other action, even without explicit knowledge that the unusual activity is associated with a supply chain attack.
- the systems described herein may be leveraged for other specific use cases such as, for example, detecting the presence of (or preventing infiltration from) cryptocurrency miners (e.g., bitcoin miners), token miners, hashing activity, non-fungible token activity, other viruses, other malware, and so on.
- cryptocurrency miners e.g., bitcoin miners
- token miners e.g., hashing activity
- non-fungible token activity other viruses, other malware, and so on.
- the systems described herein may monitor for such threats using known patterns or by detecting unusual activity, such that the mere presence of unusual activity may trigger the systems described herein to generate alerts or take some other action, even without explicit knowledge that the unusual activity is associated with a particular type of threat, intrusion, vulnerability, and so on.
- agents, sensors, or similar mechanisms may be deployed on or near managed endpoints such as computers, servers, virtualized hardware, internet of things (‘IotT’) devices, mobile devices, phones, tablets, watches, other personal digital devices, storage devices, thumb drives, secure data storage cards, or some other entity.
- IotT internet of things
- the endpoint protection platform may provide functionality such as:
- the ability to detect and prevent threats using behavioral analysis of device activity, application activity, user activity, and/or other data.
- Example embodiments are described in which policy enforcement, threat detection, or some other function is carried out by the systems described herein by detecting unusual activity, such that the mere presence of unusual activity may trigger the systems described herein to generate alerts or take some other action, even without explicit knowledge that the unusual activity is associated with a particular type of threat, intrusion, vulnerability, and so on.
- unusual activity such that the mere presence of unusual activity may trigger the systems described herein to generate alerts or take some other action, even without explicit knowledge that the unusual activity is associated with a particular type of threat, intrusion, vulnerability, and so on.
- the systems described herein may be configured to learn what constitutes ‘normal activity’—where ‘normal activity’ is activity observed, modeled, or otherwise identified in the absence of a particular type of threat, intrusion, vulnerability, and so on.
- detecting ‘unusual activity’ may alternatively be viewed as detecting a deviation from ‘normal activity’ such that ‘unusual activity’ does not need to be identified and sought out. Instead, deviations from ‘normal activity’ may be assumed to be ‘unusual activity’.
- the systems described herein or the deployments that are monitored by such systems may implement a variety of techniques.
- the systems described herein or the deployments that are monitored by such systems may tag data and logs to provide meaning or context, persistent monitoring techniques may be used to monitor a deployment at all times and in real time, custom alerts may be generated based on rules, tags, and/or known baselines from one or more polygraphs, and so on.
- data may be collected from one or more agents
- other methods and mechanisms for obtaining data may be utilized.
- some embodiments may utilize agentless deployments where no agent (or similar mechanism) is deployed on one or more customer devices, deployed within a customer's cloud deployment, or deployed at another location that is external to the data platform.
- the data platform may acquire data through one or more APIs such as the APIs that are available through various cloud services.
- one or more APIs that enable a user to access data captured by Amazon CloudTrail may be utilized by the data platform to obtain data from a customer's cloud deployment without the use of an agent that is deployed on the customer's resources.
- agents may be deployed as part of a data acquisition service or tool that does not utilize a customer's resources or environment.
- agents deployed on a customer's resources or elsewhere
- mechanisms in the data platform that can be used to obtain data from through one or more APIs such as the APIs that are available through various cloud services may be utilized.
- one or more cloud services themselves may be configured to push data to some entity (deployed anywhere), which may or may not be an agent.
- other data acquisition techniques may be utilized, including combinations and variations of the techniques described above, each of which is within the scope of the present disclosure.
- additional examples can include multi-cloud deployments, on-premises environments, hybrid cloud environments, sovereign cloud environments, heterogeneous environments, DevOps environments, DevSecOps environments, GitOps environments, quantum computing environments, data fabrics, composable applications, composable networks, decentralized applications, and many others.
- one or more of the components described above may be deployed using a secure access service edge (‘SASE’) model or similar model.
- SASE secure access service edge
- the services, functionality, or components described above may be deployed at edge devices (or relatively close to such edge device) such as a user's laptop, tablet, smartphone, or other device.
- network security controls may be delivered on such edge devices.
- SASE capabilities may be delivered as a service based upon the identity of the entity, real-time context, enterprise security/compliance policies and continuous assessment of risk/trust throughout the sessions, where the identity of entities can be associated with people, groups of people, devices, applications, services, IoT systems or edge computing locations, and so on.
- one or more of the components described above may be deployed at or near the edge devices, and the edge devices may even include local applications that are configured to utilize one or more of the components described above where the components are not deployed on the edge devices themselves.
- a method comprising: obtaining, by an agent monitoring a cloud compute environment, a data packet from an interface in the cloud compute environment, the data packet including a source address and a non-endpoint destination address; determining, by the agent and based on the non-endpoint destination address and routing information for the data packet, an endpoint destination address associated with the non-endpoint destination address of the data packet; modifying, by the agent, the data packet by replacing the non-endpoint destination address with the endpoint destination address; and providing, by the agent and based on the modified data packet, monitoring data to a data platform.
- non-endpoint destination address comprises a service IP address associated with a service network in the cloud compute environment.
- non-endpoint destination address comprises a host IP address associated with a host network in the cloud compute environment.
- a computer program product embodied in a non-transitory computer-readable medium and comprising computer instructions for: obtaining, by monitoring a cloud compute environment, a data packet from an interface in the cloud compute environment, the data packet including a source address and a non-endpoint destination address; determining, based on the non-endpoint destination address and routing information for the data packet, an endpoint destination address associated with the non-endpoint destination address of the data packet; modifying the data packet by replacing the non-endpoint destination address with the endpoint destination address; and providing, based on the modified data packet, monitoring data to a data platform.
- non-endpoint destination address comprises a service IP address associated with a service network in the cloud compute environment.
- non-endpoint destination address comprises a host IP address associated with a host network in the cloud compute environment.
- a system for monitoring a cloud compute environment comprising: a memory storing computer-executable instructions; a processor to execute the computer-executable instructions to: obtain a data packet from an interface in the cloud compute environment, the data packet including a source address and a non-endpoint destination address; determine, based on the non-endpoint destination address and routing information for the data packet, an endpoint destination address associated with the non-endpoint destination address of the data packet; modify the data packet by replacing the non-endpoint destination address with the endpoint destination address; and provide, based on the modified data packet, monitoring data to a data platform.
- non-endpoint destination address comprises a service IP address associated with a service network in the cloud compute environment.
- non-endpoint destination address comprises a host IP address associated with a host network in the cloud compute environment.
- the non-endpoint destination address comprises a service IP address associated with a service network in the cloud compute environment; and the endpoint destination address comprises a pod IP address associated with a pod in the cloud compute environment.
- one or more agents deployed in a cloud environment may monitor the cloud environment to collect and provide information about the cloud environment to a data platform such as the data platform 12 , including in any of the ways described herein.
- the agents may collect information from and/or about communications between entities in the cloud environment.
- agents may be configured to transform collected data in one or more ways that may reduce the complexities and/or resource demands associated with collecting, providing, and/or processing data, including by reducing the complexities and/or resource demands associated with joining related instances of collected data together and/or attributing collected data to appropriate entities.
- the transformations may be used to reduce the amount of data provided from the agents to the data platform. Additionally or alternatively, in some examples, the transformations may reduce the resources required by the data platform to attribute collected data to appropriate entities and/or to join related instances of collected data.
- the transformed data may be used by the data platform to generate user interface content such as alerts or polygraphs more efficiently and/or accurately.
- FIG. 5 A illustrates a container system 500 that may be deployed in a cloud environment.
- the container system 500 may include a cluster 502 of nodes 504 (e.g., node 504 -A referred to as “node A” and node 504 -B referred to as “node B”) that host containers 506 (e.g., container 506 -A- 1 and container 506 -A- 2 hosted on node A, and container 506 -B- 1 and container 506 -A- 1 hosted on node B).
- nodes 504 e.g., node 504 -A referred to as “node A” and node 504 -B referred to as “node B”
- host containers 506 e.g., container 506 -A- 1 and container 506 -A- 2 hosted on node A, and container 506 -B- 1 and container 506 -A- 1 hosted on node B.
- the nodes 504 may include physical and/or virtual compute devices configured to run instances of the containers 506 .
- the nodes 504 may be configured to run instances of the containers 506 in any suitable way, including in any of the ways described herein.
- the nodes 504 may include any of the example nodes described above.
- the containers 506 may include container images and/or executing instances of the container images on the nodes 504 .
- a container image may include executable code of an application and any dependencies, libraries, network interfaces, network configurations, and/or other resources to be used by the executable code when executed.
- An executing container may share a kernel of an operating system of a node 504 and execute in an isolated environment in the operating system of the node 504 .
- the containers 506 may be dynamic in that instances of the containers 506 may be started up, run, and stopped dynamically as governed by a container orchestration system such as Kubernetes or any other suitable orchestration system operating in the container system 500 .
- a container orchestration system such as Kubernetes or any other suitable orchestration system operating in the container system 500 .
- the executing containers 506 may send and receive communications by way of one or more communication networks 508 .
- the communications may be between the containers 506 , from non-container entities to the containers 506 , from the containers 506 to non-container entities, from external entities outside of the cluster 502 to the containers 506 in the cluster 502 , and from the containers 506 to external entities outside of the cluster 502 , for example.
- FIG. 5 A illustrates an example communication path 510 from the container 506 -A- 1 on node A to the container 506 -B- 1 on node B.
- the communication path 510 may traverse one or more of the communication networks 508 .
- the communication networks 508 may include any set and/or configuration of one or more networks configured to facilitate communication with entities in the cluster 502 , including communications with the nodes 504 and/or the containers 506 in the cluster 502 .
- the communication networks 508 may include one or more host networks configured to facilitate communications with the nodes 504 in the cluster 502 .
- the communication networks 508 may include one or more container networks configured to facilitate communications with the containers 506 in the cluster 502 , such as one or more of a pod network, a service network, and a load-balancing network.
- FIG. 5 B illustrates an example container system 512 , which may be an implementation of the container system 500 .
- the container system 512 may include the cluster 502 of nodes 504 .
- the nodes 504 may host the containers 506 implemented in pods 514 (e.g., pod 514 -A- 1 and pod 514 -A- 1 on node A, pod 514 -B- 1 and pod 514 -B- 2 on node B).
- the pods 514 may connect the containers 506 to one or more container networks of the cluster 502 such that the containers 506 in the pods 514 may send and receive communications by way of the container networks, which may include a pod network 516 and a service network 518 .
- the communications may be between the pods 514 , from non-pod entities to the pods 514 , from the pods 514 to non-pod entities, from external entities outside of the cluster 502 to the pods 514 in the cluster 502 , and from the pods 514 to external entities outside of the cluster 502 , for example.
- the pods 514 may be logical wrapper entities for the containers 506 .
- a pod may be an execution entity and may provide one or more resources for use by a container in the pod.
- the pods 514 may be created, deployed, and managed by a container orchestration system such as Kubernetes.
- the orchestration system may provide unique addresses for the pods 514 , such as pod IP addresses that may be used for addressing the pods and sending communications to and from the pods 514 .
- the pod network 516 may be provided by a container orchestration system such as Kubernetes and may support communications with the pods 514 using the unique addresses of the pods 514 .
- the pod network 516 may be configured to use the unique pod IP addresses of the pods 514 to route communications to the appropriate pods 514 in the cluster 502 .
- the pod network 516 may be configured on top of a host network.
- the service network 518 may be provided by a container orchestration system such as Kubernetes and may support communications using unique service addresses that are exposed by the service network 518 , such as unique service IP addresses.
- a service IP address may be defined to be associated with one or more pod IP addresses, and the service network 518 may be configured to map the service IP address of a data packet to an associated pod IP addresses.
- the pod network 516 may then use the pod IP address to route the data packet to the pod having the pod IP address.
- the service network 518 may be configured as a load balancer on top of the pod network 518 in some implementations.
- the container system 500 or 512 may provide one or more interfaces between entities of the cluster 502 and the communication networks of the cluster 502 .
- the interfaces may be provided between pods, the pod network 516 , the service network 518 , a host network, the nodes 504 , and any other elements on the nodes 504 .
- the container system 512 of FIG. 5 B may implement one or more container network interfaces (CNIs), such as one or more CNI plugins, to connect containers/pods with communication networks.
- CNIs container network interfaces
- a CNI plugin may insert a network interface into a container network namespace, such as with a virtual ethernet pair, to provide a container/pod with a network interface.
- Any suitable CNI may be used, including CNIs provided by EKS, Weavent, Calico, Cilium, Flannel, kubenet, GKE, etc.
- FIG. 5 B illustrates an example communication path 520 from the pod 514 -A- 1 on node A to the pod 514 -B- 1 on node B.
- the communication path 520 may traverse the service network 518 and the pod network 516 .
- the pod 514 -A- 1 may output, via a container network interface, a data packet having a service IP address as a destination address.
- the service network 518 may receive the data packet and map the service IP address to a pod IP address associated with the service IP address, such as the pod IP address of the pod 514 -B- 1 on node B.
- the pod network 516 may then route the data packet to the pod 514 -B- 1 using the pod IP address.
- Agents 522 may be deployed on the nodes 504 in the cluster 502 , as shown in FIGS. 5 A and 5 B .
- the agents 522 may be deployed on the nodes 504 in any suitable way, including in any of the ways described herein.
- the agents 522 may monitor for and collect information on their respective nodes 504 and selectively provide collected information to a data platform such as the data platform 12 .
- an agent 522 deployed on a node 504 may monitor one or more communication interfaces on the node 504 for data packets traversing the interfaces and obtain data packets that traverse the interfaces by obtaining copies of the data packets.
- the agent 522 may be configured to transform at least some of the obtained data packets, such as by replacing a non-endpoint address included in a data packet with an endpoint address.
- the agent 522 may provide information to the data platform. Because the provided information is based on the transformed data packet, the information may be more useable by the data platform than if the information was based on the non-transformed data packet. For example, the information may be configured for more efficient attribution or joining by the data platform. Additionally or alternatively, by providing information based on the transformed data packet, the agent 522 may be able to provide a lower overall amount of data to the data platform than if the information was based on the non-transformed data packet.
- FIG. 6 shows an example configuration 600 for monitoring a container system in a cloud environment.
- a communication travels from a pod 514 -A referred to as “pod A” to a pod 514 -B referred to as “pod B.”
- Pod A may output a data packet 602 that includes a source address and a destination address.
- the source address may be an endpoint address such as a pod IP address of pod A (“PA”)
- the destination address may be a non-endpoint address such as a service IP address (“SB”).
- PA pod IP address of pod A
- SB service IP address
- the service network 518 may receive the data packet 602 and map the service IP address in the data packet 602 to an endpoint address such as a pod IP address for Pod B.
- the service network 518 may route the data packet to the pod network 516 , as is illustrated in FIG. 6 by a path of a data packet 604 from the service network 518 to the pod network 516 .
- the data packet 604 may be a modified version of the data packet 602 in which the destination address has been changed from the service IP address (“SB”) to the pod IP address for pod B (“PB”).
- the pod network 516 may use the pod IP address for pod B to route the data packet 604 to pod B on node B.
- the agent 522 on node A may obtain the data packet 602 from a network interface of pod A, which means that that the agent 522 on node A obtains a copy of the data packet 602 from the network interface of pod A.
- the agent 522 on node A may also obtain the data packet 604 from one or more other network interfaces on node A, which means that that the agent 522 on node A obtains a copy of the data packet 604 from the one or more other network interfaces on node A.
- FIG. 6 shows the agent 522 obtaining data packet 602 -C, which is a copy of data packet 602 , from the network interface of pod A, as well as the agent 522 obtaining copies of the data packet 604 , which copies are labeled as data packets 604 -C, from an interface associated with the service network 518 and an interface associated with the pod network 516 .
- the agent 522 on node A may determine that the obtained data packet 602 -C includes an endpoint source address (pod IP address “PA”) and a non-endpoint destination address (service IP address “SB”). The agent 522 may determine, based on the non-endpoint destination address and routing information associated with the data packet 602 -C, an endpoint destination address associated with the non-endpoint destination address of the data packet 602 -C.
- pod IP address pod IP address
- SB non-endpoint destination address
- the agent 522 may use any suitable routing information associated with the data packet 602 -C to determine an endpoint destination address associated with the non-endpoint destination address included in the data packet 602 -C. For example, the agent 522 may access and use information associated with the data packet 604 or the data packet 604 -C to determine that the non-endpoint destination address in the data packet 602 has been routed to the endpoint destination address.
- the agent 522 may determine that the data packet 604 -C is associated with the data packet 602 -C (e.g., is a version of the data packet 602 -C after being processed by the service network 518 ), identify the destination address in the data packet 604 -C, and determine that the destination address in the data packet 604 -C is the endpoint destination address for the non-endpoint destination address in the data packet 602 -C.
- the agent 522 may access and use information in the kernel of the operating system of node A to determine an endpoint destination address associated with the non-endpoint destination address included in the data packet 602 -C.
- the agent 522 may modify the data packet 602 -C by replacing the non-endpoint destination address with the determined endpoint destination address.
- the non-endpoint service IP destination address in the data packet 602 -C may be replaced by the determined endpoint pod IP destination address.
- the agent 522 may modify the destination address in the data packet 602 -C in any suitable way, including by rewriting a portion of the data packet 602 -C, such as a header portion, a tuple, or any other portion of the data packet 602 -C.
- the modified version of the data packet 602 -C is represented as modified data packet 602 -M in FIG. 6 .
- the agent 522 may be configured to modify a data packet based at least in part on where the data packet is captured by the agent 522 .
- the modification of the data packet 602 -C described above may be performed by the agent 522 based on the data packet 602 -C being captured from a network interface of a pod and/or based on the data packet 602 -C being an outgoing data packet from a network interface of a pod.
- the agent 522 may provide information to a data platform.
- the information may be provided in any suitable form and may indicate the endpoint source and destination addresses of the modified data packet 602 -M.
- the information provided to the data platform may include the modified data packet 602 -M.
- the data platform may use the information received from the agent 522 on node A to attribute the data packet 602 -C to appropriate endpoints, which in this example are pod A on node A and pod B on node B. Because the information received by the data platform from the agent 522 is based on a modification of the data packet 602 -C, the data platform may more efficiently and/or accurately attribute the data packet 602 -C to the appropriate endpoints without having to process additional information about other data packets such as data packet 604 -C to determine the attribution.
- the agent 522 may forego providing information about the data packets 604 -C to the data platform (and/or other data packets captured at other interfaces along the network stack), which may conserve network, storage, and/or processing resources of the data platform.
- the data platform may use the information received from the agent 522 on node A to join the data packet 602 -C to information received from the agent 522 on node B.
- the agent 522 on node B may provide, to the data platform, information about the data packet 604 received by pod B on node B.
- the information may include a copy of the data packet 604 .
- the data platform may use the matching endpoint addresses of the data packets received from the agent 522 on node A and from the agent 522 on node B to match and join the data packets as related to a same communication.
- the agent 522 and/or the data platform may be configured to transform a connection tuple of a data packet to support matching and joining data packets received from different agents 522 on different nodes.
- a connection tuple of a data packet By changing the connection tuple, content of related data packets received by the data platform from different agents on different nodes may be brought into sync and may support joining of information about the data packets by the data platform.
- FIG. 7 shows another example configuration 700 for monitoring a container system in a cloud environment.
- a communication travels from a load balancer 702 referred to as “load balancer A” or “LBA” to a pod 514 -A referred to as “pod A” that is located on node A.
- Load balancer A may output a data packet 704 that includes a source address and a destination address.
- the source address may be a non-endpoint address such as an IP address of the load balancer A (“LBA”)
- the destination address may be a non-endpoint address such as a node IP address (“NA”) of node A.
- LBA IP address of the load balancer A
- NA node IP address
- a network interface 706 of node A may receive the data packet 704 and map the node IP address in the data packet 704 to an endpoint address such as a pod IP address for Pod A.
- the network interface 706 of node A may route the data packet to pod A, as is illustrated in FIG. 7 by a path of a data packet 708 from the network interface 706 of node A to pod A.
- the data packet 708 may be a modified version of the data packet 704 in which the destination address has been changed from the node IP address (“NA”) to the pod IP address for pod A (“PA”).
- An agent 522 on node A may obtain the data packet 708 from a network interface of pod A, which means that that the agent 522 on node A obtains a copy of the data packet 708 from the network interface of pod A.
- the agent 522 obtaining a copy of the data packet 708 is illustrated by data packet 708 -C, which is a copy of the data packet 708 , being obtained by the agent 522 from pod A.
- the agent 522 on node A may provide information associated with the data packet 708 -C to a data platform, which in some embodiments may include providing the data packet 708 -C to the data platform as shown in FIG. 7 .
- An agent 522 on load balancer A may obtain the data packet 704 from a network interface of load balancer A, which means that that the agent 522 on load balancer A obtains a copy of the data packet 704 from the network interface of load balancer A.
- the agent 522 on load balancer A obtaining a copy of the data packet 704 is illustrated by data packet 704 -C, which is a copy of the data packet 704 , being obtained by the agent 522 from the network interface of load balancer A.
- the agent 522 on load balancer A may determine that the obtained data packet 704 -C includes a non-endpoint destination address (node IP address “NA”). The agent 522 may determine, based on the non-endpoint destination address and routing information associated with the data packet 704 -C, an endpoint destination address associated with the non-endpoint destination address of the data packet 704 -C.
- NA node IP address
- the agent 522 may use any suitable routing information associated with the data packet 704 -C to determine an endpoint destination address associated with the non-endpoint destination address included in the data packet 704 -C. For example, the agent 522 may access and use information associated with the data packet 708 or the data packet 708 -C to determine that the non-endpoint destination address in the data packet 704 has been routed to the endpoint destination address. For instance, the agent 522 may determine, from the network interface 706 of node A that the data packet 704 has been routed to pod A.
- the agent 522 on load balancer A may modify the data packet 704 -C by replacing the non-endpoint destination address with the determined endpoint destination address.
- the non-endpoint node IP destination address in the data packet 704 -C may be replaced by the determined endpoint pod IP destination address.
- the agent 522 may modify the destination address in the data packet 704 -C in any suitable way, including by rewriting a portion of the data packet 704 -C, such as a header portion, a tuple, or any other portion of the data packet 704 -C.
- the modified version of the data packet 704 -C is represented as modified data packet 704 -M in FIG. 7 .
- the agent 522 on load balancer A may provide information to the data platform.
- the information may be provided in any suitable form and may indicate the endpoint source and destination addresses of the modified data packet 704 -M.
- the information provided to the data platform may include the modified data packet 704 -M.
- the data platform may use the information received from the agent 522 on load balancer A to attribute the data packet 704 -C to an appropriate endpoint, which in this example includes and endpoint destination of pod A on node A. Because the information received by the data platform from the agent 522 is based on a modification of the data packet 704 -C, the data platform may more efficiently and/or accurately attribute the data packet 704 -C to an appropriate endpoint without having to process additional information about other data packets such as data packet 708 -C to determine the attribution.
- the data platform may use the information received from the agent 522 on node A and the agent 522 on load balancer A to join data packets 704 -M and 708 -C. Because the agent 522 on load balancer A provided information based on the modified data packet 704 -M, the data platform may more efficiently join the data packets 704 -M and 708 -C because they include matching endpoint addresses.
- an agent 522 may be configured to modify a data packet based at least in part on where the data packet is captured by the agent 522 .
- the modification of the data packet 602 -C described above may be performed by the agent 522 based on the data packet 602 -C being captured from a network interface of a pod and/or based on the data packet 602 -C being an outgoing data packet from a network interface of a pod.
- the modification of the data packet 704 -C described above may be performed by the agent 522 based on the data packet 704 -C being captured from a network interface of a load balancer and/or based on the data packet 704 -C being an outgoing data packet from network interface of a load balancer.
- FIG. 8 illustrates an example method 800 of monitoring a cloud compute environment. While FIG. 8 depicts illustrative operations according to some embodiments, other embodiments may omit, add to, reorder, combine, and/or modify any of the operations shown in FIG. 8 . In some implementations, one or more of the operations shown in FIG. 8 may be performed by an agent deployed in a cloud compute environment.
- an agent monitoring a cloud compute environment obtains a data packet from an interface in the cloud compute environment. Operation 802 may be performed in any of the ways described herein to obtain a copy of the data packet.
- the data packet may include a source address and a destination address.
- at least one of the addresses may be a non-endpoint address.
- the non-endpoint address may be any intermediate address along a communication path that is not an endpoint address (e.g., an address of a container or a pod) for the communication.
- the non-endpoint address may be a service IP address or a node IP address.
- the agent determines an endpoint address associated with the non-endpoint address in the data packet. Operation 804 may be performed in any of the ways described herein, or in any other suitable way.
- the agent modifies the data packet by replacing the non-endpoint address with the endpoint address. Operation 806 may be performed in any of the ways described herein.
- the agent provided monitoring data to a data platform based on the modified data packet. Operation 808 may be performed in any of the ways described herein.
- the monitoring data may include any information associated with the modified data packet.
- the monitoring data may include the modified data packet, or at least the source and destination addresses included in the modified data packet.
- the data platform may receive the monitoring data from the agent, as well as additional monitoring data from one or more other agents monitoring the cloud compute environment.
- the data platform may use the received monitoring data to perform one or more data platform operations, which may include storing the monitoring data, processing the monitoring data (e.g., analyzing the monitoring data), and generating content based on the processing of the monitoring data.
- the data platform may generate and provide user interface content such as one or more alerts and/or multidimensional graphs (e.g., polygraphs) based on the monitoring data that includes information that is based one or more data packets that have been transformed by the agent (and additional agents) in any of the ways described herein.
Abstract
Example systems and methods monitor a cloud compute environment. An example method includes an agent obtaining a data packet from an interface in the cloud compute environment, the data packet including a source address and a non-endpoint destination address; determining, based on the non-endpoint destination address and routing information for the data packet, an endpoint destination address associated with the non-endpoint destination address of the data packet; modifying the data packet by replacing the non-endpoint destination address with the endpoint destination address; and providing, based on the modified data packet, monitoring data to a data platform.
Description
The present application is a continuation-in-part application of U.S. patent application Ser. No. 17/504,311 filed on Oct. 18, 2021, which is a continuation of U.S. patent application Ser. No. 16/665,961, filed Oct. 28, 2019, now U.S. Pat. No. 11,153,339, which is a continuation of U.S. patent application Ser. No. 16/134,794, filed Sep. 18, 2018, now U.S. Pat. No. 10,581,891, which claims priority to U.S. Provisional Patent Application No. 62/590,986, filed Nov. 27, 2017, and also claims priority to U.S. Provisional Patent Application No. 62/650,971, filed Mar. 30, 2018. The present application also claims priority to U.S. Provisional Patent Application No. 63/231,661 filed on Aug. 10, 2021. The contents of these applications are hereby incorporated by reference in their entirety.
The accompanying drawings illustrate various embodiments and are a part of the specification. The illustrated embodiments are merely examples and do not limit the scope of the disclosure. Throughout the drawings, identical or similar reference numbers designate identical or similar elements.
Various illustrative embodiments are described herein with reference to the accompanying drawings. It will, however, be evident that various modifications and changes may be made thereto, and additional embodiments may be implemented, without departing from the scope of the invention as set forth in the claims. For example, certain features of one embodiment described herein may be combined with or substituted for features of another embodiment described herein. The description and drawings are accordingly to be regarded in an illustrative rather than a restrictive sense.
A compute asset 16 may be associated with (e.g., owned, deployed, or managed by) a particular entity, such as a customer or client of cloud environment 14 and/or data platform 12. Accordingly, for purposes of the discussion herein, cloud environment 14 may be used by one or more entities.
The data ingested by data ingestion resources 18 from cloud environment 14 may include any type of data as may serve a particular implementation. For example, the data may include data representative of configuration information associated with compute assets 16, information about one or more processes running on compute assets 16, network activity information, information about events (creation events, modification events, communication events, user-initiated events, etc.) that occur with respect to compute assets 16, etc. In some examples, the data may or may not include actual customer data processed or otherwise generated by compute assets 16.
As illustrated by arrow 28, data ingestion resources 18 may be configured to load the data ingested from cloud environment 14 into a data store 30. Data store 30 is illustrated in FIG. 1A as being separate from and communicatively coupled to data platform 12. However, in some alternative embodiments, data store 30 is included within data platform 12.
Although the examples described herein largely relate to embodiments where data is collected from agents and ultimately stored in a data store such as those provided by Snowflake, in other embodiments data that is collected from agents and other sources may be stored in different ways. For example, data that is collected from agents and other sources may be stored in a data warehouse, data lake, data mart, and/or any other data store.
A data warehouse may be embodied as an analytic database (e.g., a relational database) that is created from two or more data sources. Such a data warehouse may be leveraged to store historical data, often on the scale of petabytes. Data warehouses may have compute and memory resources for running complicated queries and generating reports. Data warehouses may be the data sources for business intelligence (‘BI’) systems, machine learning applications, and/or other applications. By leveraging a data warehouse, data that has been copied into the data warehouse may be indexed for good analytic query performance, without affecting the write performance of a database (e.g., an Online Transaction Processing (‘OLTP’) database). Data warehouses also enable the joining data from multiple sources for analysis. For example, a sales OLTP application probably has no need to know about the weather at various sales locations, but sales predictions could take advantage of that data. By adding historical weather data to a data warehouse, it would be possible to factor it into models of historical sales data.
Data lakes, which store files of data in their native format, may be considered as “schema on read” resources. As such, any application that reads data from the lake may impose its own types and relationships on the data. Data warehouses, on the other hand, are “schema on write,” meaning that data types, indexes, and relationships are imposed on the data as it is stored in an enterprise data warehouse (EDW). “Schema on read” resources may be beneficial for data that may be used in several contexts and poses little risk of losing data. “Schema on write” resources may be beneficial for data that has a specific purpose, and good for data that must relate properly to data from other sources. Such data stores may include data that is encrypted using homomorphic encryption, data encrypted using privacy-preserving encryption, smart contracts, non-fungible tokens, decentralized finance, and other techniques.
Data marts may contain data oriented towards a specific business line whereas data warehouses contain enterprise-wide data. Data marts may be dependent on a data warehouse, independent of the data warehouse (e.g., drawn from an operational database or external source), or a hybrid of the two. In embodiments described herein, different types of data stores (including combinations thereof) may be leveraged.
As illustrated by arrow 32, data processing resources 20 may be configured to access data in data store 30 to perform the various operations described herein. In some examples, this may include performing one or more queries with respect to the data stored in data store 30. Such queries may be generated using any suitable query language.
In some examples, the queries provided by data processing resources 20 may be configured to direct data store 30 to perform one or more data analytics operations with respect to the data stored within data store 30. These data analytics operations may be with respect to data specific to a particular entity (e.g., data residing in one or more silos within data store 30 that are associated with a particular customer) and/or data associated with multiple entities. For example, data processing resources 20 may be configured to analyze data associated with a first entity and use the results of the analysis to perform one or more operations with respect to a second entity.
One or more operations performed by data processing resources 20 may be performed periodically according to a predetermined schedule. For example, one or more operations may be performed by processing resources 20 every hour or any other suitable time interval. Additionally or alternatively, one or more operations performed by data processing resources 20 may be performed in substantially real-time (or near real-time) as data is ingested into data platform 12. In this manner, the results of such operations (e.g., one or more detected anomalies in the data) may be provided to one or more external entities (e.g., computing device 24 and/or one or more users) in substantially real-time and/or in near real-time.
Also shown in FIG. 1B is a load balancer 40 configured to perform one or more load balancing operations with respect to data ingestion operations performed by data ingestion resources 18 and/or user interface operations performed by user interface resources 22. Load balancer 40 is shown to be included in data platform 12. However, load balancer 40 may alternatively be located external to data platform 12. Load balancer 40 may be implemented by any suitable microservice, application, and/or other computing resources. In some alternative examples, data platform 12 may not utilize a load balancer such as load balancer 40.
Also shown in FIG. 1B is long term storage 42 with which data ingestion resources may interface, as illustrated by arrow 44. Long term storage 42 may be implemented by any suitable type of storage resources, such as cloud-based storage (e.g., AWS S3, etc.) and/or on-premises storage and may be used by data ingestion resources 18 as part of the data ingestion process. Examples of this are described herein. In some examples, data platform 12 may not utilize long term storage 42.
The embodiments described herein can be implemented in numerous ways, including as a process; an apparatus; a system; a composition of matter; a computer program product embodied on a computer readable storage medium; and/or a processor, such as a processor configured to execute instructions stored on and/or provided by a memory coupled to the processor. In this specification, these implementations, or any other form that the invention may take, may be referred to as techniques. In general, the order of the steps of disclosed processes may be altered within the scope of the principles described herein. Unless stated otherwise, a component such as a processor or a memory described as being configured to perform a task may be implemented as a general component that is temporarily configured to perform the task at a given time or a specific component that is manufactured to perform the task. As used herein, the term ‘processor’ refers to one or more devices, circuits, and/or processing cores configured to process data, such as computer program instructions.
In some examples, a non-transitory computer-readable medium storing computer-readable instructions may be provided in accordance with the principles described herein. The instructions, when executed by a processor of a computing device, may direct the processor and/or computing device to perform one or more operations, including one or more of the operations described herein. Such instructions may be stored and/or transmitted using any of a variety of known computer-readable media.
A non-transitory computer-readable medium as referred to herein may include any non-transitory storage medium that participates in providing data (e.g., instructions) that may be read and/or executed by a computing device (e.g., by a processor of a computing device). For example, a non-transitory computer-readable medium may include, but is not limited to, any combination of non-volatile storage media and/or volatile storage media. Exemplary non-volatile storage media include, but are not limited to, read-only memory, flash memory, a solid-state drive, a magnetic storage device (e.g. a hard disk, a floppy disk, magnetic tape, etc.), ferroelectric random-access memory (“RAM”), and an optical disc (e.g., a compact disc, a digital video disc, a Blu-ray disc, etc.). Exemplary volatile storage media include, but are not limited to, RAM (e.g., dynamic RAM).
As shown in FIG. 1C , computing device 50 may include a communication interface 52, a processor 54, a storage device 56, and an input/output (“I/O”) module 58 communicatively connected one to another via a communication infrastructure 60. While an exemplary computing device 50 is shown in FIG. 1C , the components illustrated in FIG. 1C are not intended to be limiting. Additional or alternative components may be used in other embodiments. Components of computing device 50 shown in FIG. 1C will now be described in additional detail.
I/O module 58 may include one or more I/O modules configured to receive user input and provide user output. I/O module 58 may include any hardware, firmware, software, or combination thereof supportive of input and output capabilities. For example, I/O module 58 may include hardware and/or software for capturing user input, including, but not limited to, a keyboard or keypad, a touchscreen component (e.g., touchscreen display), a receiver (e.g., an RF or infrared receiver), motion sensors, and/or one or more input buttons.
I/O module 58 may include one or more devices for presenting output to a user, including, but not limited to, a graphics engine, a display (e.g., a display screen), one or more output drivers (e.g., display drivers), one or more audio speakers, and one or more audio drivers. In certain embodiments, I/O module 58 is configured to provide graphical data to a display for presentation to a user. The graphical data may be representative of one or more graphical user interfaces and/or any other graphical content as may serve a particular implementation.
Two example datacenters (104 and 106) are shown in FIG. 1D , and are associated with (e.g., belong to) entities named entity A and entity B, respectively. A datacenter may include dedicated equipment (e.g., owned and operated by entity A, or owned/leased by entity A and operated exclusively on entity A's behalf by a third party). A datacenter can also include cloud-based resources, such as infrastructure as a service (IaaS), platform as a service (PaaS), and/or software as a service (SaaS) elements. The techniques described herein can be used in conjunction with multiple types of datacenters, including ones wholly using dedicated equipment, ones that are entirely cloud-based, and ones that use a mixture of both dedicated equipment and cloud-based resources.
Both datacenter 104 and datacenter 106 include a plurality of nodes, depicted collectively as set of nodes 108 and set of nodes 110, respectively, in FIG. 1D . These nodes may implement compute assets 16. Installed on each of the nodes are in-server/in-virtual machine (VM)/embedded in IoT device agents (e.g., agent 112), which are configured to collect data and report it to data platform 12 for analysis. As described herein, agents may be small, self-contained binaries that can be run on any appropriate platforms, including virtualized ones (and, as applicable, within containers). Agents may monitor the nodes on which they execute for a variety of different activities, including: connection, process, user, machine, and file activities. Agents can be executed in user space, and can use a variety of kernel modules (e.g., auditd, iptables, netfilter, pcap, etc.) to collect data. Agents can be implemented in any appropriate programming language, such as C or Golang, using applicable kernel APIs.
As described herein, agents can selectively report information to data platform 12 in varying amounts of detail and/or with variable frequency. As is also described herein, the data collected by agents may be used by data platform 12 to create polygraphs, which are graphs of logical entities, connected by behaviors. In some embodiments, agents report information directly to data platform 12. In other embodiments, at least some agents provide information to a data aggregator, such as data aggregator 114, which in turn provides information to data platform 12. The functionality of a data aggregator can be implemented as a separate binary or other application (distinct from an agent binary), and can also be implemented by having an agent execute in an “aggregator mode” in which the designated aggregator node acts as a Layer 7 proxy for other agents that do not have access to data platform 12. Further, a chain of multiple aggregators can be used, if applicable (e.g., with agent 112 providing data to data aggregator 114, which in turn provides data to another aggregator (not pictured) which provides data to data platform 12). An example way to implement an aggregator is through a program written in an appropriate language, such as C or Golang.
Use of an aggregator can be beneficial in sensitive environments (e.g., involving financial or medical transactions) where various nodes are subject to regulatory or other architectural requirements (e.g., prohibiting a given node from communicating with systems outside of datacenter 104). Use of an aggregator can also help to minimize security exposure more generally. As one example, by limiting communications with data platform 12 to data aggregator 114, individual nodes in nodes 108 need not make external network connections (e.g., via Internet 124), which can potentially expose them to compromise (e.g., by other external devices, such as device 118, operated by a criminal). Similarly, data platform 12 can provide updates, configuration information, etc., to data aggregator 114 (which in turn distributes them to nodes 108), rather than requiring nodes 108 to allow incoming connections from data platform 12 directly.
Another benefit of an aggregator model is that network congestion can be reduced (e.g., with a single connection being made at any given time between data aggregator 114 and data platform 12, rather than potentially many different connections being open between various of nodes 108 and data platform 12). Similarly, network consumption can also be reduced (e.g., with the aggregator applying compression techniques/bundling data received from multiple agents).
One example way that an agent (e.g., agent 112, installed on node 116) can provide information to data aggregator 114 is via a REST API, formatted using data serialization protocols such as Apache Avro. One example type of information sent by agent 112 to data aggregator 114 is status information. Status information may be sent by an agent periodically (e.g., once an hour or once any other predetermined amount of time). Alternatively, status information may be sent continuously or in response to occurrence of one or more events. The status information may include, but is not limited to, a. an amount of event backlog (in bytes) that has not yet been transmitted, b. configuration information, c. any data loss period for which data was dropped, d. a cumulative count of errors encountered since the agent started, e. version information for the agent binary, and/or f. cumulative statistics on data collection (e.g., number of network packets processed, new processes seen, etc.).
A second example type of information that may be sent by agent 112 to data aggregator 114 is event data (described in more detail herein), which may include a UTC timestamp for each event. As applicable, the agent can control the amount of data that it sends to the data aggregator in each call (e.g., a maximum of 10 MB) by adjusting the amount of data sent to manage the conflicting goals of transmitting data as soon as possible, and maximizing throughput. Data can also be compressed or uncompressed by the agent (as applicable) prior to sending the data.
Each data aggregator may run within a particular customer environment. A data aggregator (e.g., data aggregator 114) may facilitate data routing from many different agents (e.g., agents executing on nodes 108) to data platform 12. In various embodiments, data aggregator 114 may implement a SOCKS 5 caching proxy through which agents can connect to data platform 12. As applicable, data aggregator 114 can encrypt (or otherwise obfuscate) sensitive information prior to transmitting it to data platform 12, and can also distribute key material to agents which can encrypt the information (as applicable). Data aggregator 114 may include a local storage, to which agents can upload data (e.g., pcap packets). The storage may have a key-value interface. The local storage can also be omitted, and agents configured to upload data to a cloud storage or other storage area, as applicable. Data aggregator 114 can, in some embodiments, also cache locally and distribute software upgrades, patches, or configuration information (e.g., as received from data platform 12).
Various examples associated with agent data collection and reporting will now be described.
In the following example, suppose that a user (e.g., a network administrator) at entity A (hereinafter “user A”) has decided to begin using the services of data platform 12. In some embodiments, user A may access a web frontend (e.g., web app 120) using a computer 126 and enrolls (on behalf of entity A) an account with data platform 12. After enrollment is complete, user A may be presented with a set of installers, pre-built and customized for the environment of entity A, that user A can download from data platform 12 and deploy on nodes 108. Examples of such installers include, but are not limited to, a Windows executable file, an iOS app, a Linux package (e.g., .deb or .rpm), a binary, or a container (e.g., a Docker container). When a user (e.g., a network administrator) at entity B (hereinafter “user B”) also signs up for the services of data platform 12, user B may be similarly presented with a set of installers that are pre-built and customized for the environment of entity B.
User A deploys an appropriate installer on each of nodes 108 (e.g., with a Windows executable file deployed on a Windows-based platform or a Linux package deployed on a Linux platform, as applicable). As applicable, the agent can be deployed in a container. Agent deployment can also be performed using one or more appropriate automation tools, such as Chef, Puppet, Salt, and Ansible. Deployment can also be performed using managed/hosted container management/orchestration frameworks such as Kubernetes, Mesos, and/or Docker Swarm.
In various embodiments, the agent may be installed in the user space (i.e., is not a kernel module), and the same binary is executed on each node of the same type (e.g., all Windows-based platforms have the same Windows-based binary installed on them). An illustrative function of an agent, such as agent 112, is to collect data (e.g., associated with node 116) and report it (e.g., to data aggregator 114). Other tasks that can be performed by agents include data configuration and upgrading.
One approach to collecting data as described herein is to collect virtually all information available about a node (and, e.g., the processes running on it). Alternatively, the agent may monitor for network connections, and then begin collecting information about processes associated with the network connections, using the presence of a network packet associated with a process as a trigger for collecting additional information about the process. As an example, if a user of node 116 executes an application, such as a calculator application, which does not typically interact with the network, no information about use of that application may be collected by agent 112 and/or sent to data aggregator 114. If, however, the user of node 116 executes an ssh command (e.g., to ssh from node 116 to node 122), agent 112 may collect information about the process and provide associated information to data aggregator 114. In various embodiments, the agent may always collect/report information about certain events, such as privilege escalation, irrespective of whether the event is associated with network activity.
An approach to collecting information (e.g., by an agent) is as follows, and described in conjunction with process 200 depicted in FIG. 2A . An agent (e.g., agent 112) monitors its node (e.g., node 116) for network activity. One example way that agent 112 can monitor node 116 for network activity is by using a network packet capture tool (e.g., listening using libpcap). As packets are received (201), the agent obtains and maintains (e.g., in an in-memory cache) connection information associated with the network activity (202). Examples of such information include DNS query/response, TCP, UDP, and IP information.
The agent may also determine a process associated with the network connection (203). One example approach is for the agent to use a kernel network diagnostic API (e.g., netlink_diag) to obtain inode/process information from the kernel. Another example approach is for the agent to scan using netstat (e.g., on /proc/net/tcp, /proc/net/tcp6, /proc/net/udp, and/proc/net/udp6) to obtain sockets and relate them to processes. Information such as socket state (e.g., whether a socket is connected, listening, etc.) can also be collected by the agent.
One way an agent can obtain a mapping between a given inode and a process identifier is to scan within the /proc/pid directory. For each of the processes currently running, the agent examines each of their file descriptors. If a file descriptor is a match for the inode, the agent can determine that the process associated with the file descriptor owns the inode. Once a mapping is determined between an inode and a process identifier, the mapping is cached. As additional packets are received for the connection, the cached process information is used (rather than a new search being performed).
In some cases, exhaustively scanning for an inode match across every file descriptor may not be feasible (e.g., due to CPU limitations). In various embodiments, searching through file descriptors is accordingly optimized. User filtering is one example of such an optimization. A given socket is owned by a user. Any processes associated with the socket will be owned by the same user as the socket. When matching an inode (identified as relating to a given socket) against processes, the agent can filter through the processes and only examine the file descriptors of processes sharing the same user owner as the socket. In various embodiments, processes owned by root are always searched against (e.g., even when user filtering is employed).
Another example of an optimization is to prioritize searching the file descriptors of certain processes over others. One such prioritization is to search through the subdirectories of /proc/ starting with the youngest process. One approximation of such a sort order is to search through /proc/ in reverse order (e.g., examining highest numbered processes first). Higher numbered processes are more likely to be newer (i.e., not long-standing processes), and thus more likely to be associated with new connections (i.e., ones for which inode-process mappings are not already cached). In some cases, the most recently created process may not have the highest process identifier (e.g., due to the kernel wrapping through process identifiers).
Another example prioritization is to query the kernel for an identification of the most recently created process and to search in a backward order through the directories in /proc/ (e.g., starting at the most recently created process and working backwards, then wrapping to the highest value (e.g., 32768) and continuing to work backward from there). An alternate approach is for the agent to keep track of the newest process that it has reported information on (e.g., to data aggregator 114), and begin its search of /proc/ in a forward order starting from the PID of that process.
Another example prioritization is to maintain, for each user actively using node 116, a list of the five (or any other number) most recently active processes. Those processes are more likely than other processes (less active, or passive) on node 116 to be involved with new connections, and can thus be searched first. For many processes, lower valued file descriptors tend to correspond to non-sockets (e.g., stdin, stdout, stderr). Yet another optimization is to preferentially search higher valued file descriptors (e.g., across processes) over lower valued file descriptors (that are less likely to yield matches).
In some cases, while attempting to locate a process identifier for a given inode, an agent may encounter a socket that does not correspond to the inode being matched against and is not already cached. The identity of that socket (and its corresponding inode) can be cached, once discovered, thus removing a future need to search for that pair.
In some cases, a connection may terminate before the agent is able to determine its associated process (e.g., due to a very short-lived connection, due to a backlog in agent processing, etc.). One approach to addressing such a situation is to asynchronously collect information about the connection using the audit kernel API, which streams information to user space. The information collected from the audit API (which can include PID/inode information) can be matched by the agent against pcap/inode information. In some embodiments, the audit API is always used, for all connections. However, due to CPU utilization considerations, use of the audit API can also be reserved for short/otherwise problematic connections (and/or omitted, as applicable).
Once the agent has determined which process is associated with the network connection (203), the agent can then collect additional information associated with the process (204). As will be described in more detail below, some of the collected information may include attributes of the process (e.g., a process parent hierarchy, and an identification of a binary associated with the process). As will also be described in more detail below, other of the collected information is derived (e.g., session summarization data and hash values).
The collected information is then transmitted (205), e.g., by an agent (e.g., agent 112) to a data aggregator (e.g., data aggregator 114), which in turn provides the information to data platform 12. In some embodiments, all information collected by an agent may be transmitted (e.g., to a data aggregator and/or to data platform 12). In other embodiments, the amount of data transmitted may be minimized (e.g., for efficiency reasons), using various techniques.
One approach to minimizing the amount of data flowing from agents (such as agents installed on nodes 108) to data platform 12 is to use a technique of implicit references with unique keys. The keys can be explicitly used by data platform 12 to extract/derive relationships, as necessary, in a data set at a later time, without impacting performance.
As previously mentioned, some data collected about a process is constant and does not change over the lifetime of the process (e.g., attributes), and some data changes (e.g., statistical information and other variable information). Constant data can be transmitted (210) once, when the agent first becomes aware of the process. And, if any changes to the constant data are detected (e.g., a process changes its parent), a refreshed version of the data can be transmitted (210) as applicable.
In some examples, an agent may collect variable data (e.g., data that may change over the lifetime of the process). In some examples, variable data can be transmitted (210) at periodic (or other) intervals. Alternatively, variable data may be transmitted in substantially real time as it is collected. In some examples, the variable data may indicate a thread count for a process, a total virtual memory used by the process, the total resident memory used by the process, the total time spent by the process executing in user space, and/or the total time spent by the process executing in kernel space. In some examples, the data may include a hash that may be used within data platform 12 to join process creation time attributes with runtime attributes to construct a full dataset.
Below are additional examples of data that an agent, such as agent 112, can collect and provide to data platform 12.
1. User Data
Core User Data: user name, UID (user ID), primary group, other groups, home directory.
Failed Login Data: IP address, hostname, username, count.
User Login Data: user name, hostname, IP address, start time, TTY (terminal), UID (user ID), GID (group ID), process, end time.
2. Machine Data
Dropped Packet Data: source IP address, destination IP address, destination port, protocol, count.
Machine Data: hostname, domain name, architecture, kernel, kernel release, kernel version, OS, OS version, OS description, CPU, memory, model number, number of cores, last boot time, last boot reason, tags (e.g., Cloud provider tags such as AWS, GCP, or Azure tags), default router, interface name, interface hardware address, interface IP address and mask, promiscuous mode.
3. Network Data
Network Connection Data: source IP address, destination IP address, source port, destination port, protocol, start time, end time, incoming and outgoing bytes, source process, destination process, direction of connection, histograms of packet length, inter packet delay, session lengths, etc.
Listening Ports in Server: source IP address, port number, protocol, process.
Dropped Packet Data: source IP address, destination IP address, destination port, protocol, count.
Arp Data: source hardware address, source IP address, destination hardware address, destination IP address.
DNS Data: source IP address, response code, response string, question (request), packet length, final answer (response).
4. Application Data
Package Data: exe path, package name, architecture, version, package path, checksums (MD5, SHA-1, SHA-256), size, owner, owner ID.
Application Data: command line, PID (process ID), start time, UID (user ID), EUID (effective UID), PPID (parent process ID), PGID (process group ID), SID (session ID), exe path, username, container ID.
5. Container Data
Container Image Data: image creation time, parent ID, author, container type, repo, (AWS) tags, size, virtual size, image version.
Container Data: container start time, container type, container name, container ID, network mode, privileged, PID mode, IP addresses, listening ports, volume map, process ID.
6. File Data
File path, file data hash, symbolic links, file creation data, file change data, file metadata, file mode.
As mentioned above, an agent, such as agent 112, can be deployed in a container (e.g., a Docker container), and can also be used to collect information about containers. Collection about a container can be performed by an agent irrespective of whether the agent is itself deployed in a container or not (as the agent can be deployed in a container running in a privileged mode that allows for monitoring).
Agents can discover containers (e.g., for monitoring) by listening for container create events (e.g., provided by Docker), and can also perform periodic ordered discovery scans to determine whether containers are running on a node. When a container is discovered, the agent can obtain attributes of the container, e.g., using standard Docker API calls (e.g., to obtain IP addresses associated with the container, whether there's a server running inside, what port it is listening on, associated PIDs, etc.). Information such as the parent process that started the container can also be collected, as can information about the image (which comes from the Docker repository).
In various embodiments, agents may use namespaces to determine whether a process is associated with a container. Namespaces are a feature of the Linux kernel that can be used to isolate resources of a collection of processes. Examples of namespaces include process ID (PID) namespaces, network namespaces, and user namespaces. Given a process, the agent can perform a fast lookup to determine whether the process is part of the namespace the container claims to be its namespace.
As mentioned, agents can be configured to report certain types of information (e.g., attribute information) once, when the agent first becomes aware of a process. In various embodiments, such static information is not reported again (or is reported once a day, every twelve hours, etc.), unless it changes (e.g., a process changes its parent, changes its owner, or a SHA-1 of the binary associated with the process changes).
In contrast to static/attribute information, certain types of data change constantly (e.g., network-related data). In various embodiments, agents are configured to report a list of current connections every minute (or other appropriate time interval). In that connection list will be connections that started in that minute interval, connections that ended in that minute interval, and connections that were ongoing throughout the minute interval (e.g., a one minute slice of a one hour connection).
In various embodiments, agents are configured to collect/compute statistical information about connections (e.g., at the one minute level of granularity and or at any other time interval). Examples of such information include, for the time interval, the number of bytes transferred, and in which direction. Another example of information collected by an agent about a connection is the length of time between packets. For connections that span multiple time intervals (e.g., a seven minute connection), statistics may be calculated for each minute of the connection. Such statistical information (for all connections) can be reported (e.g., to a data aggregator) once a minute.
In various embodiments, agents are also configured to maintain histogram data for a given network connection, and provide the histogram data (e.g., in the Apache Avro data exchange format) under the Connection event type data. Examples of such histograms include: 1. a packet length histogram (packet len_hist), which characterizes network packet distribution; 2. a session length histogram (session_len_hist), which characterizes a network session length; 3. a session time histogram (session_time_hist), which characterizes a network session time; and 4. a session switch time histogram (session_switch_time_hist), which characterizes network session switch time (i.e., incoming→outgoing and vice versa). For example, histogram data may include one or more of the following fields: 1. count, which provides a count of the elements in the sampling; 2. sum, which provides a sum of elements in the sampling; 3. max, which provides the highest value element in the sampling; 4. std_dev, which provides the standard deviation of elements in the sampling; and 5. buckets, which provides a discrete sample bucket distribution of sampling data (if applicable).
For some protocols (e.g., HTTP), typically, a connection is opened, a string is sent, a string is received, and the connection is closed. For other protocols (e.g., NFS), both sides of the connection engage in a constant chatter. Histograms allow data platform 12 to model application behavior (e.g., using machine learning techniques), for establishing baselines, and for detecting deviations. As one example, suppose that a given HTTP server typically sends/receives 1,000 bytes (in each direction) whenever a connection is made with it. If a connection generates 500 bytes of traffic, or 2,000 bytes of traffic, such connections would be considered within the typical usage pattern of the server. Suppose, however, that a connection is made that results in 10G of traffic. Such a connection is anomalous and can be flagged accordingly.
Returning to FIG. 1D , as previously mentioned, data aggregator 114 may be configured to provide information (e.g., collected from nodes 108 by agents) to data platform 12. Data aggregator 128 may be similarly configured to provide information to data platform 12. As shown in FIG. 1D , both aggregator 114 and aggregator 128 may connect to a load balancer 130, which accepts connections from aggregators (and/or as applicable, agents), as well as other devices, such as computer 126 (e.g., when it communicates with web app 120), and supports fair balancing. In various embodiments, load balancer 130 is a reverse proxy that load balances accepted connections internally to various microservices (described in more detail below), allowing for services provided by data platform 12 to scale up as more agents are added to the environment and/or as more entities subscribe to services provided by data platform 12. Example ways to implement load balancer 130 include, but are not limited to, using HaProxy, using nginx, and using elastic load balancing (ELB) services made available by Amazon.
If the data is appropriately formatted, agent service 132 may facilitate copying the received data to a streaming data stable storage using a streaming service (e.g., Amazon Kinesis and/or any other suitable streaming service. Once the ingesting into the streaming service is complete, service 132 may send an acknowledgement to the data provider (e.g., data aggregator 114). If the agent does not receive such an acknowledgement, it is configured to retry sending the data to data platform 12. One way to implement agent service 132 is as a REST API server framework (e.g., Java DropWizard), configured to communicate with Kinesis (e.g., using a Kinesis library).
In various embodiments, data platform 12 uses one or more streams (e.g., Kinesis streams) for all incoming customer data (e.g., including data provided by data aggregator 114 and data aggregator 128), and the data is sharded based on the node (also referred to herein as a “machine”) that originated the data (e.g., node 116 vs. node 122), with each node having a globally unique identifier within data platform 12. Multiple instances of agent service 132 can write to multiple shards.
Kinesis is a streaming service with a limited period (e.g., 1-7 days). To persist data longer than a day, the data may be copied to long term storage 42 (e.g., S3). Data loader 136 is a microservice that is responsible for picking up data from a data stream (e.g., a Kinesis stream) and persisting it in long term storage 42. In one example embodiment, files collected by data loader 136 from the Kinesis stream are placed into one or more buckets, and segmented using a combination of a customer identifier and time slice. Given a particular time segment, and a given customer identifier, the corresponding file (stored in long term storage) contains five minutes (or another appropriate time slice) of data collected at that specific customer from all of the customer's nodes. Data loader 136 can be implemented in any appropriate programming language, such as Java or C, and can be configured to use a Kinesis library to interface with Kinesis. In various embodiments, data loader 136 uses the Amazon Simple Queue Service (SQS) (e.g., to alert DB loader 140 that there is work for it to do).
Customer data included in data store 30 can be augmented with data from additional data sources, such as AWS CloudTrail and/or other types of external tracking services. To this end, data platform may include a tracking service analyzer 144, which is another microservice. Tracking service analyzer 144 may pull data from an external tracking service (e.g., Amazon CloudTrail) for each applicable customer account, as soon as the data is available. Tracking service analyzer 144 may normalize the tracking data as applicable, so that it can be inserted into data store 30 for later querying/analysis. Tracking service analyzer 144 can be written in any appropriate programming language, such as Java or C. Tracking service analyzer 144 also makes use of SQL/JDBC libraries to interact with data store 30 to insert/query data.
As described herein, data platform 12 can model activities that occur within datacenters, such as datacenters 104 and 106. The model may be stable over time, and differences, even subtle ones (e.g., between a current state of the datacenter and the model) can be surfaced. The ability to surface such anomalies can be particularly beneficial in datacenter environments where rogue employees and/or external attackers may operate slowly (e.g., over a period of months), hoping that the elastic nature of typical resource use (e.g., virtualized servers) will help conceal their nefarious activities.
Using techniques described herein, data platform 12 can automatically discover entities (which may implement compute assets 16) deployed in a given datacenter. Examples of entities include workloads, applications, processes, machines, virtual machines, containers, files, IP addresses, domain names, and users. The entities may be grouped together logically (into analysis groups) based on behaviors, and temporal behavior baselines can be established. In particular, using techniques described herein, periodic graphs can be constructed (also referred to herein as polygraphs), in which the nodes are applicable logical entities, and the edges represent behavioral relationships between the logical entities in the graph. Baselines can be created for every node and edge.
Communication (e.g., between applications/nodes) is one example of a behavior. A model of communications between processes is an example of a behavioral model. As another example, the launching of applications is another example of a behavior that can be modeled. The baselines may be periodically updated (e.g., hourly) for every entity. Additionally or alternatively, the baselines may be continuously updated in substantially real-time as data is collected by agents. Deviations from the expected normal behavior can then be detected and automatically reported (e.g., as anomalies or threats detected). Such deviations may be due to a desired change, a misconfiguration, or malicious activity. As applicable, data platform 12 can score the detected deviations (e.g., based on severity and threat posed). Additional examples of analysis groups include models of machine communications, models of privilege changes, and models of insider behaviors (monitoring the interactive behavior of human users as they operate within the datacenter).
Two example types of information collected by agents are network level information and process level information. As previously mentioned, agents may collect information about every connection involving their respective nodes. And, for each connection, information about both the server and the client may be collected (e.g., using the connection-to-process identification techniques described above). DNS queries and responses may also be collected. The DNS query information can be used in logical entity graphing (e.g., collapsing many different IP addresses to a single service—e.g., s3.amazon.com). Examples of process level information collected by agents include attributes (user ID, effective user ID, and command line). Information such as what user/application is responsible for launching a given process and the binary being executed (and its SHA-256 values) may also provided by agents.
The dataset collected by agents across a datacenter can be very large, and many resources (e.g., virtual machines, IP addresses, etc.) are recycled very quickly. For example, an IP address and port number used at a first point in time by a first process on a first virtual machine may very rapidly be used (e.g., an hour later) by a different process/virtual machine.
A dataset (and elements within it) can be considered at both a physical level, and a logical level, as illustrated in FIG. 2B . In particular, FIG. 2B illustrates an example 5-tuple of data 210 collected by an agent, represented physically (216) and logically (217). The 5-tuple includes a source address 211, a source port 212, a destination address 213, a destination port 214, and a protocol 215. In some cases, port numbers (e.g., 212, 214) may be indicative of the nature of a connection (e.g., with certain port usage standardized). However, in many cases, and in particular in datacenters, port usage is ephemeral. For example, a Docker container can listen on an ephemeral port, which is unrelated to the service it will run. When another Docker container starts (for the same service), the port may well be different. Similarly, particularly in a virtualized environment, IP addresses may be recycled frequently (and are thus also potentially ephemeral) or could be NATed, which makes identification difficult.
A physical representation of the 5-tuple is depicted in region 216. A process 218 (executing on machine 219) has opened a connection to machine 220. In particular, process 218 is in communication with process 221. Information such as the number of packets exchanged between the two machines over the respective ports can be recorded.
As previously mentioned, in a datacenter environment, portions of the 5-tuple may change—potentially frequently—but still be associated with the same behavior. Namely, one application (e.g., Apache) may frequently be in communication with another application (e.g., Oracle), using ephemeral datacenter resources. Further, either/both of Apache and Oracle may be multi-homed. This can lead to potentially thousands of 5-tuples (or more) that all correspond to Apache communicating with Oracle within a datacenter. For example, Apache could be executed on a single machine, and could also be executed across fifty machines, which are variously spun up and down (with different IP addresses each time). An alternate representation of the 5-tuple of data 210 is depicted in region 217, and is logical. The logical representation of the 5-tuple aggregates the 5-tuple (along with other connections between Apache and Oracle having other 5-tuples) as logically representing the same connection. By aggregating data from raw physical connection information into logical connection information, using techniques described herein, a size reduction of six orders of magnitude in the data set can be achieved.
Behaviors of the seven processes are clustered together, into a single summary. As indicated in region 227, statistical information about the connections is also maintained (e.g., number of connections, histogram information, etc.). A polygraph such as is depicted in FIG. 2C can be used to establish a baseline of behavior (e.g., at the one-hour level), allowing for the future detection of deviations from that baseline. As one example, suppose that statistically an update_engine instance transmits data at 11 bytes per second. If an instance were instead to transmit data at 1000 bytes per second, such behavior would represent a deviation from the baseline and could be flagged accordingly. Similarly, changes that are within the baseline (e.g., an eighth instance of update_engine appears, but otherwise behaves as the other instances; or one of the seven instances disappears) are not flagged as anomalous. Further, datacenter events, such as failover, autobalancing, and A-B refresh are unlikely to trigger false alarms in a polygraph, as at the logical level, the behaviors remain the same.
In various embodiments, polygraph data is maintained for every application in a datacenter, and such polygraph data can be combined to make a single datacenter view across all such applications. FIG. 2D illustrates a portion of a polygraph for a service that evidences more complex behaviors than are depicted in FIG. 2C . In particular, FIG. 2D illustrates the behaviors of S3 as a service (as used by a particular customer datacenter). Clients within the datacenter variously connect to the S3 service using one of five fully qualified domains (listed in region 230). Contact with any of the domains is aggregated as contact with S3 (as indicated in region 231). Depicted in region 232 are various containers which (as clients) connect with S3. Other containers (which do not connect with S3) are not included. As with the polygraph portion depicted in FIG. 2C , statistical information about the connections is known and summarized, such as the number of bytes transferred, histogram information, etc.
In the particular polygraph shown in FIG. 2E , nodes generally correspond to workers, and edges correspond to communications the workers engage in (with connection activity being the behavior modeled in polygraph 235). Another example polygraph could model other behavior, such as application launching. The communications graphed in FIG. 2E include traffic entering the datacenter, traffic exiting the datacenter, and traffic that stays wholly within the datacenter (e.g., traffic between workers). One example of a node included in polygraph 235 is the sshd application, depicted as node 236. As indicated in FIG. 2E, 421 instances of sshd were executing during the one hour time period of data represented in polygraph 235. As indicated in region 237, nodes within the datacenter communicated with a total of 1349 IP addresses outside of the datacenter (and not otherwise accounted for, e.g., as belonging to a service such as Amazon AWS 238 or Slack 239).
In the following examples, suppose that user B, an administrator of datacenter 106, is interacting with data platform 12 to view visualizations of polygraphs in a web browser (e.g., as served to user B via web app 120). One type of polygraph user B can view is an application-communication polygraph, which indicates, for a given one hour window (or any other suitable time interval), which applications communicated with which other applications. Another type of polygraph user B can view is an application launch polygraph. User B can also view graphs related to user behavior, such as an insider behavior graph which tracks user connections (e.g., to internal and external applications, including chains of such behavior), a privilege change graph which tracks how privileges change between processes, and a user login graph, which tracks which (logical) machines a user logs into.
As shown in FIG. 2G , user B has elected to click on region 250, which depicts connections that are only present in the 9 am-10 am polygraph in a first color 251, and depicts connections that are only present in the 10 am-11 am polygraph in a second color 252. Connections present in both polygraphs are omitted from display. As one example, in the 9 am-10 am polygraph (corresponding to connections made during the 9 am-10 am time period at datacenter 106), a connection was made by a server to sshd (253) and also to systemd (254). Both of those connections ended prior to 10 am and are thus depicted in the first color. As another example, in the 10 am-11 am polygraph (corresponding to connections made during the 10 am-11 am time period at datacenter 106), a connection was made from a known bad external IP to nginx (255). The connection was not present during the 9 am-10 am time slice and thus is depicted in the second color. As yet another example, two different connections were made to a Slack service between 9 am and 11 am. However, the first was made by a first client during the 9 am-10 am time slice (256) and the second was made by a different client during the 10 am-11 am slice (257), and so the two connections are depicted respectively in the first and second colors and blue.
Returning to the polygraph depicted in FIG. 2F , suppose user B enters “etcd” into the search box located in region 244. User B will then be presented with the interface illustrated in FIG. 2H . As shown in FIG. 2H , three applications containing the term “etcd” were engaged in communications during the 9 am-10 am window. One application is etcdctl, a command line client for etcd. As shown in FIG. 2H , a total of three different etcdctl processes were executed during the 9 am-10 am window, and were clustered together (260). FIG. 2H also depicts two different clusters that are both named etcd2. The first cluster includes (for the 9 am-10 am window) five members (261) and the second cluster includes (for the same window) eight members (262). The reason for these two distinct clusters is that the two groups of applications behave differently (e.g., they exhibit two distinct sets of communication patterns). Specifically, the instances of etcd2 in cluster 261 only communicate with locksmithctl (263) and other etcd2 instances (in both clusters 261 and 262). The instances of etcd2 in cluster 262 communicate with additional entities, such as etcdctl and Docker containers. As desired, user B can click on one of the clusters (e.g., cluster 261) and be presented with summary information about the applications included in the cluster, as is shown in FIG. 2I (e.g., in region 265). User B can also double click on a given cluster (e.g., cluster 261) to see details on each of the individual members of the cluster broken out.
Suppose user B now clicks on region 245 of the interface shown in FIG. 2F . User B will then be shown an application launch polygraph. Launching an application is another example of a behavior. The launch polygraph models how applications are launched by other applications. FIG. 2J illustrates an example of a portion of a launch polygraph. In particular, user B has typed “find” into region 266, to see how the “find” application is being launched. As shown in FIG. 2J , in the launch polygraph for the 10 am-11 am time period, find applications (267) are always launched by bash (268), which is in turn always launched by systemd (269). If find is launched by a different application, this would be anomalous behavior.
Suppose user B now clicks on region 246 of the interface shown in FIG. 2F . User B will then be shown an insider behavior graph. The insider behavior graph tracks information about behaviors such as processes started by a user interactively using protocols such as ssh or telnet, and any processes started by those processes. As one example, suppose an administrator logs into a first virtual machine in datacenter 106 (e.g., using sshd via an external connection he makes from a hotel), using a first set of credentials (e.g., first.last@example.com and an appropriate password). From the first virtual machine, the administrator connects to a second virtual machine (e.g., using the same credentials), then uses the sudo command to change identities to those of another user, and then launches a program. graphs built by data platform 12 can be used to associate the administrator with each of his actions, including launching the program using the identity of another user.
As previously mentioned, the polygraph depicted in FIG. 2E corresponds to activities in a datacenter in which, in a given hour, approximately 500 virtual machines collectively run one million processes, and make 100 million connections in that hour. The polygraph represents a drastic reduction in size (e.g., from tracking information on 100 million connections in an hour, to a few hundred nodes and a few hundred edges). Using techniques described herein, such a polygraph can be constructed (e.g., using commercially available computing infrastructure) in less than an hour (e.g., within a few minutes). Thus, ongoing hourly snapshots of a datacenter can be created within a two hour moving window (i.e., collecting data for the time period 8 am-9 am, while also generating a snapshot for the time previous time period 7 am-8 am). The following describes various example infrastructure that can be used in polygraph construction, and also describes various techniques that can be used to construct polygraphs.
Returning to FIG. 1D , embodiments of data platform 12 may be built using any suitable infrastructure as a service (IaaS) (e.g., AWS). For example, data platform 12 can use Simple Storage Service (S3) for data storage, Key Management Service (KMS) for managing secrets, Simple Queue Service (SQS) for managing messaging between applications, Simple Email Service (SES) for sending emails, and Route 53 for managing DNS. Other infrastructure tools can also be used. Examples include: orchestration tools (e.g., Kubernetes or Mesos/Marathon), service discovery tools (e.g., Mesos-DNS), service load balancing tools (e.g., marathon-LB), container tools (e.g., Docker or rkt), log/metric tools (e.g., collectd, fluentd, kibana, etc.), big data processing systems (e.g., Spark, Hadoop, AWS Redshift, Snowflake etc.), and distributed key value stores (e.g., Apache Zookeeper or etcd2).
As previously mentioned, in various embodiments, data platform 12 may make use of a collection of microservices. Each microservice can have multiple instances, and may be configured to recover from failure, scale, and distribute work amongst various such instances, as applicable. For example, microservices are auto-balancing for new instances, and can distribute workload if new instances are started or existing instances are terminated. In various embodiments, microservices may be deployed as self-contained Docker containers. A Mesos-Marathon or Spark framework can be used to deploy the microservices (e.g., with Marathon monitoring and restarting failed instances of microservices as needed). The service etcd2 can be used by microservice instances to discover how many peer instances are running, and used for calculating a hash-based scheme for workload distribution. Microservices may be configured to publish various health/status metrics to either an SQS queue, or etcd2, as applicable. In some examples, Amazon DynamoDB can be used for state management.
Additional information on various microservices used in embodiments of data platform 12 is provided below.
In some cases, connections are process to process (e.g., from a process on one virtual machine within the cloud environment associated with entity A to another process on a virtual machine within the cloud environment associated with entity A). In other cases, a process may be in communication with a node (e.g., outside of entity A) which does not have an agent deployed upon it. As one example, a node within entity A might be in communication with node 172, outside of entity A. In such a scenario, communications with node 172 are modeled (e.g., by graph generator 146) using the IP address of node 172. Similarly, where a node within entity A does not have an agent deployed upon it, the IP address of the node can be used by graph generator in modeling.
Graphs created by graph generator 146 may be written to data store 30 and cached for further processing. A graph may be a summary of all activity that happened in a particular time interval. As each graph corresponds to a distinct period of time, different rows can be aggregated to find summary information over a larger timestamp. In some examples, picking two different graphs from two different timestamps can be used to compare different periods. If necessary, graph generator can parallelize its workload (e.g., where its backlog cannot otherwise be handled within a particular time period, such as an hour, or if is required to process a graph spanning a long time period).
SSH tracker 148 is a microservice that may be responsible for following ssh connections and process parent hierarchies to determine trails of user ssh activity. Identified ssh trails are placed by the SSH tracker 148 into data store 30 and cached for further processing.
SSH tracker 148 can be implemented in any appropriate programming language, such as Java or C, and machine libraries, such as Spark's MLLib. Example ways that SSH tracker computations can be implemented include using SQL or Map-R, using Spark or Hadoop.
Graph Behavior Modeler (GBM) 154 is a microservice that may compute polygraphs. In particular, GBM 154 can be used to find clusters of nodes in a graph that should be considered similar based on some set of their properties and relationships to other nodes. As described herein, the clusters and their relationships can be used to provide visibility into a datacenter environment without requiring user specified labels. GBM 154 may track such clusters over time persistently, allowing for changes to be detected and alerts to be generated.
new user: This event may be created the first time a user (e.g., of node 116) is first observed by an agent within a datacenter.
user launched new binary: This event may be generated when an interactive user launches an application for the first time.
new privilege escalation: This event may be generated when user privileges are escalated and a new application is run.
new application or container: This event may be generated when an application or container is seen for the first time.
new external connection: This event may be generated when a connection to an external IP/domain is made from a new application.
new external host or IP: This event may be generated when a new external host or IP is involved in a connection with a datacenter.
new internal connection: This event may be generated when a connection between internal-only applications is seen for the first time.
new external client: This event may be generated when a new external connection is seen for an application which typically does not have external connections.
new parent: This event may be generated when an application is launched by a different parent.
connection to known bad IP/domain: Data platform 12 maintains (or can otherwise access) one or more reputation feeds. If an environment makes a connection to a known bad IP or domain, an event will be generated.
login from a known bad IP/domain: An event may be generated when a successful connection to a datacenter from a known bad IP is observed by data platform 12.
At 302, a logical graph model is generated, using at least a portion of the monitored activities. A variety of approaches can be used to generate such logical graph models, and a variety of logical graphs can be generated (whether using the same, or different approaches). The following is one example of how data received at 301 can be used to generate and maintain a model.
During bootstrap, data platform 12 creates an aggregate graph of physical connections (also referred to herein as an aggregated physical graph) by matching connections that occurred in the first hour into communication pairs. Clustering is then performed on the communication pairs. Examples of such clustering, described in more detail below, include performing Matching Neighbor clustering and similarity (e.g., SimRank) clustering. Additional processing can also be performed (and is described in more detail below), such as by splitting clusters based on application type, and annotating nodes with DNS query information. The resulting graph (also referred to herein as a base graph or common graph) can be used to generate a variety of models, where a subset of node and edge types (described in more detail below) and their properties are considered in a given model. One example of a model is a UID to UID model (also referred to herein as a Uid2Uid model) which clusters together processes that share a username and show similar privilege change behavior. Another example of a model is a CType model, which clusters together processes that share command line similarity. Yet another example of a model is a PType model, which clusters together processes that share behaviors over time.
Each hour (or any other predetermined time interval) after bootstrap, a new snapshot is taken (i.e., data collected about a datacenter in the last hour is processed) and information from the new snapshot is merged with existing data to create and (as additional data is collected/processed) maintain a cumulative graph. The cumulative graph (also referred to herein as a cumulative PType graph and a polygraph) is a running model of how processes behave over time. Nodes in the cumulative graph are PType nodes, and provide information such as a list of all active processes and PIDs in the last hour, the number of historic total processes, the average number of active processes per hour, the application type of the process (e.g., the CType of the PType), and historic CType information/frequency. Edges in the cumulative graph can represent connectivity and provide information such as connectivity frequency. The edges can be weighted (e.g., based on number of connections, number of bytes exchanged, etc.). Edges in the cumulative graph (and snapshots) can also represent transitions.
One approach to merging a snapshot of the activity of the last hour into a cumulative graph is as follows. An aggregate graph of physical connections is made for the connections included in the snapshot (as was previously done for the original snapshot used during bootstrap). And, clustering/splitting is similarly performed on the snapshot's aggregate graph. Next, PType clusters in the snapshot's graph are compared against PType clusters in the cumulative graph to identify commonality.
One approach to determining commonality is, for any two nodes that are members of a given CmdType (described in more detail below), comparing internal neighbors and calculating a set membership Jaccard distance. The pairs of nodes are then ordered by decreasing similarity (i.e., with the most similar sets first). For nodes with a threshold amount of commonality (e.g., at least 66% members in common), any new nodes (i.e., appearing in the snapshot's graph but not the cumulative graph) are assigned the same PType identifier as is assigned to the corresponding node in the cumulative graph. For each node that is not classified (i.e., has not been assigned a PType identifier), a network signature is generated (i.e., indicative of the kinds of network connections the node makes, who the node communicates with, etc.). The following processing is then performed until convergence. If a match of the network signature is found in the cumulative graph, the unclassified node is assigned the PType identifier of the corresponding node in the cumulative graph. Any nodes which remain unclassified after convergence are new PTypes and are assigned new identifiers and added to the cumulative graph as new. As applicable, the detection of a new PType can be used to generate an alert. If the new PType has a new CmdType, a severity of the alert can be increased. If any surviving nodes (i.e., present in both the cumulative graph and the snapshot graph) change PTypes, such change is noted as a transition, and an alert can be generated. Further, if a surviving node changes PType and also changes CmdType, a severity of the alert can be increased.
Changes to the cumulative graph (e.g., a new PType or a new edge between two PTypes) can be used (e.g., at 303) to detect anomalies (described in more detail below). Two example kinds of anomalies that can be detected by data platform 12 include security anomalies (e.g., a user or process behaving in an unexpected manner) and devops/root cause anomalies (e.g., network congestion, application failure, etc.). Detected anomalies can be recorded and surfaced (e.g., to administrators, auditors, etc.), such as through alerts which are generated at 304 based on anomaly detection.
Additional detail regarding processing performed, by various components depicted in FIG. 1D (whether performed individually or in combination), in conjunction with model/polygraph construction (e.g., as performed at 302) are provided below.
As explained above, an aggregated physical graph can be generated on a per customer basis periodically (e.g., once an hour) from raw physical graph information, by matching connections (e.g., between two processes on two virtual machines). In various embodiments, a deterministic fixed approach is used to cluster nodes in the aggregated physical graph (e.g., representing processes and their communications). As one example, Matching Neighbors Clustering (MNC) can be performed on the aggregated physical graph to determine which entities exhibit identical behavior and cluster such entities together.
In MNC, only those processes exhibiting identical (communication) behavior will be clustered. In various embodiments, an alternate clustering approach can also/instead be used, which uses a similarity measure (e.g., constrained by a threshold value, such as a 60% similarity) to cluster items. In some embodiments, the output of MNC is used as input to SimRank, in other embodiments, MNC is omitted.
One approach to similarity clustering is to use SimRank. In an embodiment of the SimRank approach, for a given node v in a directed graph, I(v) and O(v) denote the respective set of in-neighbors and out-neighbors of v. Individual in-neighbors are denoted as Ii(v), for 1≤i≤|(v)|, and individual out-neighbors are denoted as Oi(v), for 1≤i≤|O(v)|. The similarity between two objects a and b can be denoted by s(a,b)∈[1,0]. A recursive equation (hereinafter “the SimRank equation”) can be written for s(a,b), where, if a=b, then s(a,b) is defined as 1, otherwise,
where C is a constant between 0 and 1. One example value for the decay factor C is 0.8 (and a fixed number of iterations such as five). Another example value for the decay factor C is 0.6 (and/or a different number of iterations). In the event that a or b has no in-neighbors, similarity is set to s(a,b)=0, so the summation is defined to be 0 when I(a)=Ø or I(b)=Ø.
The SimRank equations for a graph G can be solved by iteration to a fixed point. Suppose n is the number of nodes in G. For each iteration k, n2 entries sk(*,*) are kept, where sk(a,b) gives the score between a and b on iteration k. Successive computations of sk+1(*,*) are made based on sk(*,*). Starting with so(*,*), where each so(a,b) is a lower bound on the actual SimRank score
The SimRank equation can be used to compute sk+1(a, b) from sk(*,*) with sk+1(a, b)=
and sk+1(a, b)=1 for a=b. On each iteration k+1, the similarity of (a,b) is updated using the similarity scores of the neighbors of (a,b) from the previous iteration k according to the SimRank equation. The values sk(*,*) are nondecreasing as k increases.
Returning to FIG. 3C , while MNC would cluster nodes p4 and p5 together (and not include node p6 in their cluster), application of SimRank would cluster nodes p4-p6 into one cluster (314) and also cluster nodes p7-p9 into another cluster (315).
In various embodiments, SimRank is modified (from what is described above) to accommodate differences between the asymmetry of client and server connections. As one example, SimRank can be modified to use different thresholds for client communications (e.g., an 80% match among nodes c1-c6) and for server communications (e.g., a 60% match among nodes s1 and s2). Such modification can also help achieve convergence in situations such as where a server process dies on one node and restarts on another node.
The application of MNC/SimRank to an aggregated physical graph results in a smaller graph, in which processes which are determined to be sufficiently similar are clustered together. Typically, clusters generated as output of MNC will be underinclusive. For example, for the nodes depicted in FIG. 3C , process p6 will not be included in a cluster with processes p4 and p5, despite substantial similarity in their communication behaviors. The application of SimRank (e.g., to the output of MNC) helps mitigate the underinclusiveness of MNC, but can result in overly inclusive clusters. As one example, suppose (returning to the nodes depicted in FIG. 3B ) that as a result of applying SimRank to the depicted nodes, nodes p1-p4 are all included in a single cluster. Both MNC and SimRank operate agnostically of which application a given process belongs to. Suppose processes p1-p3 each correspond to a first application (e.g., an update engine), and process p4 corresponds to a second application (e.g., sshd). Further suppose process p10 corresponds to contact with AWS. Clustering all four of the processes together (e.g., as a result of SimRank) could be problematic, particularly in a security context (e.g., where granular information useful in detecting threats would be lost).
As previously mentioned, data platform 12 may maintain a mapping between processes and the applications to which they belong. In various embodiments, the output of SimRank (e.g., SimRank clusters) is split based on the applications to which cluster members belong (such a split is also referred to herein as a “CmdType split”). If all cluster members share a common application, the cluster remains. If different cluster members originate from different applications, the cluster members are split along application-type (CmdType) lines. Using the nodes depicted in FIG. 3D as an example, suppose that nodes c1, c2, c3, and c5 all share “update engine” as the type of application to which they belong (sharing a CmdType). Suppose that node c4 belongs to “ssh,” and suppose that node c6 belongs to “bash.” As a result of SimRank, all six nodes (c1-c6) might be clustered into a single cluster. After a CmdType split is performed on the cluster, however, the single cluster will be broken into three clusters (c1, c2, c3, c5; c4; and c6). Specifically, the resulting clusters comprise processes associated with the same type of application, which exhibit similar behaviors (e.g., communication behaviors). Each of the three clusters resulting from the CmdType split represents, respectively, a node (also referred to herein as a PType) of a particular CmdType. Each PType is given a persistent identifier and stored persistently as a cumulative graph.
A variety of approaches can be used to determine a CmdType for a given process. As one example, for some applications (e.g., sshd), a one-to-one mapping exists between the CmdType and the application/binary name. Thus, processes corresponding to the execution of sshd will be classified using a CmdType of sshd. In various embodiments, a list of common application/binary names (e.g., sshd, apache, etc.) is maintained by data platform 12 and manually curated as applicable. Other types of applications (e.g., Java, Python, and Ruby) are multi-homed, meaning that several very different applications may all execute using the binary name, “java.” For these types of applications, information such as command line/execution path information can be used in determining a CmdType. In particular, the subapplication can be used as the CmdType of the application, and/or term frequency analysis (e.g., TF/IDF) can be used on command line information to group, for example, any marathon related applications together (e.g., as a python.marathon CmdType) and separately from other Python applications (e.g., as a python.airflow CmdType).
In various embodiments, machine learning techniques are used to determine a CmdType. The CmdType model is constrained such that the execution path for each CmdType is unique. One example approach to making a CmdType model is a random forest based approach. An initial CmdType model is bootstrapped using process parameters (e.g., available within one minute of process startup) obtained using one hour of information for a given customer (e.g., entity A). Examples of such parameters include the command line of the process, the command line of the process's parent(s) (if applicable), the uptime of the process, UID/EUID and any change information, TTY and any change information, listening ports, and children (if any). Another approach is to perform term frequency clustering over command line information to convert command lines into cluster identifiers.
The random forest model can be used (e.g., in subsequent hours) to predict a CmdType for a process (e.g., based on features of the process). If a match is found, the process can be assigned the matching CmdType. If a match is not found, a comparison between features of the process and its nearest CmdType (e.g., as determined using a Levenstein distance) can be performed. The existing CmdType can be expanded to include the process, or, as applicable, a new CmdType can be created (and other actions taken, such as generating an alert). Another approach to handling processes which do not match an existing CmdType is to designate such processes as unclassified, and once an hour, create a new random forest seeded with process information from a sampling of classified processes (e.g., 10 or 100 processes per CmdType) and the new processes. If a given new process winds up in an existing set, the process is given the corresponding CmdType. If a new cluster is created, a new CmdType can be created.
Conceptually, a polygraph represents the smallest possible graph of clusters that preserve a set of rules (e.g., in which nodes included in the cluster must share a CmdType and behavior). As a result of performing MNC, SimRank, and cluster splitting (e.g., CmdType splitting) many processes are clustered together based on commonality of behavior (e.g., communication behavior) and commonality of application type. Such clustering represents a significant reduction in graph size (e.g., compared to the original raw physical graph). Nonetheless, further clustering can be performed (e.g., by iterating on the graph data using the GBM to achieve such a polygraph). As more information within the graph is correlated, more nodes can be clustered together, reducing the size of the graph, until convergence is reached and no further clustering is possible.
Communications between a cluster of nodes (e.g., nodes of cluster 320) and the first IP address can be considered different behavior from communications between the same set of nodes and the second IP address, and thus communications 324 and 325 will not be combined by MNC/SimRank in various embodiments. Nonetheless, it could be desirable for nodes of clusters 320/322 to be combined (into cluster 326), and for nodes of clusters 321/323 to be combined (into cluster 327), as representing (collectively) communications between a1 and a2. One task that can be performed by data platform 12 is to use DNS query information to map IP addresses to logical entities. As will be described in more detail below, GBM 154 can make use of the DNS query information to determine that graph nodes of cluster 320 and graph nodes of cluster 322 both made DNS queries for “appserverabc.example.com,” which first resolved to 1.1.1.1 and then to 2.2.2.2, and to combine nodes 320/322 and 321/323 together into a single pair of nodes (326 communicating with 327).
In various embodiments, GBM 154 operates in a batch manner in which it receives as input the nodes and edges of a graph for a particular time period along with its previous state, and generates as output clustered nodes, cluster membership edges, cluster-to-cluster edges, events, and its next state.
While GBM 154 can be used with different models corresponding to different subgraphs, core abstractions remain the same across types of models.
For example, each node type in a GBM model is considered to belong to a class. The class can be thought of as a way for the GBM to split nodes based on the criteria it uses for the model. The class for a node is represented as a string whose value is derived from the node's key and properties depending on the GBM Model. Note that different GBM models may create different class values for the same node. For each node type in a given GBM model, GBM 154 can generate clusters of nodes for that type. A GBM generated cluster for a given member node type cannot span more than one class for that node type. GBM 154 generates edges between clusters that have the same types as the edges between source and destination cluster node types.
Additionally or alternatively, the processes described herein as being used for a particular model can be used (can be the same) across models, and different models can also be configured with different settings.
Additionally or alternatively, the node types and the edge types may correspond to existing types in the common graph node and edge tables but this is not necessary. Even when there is a correspondence, the properties provided to GBM 154 are not limited to the properties that are stored in the corresponding graph table entries. They can be enriched with additional information before being passed to GBM 154.
Logically, the input for a GBM model can be characterized in a manner that is similar to other graphs. Edge triplets can be expressed, for example, as an array of source node type, edge type, and destination node type. And, each node type is associated with node properties, and each edge type is associated with edge properties. Other edge triplets can also be used (and/or edge triplets can be extended) in accordance with various embodiments.
Note that the physical input to the GBM model need not (and does not, in various embodiments) conform to the logical input. For example, the edges in the PtypeConn model correspond to edges between Matching Neighbors (MN) clusters, where each process node has an MN cluster identifier property. In the User ID to User ID model (also referred to herein as the Uid2Uid model), edges are not explicitly provided separately from nodes (as the euid array in the node properties serves the same purpose). In both cases, however, the physical information provides the applicable information necessary for the logical input.
The state input for a particular GBM model can be stored in a file, a database, or other appropriate storage. The state file (from a previous run) is provided, along with graph data, except for when the first run for a given model is performed, or the model is reset. In some cases, no data may be available for a particular model in a given time period, and GBM may not be run for that time period. As data becomes available at a future time, GBM can run using the latest state file as input.
-
- A given node type can be used in multiple different GBM models. The type names of the cluster nodes generated by two such models for that node type will be different. For instance, process type nodes will appear in both PtypeConn and Uid2Uid models, but their cluster nodes will have different type names.
- The membership edge type name is “MemberOf.”
- The edge type names for cluster-to-cluster edges will be the same as the edge type names in the underlying node-to-node edges in the input.
The following are example events GBM 154 can generate: new class, new cluster, new edge from class to class, split class (the notion that GBM 154 considers all nodes of a given type and class to be in the same cluster initially and if GBM 154 splits them into multiple clusters, it is splitting a class), new edge from cluster and class, new edge between cluster and cluster, and/or new edge from class to cluster.
One underlying node or edge in the logical input can cause multiple types of events to be generated. Conversely, one event can correspond to multiple nodes or edges in the input. Not every model generates every event type.
Additional information regarding examples of data structures/models that can be used in conjunction with models used by data platform 12 is now provided.
In some examples, a PTypeConn Model clusters nodes of the same class that have similar connectivity relationships. For example, if two processes had similar incoming neighbors of the same class and outgoing neighbors of the same class, they could be clustered.
The node input to the PTypeConn model for a given time period includes non-interactive (i.e., not associated with tty) process nodes that had connections in the time period and the base graph nodes of other types (IP Service Endpoint (IPSep) comprising an IP address and a port), DNS Service Endpoint (DNSSep) and IPAddress) that have been involved in those connections. The base relationship is the connectivity relationship for the following type triplets:
-
- Process, ConnectedTo, Process
- Process, ConnectedTo, IP Service Endpoint (IPSep)
- Process, ConnectedTo, DNS Service Endpoint (DNSSep)
- IPAddress, ConnectedTo, ProcessProcess, DNS, ConnectedTo, Process
The edge inputs to this model are the ConnectedTo edges from the MN cluster, instead of individual node-to-node ConnectedTo edges from the base graph. The membership edges created by this model refer to the base graph node type provided in the input.
Class Values:
The class values of nodes are determined as follows depending on the node type (e.g., Process nodes, IPSep nodes, DNSSep nodes, and IP Address nodes).
Process Nodes:
if exe_path contains java then “java <cmdline_term_1> . . . ”
else if exe_path contains python then “python <cmdline_term_1> . . . ”
else “last_part_of_exe_path”
IPSep nodes:
if IP_internal then “IntIPS”
else if severity=0 then “<IP_addr>:<protocol>:<port>”
else “<IP_addr>:<port>_BadIP”
DNSSep nodes:
if IP_internal=1 then “<hostname>”
else if severity=0 then “<hostname>:<protocol>:port”
else “<hostname>:<port>_BadIP”
IPAddress nodes (will appear only on client side):
if IP_internal=1 then “IPIntC”
else if severity=0 then “ExtIPC”
else “ExtBadIPC”
Events:
A new class event in this model for a process node is equivalent to seeing a new CType being involved in a connection for the first time. Note that this does not mean the CType was not seen before. It is possible that it was previously seen but did not make a connection at that time.
A new class event in this model for an IPSep node with IP_internal=0 is equivalent to seeing a connection to a new external IP address for the first time.
A new class event in this model for a DNSSep node is equivalent to seeing a connection to a new domain for the first time.
A new class event in this model for an IPAddress node with IP_internal=0 and severity=0 is equivalent to seeing a connection from any external IP address for the first time.
A new class event in this model for an IPAddress node with IP_internal=0 and severity>0 is equivalent to seeing a connection from any bad external IP address for the first time.
A new class to class to edge from a class for a process node to a class for a process node is equivalent to seeing a communication from the source CType making a connection to the destination CType for the first time.
A new class to class to edge from a class for a process node to a class for a DNSSep node is equivalent to seeing a communication from the source CType making a connection to the destination domain name for the first time.
An IntPConn Model may be similar to the PtypeConn Model, except that connection edges between parent/child processes and connections between processes where both sides are not interactive are filtered out.
A Uid2Uid Model may cluster processes with the same username that show similar privilege change behavior. For instance, if two processes with the same username had similar effective user values, launched processes with similar usernames, and were launched by processes with similar usernames, then they could be clustered.
An edge between a source cluster and destination cluster generated by this model means that all of the processes in the source cluster had a privilege change relationship to at least one process in the destination cluster.
The node input to this model for a given time period includes process nodes that are running in that period. The value of a class of process nodes is “<username>”.
The base relationship that is used for clustering is privilege change, either by the process changing its effective user ID, or by launching a child process which runs with a different user.
The physical input for this model includes process nodes (only), with the caveat that the complete ancestor hierarchy of process nodes active (i.e., running) for a given time period is provided as input even if an ancestor is not active in that time period. Note that effective user IDs of a process are represented as an array in the process node properties, and launch relationships are available from ppid_hash fields in the properties as well.
A new class event in this model is equivalent to seeing a user for the first time.
A new class to class edge event is equivalent to seeing the source user making a privilege change to the destination user for the first time.
A Ct2Ct Model may cluster processes with the same CType that show similar launch behavior. For instance, if two processes with the same CType have launched processes with similar CTypes, then they could be clustered.
The node input to this model for a given time period includes process nodes that are running in that period. The value class of process nodes is CType (similar to how it is created for the PtypeConn Model).
The base relationship that is used for clustering is a parent process with a given CType launching a child process with another given destination CType.
The physical input for this model includes process nodes (only) with the caveat that the complete ancestor hierarchy active process nodes (i.e., that are running) for a given time period is provided as input even if an ancestor is not active in that time period. Note that launch relationships are available from ppid_hash fields in the process node properties.
An edge between a source cluster and destination cluster generated by this model means that all of the processes in the source cluster launched at least one process in the destination cluster.
A new class event in this model is equivalent to seeing a CType for the first time. Note that the same type of event will be generated by the PtypeConn Model as well.
A new class to class edge event is equivalent to seeing the source CType launching the destination CType for the first time.
An MTypeConn Model may cluster nodes of the same class that have similar connectivity relationships. For example, if two machines had similar incoming neighbors of the same class and outgoing neighbors of the same class, they could be clustered.
A new class event in this model will be generated for external IP addresses or (as applicable) domain names seen for the first time. Note that a new class to class to edge Machine, class to class for an IPSep or DNSName node will also be generated at the same time.
The membership edges generated by this model will refer to Machine, IPAddress, DNSName, and IPSep nodes in the base graph. Though the nodes provided to this model are IPAddress nodes instead of IPSep nodes, the membership edges it generates will refer to IPSep type nodes. Alternatively, the base graph can generate edges between Machine and IPSep node types. Note that the Machine to IPAddress edges have tcp_dst_ports/udp_dst_ports properties that can be used for this purpose.
The node input to this model for a given time period includes machine nodes that had connections in the time period and the base graph nodes of other types (IPAddress and DNSName) that were involved in those connections.
The base relationship is the connectivity relationship for the following type triplets:
-
- Machine, ConnectedTo, Machine
- Machine, ConnectedTo, IPAddress
- Machine, ConnectedTo, DNSName
- IPAddress, ConnectedTo, Machine, DNS, ConnectedTo, Machine
The edge inputs to this model are the corresponding ConnectedTo edges in the base graph.
Class Values:
Machine:
The class value for all Machine nodes is “Machine.”
The machine_terms property in the Machine nodes is used, in various embodiments, for labeling machines that are clustered together. If a majority of the machines clustered together share a term in the machine_terms, that term can be used for labeling the cluster.
IPSep:
The class value for IPSep nodes is determined as follows:
if IP_internal then “IntIPS”
else
if severity=0 then “<ip_addr>:<protocol>:<port>”
else “<IP_addr_BadIP>”
IPAddress:
The class value for IpAddress nodes is determined as follows:
if IP_internal then “IntIPC”
else
if severity=0 then “ExtIPC”
else “ExtBadIPC”
DNSName:
The class value for DNSName nodes is determined as follows:
if severity=0 then “<hostname>”
else then “<hostname>_BadIP”
An example structure for a New Class Event is now described.
The key field for this event type looks as follows (using the PtypeConn model as an example):
{
“node”: {
“class”: {
“cid”: “httpd”
},
“key”: {
“cid”: “29654”
},
“type”: “PtypeConn”
}
}
It contains the class value and also the ID of the cluster where that class value is observed. Multiple clusters can be observed with the same value in a given time period. It contains the class value and also the ID of the cluster where that class value is observed. Multiple clusters can be observed with the same value in a given time period. Accordingly, in some embodiments, GBM 154 generates multiple events of this type for the same class value.
The properties field looks as follows:
{
“set_size”: 5
}
The set_size indicates the size of the cluster referenced in the keys field.
Conditions:
For a given model and time period, multiple NewClass events can be generated if there is more than one cluster in that class. NewNode events will not be generated separately in this case.
Example New Class to Class Edge Event structure:
The key field for this event type looks as follows (using the PtypeConn model as an example):
“edge”: {
“dst_node”: {
“class”: {
“cid”: “java war”
},
“key”: {
“cid”: “27635”
},
“type”: “PtypeConn”
},
“src_node”: {
“class”: {
“cid”: “IntIPC”
},
“key”: {
“cid”: “20881”
},
“type”: “PtypeConn”
},
“type”: “ConnectedTo”
}
}
The key field contains source and destination class values and also source and destination cluster identifiers (i.e., the src/dst_node:key.cid represents the src/dst cluster identifier).
In a given time period for a given model, an event of this type could involve multiple edges between different cluster pairs that have the same source and destination class values. GBM 154 can generate multiple events in this case with different source and destination cluster identifiers.
The props fields look as follows for this event type:
{
“dst_set_size”: 2,
“src_set_size”: 1
}
The source and destination sizes represent the sizes of the clusters given in the keys field.
Conditions:
For a given model and time period, multiple NewClassToClass events can be generated if there are more than one pair of clusters in that class pair. NewNodeToNode events are not generated separately in this case.
Combining Events at the Class Level: for a given model and time period, the following example types of events can represent multiple changes in the underlying GBM cluster level graph in terms of multiple new clusters or multiple new edges between clusters:
-
- NewClass
- NewEdgeClassToClass
- NewEdgeNodeToClass
- NewEdgeClassToNode
Multiple NewClass events with the same model and class can be output if there are multiple clusters in that new class.
Multiple NewEdgeClassToClass events with the same model and class pair can be output if there are multiple new cluster edges within that class pair.
Multiple NewEdgeNodeToClass events with the same model and destination class can be output if there are multiple new edges from the source cluster to the destination clusters in that destination class (the first time seeing this class as a destination cluster class for the source cluster).
Multiple NewEdgeClassToNode events with the same model and source class can be output if there are multiple new edges from source clusters to the destination clusters in that source class (the first time seeing this class as a source cluster class for the destination cluster).
These events may be combined at the class level and treated as a single event when it is desirable to view changes at the class level, e.g., when one wants to know when there is a new CType.
In some examples, different models may have partial overlap in the types of nodes they use from the base graph. Therefore, they can generate NewClass type events for the same class. NewClass events can also be combined across models when it is desirable to view changes at the class level.
Using techniques herein, actions can be associated with processes and (e.g., by associating processes with users) actions can thus also be associated with extended user sessions. Such information can be used to track user behavior correctly, even where a malicious user attempts to hide his trail by changing user identities (e.g., through lateral movement). Extended user session tracking can also be useful in operational use cases without malicious intent, e.g., where users make original logins with distinct usernames (e.g., “charlie” or “dave”) but then perform actions under a common username (e.g., “admin” or “support”). One such example is where multiple users with administrator privileges exist, and they need to gain superuser privilege to perform a particular type of maintenance. It may be desirable to know which operations are performed (as the superuser) by which original user when debugging issues. In the following examples describing extended user session tracking, reference is generally made to using the secure shell (ssh) protocol as implemented by openssh (on the server side) as the mechanism for logins. However, extended user session tracking is not limited to the ssh protocol or a particular limitation and the techniques described herein can be extended to other login mechanisms.
On any given machine, there will be a process that listens for and accepts ssh connections on a given port. This process can run the openssh server program running in daemon mode or it could be running another program (e.g., initd on a Linux system). In either case, a new process running openssh will be created for every new ssh login session and this process can be used to identify an ssh session on that machine. This process is called the “privileged” process in openssh.
After authentication of the ssh session, when an ssh client requests a shell or any other program to be run under that ssh session, a new process that runs that program will be created under (i.e., as a child of) the associated privileged process. If an ssh client requests port forwarding to be performed, the connections will be associated with the privileged process.
In modern operating systems such as Linux and Windows, each process has a parent process (except for the very first process) and when a new process is created the parent process is known. By tracking the parent-child hierarchy of processes, one can determine if a particular process is a descendant of a privileged openssh process and thus if it is associated with an ssh login session.
For user session tracking across machines (or on a single machine with multiple logins) in a distributed environment, it is established when two login sessions have a parent-child relationship. After that, the “original” login session, if any, for any given login session can be determined by following the parent relationship recursively.
The external domain could be a malicious domain, or it could be benign. Suppose the external domain is malicious (and, e.g., Charlie has malicious intent). It would be advantageous (e.g., for security reasons) to be able to trace the contact with the external domain back to Machine A, and then back to Charlie's IP address. Using techniques described herein (e.g., by correlating process information collected by various agents), such tracking of Charlie's activities back to his original login (330) can be accomplished. In particular, an extended user session can be tracked that associates Charlie's ssh processes together with a single original login and thus original user.
As described herein, software agents (such as agent 112) may run on machines (such as a machine that implements one of nodes 116) and detect new connections, processes, and/or logins. As also previously explained, such agents send associated records to data platform 12 which includes one or more datastores (e.g., data store 30) for persistently storing such data. Such data can be modeled using logical tables, also persisted in datastores (e.g., in a relational database that provides an SQL interface), allowing for querying of the data. Other datastores such as graph oriented databases and/or hybrid schemes can also be used.
The following identifiers are commonly used in the tables:
-
- MID
- PID_hash
An ssh login session can be identified uniquely by an (MID, PID_hash) tuple. The MID is a machine identifier that is unique to each machine, whether physical or virtual, across time and space. Operating systems use numbers called process identifiers (PIDs) to identify processes running at a given time. Over time processes may die and new processes may be started on a machine or the machine itself may restart. The PID is not necessarily unique across time in that the same PID value can be reused for different processes at different times. In order to track process descendants across time, one should therefore account for time as well. In order to be able to identify a process on a machine uniquely across time, another number called a PID_hash is generated for the process. In various embodiments, the PID_hash is generated using a collision-resistant hash function that takes the PID, start time, and (in various embodiments, as applicable) other properties of a process.
Input data collected by agents comprises the input data model and is represented by the following logical tables:
-
- connections
- processes
- logins
A connections table may maintain records of TCP/IP connections observed on each machine. Example columns included in a connections table are as follows:
| Column | |
| Name | Description |
| MID | Identifier of the machine that the connection was observed |
| on. | |
| start_time | Connection start time. |
| PID_hash | Identifier of the process that was associated with the |
| connection. | |
| src_IP_addr | Source IP address (the connection was initiated from this IP |
| address). | |
| src_port | Source port. |
| dst_IP_addr | Destination IP address (the connection was made to this IP |
| address). | |
| dst_port | Destination port. |
| Prot | Protocol (TCP or UDP). |
| Dir | Direction of the connection (incoming or outgoing) with |
| respect to this machine. | |
The source fields (IP address and port) correspond to the side from which the connection was initiated. On the destination side, the agent associates an ssh connection with the privileged ssh process that is created for that connection.
For each connection in the system, there will be two records in the table, assuming that the machines on both sides of the connection capture the connection. These records can be matched based on equality of the tuple (src_IP_addr, src_port, dst_IP_addr, dst_port, Prot) and proximity of the start_time fields (e.g., with a one minute upper threshold between the start_time fields).
A processes table maintains records of processes observed on each machine. It may have the following columns:
| Column | |
| Name | Description |
| MID | Identifier of the machine that the process was observed on. |
| PID_hash | Identifier of the process. |
| start_time | Start time of the process. |
| exe_path | The executable path of the process. |
| PPID_hash | Identifier of the parent process. |
A logins table may maintain records of logins to machines. It may have the following columns:
| Column Name | Description |
| MID | Identifier of the machine that the login was |
| observed on. | |
| sshd_PID_hash | Identifier of the sshd privileged process associated |
| with login. | |
| login_time | Time of login. |
| login_username | Username used in login. |
Output data generated by session tracking is represented with the following logical tables:
-
- login-local-descendant
- login-connection
- login-lineage
Using data in these tables, it is possible to determine descendant processes of a given ssh login session across the environment (i.e., spanning machines). Conversely, given a process, it is possible to determine if it is an ssh login descendant as well as the original ssh login session for it if so.
A login-local-descendant table maintains the local (i.e., on the same machine) descendant processes of each ssh login session. It may have the following columns:
| Column Name | Description |
| MID | Identifier of the machine that the login was |
| observed on. | |
| sshd_PID_hash | Identifier of the sshd privileged process associated |
| with login. | |
| login_time | Time of login. |
| login_username | Username used in login. |
A login-connections table may maintain the connections associated with ssh logins. It may have the following columns:
| Column Name | Description |
| MID | Identifier of the machine that the process was |
| observed on. | |
| sshd_PID_hash | Identifier of the sshd privileged process associated |
| with the login. | |
| login_time | Time of login. |
| login_username | The username used in the login. |
| src_IP_addr | Source IP address (connection was initiated from this |
| IP address). | |
| src_port | Source port. |
| dst_IP_addr | Destination IP address (connection was made to this |
| IP address). | |
| dst_port | Destination port. |
A login-lineage table may maintain the lineage of ssh login sessions. It may have the following columns:
| Column Name | Description |
| MID | Identifier of the machine that the ssh login was |
| observed on. | |
| sshd_PID_hash | Identifier of the sshd privileged process |
| associated with the login. | |
| parent_MID | Identifier of the machine that the parent ssh |
| login was observed on. | |
| parent_sshd_PID_hash | Identifier of the sshd privileged process |
| associated with the parent login. | |
| origin_MID | Identifier of the machine that the origin ssh |
| login was observed on. | |
| origin_sshd_PID_hash | Identifier of the sshd privileged process |
| associated with the origin login. | |
The parent_MID and parent_sshd_PID_hash columns can be null if there is no parent ssh login. In that case, the (MID, sshd_PID_hash) tuple will be the same as the (origin MID, origin_sshd_PID_hash) tuple.
At time t1 (365), a first ssh connection is made to Machine A (366) from an external source (367) by a user having a username of “X.” In the following example, suppose the external source has an IP address of 1.1.1.10 and uses source port 10000 to connect to Machine A (which has an IP address of 2.2.2.20 and a destination port 22). External source 367 is considered an external source because its IP address is outside of the environment being monitored (e.g., is a node outside of entity A's datacenter, connecting to a node inside of entity A's datacenter).
A first ssh login session LS1 is created on machine A for user X. The privileged openssh process for this login is A1 (368). Under the login session LS1, the user creates a bash shell process with PID_hash A2 (369).
At time t2 (370), inside the bash shell process A2, the user runs an ssh program under a new process A3 (371) to log in to machine B (372) with a different username (“Y”). In particular, an ssh connection is made from source IP address 2.2.2.20 and source port 10001 (Machine A's source information) to destination IP address 2.2.2.21 and destination port 22 (Machine B's destination information).
A second ssh login session LS2 is created on machine B for user Y. The privileged openssh process for this login is B1 (373). Under the login session LS2, the user creates a bash shell process with PID_hash B2 (374).
At time t3 (376), inside the bash shell process B2, the user runs a curl command under a new process B3 (377) to download a file from an external destination (378). In particular, an HTTPS connection is made from source IP address 2.2.2.21 and source port 10002 (Machine B's source information) to external destination IP address 3.3.3.30 and destination port 443 (the external destination's information).
Using techniques described herein, it is possible to determine the original user who initiated the connection to external destination 378, which in this example is a user having the username X on machine A (where the extended user session can be determined to start with ssh login session LS1).
Based on local descendant tracking, the following determinations can be on machine A and B without yet having performed additional processing (described in more detail below):
-
- A3 is a descendant of A1 and thus associated with LS1.
- The connection to the external domain from machine B is initiated by B3.
- B3 is a descendant of B1 and is thus associated with LS2.
- Connection to the external domain is thus associated with LS2.
An association between A3 and LS2 can be established based on the fact that LS2 was created based on an ssh connection initiated from A3. Accordingly, it can be determined that LS2 is a child of LS1.
To determine the user responsible for making the connection to the external destination (e.g., if it were a known bad destination), first, the process that made the connection would be traced, i.e., from B3 to LS2. Then LS2 would be traced to LS1 (i.e., LS1 is the origin login session for LS2). Thus the user for this connection is the user for LS1, i.e., X. As represented in FIG. 3I , one can visualize the tracing by following the links (in the reverse direction of arrows) from external destination 378 to A1 (368).
In the example scenario, it is assumed that both ssh connections occur in the same analysis period. However, the approaches described herein will also work for connections and processes that are created in different time periods.
The process begins at 381 when new ssh connection records are identified. In particular, new ssh connections started during the current time period are identified by querying the connections table. The query uses filters on the start_time and dst_port columns. The values of the range filter on the start_time column are based on the current time period. The dst_port column is checked against ssh listening port(s). By default, the ssh listening port number is 22. However, as this could vary across environments, the port(s) that openssh servers are listening to in the environment can be determined by data collection agents dynamically and used as the filter value for the dst_port as applicable. In the scenario depicted in FIG. 3I , the query result will generate the records shown in FIG. 3K . Note that for the connection between machine A and B, the two machines are likely to report start_time values that are not exactly the same but close enough to be considered matching (e.g., within one minute or another appropriate amount of time). In the above table, they are shown to be the same for simplicity.
At 382, ssh connection records reported from source and destination sides of the same connection are matched. The ssh connection records (e.g., returned from the query at 381) are matched based on the following criteria:
-
- The five tuples (src_IP, dst_IP, IP_prot, src_port, dst_port) of the connection records must match.
- The delta between the start times of the connections must be within a limit that would account for the worst case clock difference expected between two machines in the environment and typical connection setup latency.
- If there are multiple matches possible, then the match with the smallest time delta is chosen.
Note that record 390 from machine A for the incoming connection from the external source cannot be matched with another record as there is an agent only on the destination side for this connection. Example output of portion 382 of process 380 is shown in FIG. 3L . The values in the dst_PID_hash column (391) are that of the sshd privileged process associated with ssh logins.
At 383, new logins during the current time period are identified by querying the logins table. The query uses a range filter on the login_time column with values based on the current time period. In the example depicted in FIG. 3I , the query result will generate the records depicted in FIG. 3M .
At 384, matched ssh connection records created at 382 and new login records created at 383 are joined to create new records that will eventually be stored in the login-connection table. The join condition is that dst_MID of the matched connection record is equal to the MID of the login record and the dst_PID_hash of the matched connection record is equal to the sshd_PID_hash of the login record. In the example depicted in FIG. 3I , the processing performed at 384 will generate the records depicted in FIG. 3N .
At 385, login-local-descendant records in the lookback time period are identified. It is possible that a process that is created in a previous time period makes an ssh connection in the current analysis batch period. Although not depicted in the example illustrated in FIG. 3I , consider a case where bash process A2 does not create ssh process A3 right away but instead that the ssh connection A3 later makes to machine B is processed in a subsequent time period than the one where A2 was processed. While processing this subsequent time period in which processes A3 and B1 are seen, knowledge of A2 would be useful in establishing that B1 is associated with A3 (via ssh connection) which is associated with A2 (via process parentage) which in turn would be useful in establishing that the parent of the second ssh login is the first ssh login. The time period for which look back is performed can be limited to reduce the amount of historical data that is considered. However, this is not a requirement (and the amount of look back can be determined, e.g., based on available processing resources). The login local descendants in the lookback time period can be identified by querying the login-local-descendant table. The query uses a range filter on the login time column where the range is from start_time_of_current_period−lookback_time to start_time_of_current_period. (No records as a result of performing 385 on the scenario depicted in FIG. 3I are obtained, as only a single time period is applicable in the example scenario.)
At 386, new processes that are started in the current time period are identified by querying the processes table. The query uses a range filter on the start_time column with values based on the current time period. In the example depicted in FIG. 3I , the processing performed at 386 will generate the records depicted in FIG. 3O .
At 387, new login-local-descendant records are identified. The purpose is to determine whether any of the new processes in the current time period are descendants of an ssh login process and if so to create records that will be stored in the login-local-descendant table for them. In order to do so, the parent-child relationships between the processes are recursively followed. Either a top down or bottom up approach can be used. In a top down approach, the ssh local descendants in the lookback period identified at 385, along with new ssh login processes in the current period identified at 384 are considered as possible ancestors for the new processes in the current period identified at 386.
Conceptually, the recursive approach can be considered to include multiple sub-steps where new processes that are identified to be ssh local descendants in the current sub-step are considered as ancestors for the next step. In the example scenario depicted in FIG. 3I , the following descendancy relationships will be established in two sub-steps:
Sub-step 1:
Process A2 is a local descendant of LS1 (i.e., MID=A, sshd_PID_hash=A1) because it is a child of process A1 which is the login process for LS1.
Process B2 is a local descendant of LS2 (i.e., MID=B, sshd_PID_hash=B1) because it is a child of process BI which is the login process for LS2.
Sub-step 2:
Process A3 is a local descendant of LS1 because it is a child of process A2 which is associated to LS1 in sub-step 1.
Process B3 is a local descendant of LS2 because it is a child of process B1 which is associated to LS2 in sub-step 1.
At 388, the lineage of new ssh logins created in the current time period is determined by associating their ssh connections to source processes that may be descendants of other ssh logins (which may have been created in the current period or previous time periods). In order to do so, first an attempt is made to join the new ssh login connections in the current period (identified at 384) with the combination of the login local descendants in the lookback period (identified at 385) and the login local descendants in the current time period (identified at 386). This will create adjacency relationships between child and parent logins. In the example depicted in FIG. 3I , the second ssh login connection will be associated with process A3 and an adjacency relationship between the two login sessions will be created (as illustrated in FIG. 3Q ).
Next, the adjacency relationships are used to find the original login sessions. While not shown in the sample scenario, there could be multiple ssh logins in a chain in the current time period, in which case a recursive approach (as in 387) could be used. At the conclusion of portion 388, the login lineage records depicted in FIG. 3R will be generated.
Finally, at 389, output data is generated. In particular, the new login-connection, login-local-descendant, and login-lineage records generated at 384, 387, and 388 are inserted into their respective output tables (e.g., in a transaction manner).
An alternate approach to matching TCP connections between machines running an agent is for the client to generate a connection GUID and send it in the connection request (e.g., the SYN packet) it sends and for the server to extract the GUID from the request. If two connection records from two machines have the same GUID, they are for the same connection. Both the client and server will store the GUID (if if exists) in the connection records they maintain and report. On the client side, the agent can configure the network stack (e.g. using IP tables functionality on Linux) to intercept an outgoing TCP SYN packet and modify it to add the generated GUID as a TCP option. On the server side, the agent already extracts TCP SYN packets and thus can look for this option and extract the GUID if it exists.
Example graph-based user tracking and threat detection embodiments associated with data platform 12 will now be described. Administrators and other users of network environments (e.g., entity A's datacenter 104) often change roles to perform tasks. As one example, suppose that at the start of a workday, an administrator (hereinafter “Joe Smith”) logs in to a console, using an individualized account (e.g., username=joe.smith). Joe performs various tasks as himself (e.g., answering emails, generating status reports, writing code, etc.). For other tasks (e.g., performing updates), Joe may require different/additional permission than his individual account has (e.g., root privileges). One way Joe can gain access to such permissions is by using sudo, which will allow Joe to run a single command with root privileges. Another way Joe can gain access to such permissions is by su or otherwise logging into a shell as root. After gaining root privileges, another thing that Joe can do is switch identities. As one example, to perform administrative tasks, Joe may use “su help” or “su database-admin” to become (respectively) the help user or the database-admin user on a system. He may also connect from one machine to another, potentially changing identities along the way (e.g., logging in as joe.smith at a first console, and connecting to a database server as database-admin). When he's completed various administrative tasks, Joe can relinquish his root privileges by closing out of any additional shells created, reverting back to a shell created for user joe.smith.
While there are many legitimate reasons for Joe to change his identity throughout the day, such changes may also correspond to nefarious activity. Joe himself may be nefarious, or Joe's account (joe.smith) may have been compromised by a third party (whether an “outsider” outside of entity A's network, or an “insider”). Using techniques described herein, the behavior of users of the environment can be tracked (including across multiple accounts and/or multiple machines) and modeled (e.g., using various graphs described herein). Such models can be used to generate alerts (e.g., to anomalous user behavior). Such models can also be used forensically, e.g., helping an investigator visualize various aspects of a network and activities that have occurred, and to attribute particular types of actions (e.g., network connections or file accesses) to specific users.
In a typical day in a datacenter, a user (e.g., Joe Smith) will log in, run various processes, and (optionally) log out. The user will typically log in from the same set of IP addresses, from IP addresses within the same geographical area (e.g., city or country), or from historically known IP addresses/geographical areas (i.e., ones the user has previously/occasionally used). A deviation from the user's typical (or historical) behavior indicates a change in login behavior. However, it does not necessarily mean that a breach has occurred. Once logged into a datacenter, a user may take a variety of actions. As a first example, a user might execute a binary/script. Such binary/script might communicate with other nodes in the datacenter, or outside of the datacenter, and transfer data to the user (e.g., executing “curl” to obtain data from a service external to the datacenter). As a second example, the user can similarly transfer data (e.g., out of the datacenter), such as by using POST. As a third example, a user might change privilege (one or more times), at which point the user can send/receive data as per above. As a fourth example, a user might connect to a different machine within the datacenter (one or more times), at which point the user can send/receive data as per the above.
In various embodiments, the above information associated with user behavior is broken into four tiers. The tiers represent example types of information that data platform 12 can use in modeling user behavior:
1. The user's entry point (e.g., domains, IP addresses, and/or geolocation information such as country/city) from which a user logs in.
2. The login user and machine class.
3. Binaries, executables, processes, etc. a user launches.
4. Internal servers with which the user (or any of the user's processes, child processes, etc.) communicates, and external contacts (e.g., domains, IP addresses, and/or geolocation information such as country/city) with which the user communicates (i.e., transfers data).
In the event of a security breach, being able to concretely answer questions about such information can be very important. And, collectively, such information is useful in providing an end-to-end path (e.g., for performing investigations).
In the following example, suppose a user (“UserA”) logs into a machine (“Machine01”) from a first IP address (“IP01”). Machine01 is inside a datacenter. UserA then launches a script (“runnable.sh”) on Machine01. From Machine01, UserA next logs into a second machine (“Machine02”) via ssh, also as UserA, also within the datacenter. On Machine02, UserA again launches a script (“new_runnable.sh”). On Machine02, UserA then changes privilege, becoming root on Machine02. From Machine02, UserA (now as root) logs into a third machine (“Machine03”) in the datacenter via ssh, as root on Machine03. As root on Machine03, the user executes a script (“collect_data.sh”) on Machine03. The script internally communicates (as root) to a MySQL-based service internal to the datacenter, and downloads data from the MySQL-based service. Finally, as root on Machine03, the user externally communicates with a server outside the datacenter (“External01”), using a POST command. To summarize what has occurred, in this example, the source/entry point is IP01. Data is transferred to an external server External01. The machine performing the transfer to External01 is Machine03. The user transferring the data is “root” (on Machine03), while the actual user (hiding behind root) is UserA.
In the above scenario, the “original user” (ultimately responsible for transmitting data to External01) is UserA, who logged in from IP01. Each of the processes ultimately started by UserA, whether started at the command line (tty) such as “runnable.sh” or started after an ssh connection such as “new_runnable.sh,” and whether as UserA, or as a subsequent identity, are all examples of child processes which can be arranged into a process hierarchy.
As previously mentioned, machines can be clustered together logically into machine clusters. One approach to clustering is to classify machines based on information such as the types of services they provide/binaries they have installed upon them/processes they execute. Machines sharing a given machine class (as they share common binaries/services/etc.) will behave similarly to one another. Each machine in a datacenter can be assigned to a machine cluster, and each machine cluster can be assigned an identifier (also referred to herein as a machine class). One or more tags can also be assigned to a given machine class (e.g., database_servers_west or prod_web_frontend). One approach to assigning a tag to a machine class is to apply term frequency analysis (e.g., TF/IDF) to the applications run by a given machine class, selecting as tags those most unique to the class. Data platform 12 can use behavioral baselines taken for a class of machines to identify deviations from the baseline (e.g., by a particular machine in the class).
The inclusion of an original user in both Tier 1 and Tier 2 allows for horizontal tiering. Such horizontal tiering ensures that there is no overlap between any two users in Tier 1 and Tier 2. Such lack of overlap provides for faster searching of an end-to-end path (e.g., one starting with a Tier 0 node and terminating at a Tier 3 node). Horizontal tiering also helps in establishing baseline insider behavior. For example, by building an hourly insider behavior graph, new edges/changes in edges between nodes in Tier 1 and Tier 2 can be identified. Any such changes correspond to a change associated with the original user. And, any such changes can be surfaced as anomalous and alerts can be generated.
As explained above, Tier 1 corresponds to a user (e.g., user “U”) logging into a machine having a particular machine class (e.g., machine class “M”). Tier 2 is a cluster of processes having command line similarity (e.g., CType “C”), having an original user “U,” and running as a particular effective user (e.g., user “U1”). The value of U1 may be the same as U (e.g., joe.smith in both cases), or the value of U1 may be different (e.g., U=joe.smith and U1=root). Thus, while an edge may be present from a Tier 1 node to a Tier 2 node, the effective user in the Tier 2 node may or may not match the original user (while the original user in the Tier 2 node will match the original user in the Tier 1 node).
A change from a user U into a user U1 can take place in a variety of ways. Examples include where U becomes U1 on the same machine (e.g., via su), and also where U sshes to other machine(s). In both situations, U can perform multiple changes, and can combine approaches. For example, U can become U1 on a first machine, ssh to a second machine (as U1), become U2 on the second machine, and ssh to a third machine (whether as user U2 or user U3). In various embodiments, the complexity of how user U ultimately becomes U3 (or U5, etc.) is hidden from a viewer of an insider behavior graph, and only an original user (e.g., U) and the effective user of a given node (e.g., U5) are depicted. As applicable (e.g., if desired by a viewer of the insider behavior graph), additional detail about the path (e.g., an end-to-end path of edges from user U to user U5) can be surfaced (e.g., via user interactions with nodes).
Nodes 414-423 are examples of Tier 2 nodes—processes that are launched by users in Tier 1 and their child, grandchild, etc. processes. Note that also depicted in FIG. 4B is a Tier 1 node 411 that corresponds to a user, “root,” that logged in to a machine cluster from within the datacenter (i.e., has an entry point within the datacenter). Nodes 425-1 and 425-2 are examples of Tier 3 nodes—internal/external IP addresses, servers, etc., with which Tier 2 nodes communicate.
In the example shown in FIG. 4B , a viewer of interface 404 has clicked on node 423. As indicated in region 426, the user running the marathon container is “root.” However, by following the directional arrows in the graph backwards from node 423 (i.e., from right to left), the viewer can determine that the original user, responsible for node 423, is “aruneli_prod,” who logged into the datacenter from IP 52.32.40.231.
The following are examples of changes that can be tracked using an insider behavior graph model:
-
- A user logs in from a new IP address.
- A user logs in from a geolocation not previously used by that user.
- A user logs into a new machine class.
- A user launches a process not previously used by that user.
- A user connects to an internal server to which the user has not previously connected.
- An original user communicates with an external server (or external server known to be malicious) with which that user has not previously communicated.
- A user communicates with an external server which has a geolocation not previously used by that user.
Such changes can be surfaced as alerts, e.g., to help an administrator determine when/what anomalous behavior occurs within a datacenter. Further, the behavior graph model can be used (e.g., during forensic analysis) to answer questions helpful during an investigation. Examples of such questions include:
-
- Was there any new login activity (Tier 0) in the timeframe being investigated? As one example, has a user logged in from an IP address with unknown geolocation information?Similarly, has a user started communicating externally with a
new Tier 3 node (e.g., one with unknown geolocation information). - Has there been any suspicious login activity (Tier 0) in the timeframe being investigated? As one example, has a user logged in from an IP address that corresponds to a known bad IP address as maintained by
Threat aggregator 150? Similarly, has there been anysuspicious Tier 3 activity? - Were any anomalous connections made within the datacenter during the timeframe being investigated? As one example, suppose a given user (“Frank”) typically enters a datacenter from a particular IP address (or range of IP addresses), and then connects to a first machine type (e.g., bastion), and then to a second machine type (e.g., database_prod). If Frank has directly connected to database_prod (instead of first going through bastion) during the timeframe, this can be surfaced using the insider graph.
- Who is (the original user) responsible for running a particular process?
- Was there any new login activity (Tier 0) in the timeframe being investigated? As one example, has a user logged in from an IP address with unknown geolocation information?Similarly, has a user started communicating externally with a
An example of an insider behavior graph being used in an investigation is depicted in FIGS. 4C and 4D . FIG. 4C depicts a baseline of behavior for a user, “Bill.” As shown in FIG. 4C , Bill typically logs into a datacenter from the IP address, 71.198.44.40 (427). He typically makes use of ssh (428), and sudo (429), makes use of a set of typical applications (430) and connects (as root) with the external service, api.lacework.net (431).
Suppose Bill's credentials are compromised by a nefarious outsider (“Eve”). FIG. 4D depicts an embodiment of how the graph depicted in FIG. 4C would appear once Eve begins exfiltrating data from the datacenter. Eve logs into the datacenter (using Bill's credentials) from 52.5.66.8 (432). As Bill, Eve escalates her privilege to root (e.g., via su), and then becomes a different user, Alex (e.g., via su alex). As Alex, Eve executes a script, “sneak.sh” (433), which launches another script, “post.sh” (434), which contacts external server 435 which has an IP address of 52.5.66.7, and transmits data to it. Edges 436-439 each represent changes in Bill's behavior. As previously mentioned, such changes can be detected as anomalies and associated alerts can be generated. As a first example, Bill logging in from an IP address he has not previously logged in from (436) can generate an alert. As a second example, while Bill does typically make use of sudo (429), he has not previously executed sneak.sh (433) or post.sh (434) and the execution of those scripts can generate alerts as well. As a third example, Bill has not previously communicated with server 435, and an alert can be generated when he does so (439). Considered individually, each of edges 436-439 may indicate nefarious behavior, or may be benign. As an example of a benign edge, suppose Bill begins working from a home office two days a week. The first time he logs in from his home office (i.e., from an IP address that is not 71.198.44.40), an alert can be generated that he has logged in from a new location. Over time, however, as Bill continues to log in from his home office but otherwise engages in typical activities, Bill's graph will evolve to include logins from both 71.198.44.40 and his home office as baseline behavior. Similarly, if Bill begins using a new tool in his job, an alert can be generated the first time he executes the tool, but over time will become part of his baseline.
In some cases, a single edge can indicate a serious threat. For example, if server 432 (or 435) is included in a known bad IP listing, edge 436 (or 439) indicates compromise. An alert that includes an appropriate severity level (e.g., “threat level high”) can be generated. In other cases, a combination of edges could indicate a threat (where a single edge might otherwise result in a lesser warning). In the example shown in FIG. 4D , the presence of multiple new edges is indicative of a serious threat. Of note, even though “sneak.sh” and “post.sh” were executed by Alex, because data platform 12 also keeps track of an original user, the compromise of user B's account will be discovered.
-
- Where is a user logging in from?
- Have any users logged in from a known bad address?
- Have any non-developer users accessed development machines?
- Which machines does a particular user access?
Examples of alerts that can be generated using the user login graph include:
-
- A user logs in from a known bad IP address.
- A user logs in from a new country for the first time.
- A new user logs into the datacenter for the first time.
- A user accesses a machine class that the user has not previously accessed.
One way to track privilege changes in a datacenter is by monitoring a process hierarchy of processes. To help filter out noisy commands/processes such as “su -u,” the hierarchy of processes can be constrained to those associated with network activity. In a *nix system, each process has two identifiers assigned to it, a process identifier (PID) and a parent process identifier (PPID). When such a system starts, the initial process is assigned a PID 0. Each user process has a corresponding parent process.
Using techniques described herein, a graph can be constructed (also referred to herein as a privilege change graph) which models privilege changes. In particular, a graph can be constructed which identifies where a process P1 launches a process P2, where P1 and P2 each have an associated user U1 and U2, with U1 being an original user, and U2 being an effective user. In the graph, each node is a cluster of processes (sharing a CType) executed by a particular (original) user. As all the processes in the cluster belong to the same user, a label that can be used for the cluster is the user's username. An edge in the graph, from a first node to a second node, indicates that a user of the first node changed its privilege to the user of the second node.
As with other graphs, anomalies in graph 443 can be used to generate alerts. Three examples of such alerts are as follows:
-
- New user entering the datacenter. Any time a new user enters the datacenter and runs a process, the graph will show a new node, with a new CType. This indicates a new user has been detected within the datacenter.
FIG. 4F is a representation of an example of an interface that depicts such an alert. Specifically, as indicated inregion 447, an alert for thetime period 1 pm-2 pm on June 8 was generated. The alert identifies that a new user, Bill (448) executed a process. - Privilege change. As explained above, a new edge, from a first node (user A) to a second node (user B) indicates that user A has changed privilege to user B.
- Privilege escalation. Privilege escalation is a particular case of privilege change, in which the first user becomes root.
- New user entering the datacenter. Any time a new user enters the datacenter and runs a process, the graph will show a new node, with a new CType. This indicates a new user has been detected within the datacenter.
An example of an anomalous privilege change and an example of an anomalous privilege escalation are each depicted in graph 450 of FIG. 4G . In particular, as indicated in region 451, two alerts for the time period 2 pm-3 pm on June 8 were generated (corresponding to the detection of the two anomalous events). In region 452, root has changed privilege to the user “daemon,” which root has not previously done. This anomaly is indicated to the user by highlighting the daemon node (e.g., outlining it in a particular color, e.g., red). As indicated by edge 453, Bill has escalated his privilege to the user root (which can similarly be highlighted in region 454). This action by Bill represents a privilege escalation.
An Extensible query interface for dynamic data compositions and filter applications will now be described.
As described herein, datacenters are highly dynamic environments. And, different customers of data platform 12 (e.g., entity A vs. entity B) may have different/disparate needs/requirements of data platform 12, e.g., due to having different types of assets, different applications, etc. Further, as time progresses, new software tools will be developed, new types of anomalous behavior will be possible (and should be detectable), etc. In various embodiments, data platform 12 makes use of predefined relational schema (including by having different predefined relational schema for different customers). However, the complexity and cost of maintaining/updating such predefined relational schema can rapidly become problematic—particularly where the schema includes a mix of relational, nested, and hierarchical (graph) datasets. In other embodiments, the data models and filtering applications used by data platform 12 are extensible. As will be described in more detail below, in various embodiments, data platform 12 supports dynamic query generation by automatic discovery of join relations via static or dynamic filtering key specifications among composable data sets. This allows a user of data platform 12 to be agnostic to modifications made to existing data sets as well as creation of new data sets. The extensible query interface also provides a declarative and configurable specification for optimizing internal data generation and derivations.
As will also be described in more detail below, data platform 12 is configured to dynamically translate user interactions (e.g., received via web app 120) into SQL queries (and without the user needing to know how to write queries). Such queries can then be performed (e.g., by query service 166) against any compatible backend (e.g., data store 30).
In the example shown in FIG. 4H , user A is viewing a dashboard that provides various information about entity A users (455), during the time period March 2 at midnight—March 25 at 7 pm (which she selected by interacting with region 456). Various statistical information is presented to user A in region 457. Region 458 presents a timeline of events that occurred during the selected time period. User A has opted to list only the critical, high, and medium events during the time period by clicking on the associated boxes (459-461). A total of 55 low severity, and 155 info-only events also occurred during the time period. Each time user A interacts with an element in FIG. 4H (e.g., clicks on box 461, clicks on link 464-1, or clicks on tab 465), her actions are translated/formalized into filters on the data set and used to dynamically generate SQL queries. The SQL queries are generated transparently to user A (and also to a designer of the user interface shown in FIG. 4H ).
User A notes in the timeline (462) that a user, Harish, connected to a known bad server (examplebad.com) using wget, an event that has a critical severity level. User A can click on region 463 to expand details about the event inline (which will display, for example, the text “External connection made to known bad host examplebad.com at port 80 from application ‘wget’ running on host dev1.lacework.internal as user harish”) directly below line 462. User A can also click on link 464-1, which will take her to a dossier for the event (depicted in FIG. 4I ). As will be described in more detail below, a dossier is a template for a collection of visualizations.
As shown in interface 466, the event of Harish using wget to contact examplebad.com on March 16 was assigned an event ID of 9291 by data platform 12 (467). For convenience to user A, the event is also added to her dashboard in region 476 as a bookmark (468). A summary of the event is depicted in region 469. By interacting with boxes shown in region 470, user A can see a timeline of related events. In this case, user A has indicated that she would like to see other events involving the wget application (by clicking box 471). Events of critical and medium security involving wget occurred during the one hour window selected in region 472.
Data stored in data store 30 can be internally organized as an activity graph. In the activity graph, nodes are also referred to as Entities. Activities generated by Entities are modeled as directional edges between nodes. Thus, each edge is an activity between two Entities. One example of an Activity is a “login” Activity, in which a user Entity logs into a machine Entity (with a directed edge from the user to the machine). A second example of an Activity is a “launch” Activity, in which a parent process launches a child process (with a directed edge from the parent to the child). A third example of an Activity is a “DNS query” Activity, in which either a process or a machine performs a query (with a directed edge from the requestor to the answer, e.g., an edge from a process to www.example.com). A fourth example of an Activity is a network “connected to” Activity, in which processes, IP addresses, and listen ports can connect to each other (with a directed edge from the initiator to the server).
As will be described in more detail below, query service 166 provides either relational views or graph views on top of data stored in data store 30. Typically, a user will to see want to see data filtered using the activity graph. For example, if an entity was not involved in an activity in a given time period, that entity should be filtered out of query results. Thus, a request to show “all machines” in a given time frame will be interpreted as “show distinct machines that were active” during the time frame.
A filter is an operator that: 1. takes an entity and field values as inputs, 2. a valid SQL expression with specific reference(s) of entity fields, or 3. is a conjunct/disjunct of filters. As will be described in more detail below, filters can be used to filter data in various ways, and limit data returned by query service 166 without changing the associated data set.
As mentioned above, a dossier is a template for a collection of visualizations. Each visualization (e.g., the box including chart 484) has a corresponding card, which identifies particular target information needed (e.g., from data store 30) to generate the visualization. In various embodiments, data platform 12 maintains a global set of dossiers/cards. Users of data platform 12 such as user A can build their own dashboard interfaces using preexisting dossiers/cards as components, and/or they can make use of a default dashboard (which incorporates various of such dossiers/cards).
A JSON file can be used to store multiple cards (e.g., as part of a query service catalog). A particular card is represented by a single JSON object with a unique name as a field name.
Each card may be described by the following named fields:
TYPE: the type of the card. Example values include:
-
- Entity (the default type)
- SQL
- Filters
- DynamicSQL
- graphFilter
- graph
- Function
- Template
PARAMETERS: a JSON array object that contains an array of parameter objects with the following fields:
-
- name (the name of the parameter)
- required (a Boolean flag indicating whether the parameter is required or not)
- default (a default value of the parameter)
- props (a generic JSON object for properties of the parameter. Possible values are: “utype” (a user defined type), and “scope” (an optional property to configure a namespace of the parameter))
- value (a value for the parameter—non-null to override the default value defined in nested source entities)
SOURCES: a JSON array object explicitly specifying references of input entities. Each source reference has the following attributes:
-
- name (the card/entity name or fully-qualified Table name)
- type (required for base Table entity)
- alias (an alias to access this source entity in other fields (e.g., returns, filters, groups, etc))
RETURNS: a required JSON array object of a return field object. A return field object can be described by the following attributes:
-
- field (a valid field name from a source entity)
- expr (a valid SQL scalar expression. References to input fields of source entities are specified in the format of #{Entity.Field}. Parameters can also be used in the expression in the format of ${ParameterName})
- type (the type of field, which is required for return fields specified by expr. It is also required for all return fields of an Entity with an SQL type)
- alias (the unique alias for return field)
- aggr (possible aggregations are: COUNT, COUNT_DISTINCT, DISTINCT, MAX, MIN, AVG, SUM, FIRST_VALUE, LAST_VALUE)
- case (JSON array object represents conditional expressions “when” and “expr”)
- fieldsFrom, and, except (specification for projections from a source entity with excluded fields)
- props (general JSON object for properties of the return field. Possible properties include: “filterGroup,” “title,” “format,” and “utype”)
PROPS: generic JSON objects for other entity properties
SQL: a JSON array of string literals for SQL statements. Each string literal can contain parameterized expressions ${ParameterName} and/or composable entity by #{EntityName}
GRAPH: required for graph entity. Has the following required fields:
-
- source (including “type,” “props,” and “keys”)
- target (including “type,” “props,” and “keys”)
- edge (including “type” and “props”)
JOINS: a JSON array of join operators. Possible fields for a join operator include:
-
- type (possible join types include: “loj”—Left Outer Join, “join”—Inner Join, “in”—Semi Join, “implicit”—Implicit Join)
- left (a left hand side field of join)
- right (a right hand side field of join)
- keys (key columns for multi-way joins)
- order (a join order of multi-way joins)
FKEYS: a JSON array of FilterKey(s). The fields for a FilterKey are:
-
- type (type of FilterKey)
- fieldRefs (reference(s) to return fields of an entity defined in the sources field)
- alias (an alias of the FilterKey, used in implicit join specification)
FILTERS: a JSON array of filters (conjunct). Possible fields for a filter include:
-
- type (types of filters, including: “eq”—equivalent to SQL =, “ne”—equivalent to SQL < >, “ge”—equivalent to SQL >=, “gt”—equivalent to SQL >, “le”—equivalent to SQL <=, “lt”-equivalent to SQL <, “like”—equivalent to SQL LIKE, “not_like”—equivalent to SQL NOT LIKE, “rlike”—equivalent to SQL RLIKE (Snowflake specific), “not_rlike”—equivalent to SQL NOT RLIKE (Snowflake specific), “in”—equivalent to SQL IN, “not in”—equivalent to SQL NOT IN)
- expr (generic SQL expression)
- field (field name)
- value (single value)
- values (for both IN and NOT IN)
ORDERS: a JSON array of ORDER BY for returning fields. Possible attributes for the ORDER BY clause include:
-
- field (field ordinal index (1 based) or field alias)
- order (asc/desc, default is ascending order)
GROUPS: a JSON array of GROUP BY for returning fields. Field attributes are:
-
- field (ordinal index (1 based) or alias from the return fields)
LIMIT: a limit for the number of records to be returned
OFFSET: an offset of starting position of returned data. Used in combination with limit for pagination.
Suppose customers of data platform 12 (e.g., entity A and entity B) request new data transformations or a new aggregation of data from an existing data set (as well as a corresponding visualization for the newly defined data set). As mentioned above, the data models and filtering applications used by data platform 12 are extensible. Thus, two example scenarios of extensibility are (1) extending the filter data set, and (2) extending a FilterKey in the filter data set.
As mentioned above, a second extensibility scenario is one in which a FilterKey in the filter data set is extended (i.e., existing template functions are used to define a new data set). As also mentioned above, data sets used by data platform 12 are composable/reusable/extensible, irrespective of whether the data sets are relational or graph data sets. One example data set is the User Tracking polygraph, which is generated as a graph data set (comprising nodes and edges). Like other polygraphs, User Tracking is an external data set that can be visualized both as a graph (via the nodes and edges) and can also be used as a filter data set for other cards, via the cluster identifier (CID) field.
As mentioned above, as users such as user A navigate through/interact with interfaces provided by data platform 12 (e.g., as shown in FIG. 4H ), such interactions trigger query service 166 to generate and perform queries against data store 30. Dynamic composition of filter datasets can be implemented using FilterKeys and FilterKey Types. A FilterKey can be defined as a list of columns and/or fields in a nested structure (e.g., JSON). Instances of the same FilterKey Type can be formed as an Implicit Join Group. The same instance of a FilterKey can participate in different Implicit Join Groups. A list of relationships among all possible Implicit Join Groups is represented as a Join graph for the entire search space to create a final data filter set by traversing edges and producing Join Path(s).
Each card (e.g., as stored in the query service catalog and used in a dossier) can be introspected by a/card/describe/CardID REST request.
At runtime (e.g., whenever it receives a request from web app 120), query service 166 parses the list of implicit joins and creates a Join graph to manifest relationships of FilterKeys among Entities. A Join graph (an example of which is depicted in FIG. 4K ) comprises a list of Join Link(s). A Join Link represents each implicit join group by the same FilterKey type. A Join Link maintains a reverse map (Entity-to-FilterKey) of FilterKeys and their Entities. As previously mentioned, Entities can have more than one FilterKey defined. The reverse map guarantees one FilterKey per Entity can be used for each JoinLink. Each JoinLink also maintains a list of entities for the priority order of joins. Each JoinLink is also responsible for creating and adding directional edge(s) to graphs. An edge represents a possible join between two Entities.
At runtime, each Implicit Join uses the Join graph to find all possible join paths. The search of possible join paths starts with the outer FilterKey of an implicit join. One approach is to use a shortest path approach, with breadth first traversal and subject to the following criteria:
-
- Use the priority order list of Join Links for all entities in the same implicit join group.
- Stop when a node (Entity) is reached which has local filter(s).
- Include all join paths at the same level (depth).
- Exclude join paths based on the predefined rules (path of edges).
At 487, a query is generated based on an implicit join. One example of processing that can be performed at 487 is as follows. As explained above, one way dynamic composition of filter datasets can be implemented is by using FilterKeys and FilterKey Types. And, instances of the same FilterKey Type can be formed as an Implicit Join Group. A Join graph for the entire search space can be constructed from a list of all relationships among all possible Join Groups. And, a final data filter set can be created by traversing edges and producing one or more Join Paths. Finally, the shortest path in the join paths is used to generate an SQL query string.
One approach to generating an SQL query string is to use a query building library (authored in an appropriate language such as Java). For example, a common interface “sqlGen” may be used in conjunction with process 485 is as follows. First, a card/entity is composed by a list of input cards/entities, where each input card recursively is composed by its own list of input cards. This nested structure can be visualized as a tree of query blocks(SELECT) in standard SQL constructs. SQL generation can be performed as the traversal of the tree from root to leaf entities (top-down), calling the sqlGen of each entity. Each entity can be treated as a subclass of the Java class(Entity). An implicit join filter (EntityFilter) is implemented as a subclass of Entity, similar to the right hand side of a SQL semi-join operator. Unlike the static SQL semi-join construct, it is conditionally and recursively generated even if it is specified in the input sources of the JSON specification. Another recursive interface can also be used in conjunction with process 485, preSQLGen, which is primarily the entry point for EntityFilter to run a search and generate nested implicit join filters. During preSQLGen recursive invocations, the applicability of implicit join filters is examined and pushed down to its input subquery list. Another top-down traversal, pullUpCachable, can be used to pull up common sub-query blocks, including those dynamically generated by preSQLGen, such that SELECT statements of those cacheable blocks are generated only once at top-level WITH clauses. A recursive interface, sqlWith, is used to generate nested subqueries inside WITH clauses. The recursive calls of a sqlWith function can generate nested WITH clauses as well. An sqlFrom function can be used to generate SQL FROM clauses by referencing those subquery blocks in the WITH clauses. It also produces INNER/OUTER join operators based on the joins in the specification. Another recursive interface, sqlWhere, can be used to generate conjuncts and disjuncts of local predicates and semi-join predicates based on implicit join transformations. Further, sqlProject, sqlGroupBy, sqlOrderBy, and sqlLimitOffset can respectively be used to translate the corresponding directives in JSON spec to SQL SELECT list, GROUP BY, ORDER BY, and LIMIT/OFFSET clauses.
Returning to process 485, at 488, the query (generated at 487) is used to respond to the request. As one example of the processing performed at 488, the generated query is used to query data store 30 and provide (e.g., to web app 120) fact data formatted in accordance with a schema (e.g., as associated with a card associated with the request received at 486).
Although the examples described herein largely relate to embodiments where data is collected from agents and ultimately stored in a data store such as those provided by Snowflake, in other embodiments data that is collected from agents and other sources may be stored in different ways. For example, data that is collected from agents and other sources may be stored in a data warehouse, data lake, data mart, and/or any other data store.
A data warehouse may be embodied as an analytic database (e.g., a relational database) that is created from two or more data sources. Such a data warehouse may be leveraged to store historical data, often on the scale of petabytes. Data warehouses may have compute and memory resources for running complicated queries and generating reports. Data warehouses may be the data sources for business intelligence (‘BI’) systems, machine learning applications, and/or other applications. By leveraging a data warehouse, data that has been copied into the data warehouse may be indexed for good analytic query performance, without affecting the write performance of a database (e.g., an Online Transaction Processing (‘OLTP’) database). Data warehouses also enable the joining data from multiple sources for analysis. For example, a sales OLTP application probably has no need to know about the weather at various sales locations, but sales predictions could take advantage of that data. By adding historical weather data to a data warehouse, it would be possible to factor it into models of historical sales data.
Data lakes, which store files of data in their native format, may be considered as “schema on read” resources. As such, any application that reads data from the lake may impose its own types and relationships on the data. Data warehouses, on the other hand, are “schema on write,” meaning that data types, indexes, and relationships are imposed on the data as it is stored in the EDW. “Schema on read” resources may be beneficial for data that may be used in several contexts and poses little risk of losing data. “Schema on write” resources may be beneficial for data that has a specific purpose, and good for data that must relate properly to data from other sources. Such data stores may include data that is encrypted using homomorphic encryption, data encrypted using privacy-preserving encryption, smart contracts, non-fungible tokens, decentralized finance, and other techniques.
Data marts may contain data oriented towards a specific business line whereas data warehouses contain enterprise-wide data. Data marts may be dependent on a data warehouse, independent of the data warehouse (e.g., drawn from an operational database or external source), or a hybrid of the two. In embodiments described herein, different types of data stores (including combinations thereof) may be leveraged. Such data stores may be proprietary or may be embodied as vendor provided products or services such as, for example, Google BigQuery, Druid, Amazon Redshift, IBM db2, Dremio, Databricks Lakehouse Platform, Cloudera, Azure Synapse Analytics, and others.
The deployments (e.g., a customer's cloud deployment) that are analyzed, monitored, evaluated, or otherwise observed by the systems described herein (e.g., systems that include components such as the platform 12 of FIG. 1D , the data collection agents described herein, and/or other components) may be provisioned, deployed, and/or managed using infrastructure as code (‘IaC’). IaC involves the managing and/or provisioning of infrastructure through code instead of through manual processes. With IaC, configuration files may be created that include infrastructure specifications. IaC can be beneficial as configurations may be edited and distributed, while also ensuring that environments are provisioned in a consistent manner. IaC approaches may be enabled in a variety of ways including, for example, using IaC software tools such as Terraform by HashiCorp. Through the usage of such tools, users may define and provide data center infrastructure using JavaScript Object Notation (‘JSON’), YAML, proprietary formats, or some other format. In some embodiments, the configuration files may be used to emulate a cloud deployment for the purposes of analyzing the emulated cloud deployment using the systems described herein. Likewise, the configuration files themselves may be used as inputs to the systems described herein, such that the configuration files may be inspected to identify vulnerabilities, misconfigurations, violations of regulatory requirements, or other issues. In fact, configuration files for multiple cloud deployments may even be used by the systems described herein to identify best practices, to identify configuration files that deviate from typical configuration files, to identify configuration files with similarities to deployments that have been determined to be deficient in some way, or the configuration files may be leveraged in some other ways to detect vulnerabilities, misconfigurations, violations of regulatory requirements, or other issues prior to deploying an infrastructure that is described in the configuration files. In some embodiments the techniques described herein may be use in multi-cloud, multi-tenant, cross-cloud, cross-tenant, cross-user, industry cloud, digital platform, and other scenarios depending on specific need or situation.
In some embodiments, the deployments that are analyzed, monitored, evaluated, or otherwise observed by the systems described herein (e.g., systems that include components such as the platform 12 of FIG. 1D , the data collection agents described herein, and/or other components) may be monitored to determine the extent to which a particular component has experienced “drift” relative to its associated IaC configuration. Discrepancies between how cloud resources were defined in an IaC configuration file and how they are currently configured in runtime may be identified and remediation workflows may be initiated to generate an alert, reconfigure the deployment, or take some other action. Such discrepancies may occur for a variety of reasons. Such discrepancies may occur, for example, due to maintenance operations being performed, due to incident response tasks being carried out, or for some other reason. Readers will appreciate that while IaC helps avoid initial misconfigurations of a deployment by codifying and enforcing resource creation, resource configuration, security policies, and so on, the systems described herein may prevent unwanted drift from occurring during runtime and after a deployment has been created in accordance with an IaC configuration.
In some embodiments, the deployments (e.g., a customer's cloud deployment) that are analyzed, monitored, evaluated, or otherwise observed by the systems described herein (e.g., systems that include components such as the platform 12 of FIG. 1D , the data collection agents described herein, and/or other components) may also be provisioned, deployed, and/or managed using security as code (‘SaC’). SaC extends IaC concepts by defining cybersecurity policies and/or standards programmatically, so that the policies and/or standards can be referenced automatically in the configuration scripts used to provision cloud deployments. Stated differently, SaC can automate policy implementation and cloud deployments may even be compared with the policies to prevent “drift.” For example, if a policy is created where all personally identifiable information (‘PII’) or personal health information (‘PHI’) must be encrypted when it is stored, that policy is translated into a process that is automatically launched whenever a developer submits code, and code that violates the policy may be automatically rejected.
In some embodiments, SaC may be implemented by initially classifying workloads (e.g., by sensitivity, by criticality, by deployment model, by segment). Policies that can be instantiated as code may subsequently be designed. For example, compute-related policies may be designed, access-related policies may be designed, application-related policies may be designed, network-related policies may be designed, data-related policies may be designed, and so on. Security as code may then be instantiated through architecture and automation, as successful implementation of SaC can benefit from making key architectural-design decisions and executing the right automation capabilities. Next, operating model protections may be built and supported. For example, an operating model may “shift left” to maximize self-service and achieve full-life-cycle security automation (e.g., by standardizing common development toolchains, CI/CD pipelines, and the like). In such an example, security policies and access controls may be part of the pipeline, automatic code review and bug/defect detection may be performed, automated build processes may be performed, vulnerability scanning may be performed, checks against a risk-control framework may be made, and other tasks may be performed all before deploying an infrastructure or components thereof.
The systems described herein may be useful in analyzing, monitoring, evaluating, or otherwise observing a GitOps environment. In a GitOps environment, Git may be viewed as the one and only source of truth. As such, GitOps may require that the desired state of infrastructure (e.g., a customer's cloud deployment) be stored in version control such that the entire audit trail of changes to such infrastructure can be viewed or audited. In a GitOps environment, all changes to infrastructure are embodied as fully traceable commits that are associated with committer information, commit IDs, time stamps, and/or other information. In such an embodiment, both an application and the infrastructure (e.g., a customer's cloud deployment) that supports the execution of the application are therefore versioned artifacts and can be audited using the gold standards of software development and delivery. Readers will appreciate that while the systems described herein are described as analyzing, monitoring, evaluating, or otherwise observing a GitOps environment, in other embodiments other source control mechanisms may be utilized for creating infrastructure, making changes to infrastructure, and so on. In these embodiments, the systems described herein may similarly be used for analyzing, monitoring, evaluating, or otherwise observing such environments.
As described in other portions of the present disclosure, the systems described herein may be used to analyze, monitor, evaluate, or otherwise observe a customer's cloud deployment. While securing traditional datacenters requires managing and securing an IP-based perimeter with networks and firewalls, hardware security modules (‘HSMs’), security information and event management (‘SIEM’) technologies, and other physical access restrictions, such solutions are not particularly useful when applied to cloud deployments. As such, the systems described herein may be configured to interact with and even monitor other solutions that are appropriate for cloud deployments such as, for example, “zero trust” solutions.
A zero trust security model (a.k.a., zero trust architecture) describes an approach to the design and implementation of IT systems. A primary concept behind zero trust is that devices should not be trusted by default, even if they are connected to a managed corporate network such as the corporate LAN and even if they were previously verified. Zero trust security models help prevent successful breaches by eliminating the concept of trust from an organization's network architecture. Zero trust security models can include multiple forms of authentication and authorization (e.g., machine authentication and authorization, human/user authentication and authorization) and can also be used to control multiple types of accesses or interactions (e.g., machine-to-machine access, human-to-machine access).
In some embodiments, the systems described herein may be configured to interact with zero trust solutions in a variety of ways. For example, agents that collect input data for the systems described herein (or other components of such systems) may be configured to access various machines, applications, data sources, or other entity through a zero trust solution, especially where local instances of the systems described herein are deployed at edge locations. Likewise, given that zero trust solutions may be part of a customer's cloud deployment, the zero trust solution itself may be monitored to identify vulnerabilities, anomalies, and so on. For example, network traffic to and from the zero trust solution may be analyzed, the zero trust solution may be monitored to detect unusual interactions, log files generated by the zero trust solution may be gathered and analyzed, and so on.
In some embodiments, the systems described herein may leverage various tools and mechanisms in the process of performing its primary tasks (e.g., monitoring a cloud deployment). For example, Linux eBPF is mechanism for writing code to be executed in the Linux kernel space. Through the usage of eBPF, user mode processes can hook into specific trace points in the kernel and access data structures and other information. For example, eBPF may be used to gather information that enables the systems described herein to attribute the utilization of networking resources or network traffic to specific processes. This may be useful in analyzing the behavior of a particular process, which may be important for observability/SIEM.
The systems described may be configured to collect security event logs (or any other type of log or similar record of activity) and telemetry in real time for threat detection, for analyzing compliance requirements, or for other purposes. In such embodiments, the systems described herein may analyze telemetry in real time (or near real time), as well as historical telemetry, to detect attacks or other activities of interest. The attacks or activities of interest may be analyzed to determine their potential severity and impact on an organization. In fact, the attacks or activities of interest may be reported, and relevant events, logs, or other information may be stored for subsequent examination.
In one embodiment, systems described herein may be configured to collect security event logs (or any other type of log or similar record of activity) and telemetry in real time to provide customers with a SIEM or SIEM-like solution. SIEM technology aggregates event data produced by security devices, network infrastructure, systems, applications, or other source. Centralizing all of the data that may be generated by a cloud deployment may be challenging for a traditional STEM, however, as each component in a cloud deployment may generate log data or other forms of machine data, such that the collective amount of data that can be used to monitor the cloud deployment can grow to be quite large. A traditional SIEM architecture, where data is centralized and aggregated, can quickly result in large amounts of data that may be expensive to store, process, retain, and so on. As such, SIEM technologies may frequently be implemented such that silos are created to separate the data.
In some embodiments of the present disclosure, data that is ingested by the systems described herein may be stored in a cloud-based data warehouse such as those provided by Snowflake and others. Given that companies like Snowflake offer data analytics and other services to operate on data that is stored in their data warehouses, in some embodiments one or more of the components of the systems described herein may be deployed in or near Snowflake as part of a secure data lake architecture (a.k.a., a security data lake architecture, a security data lake/warehouse). In such an embodiment, components of the systems described herein may be deployed in or near Snowflake to collect data, transform data, analyze data for the purposes of detecting threats or vulnerabilities, initiate remediation workflows, generate alerts, or perform any of the other functions that can be performed by the systems described herein. In such embodiments, data may be received from a variety of sources (e.g., EDR or EDR-like tools that handle endpoint data, cloud access security broker (‘CASB’) or CASB-like tools that handle data describing interactions with cloud applications, Identity and Access Management (‘IAM’) or IAM-like tools, and many others), normalized for storage in a data warehouse, and such normalized data may be used by the systems described herein. In fact, the systems described herein may actually implement the data sources (e.g., an EDR tool, a CASB tool, an IAM tool) described above.
In some embodiments one data source that is ingested by the systems described herein is log data, although other forms of data such as network telemetry data (flows and packets) and/or many other forms of data may also be utilized. In some embodiments, event data can be combined with contextual information about users, assets, threats, vulnerabilities, and so on, for the purposes of scoring, prioritization and expediting investigations. In some embodiments, input data may be normalized, so that events, data, contextual information, or other information from disparate sources can be analyzed more efficiently for specific purposes (e.g., network security event monitoring, user activity monitoring, compliance reporting). The embodiments described here offer real-time analysis of events for security monitoring, advanced analysis of user and entity behaviors, querying and long-range analytics for historical analysis, other support for incident investigation and management, reporting (for compliance requirements, for example), and other functionality.
In some embodiments, the systems described herein may be part of an application performance monitoring (‘APM’) solution. APM software and tools enable the observation of application behavior, observation of its infrastructure dependencies, observation of users and business key performance indicators (‘KPIs’) throughout the application's life cycle, and more. The applications being observed may be developed internally, as packaged applications, as software as a service (‘SaaS’), or embodied in some other ways. In such embodiments, the systems described herein may provide one or more of the following capabilities:
The ability to operate as an analytics platform that ingests, analyzes, and builds context from traces, metrics, logs, and other sources.
Automated discovery and mapping of an application and its infrastructure components.
Observation of an application's complete transactional behavior, including interactions over a data communications network.
Monitoring of applications running on mobile (native and browser) and desktop devices.
Identification of probable root causes of an application's performance problems and their impact on business outcomes.
Integration capabilities with automation and service management tools.
Analysis of business KPIs and user journeys (for example, login to check-out).
Domain-agnostic analytics capabilities for integrating data from third-party sources.
Endpoint monitoring to understand the user experience and its impact on business outcomes.
Support for virtual desktop infrastructure (‘VDI’) monitoring.
In embodiments where the systems described herein are used for APM, some components of the system may be modified, other components may be added, some components may be removed, and other components may remain the same. In such an example, similar mechanisms as described elsewhere in this disclosure may be used to collect information from the applications, network resources used by the application, and so on. The graph based modelling techniques may also be leveraged to perform some of the functions mentioned above, or other functions as needed.
In some embodiments, the systems described herein may be part of a solution for developing and/or managing artificial intelligence (‘AI’) or machine learning (‘ML’) applications. For example, the systems described herein may be part of an AutoML tool that automate the tasks associated with developing and deploying ML models. In such an example, the systems described herein may perform various functions as part of an AutoML tool such as, for example, monitoring the performance of a series of processes, microservices, and so on that are used to collectively form the AutoML tool. In other embodiments, the systems described herein may perform other functions as part of an AutoML tool or may be used to monitor, analyze, or otherwise observe an environment that the AutoML tool is deployed within.
In some embodiments, the systems described herein may be used to manage, analyze, or otherwise observe deployments that include other forms of AI/ML tools. For example, the systems described herein may manage, analyze, or otherwise observe deployments that include AI services. AI services are, like other resources in an as-a-service model, ready-made models and AI applications that are consumable as services and made available through APIs. In such an example, rather than using their own data to build and train models for common activities, organizations may access pre-trained models that accomplish specific tasks. Whether an organization needs natural language processing (‘NLP’), automatic speech recognition (‘ASR’), image recognition, or some other capability, AI services simply plug-and-play into an application through an API. Likewise, the systems described herein may be used to manage, analyze, or otherwise observe deployments that include other forms of AI/ML tools such as Amazon Sagemaker (or other cloud machine-learning platform that enables developers to create, train, and deploy ML models) and related services such as Data Wrangler (a service to accelerate data prep for ML) and Pipelines (a CI/CD service for ML).
In some embodiments, the systems described herein may be used to manage, analyze, or otherwise observe deployments that include various data services. For example, data services may include secure data sharing services, data marketplace services, private data exchanges services, and others. Secure data sharing services can allow access to live data from its original location, where those who are granted access to the data simply reference the data in a controlled and secure manner, without latency or contention from concurrent users. Because changes to data are made to a single version, data remains up-to-date for all consumers, which ensures data models are always using the latest version of such data. Data marketplace services operate as a single location to access live, ready-to-query data (or data that is otherwise ready for some other use). A data marketplace can even include a “feature stores,” which can allow data scientists to repurpose existing work. For example, once a data scientist has converted raw data into a metric (e.g., costs of goods sold), this universal metric can be found quickly and used by other data scientists for quick analysis against that data.
In some embodiments, the systems described herein may be used to manage, analyze, or otherwise observe deployments that include distributed training engines or similar mechanisms such as, for example, such as tools built on Dask. Dask is an open source library for parallel computing that is written in Python. Dask is designed to enable data scientists to improve model accuracy faster, as Dask enables data scientists can do everything in Python end-to-end, which means that they no longer need to convert their code to execute in environments like Apache Spark. The result is reduced complexity and increased efficiency. The systems described herein may also be used to manage, analyze, or otherwise observe deployments that include technologies such as RAPIDS (an open source Python framework which is built on top of Dask). RAPIDS optimizes compute time and speed by providing data pipelines and executing data science code entirely on graphics processing units (GPUs) rather than CPUs. Multi-cluster, shared data architecture, DataFrames, Java user-defined functions (UDF) are supported to enable trained models to run within a data warehouse.
In some embodiments, the systems described herein may be leveraged for the specific use case of detecting and/or remediating ransomware attacks and/or other malicious action taken with respect to data, systems, and/or other resources associated with one or more entities. Ransomware is a type of malware from cryptovirology that threatens to publish the victim's data or perpetually block access to such data unless a ransom is paid. In such embodiments, ransomware attacks may be carried out in a manner such that patterns (e.g., specific process-to-process communications, specific data access patterns, unusual amounts of encryption/re-encryption activities) emerge, where the systems described herein may monitor for such patterns. Alternatively, ransomware attacks may involve behavior that deviates from normal behavior of a cloud deployment that is not experiencing a ransomware attack, such that the mere presence of unusual activity may trigger the systems described herein to generate alerts or take some other action, even without explicit knowledge that the unusual activity is associated with a ransomware attack.
In some embodiments, particular policies may be put in place the systems described herein may be configured to enforce such policies as part of an effort to thwart ransomware attacks. For example, particular network sharing protocols (e.g., Common Internet File System (‘CIFS’), Network File System (‘NFS’)) may be avoided when implementing storage for backup data, policies that protect backup systems may be implemented and enforced to ensure that usable backups are always available, multifactor authentication for particular accounts may be utilized and accounts may be configured with the minimum privilege required to function, isolated recovery environments may be created and isolation may be monitored and enforced to ensure the integrity of the recovery environment, and so on. As described in the present disclosure, the systems described herein may be configured to explicitly enforce such policies or may be configured to detect unusual activity that represents a violation of such policies, such that the mere presence of unusual activity may trigger the systems described herein to generate alerts or take some other action, even without explicit knowledge that the unusual activity is associated with a violation of a particular policy.
Readers will appreciate that ransomware attacks are often deployed as part of a larger attack that may involve, for example:
Penetration of the network through means such as, for example, stolen credentials and remote access malware.
Stealing of credentials for critical system accounts, including subverting critical administrative accounts that control systems such as backup, Active Directory (‘AD’), DNS, storage admin consoles, and/or other key systems.
Attacks on a backup administration console to turn off or modify backup jobs, change retention policies, or even provide a roadmap to where sensitive application data is stored.
Data theft attacks.
As a result of the many aspects that are part of a ransomware attack, embodiments of the present disclosure may be configured as follows:
The systems may include one or more components that detect malicious activity based on the behavior of a process.
The systems may include one or more components that store indicator of compromise (‘IOC’) or indicator of attack (‘IOA’) data for retrospective analysis.
The systems may include one or more components that detect and block fileless malware attacks.
The systems may include one or more components that remove malware automatically when detected.
The systems may include a cloud-based, SaaS-style, multitenant infrastructure.
The systems may include one or more components that identify changes made by malware and provide the recommended remediation steps or a rollback capability.
The systems may include one or more components that detect various application vulnerabilities and memory exploit techniques.
The systems may include one or more components that continue to collect suspicious event data even when a managed endpoint is outside of an organization's network.
The systems may include one or more components that perform static, on-demand malware detection scans of folders, drives, devices, or other entities.
The systems may include data loss prevention (DLP) functionality.
In some embodiments, the systems described herein may manage, analyze, or otherwise observe deployments that include deception technologies. Deception technologies allow for the use of decoys that may be generated based on scans of true network areas and data. Such decoys may be deployed as mock networks running on the same infrastructure as the real networks, but when an intruder attempts to enter the real network, they are directed to the false network and security is immediately notified. Such technologies may be useful for detecting and stopping various types of cyber threats such as, for example, Advanced Persistent Threats (‘APTs’), malware, ransomware, credential dumping, lateral movement and malicious insiders. To continue to outsmart increasingly sophisticated attackers, these solutions may continuously deploy, support, refresh and respond to deception alerts.
In some embodiments, the systems described herein may manage, analyze, or otherwise observe deployments that include various authentication technologies, such as multi-factor authentication and role-based authentication. In fact, the authentication technologies may be included in the set of resources that are managed, analyzed, or otherwise observed as interactions with the authentication technologies may monitored. Likewise, log files or other information retained by the authentication technologies may be gathered by one or more agents and used as input to the systems described herein.
In some embodiments, the systems described herein may be leveraged for the specific use case of detecting supply chain attacks. More specifically, the systems described herein may be used to monitor a deployment that includes software components, virtualized hardware components, and other components of an organization's supply chain such that interactions with an outside partner or provider with access to an organization's systems and data can be monitored. In such embodiments, supply chain attacks may be carried out in a manner such that patterns (e.g., specific interactions between internal and external systems) emerge, where the systems described herein may monitor for such patterns. Alternatively, supply chain attacks may involve behavior that deviates from normal behavior of a cloud deployment that is not experiencing a supply chain attack, such that the mere presence of unusual activity may trigger the systems described herein to generate alerts or take some other action, even without explicit knowledge that the unusual activity is associated with a supply chain attack.
In some embodiments, the systems described herein may be leveraged for other specific use cases such as, for example, detecting the presence of (or preventing infiltration from) cryptocurrency miners (e.g., bitcoin miners), token miners, hashing activity, non-fungible token activity, other viruses, other malware, and so on. As described in the present disclosure, the systems described herein may monitor for such threats using known patterns or by detecting unusual activity, such that the mere presence of unusual activity may trigger the systems described herein to generate alerts or take some other action, even without explicit knowledge that the unusual activity is associated with a particular type of threat, intrusion, vulnerability, and so on.
The systems described herein may also be leveraged for endpoint protection, such the systems described herein form all of or part of an endpoint protection platform. In such an embodiment, agents, sensors, or similar mechanisms may be deployed on or near managed endpoints such as computers, servers, virtualized hardware, internet of things (‘IotT’) devices, mobile devices, phones, tablets, watches, other personal digital devices, storage devices, thumb drives, secure data storage cards, or some other entity. In such an example, the endpoint protection platform may provide functionality such as:
Prevention and protection against security threats including malware that uses file-based and fileless exploits.
The ability to apply control (allow/block) to access of software, scripts, processes, microservices, and so on.
The ability to detect and prevent threats using behavioral analysis of device activity, application activity, user activity, and/or other data.
The ability for facilities to investigate incidents further and/or obtain guidance for remediation when exploits evade protection controls
The ability to collect and report on inventory, configuration and policy management of the endpoints.
The ability to manage and report on operating system security control status for the monitored endpoints.
The ability to scan systems for vulnerabilities and report/manage the installation of security patches.
The ability to report on internet, network and/or application activity to derive additional indications of potentially malicious activity.
Example embodiments are described in which policy enforcement, threat detection, or some other function is carried out by the systems described herein by detecting unusual activity, such that the mere presence of unusual activity may trigger the systems described herein to generate alerts or take some other action, even without explicit knowledge that the unusual activity is associated with a particular type of threat, intrusion, vulnerability, and so on. Although these examples are largely described in terms of identifying unusual activity, in these examples the systems described herein may be configured to learn what constitutes ‘normal activity’—where ‘normal activity’ is activity observed, modeled, or otherwise identified in the absence of a particular type of threat, intrusion, vulnerability, and so on. As such, detecting ‘unusual activity’ may alternatively be viewed as detecting a deviation from ‘normal activity’ such that ‘unusual activity’ does not need to be identified and sought out. Instead, deviations from ‘normal activity’ may be assumed to be ‘unusual activity’.
Readers will appreciate that while specific examples of the functionality that the systems described herein can provide are included in the present disclosure, such examples are not to be interpreted as limitations as to the functionality that the systems described herein can provide. Other functionality may be provided by the systems described herein, all of which are within the scope of the present disclosure. For the purposes of illustration and not as a limitation, additional examples can include governance, risk, and compliance (‘GRC’), threat detection and incident response, identity and access management, network and infrastructure security, data protection and privacy, identity and access management (‘IAM’), and many others.
In order to provide the functionality described above, the systems described herein or the deployments that are monitored by such systems may implement a variety of techniques. For example, the systems described herein or the deployments that are monitored by such systems may tag data and logs to provide meaning or context, persistent monitoring techniques may be used to monitor a deployment at all times and in real time, custom alerts may be generated based on rules, tags, and/or known baselines from one or more polygraphs, and so on.
Although examples are described above where data may be collected from one or more agents, in some embodiments other methods and mechanisms for obtaining data may be utilized. For example, some embodiments may utilize agentless deployments where no agent (or similar mechanism) is deployed on one or more customer devices, deployed within a customer's cloud deployment, or deployed at another location that is external to the data platform. In such embodiments, the data platform may acquire data through one or more APIs such as the APIs that are available through various cloud services. For example, one or more APIs that enable a user to access data captured by Amazon CloudTrail may be utilized by the data platform to obtain data from a customer's cloud deployment without the use of an agent that is deployed on the customer's resources. In some embodiments, agents may be deployed as part of a data acquisition service or tool that does not utilize a customer's resources or environment. In some embodiments, agents (deployed on a customer's resources or elsewhere) and mechanisms in the data platform that can be used to obtain data from through one or more APIs such as the APIs that are available through various cloud services may be utilized. In some embodiments, one or more cloud services themselves may be configured to push data to some entity (deployed anywhere), which may or may not be an agent. In some embodiments, other data acquisition techniques may be utilized, including combinations and variations of the techniques described above, each of which is within the scope of the present disclosure.
Readers will appreciate that while specific examples of the cloud deployments that may be monitored, analyzed, or otherwise observed by the systems described herein have been provided, such examples are not to be interpreted as limitations as to the types of deployments that may be monitored, analyzed, or otherwise observed by the systems described herein. Other deployments may be monitored, analyzed, or otherwise observed by the systems described herein, all of which are within the scope of the present disclosure. For the purposes of illustration and not as a limitation, additional examples can include multi-cloud deployments, on-premises environments, hybrid cloud environments, sovereign cloud environments, heterogeneous environments, DevOps environments, DevSecOps environments, GitOps environments, quantum computing environments, data fabrics, composable applications, composable networks, decentralized applications, and many others.
Readers will appreciate that while specific examples of the types of data that may be collected, transformed, stored, and/or analyzed by the systems described herein have been provided, such examples are not to be interpreted as limitations as to the types of data that may be collected, transformed, stored, and/or analyzed by the systems described herein. Other types of data can include, for example, data collected from different tools (e.g., DevOps tools, DevSecOps, GitOps tools), different forms of network data (e.g., routing data, network translation data, message payload data, Wifi data, Bluetooth data, personal area networking data, payment device data, near field communication data, metadata describing interactions carried out over a network, and many others), data describing processes executing in a container, lambda, EC2 instance, virtual machine, or other execution environment), information describing the execution environment itself, and many other types of data.
In some embodiments, one or more of the components described above may be deployed using a secure access service edge (‘SASE’) model or similar model. In a SASE model, the services, functionality, or components described above may be deployed at edge devices (or relatively close to such edge device) such as a user's laptop, tablet, smartphone, or other device. In such a way, network security controls may be delivered on such edge devices. SASE capabilities may be delivered as a service based upon the identity of the entity, real-time context, enterprise security/compliance policies and continuous assessment of risk/trust throughout the sessions, where the identity of entities can be associated with people, groups of people, devices, applications, services, IoT systems or edge computing locations, and so on. In these embodiments, one or more of the components described above may be deployed at or near the edge devices, and the edge devices may even include local applications that are configured to utilize one or more of the components described above where the components are not deployed on the edge devices themselves.
Advantages and features of the present disclosure can be further described by the following statements:
1. A method comprising: obtaining, by an agent monitoring a cloud compute environment, a data packet from an interface in the cloud compute environment, the data packet including a source address and a non-endpoint destination address; determining, by the agent and based on the non-endpoint destination address and routing information for the data packet, an endpoint destination address associated with the non-endpoint destination address of the data packet; modifying, by the agent, the data packet by replacing the non-endpoint destination address with the endpoint destination address; and providing, by the agent and based on the modified data packet, monitoring data to a data platform.
2. The method of statement 1, wherein the source address comprises an IP address of a container in the cloud compute environment.
3. The method of statement 1, wherein the source address comprises a pod IP address for a pod including a container.
4. The method of any of the preceding statements, wherein the non-endpoint destination address comprises a service IP address associated with a service network in the cloud compute environment.
5. The method of any of statements 1-3, wherein the non-endpoint destination address comprises a host IP address associated with a host network in the cloud compute environment.
6. The method of any of the preceding statements, further comprising: obtaining, by a second agent monitoring the cloud compute environment, a second data packet from a second interface in the cloud compute environment, the second data packet including a second source address and a second non-endpoint destination address; determining, by the second agent and based on the second non-endpoint destination address and routing information for the second data packet, that the endpoint destination address is associated with the second non-endpoint destination address of the second data packet; modifying, by the second agent, the second data packet by replacing the second non-endpoint destination address with the endpoint destination address; and providing, by the second agent and based on the modified second data packet, second monitoring data to the data platform.
7. The method of any of the previous statements, further comprising: receiving at the data platform, the monitoring data; and generating a polygraph based at least in part on the monitoring data.
8. A computer program product embodied in a non-transitory computer-readable medium and comprising computer instructions for: obtaining, by monitoring a cloud compute environment, a data packet from an interface in the cloud compute environment, the data packet including a source address and a non-endpoint destination address; determining, based on the non-endpoint destination address and routing information for the data packet, an endpoint destination address associated with the non-endpoint destination address of the data packet; modifying the data packet by replacing the non-endpoint destination address with the endpoint destination address; and providing, based on the modified data packet, monitoring data to a data platform.
9. The computer program product of statement 8, wherein the source address comprises an IP address of a container in the cloud compute environment.
10. The computer program product of statement 8, wherein the source address comprises a pod IP address for a pod including a container.
11. The computer program product of any of statements 8-10, wherein the non-endpoint destination address comprises a service IP address associated with a service network in the cloud compute environment.
12. The computer program product of any of statements 8-10, wherein the non-endpoint destination address comprises a host IP address associated with a host network in the cloud compute environment.
13. The computer program product of any of statements 8-12, the computer instructions further for: obtaining, by monitoring the cloud compute environment, a second data packet from a second interface in the cloud compute environment, the second data packet including a second source address and a second non-endpoint destination address; determining, based on the second non-endpoint destination address and routing information for the second data packet, that the endpoint destination address is associated with the second non-endpoint destination address of the second data packet; modifying the second data packet by replacing the second non-endpoint destination address with the endpoint destination address; and providing, based on the modified second data packet, second monitoring data to the data platform.
14. The computer program product of statement 13, wherein: the source address is an endpoint source address; and the second source address in a non-endpoint source address.
15. A system for monitoring a cloud compute environment, the system comprising: a memory storing computer-executable instructions; a processor to execute the computer-executable instructions to: obtain a data packet from an interface in the cloud compute environment, the data packet including a source address and a non-endpoint destination address; determine, based on the non-endpoint destination address and routing information for the data packet, an endpoint destination address associated with the non-endpoint destination address of the data packet; modify the data packet by replacing the non-endpoint destination address with the endpoint destination address; and provide, based on the modified data packet, monitoring data to a data platform.
16. The system of statement 15, wherein the source address comprises an IP address of a container in the cloud compute environment.
17. The system of statement 15, wherein the source address comprises a pod IP address for a pod including a container.
18. The system of any of statements 15-17, wherein the non-endpoint destination address comprises a service IP address associated with a service network in the cloud compute environment.
19. The system of any of statements 15-17, wherein the non-endpoint destination address comprises a host IP address associated with a host network in the cloud compute environment.
20. The system of any of statements 15-17, wherein: the non-endpoint destination address comprises a service IP address associated with a service network in the cloud compute environment; and the endpoint destination address comprises a pod IP address associated with a pod in the cloud compute environment.
In some embodiments, one or more agents deployed in a cloud environment, such as in the cloud environment 14, may monitor the cloud environment to collect and provide information about the cloud environment to a data platform such as the data platform 12, including in any of the ways described herein. For example, the agents may collect information from and/or about communications between entities in the cloud environment.
However, when a cloud environment has many highly dynamic entities or complex communication paths (e.g., paths through multiple communication networks), using such communications to collect information may be complex and/or may require that large amounts of data be collected and provided to the data platform. In addition, for such a cloud environment, joining related instances of collected data and/or attributing the collected data to appropriate entities may be complex and/or may require significant data storage and computing resources.
As described herein, agents may be configured to transform collected data in one or more ways that may reduce the complexities and/or resource demands associated with collecting, providing, and/or processing data, including by reducing the complexities and/or resource demands associated with joining related instances of collected data together and/or attributing collected data to appropriate entities. In some examples, the transformations may be used to reduce the amount of data provided from the agents to the data platform. Additionally or alternatively, in some examples, the transformations may reduce the resources required by the data platform to attribute collected data to appropriate entities and/or to join related instances of collected data. For example, the transformed data may be used by the data platform to generate user interface content such as alerts or polygraphs more efficiently and/or accurately. These and/or other benefits that may be provided by systems and methods described herein will be made apparent by the description herein.
For further explanation, FIG. 5A illustrates a container system 500 that may be deployed in a cloud environment. As shown, the container system 500 may include a cluster 502 of nodes 504 (e.g., node 504-A referred to as “node A” and node 504-B referred to as “node B”) that host containers 506 (e.g., container 506-A-1 and container 506-A-2 hosted on node A, and container 506-B-1 and container 506-A-1 hosted on node B).
The nodes 504 may include physical and/or virtual compute devices configured to run instances of the containers 506. The nodes 504 may be configured to run instances of the containers 506 in any suitable way, including in any of the ways described herein. In some embodiments, the nodes 504 may include any of the example nodes described above.
The containers 506 may include container images and/or executing instances of the container images on the nodes 504. For example, a container image may include executable code of an application and any dependencies, libraries, network interfaces, network configurations, and/or other resources to be used by the executable code when executed. An executing container may share a kernel of an operating system of a node 504 and execute in an isolated environment in the operating system of the node 504. The containers 506 may be dynamic in that instances of the containers 506 may be started up, run, and stopped dynamically as governed by a container orchestration system such as Kubernetes or any other suitable orchestration system operating in the container system 500.
The executing containers 506 may send and receive communications by way of one or more communication networks 508. The communications may be between the containers 506, from non-container entities to the containers 506, from the containers 506 to non-container entities, from external entities outside of the cluster 502 to the containers 506 in the cluster 502, and from the containers 506 to external entities outside of the cluster 502, for example. FIG. 5A illustrates an example communication path 510 from the container 506-A-1 on node A to the container 506-B-1 on node B. The communication path 510 may traverse one or more of the communication networks 508.
The communication networks 508 may include any set and/or configuration of one or more networks configured to facilitate communication with entities in the cluster 502, including communications with the nodes 504 and/or the containers 506 in the cluster 502. In certain embodiments, the communication networks 508 may include one or more host networks configured to facilitate communications with the nodes 504 in the cluster 502. Additionally or alternatively, the communication networks 508 may include one or more container networks configured to facilitate communications with the containers 506 in the cluster 502, such as one or more of a pod network, a service network, and a load-balancing network.
In some embodiments, the pods 514 may be logical wrapper entities for the containers 506. A pod may be an execution entity and may provide one or more resources for use by a container in the pod. In certain implementations, the pods 514 may be created, deployed, and managed by a container orchestration system such as Kubernetes. The orchestration system may provide unique addresses for the pods 514, such as pod IP addresses that may be used for addressing the pods and sending communications to and from the pods 514.
The pod network 516 may be provided by a container orchestration system such as Kubernetes and may support communications with the pods 514 using the unique addresses of the pods 514. For example, the pod network 516 may be configured to use the unique pod IP addresses of the pods 514 to route communications to the appropriate pods 514 in the cluster 502. In some implementations, the pod network 516 may be configured on top of a host network.
The service network 518 may be provided by a container orchestration system such as Kubernetes and may support communications using unique service addresses that are exposed by the service network 518, such as unique service IP addresses. A service IP address may be defined to be associated with one or more pod IP addresses, and the service network 518 may be configured to map the service IP address of a data packet to an associated pod IP addresses. The pod network 516 may then use the pod IP address to route the data packet to the pod having the pod IP address. The service network 518 may be configured as a load balancer on top of the pod network 518 in some implementations.
The container system 500 or 512 may provide one or more interfaces between entities of the cluster 502 and the communication networks of the cluster 502. For example, the interfaces may be provided between pods, the pod network 516, the service network 518, a host network, the nodes 504, and any other elements on the nodes 504. To illustrate, the container system 512 of FIG. 5B may implement one or more container network interfaces (CNIs), such as one or more CNI plugins, to connect containers/pods with communication networks. A CNI plugin may insert a network interface into a container network namespace, such as with a virtual ethernet pair, to provide a container/pod with a network interface. Any suitable CNI may be used, including CNIs provided by EKS, Weavent, Calico, Cilium, Flannel, kubenet, GKE, etc.
In certain embodiments, an agent 522 deployed on a node 504 may monitor one or more communication interfaces on the node 504 for data packets traversing the interfaces and obtain data packets that traverse the interfaces by obtaining copies of the data packets. The agent 522 may be configured to transform at least some of the obtained data packets, such as by replacing a non-endpoint address included in a data packet with an endpoint address. Based on the transformed data packet, the agent 522 may provide information to the data platform. Because the provided information is based on the transformed data packet, the information may be more useable by the data platform than if the information was based on the non-transformed data packet. For example, the information may be configured for more efficient attribution or joining by the data platform. Additionally or alternatively, by providing information based on the transformed data packet, the agent 522 may be able to provide a lower overall amount of data to the data platform than if the information was based on the non-transformed data packet.
To illustrate an example, FIG. 6 shows an example configuration 600 for monitoring a container system in a cloud environment. In the example shown in FIG. 6 , a communication travels from a pod 514-A referred to as “pod A” to a pod 514-B referred to as “pod B.” Pod A may output a data packet 602 that includes a source address and a destination address. The source address may be an endpoint address such as a pod IP address of pod A (“PA”), and the destination address may be a non-endpoint address such as a service IP address (“SB”). The service network 518, such as a service proxy, may receive the data packet 602 and map the service IP address in the data packet 602 to an endpoint address such as a pod IP address for Pod B. The service network 518 may route the data packet to the pod network 516, as is illustrated in FIG. 6 by a path of a data packet 604 from the service network 518 to the pod network 516. In some embodiments, the data packet 604 may be a modified version of the data packet 602 in which the destination address has been changed from the service IP address (“SB”) to the pod IP address for pod B (“PB”). The pod network 516 may use the pod IP address for pod B to route the data packet 604 to pod B on node B.
The agent 522 on node A may obtain the data packet 602 from a network interface of pod A, which means that that the agent 522 on node A obtains a copy of the data packet 602 from the network interface of pod A. The agent 522 on node A may also obtain the data packet 604 from one or more other network interfaces on node A, which means that that the agent 522 on node A obtains a copy of the data packet 604 from the one or more other network interfaces on node A. For example, FIG. 6 shows the agent 522 obtaining data packet 602-C, which is a copy of data packet 602, from the network interface of pod A, as well as the agent 522 obtaining copies of the data packet 604, which copies are labeled as data packets 604-C, from an interface associated with the service network 518 and an interface associated with the pod network 516.
The agent 522 on node A may determine that the obtained data packet 602-C includes an endpoint source address (pod IP address “PA”) and a non-endpoint destination address (service IP address “SB”). The agent 522 may determine, based on the non-endpoint destination address and routing information associated with the data packet 602-C, an endpoint destination address associated with the non-endpoint destination address of the data packet 602-C.
The agent 522 may use any suitable routing information associated with the data packet 602-C to determine an endpoint destination address associated with the non-endpoint destination address included in the data packet 602-C. For example, the agent 522 may access and use information associated with the data packet 604 or the data packet 604-C to determine that the non-endpoint destination address in the data packet 602 has been routed to the endpoint destination address. For instance, the agent 522 may determine that the data packet 604-C is associated with the data packet 602-C (e.g., is a version of the data packet 602-C after being processed by the service network 518), identify the destination address in the data packet 604-C, and determine that the destination address in the data packet 604-C is the endpoint destination address for the non-endpoint destination address in the data packet 602-C. As another example, the agent 522 may access and use information in the kernel of the operating system of node A to determine an endpoint destination address associated with the non-endpoint destination address included in the data packet 602-C.
The agent 522 may modify the data packet 602-C by replacing the non-endpoint destination address with the determined endpoint destination address. For example, the non-endpoint service IP destination address in the data packet 602-C may be replaced by the determined endpoint pod IP destination address. The agent 522 may modify the destination address in the data packet 602-C in any suitable way, including by rewriting a portion of the data packet 602-C, such as a header portion, a tuple, or any other portion of the data packet 602-C. The modified version of the data packet 602-C is represented as modified data packet 602-M in FIG. 6 .
In certain implementations, the agent 522 may be configured to modify a data packet based at least in part on where the data packet is captured by the agent 522. For example, the modification of the data packet 602-C described above may be performed by the agent 522 based on the data packet 602-C being captured from a network interface of a pod and/or based on the data packet 602-C being an outgoing data packet from a network interface of a pod.
Based on the modified data packet, the agent 522 may provide information to a data platform. The information may be provided in any suitable form and may indicate the endpoint source and destination addresses of the modified data packet 602-M. In some implementations, the information provided to the data platform may include the modified data packet 602-M.
The data platform may use the information received from the agent 522 on node A to attribute the data packet 602-C to appropriate endpoints, which in this example are pod A on node A and pod B on node B. Because the information received by the data platform from the agent 522 is based on a modification of the data packet 602-C, the data platform may more efficiently and/or accurately attribute the data packet 602-C to the appropriate endpoints without having to process additional information about other data packets such as data packet 604-C to determine the attribution. Accordingly, in some implementations, the agent 522 may forego providing information about the data packets 604-C to the data platform (and/or other data packets captured at other interfaces along the network stack), which may conserve network, storage, and/or processing resources of the data platform.
Additionally or alternatively, the data platform may use the information received from the agent 522 on node A to join the data packet 602-C to information received from the agent 522 on node B. For example, the agent 522 on node B may provide, to the data platform, information about the data packet 604 received by pod B on node B. In some examples, the information may include a copy of the data packet 604. The data platform may use the matching endpoint addresses of the data packets received from the agent 522 on node A and from the agent 522 on node B to match and join the data packets as related to a same communication.
In some embodiments, the agent 522 and/or the data platform may be configured to transform a connection tuple of a data packet to support matching and joining data packets received from different agents 522 on different nodes. By changing the connection tuple, content of related data packets received by the data platform from different agents on different nodes may be brought into sync and may support joining of information about the data packets by the data platform.
An agent 522 on node A may obtain the data packet 708 from a network interface of pod A, which means that that the agent 522 on node A obtains a copy of the data packet 708 from the network interface of pod A. The agent 522 obtaining a copy of the data packet 708 is illustrated by data packet 708-C, which is a copy of the data packet 708, being obtained by the agent 522 from pod A. The agent 522 on node A may provide information associated with the data packet 708-C to a data platform, which in some embodiments may include providing the data packet 708-C to the data platform as shown in FIG. 7 .
An agent 522 on load balancer A may obtain the data packet 704 from a network interface of load balancer A, which means that that the agent 522 on load balancer A obtains a copy of the data packet 704 from the network interface of load balancer A. The agent 522 on load balancer A obtaining a copy of the data packet 704 is illustrated by data packet 704-C, which is a copy of the data packet 704, being obtained by the agent 522 from the network interface of load balancer A.
The agent 522 on load balancer A may determine that the obtained data packet 704-C includes a non-endpoint destination address (node IP address “NA”). The agent 522 may determine, based on the non-endpoint destination address and routing information associated with the data packet 704-C, an endpoint destination address associated with the non-endpoint destination address of the data packet 704-C.
The agent 522 may use any suitable routing information associated with the data packet 704-C to determine an endpoint destination address associated with the non-endpoint destination address included in the data packet 704-C. For example, the agent 522 may access and use information associated with the data packet 708 or the data packet 708-C to determine that the non-endpoint destination address in the data packet 704 has been routed to the endpoint destination address. For instance, the agent 522 may determine, from the network interface 706 of node A that the data packet 704 has been routed to pod A.
The agent 522 on load balancer A may modify the data packet 704-C by replacing the non-endpoint destination address with the determined endpoint destination address. For example, the non-endpoint node IP destination address in the data packet 704-C may be replaced by the determined endpoint pod IP destination address. The agent 522 may modify the destination address in the data packet 704-C in any suitable way, including by rewriting a portion of the data packet 704-C, such as a header portion, a tuple, or any other portion of the data packet 704-C. The modified version of the data packet 704-C is represented as modified data packet 704-M in FIG. 7 .
Based on the modified data packet, the agent 522 on load balancer A may provide information to the data platform. The information may be provided in any suitable form and may indicate the endpoint source and destination addresses of the modified data packet 704-M. In some implementations, the information provided to the data platform may include the modified data packet 704-M.
The data platform may use the information received from the agent 522 on load balancer A to attribute the data packet 704-C to an appropriate endpoint, which in this example includes and endpoint destination of pod A on node A. Because the information received by the data platform from the agent 522 is based on a modification of the data packet 704-C, the data platform may more efficiently and/or accurately attribute the data packet 704-C to an appropriate endpoint without having to process additional information about other data packets such as data packet 708-C to determine the attribution.
Additionally or alternatively, the data platform may use the information received from the agent 522 on node A and the agent 522 on load balancer A to join data packets 704-M and 708-C. Because the agent 522 on load balancer A provided information based on the modified data packet 704-M, the data platform may more efficiently join the data packets 704-M and 708-C because they include matching endpoint addresses.
In certain implementations, an agent 522 may be configured to modify a data packet based at least in part on where the data packet is captured by the agent 522. As an example, the modification of the data packet 602-C described above may be performed by the agent 522 based on the data packet 602-C being captured from a network interface of a pod and/or based on the data packet 602-C being an outgoing data packet from a network interface of a pod. As another example, the modification of the data packet 704-C described above may be performed by the agent 522 based on the data packet 704-C being captured from a network interface of a load balancer and/or based on the data packet 704-C being an outgoing data packet from network interface of a load balancer.
At operation 802, an agent monitoring a cloud compute environment obtains a data packet from an interface in the cloud compute environment. Operation 802 may be performed in any of the ways described herein to obtain a copy of the data packet. The data packet may include a source address and a destination address. In certain examples, at least one of the addresses may be a non-endpoint address. The non-endpoint address may be any intermediate address along a communication path that is not an endpoint address (e.g., an address of a container or a pod) for the communication. For example, the non-endpoint address may be a service IP address or a node IP address.
At operation 804, the agent determines an endpoint address associated with the non-endpoint address in the data packet. Operation 804 may be performed in any of the ways described herein, or in any other suitable way.
At operation 806, the agent modifies the data packet by replacing the non-endpoint address with the endpoint address. Operation 806 may be performed in any of the ways described herein.
At operation 808, the agent provided monitoring data to a data platform based on the modified data packet. Operation 808 may be performed in any of the ways described herein. The monitoring data may include any information associated with the modified data packet. In some examples, the monitoring data may include the modified data packet, or at least the source and destination addresses included in the modified data packet.
The data platform (e.g., one or more computing devices of the data platform) may receive the monitoring data from the agent, as well as additional monitoring data from one or more other agents monitoring the cloud compute environment. The data platform may use the received monitoring data to perform one or more data platform operations, which may include storing the monitoring data, processing the monitoring data (e.g., analyzing the monitoring data), and generating content based on the processing of the monitoring data. For example, the data platform may generate and provide user interface content such as one or more alerts and/or multidimensional graphs (e.g., polygraphs) based on the monitoring data that includes information that is based one or more data packets that have been transformed by the agent (and additional agents) in any of the ways described herein.
Claims (20)
1. A method comprising:
obtaining, by an agent monitoring a cloud compute environment, a data packet from an interface of a pod managed by a container orchestration system in the cloud compute environment, the data packet including a source address and a non-endpoint destination address;
determining, by the agent and based on the non-endpoint destination address and routing information for the data packet, an endpoint destination address associated with the non-endpoint destination address of the data packet;
modifying, by the agent, the data packet by replacing the non-endpoint destination address with the endpoint destination address; and
providing, by the agent and based on the modified data packet, monitoring data to a data platform.
2. The method of claim 1 , wherein the source address comprises an IP address of a container in the cloud compute environment.
3. The method of claim 1 , wherein the source address comprises a pod IP address for the pod, the pod including a container.
4. The method of claim 1 , wherein the non-endpoint destination address comprises a service IP address associated with a service network in the cloud compute environment.
5. The method of claim 1 , wherein the non-endpoint destination address comprises a host IP address associated with a host network in the cloud compute environment.
6. The method of claim 1 , further comprising:
obtaining, by a second agent monitoring the cloud compute environment, a second data packet from a second interface in the cloud compute environment, the second data packet including a second source address and a second non-endpoint destination address;
determining, by the second agent and based on the second non-endpoint destination address and routing information for the second data packet, that the endpoint destination address is associated with the second non-endpoint destination address of the second data packet;
modifying, by the second agent, the second data packet by replacing the second non-endpoint destination address with the endpoint destination address; and
providing, by the second agent and based on the modified second data packet, second monitoring data to the data platform.
7. The method of claim 1 , further comprising:
receiving, at the data platform, the monitoring data; and
generating a polygraph based at least in part on the monitoring data.
8. A computer program product embodied in a non-transitory computer-readable medium and comprising computer instructions for:
obtaining a data packet from an interface of a pod managed by a container orchestration system in a cloud compute environment, the data packet including a source address and a non-endpoint destination address;
determining, based on the non-endpoint destination address and routing information for the data packet, an endpoint destination address associated with the non-endpoint destination address of the data packet;
modifying the data packet by replacing the non-endpoint destination address with the endpoint destination address; and
providing, based on the modified data packet, monitoring data to a data platform.
9. The computer program product of claim 8 , wherein the source address comprises an IP address of a container in the cloud compute environment.
10. The computer program product of claim 8 , wherein the source address comprises a pod IP address for the pod, the pod including a container.
11. The computer program product of claim 8 , wherein the non-endpoint destination address comprises a service IP address associated with a service network in the cloud compute environment.
12. The computer program product of claim 8 , wherein the non-endpoint destination address comprises a host IP address associated with a host network in the cloud compute environment.
13. The computer program product of claim 8 , the computer instructions further for:
obtaining a second data packet from a second interface in the cloud compute environment, the second data packet including a second source address and a second non-endpoint destination address;
determining, based on the second non-endpoint destination address and routing information for the second data packet, that the endpoint destination address is associated with the second non-endpoint destination address of the second data packet;
modifying the second data packet by replacing the second non-endpoint destination address with the endpoint destination address; and
providing, based on the modified second data packet, second monitoring data to the data platform.
14. The computer program product of claim 13 , wherein:
the source address is an endpoint source address; and
the second source address in a non-endpoint source address.
15. A system for monitoring a cloud compute environment, the system comprising:
a memory storing computer-executable instructions;
a processor to execute the computer-executable instructions to:
obtain a data packet from an interface of a pod managed by a container orchestration system in the cloud compute environment, the data packet including a source address and a non-endpoint destination address;
determine, based on the non-endpoint destination address and routing information for the data packet, an endpoint destination address associated with the non-endpoint destination address of the data packet;
modify the data packet by replacing the non-endpoint destination address with the endpoint destination address; and
provide, based on the modified data packet, monitoring data to a data platform.
16. The system of claim 15 , wherein the source address comprises an IP address of a container in the cloud compute environment.
17. The system of claim 15 , wherein the source address comprises a pod IP address for the pod, the pod including a container.
18. The system of claim 15 , wherein the non-endpoint destination address comprises a service IP address associated with a service network in the cloud compute environment.
19. The system of claim 15 , wherein the non-endpoint destination address comprises a host IP address associated with a host network in the cloud compute environment.
20. The system of claim 15 , wherein:
the non-endpoint destination address comprises a service IP address associated with a service network in the cloud compute environment; and
the endpoint destination address comprises a pod IP address associated with a second pod in the cloud compute environment.
Priority Applications (1)
| Application Number | Priority Date | Filing Date | Title |
|---|---|---|---|
| US17/589,361 US11792284B1 (en) | 2017-11-27 | 2022-01-31 | Using data transformations for monitoring a cloud compute environment |
Applications Claiming Priority (7)
| Application Number | Priority Date | Filing Date | Title |
|---|---|---|---|
| US201762590986P | 2017-11-27 | 2017-11-27 | |
| US201862650971P | 2018-03-30 | 2018-03-30 | |
| US16/134,794 US10581891B1 (en) | 2017-11-27 | 2018-09-18 | Using graph-based models to identify datacenter anomalies |
| US16/665,961 US11153339B1 (en) | 2017-11-27 | 2019-10-28 | Using graph-based models to identify datacenter anomalies |
| US202163231661P | 2021-08-10 | 2021-08-10 | |
| US17/504,311 US11677772B1 (en) | 2017-11-27 | 2021-10-18 | Using graph-based models to identify anomalies in a network environment |
| US17/589,361 US11792284B1 (en) | 2017-11-27 | 2022-01-31 | Using data transformations for monitoring a cloud compute environment |
Related Parent Applications (1)
| Application Number | Title | Priority Date | Filing Date |
|---|---|---|---|
| US17/504,311 Continuation-In-Part US11677772B1 (en) | 2017-11-27 | 2021-10-18 | Using graph-based models to identify anomalies in a network environment |
Publications (1)
| Publication Number | Publication Date |
|---|---|
| US11792284B1 true US11792284B1 (en) | 2023-10-17 |
Family
ID=88309473
Family Applications (1)
| Application Number | Title | Priority Date | Filing Date |
|---|---|---|---|
| US17/589,361 Active US11792284B1 (en) | 2017-11-27 | 2022-01-31 | Using data transformations for monitoring a cloud compute environment |
Country Status (1)
| Country | Link |
|---|---|
| US (1) | US11792284B1 (en) |
Cited By (7)
| Publication number | Priority date | Publication date | Assignee | Title |
|---|---|---|---|---|
| US20220131880A1 (en) * | 2020-10-27 | 2022-04-28 | Level 3 Communications, Llc | Autonomous network security scaling |
| US20230275912A1 (en) * | 2022-02-25 | 2023-08-31 | Microsoft Technology Licensing, Llc | Graph-based analysis of security incidents |
| US20230283595A1 (en) * | 2021-06-28 | 2023-09-07 | Cisco Technology, Inc. | Dynamic proxy response from application container |
| US20230336554A1 (en) * | 2022-04-13 | 2023-10-19 | Wiz, Inc. | Techniques for analyzing external exposure in cloud environments |
| US20230336550A1 (en) * | 2022-04-13 | 2023-10-19 | Wiz, Inc. | Techniques for detecting resources without authentication using exposure analysis |
| US20230336578A1 (en) * | 2022-04-13 | 2023-10-19 | Wiz, Inc. | Techniques for active inspection of vulnerability exploitation using exposure analysis |
| US20240039914A1 (en) * | 2020-06-29 | 2024-02-01 | Cyral Inc. | Non-in line data monitoring and security services |
Citations (272)
| Publication number | Priority date | Publication date | Assignee | Title |
|---|---|---|---|---|
| US5584024A (en) | 1994-03-24 | 1996-12-10 | Software Ag | Interactive database query system and method for prohibiting the selection of semantically incorrect query parameters |
| US5806062A (en) | 1995-10-17 | 1998-09-08 | Lucent Technologies Inc. | Data analysis system using virtual databases |
| US6347339B1 (en) | 1998-12-01 | 2002-02-12 | Cisco Technology, Inc. | Detecting an active network node using a login attempt |
| US6363411B1 (en) | 1998-08-05 | 2002-03-26 | Mci Worldcom, Inc. | Intelligent network |
| US20020059531A1 (en) | 2000-11-16 | 2002-05-16 | Lai On Warren Kwan | Integrated tracking of multi-authentication among web services |
| US6434663B1 (en) | 1996-09-06 | 2002-08-13 | Intel Corporation | Disk block allocation optimization methodology with accommodation for file system cluster size greater than operating system memory page size |
| US20020161889A1 (en) | 1999-03-26 | 2002-10-31 | Rod Gamache | Method and system for consistent cluster operational data in a server cluster using a quorum of replicas |
| US20020184225A1 (en) | 2001-05-31 | 2002-12-05 | Hovhannes Ghukasyan | Automatic generation of join graphs for relational database queries |
| US20030037136A1 (en) | 2001-06-27 | 2003-02-20 | Labovitz Craig H. | Method and system for monitoring control signal traffic over a computer network |
| US20030179227A1 (en) | 2001-10-05 | 2003-09-25 | Farhan Ahmad | Methods and apparatus for launching device specific applications on storage area network components |
| US20030233361A1 (en) | 2002-06-13 | 2003-12-18 | Cady C. Conrad | Resumption of user authentication and restoration of interrupted virtual sessions in a stateless network |
| US20040015470A1 (en) | 2002-07-20 | 2004-01-22 | Smith Michael David | Dynamic filtering in a database system |
| US20050060287A1 (en) | 2003-05-16 | 2005-03-17 | Hellman Ziv Z. | System and method for automatic clustering, sub-clustering and cluster hierarchization of search results in cross-referenced databases using articulation nodes |
| US20050102284A1 (en) | 2003-11-10 | 2005-05-12 | Chandramouli Srinivasan | Dynamic graphical user interface and query logic SQL generator used for developing Web-based database applications |
| US20050102365A1 (en) | 2003-11-06 | 2005-05-12 | International Business Machines Corporation | Method and system for multiple instant messaging login sessions |
| US20050108142A1 (en) | 2003-11-18 | 2005-05-19 | Espeed, Inc. | System and method for managing relationships between brokers and traders |
| US20050188222A1 (en) | 2004-02-24 | 2005-08-25 | Covelight Systems, Inc. | Methods, systems and computer program products for monitoring user login activity for a server application |
| US20050231760A1 (en) | 2004-04-09 | 2005-10-20 | Junichi Minato | Information processing apparatus allowing multiple logins |
| US20050246288A1 (en) | 2004-04-28 | 2005-11-03 | Hitachi, Ltd. | Session information preserving system and method therefor |
| US20060085437A1 (en) | 2004-10-14 | 2006-04-20 | International Business Machines Corporation | Management of relationships between database tables |
| US20060090095A1 (en) | 1999-03-26 | 2006-04-27 | Microsoft Corporation | Consistent cluster operational data in a server cluster using a quorum of replicas |
| US7054873B2 (en) | 1999-05-04 | 2006-05-30 | Telefonaktiebolaget Lm Ericsson (Publ) | Telecommunications network resource handling arrangement and method |
| US20060259470A1 (en) | 2005-05-11 | 2006-11-16 | Sivakumar Chandrasekharan | Apparatus, system, and method for map definition generation |
| US20060288415A1 (en) | 2005-06-16 | 2006-12-21 | Chung Shan Institute Of Science And Technology | Method of detecting network worms |
| US20070050497A1 (en) | 2005-08-29 | 2007-03-01 | Haley Michael R | System and method for detecting status changes in a network using virtual coordinate mapping |
| US20070118909A1 (en) | 2005-11-18 | 2007-05-24 | Nexthink Sa | Method for the detection and visualization of anomalous behaviors in a computer network |
| US20070130330A1 (en) | 2005-11-15 | 2007-06-07 | Aternity Information Systems Ltd. | System for inventing computer systems and alerting users of faults to systems for monitoring |
| US20070162963A1 (en) | 2006-01-10 | 2007-07-12 | Alcatel Lucent | Method of providing a centralised login |
| US20070162605A1 (en) | 2006-01-07 | 2007-07-12 | Chalasani Nanchariah R | Distributed instant messaging |
| US20070168696A1 (en) | 2005-11-15 | 2007-07-19 | Aternity Information Systems, Ltd. | System for inventing computer systems and alerting users of faults |
| US20070169175A1 (en) | 2006-01-18 | 2007-07-19 | Hall Kylene J | Killing login-based sessions with a single action |
| US20070225956A1 (en) | 2006-03-27 | 2007-09-27 | Dexter Roydon Pratt | Causal analysis in complex biological systems |
| US20070266425A1 (en) | 2006-05-15 | 2007-11-15 | Lg Electronics Inc. | Method for enabling login and establishing session for wireless communication terminal |
| US7310733B1 (en) | 2001-01-29 | 2007-12-18 | Ebay Inc. | Method and system for maintaining login preference information of users in a network-based transaction facility |
| US20080034411A1 (en) | 2006-08-03 | 2008-02-07 | Fujitsu Limited | Login administration method and server |
| US20080065879A1 (en) | 2005-05-31 | 2008-03-13 | Nhn Corporation | Method and system for detecting concurrent logins |
| US20080148180A1 (en) | 2006-12-14 | 2008-06-19 | Microsoft Corporation | Detecting Anomalies in Server Behavior |
| US20080151893A1 (en) | 2006-12-20 | 2008-06-26 | Sun Microsystems, Inc. | Method and system for virtual routing using containers |
| US20080155335A1 (en) | 2006-12-20 | 2008-06-26 | Udo Klein | Graphical analysis to detect process object anomalies |
| US20080244718A1 (en) | 2007-03-30 | 2008-10-02 | Simon Frost | Systems and Methods for User Login |
| US20080263643A1 (en) | 2007-04-19 | 2008-10-23 | International Business Machines Corporation | Method and system for password application |
| US20080270451A1 (en) | 2007-04-24 | 2008-10-30 | Interse A/S | System and Method of Generating a Metadata Model for Use in Classifying and Searching for Information Objects Maintained in Heterogeneous Data Stores |
| US20090019160A1 (en) | 2007-07-12 | 2009-01-15 | International Business Machines Corporation | Method and system for workload management utilizing tcp/ip and operating system data |
| US20090165109A1 (en) | 2005-07-21 | 2009-06-25 | Arcot Systems, Inc. | Controlled and client-side authentication module |
| US20090222740A1 (en) | 2003-07-11 | 2009-09-03 | Computer Associates Think, Inc. | System and method for synchronizing login processes |
| US20090228474A1 (en) | 2007-11-01 | 2009-09-10 | Chi-Hsien Chiu | Analyzing event streams of user sessions |
| US20090271504A1 (en) | 2003-06-09 | 2009-10-29 | Andrew Francis Ginter | Techniques for agent configuration |
| US20090287720A1 (en) | 2008-05-15 | 2009-11-19 | Oracle International Corp | Cluster health indicator with dynamic load correlation |
| US20100094767A1 (en) | 2008-06-12 | 2010-04-15 | Tom Miltonberger | Modeling Users for Fraud Detection and Analysis |
| US20100114931A1 (en) | 2008-10-21 | 2010-05-06 | Microsoft Corporation | Facet, logic and textual-based query composer |
| US20100172261A1 (en) | 2007-09-04 | 2010-07-08 | Hiroyuki Shinbo | Information collection device, communication error detection device, and computer program |
| US20100217860A1 (en) | 2009-02-24 | 2010-08-26 | Telcordia Technologies, Inc. | Systems and methods for single session management in load balanced application server clusters |
| US20100274785A1 (en) | 2009-04-24 | 2010-10-28 | At&T Intellectual Property I, L.P. | Database Analysis Using Clusters |
| US20100309206A1 (en) | 2009-06-04 | 2010-12-09 | Microsoft Corporation | Graph scalability |
| US7856544B2 (en) | 2008-08-18 | 2010-12-21 | International Business Machines Corporation | Stream processing in super node clusters of processors assigned with stream computation graph kernels and coupled by stream traffic optical links |
| US20100329162A1 (en) | 2009-06-29 | 2010-12-30 | Qualcomm, Incorporated | Method and apparatus for radio filtering in a multi-radio device |
| US20110029952A1 (en) | 2009-07-31 | 2011-02-03 | Xerox Corporation | Method and system for constructing a document redundancy graph |
| US20110055138A1 (en) | 2009-08-27 | 2011-03-03 | Vaibhav Khanduja | Method and system for processing network activity data |
| US20110302631A1 (en) | 2010-06-07 | 2011-12-08 | Salesforce.Com, Inc. | Systems and methods for logging into an application on a second domain from a first domain in a multi-tenant database system environment |
| US20120005243A1 (en) | 2010-07-02 | 2012-01-05 | At&T Intellectual Property I, Lp | Operating a Network Using Relational Database Methodology |
| US8103906B1 (en) | 2010-10-01 | 2012-01-24 | Massoud Alibakhsh | System and method for providing total real-time redundancy for a plurality of client-server systems |
| US8122122B1 (en) | 2005-11-08 | 2012-02-21 | Raytheon Oakley Systems, Inc. | Event monitoring and collection |
| US20120054732A1 (en) | 2010-08-24 | 2012-03-01 | Oracle International Corporation | Reducing downtime while patching binaries on a cluster |
| US20120089875A1 (en) | 2010-10-07 | 2012-04-12 | Microsoft Corporation | Multi-user test framework |
| US20120102029A1 (en) | 2010-10-25 | 2012-04-26 | Ab Initio Technology Llc | Managing data set objects |
| US20120158858A1 (en) | 2010-12-16 | 2012-06-21 | Microsoft Corporation | Resource Optimization for Online Services |
| US20120173541A1 (en) | 2010-12-30 | 2012-07-05 | Venkateshwaran Venkataramani | Distributed Cache for Graph Data |
| US8276197B1 (en) | 2006-09-29 | 2012-09-25 | Sprint Communications Company L.P. | Cascading network login |
| US20120317151A1 (en) | 2011-06-09 | 2012-12-13 | Thomas Walter Ruf | Model-Based Method for Managing Information Derived From Network Traffic |
| US20120317149A1 (en) | 2011-06-09 | 2012-12-13 | Salesforce.Com, Inc. | Methods and systems for processing graphs using distributed memory and set operations |
| US20120323956A1 (en) | 2011-06-16 | 2012-12-20 | Microsoft Corporation | Composable SQL Query Generation |
| US8341711B1 (en) | 2004-08-24 | 2012-12-25 | Whitehat Security, Inc. | Automated login session extender for use in security analysis systems |
| US8359584B2 (en) | 2009-12-18 | 2013-01-22 | Microsoft Corporation | Debugging from a call graph |
| US20130067100A1 (en) | 2011-09-12 | 2013-03-14 | Microsoft Corporation | Multi-desktop interaction using nested remote desktop sessions |
| US20130081118A1 (en) | 2011-09-23 | 2013-03-28 | Canon U.S.A., Inc. | Method, system, and computer-readable storage medium for establishing a login session |
| US20130086667A1 (en) | 2011-10-04 | 2013-04-04 | Salesforce.Com, Inc. | Method and system for providing login as a service |
| US20130097320A1 (en) | 2011-10-14 | 2013-04-18 | Sap Ag | Business Network Access Protocol for the Business Network |
| US8443442B2 (en) | 2006-01-31 | 2013-05-14 | The Penn State Research Foundation | Signature-free buffer overflow attack blocker |
| US20130173915A1 (en) | 2011-12-28 | 2013-07-04 | Pitney Bowes Inc. | System and method for secure nework login |
| US20130205357A1 (en) | 2005-08-04 | 2013-08-08 | General Instrument Corporation | Ip multicast management and service provision system and method |
| US20130219295A1 (en) | 2007-09-19 | 2013-08-22 | Michael R. Feldman | Multimedia system and associated methods |
| US20130269007A1 (en) | 2010-12-16 | 2013-10-10 | Nec Software Kyushu, Ltd. | Authentication system, authentication server, service providing server, authentication method, and computer-readable recording medium |
| US20130304915A1 (en) | 2011-01-17 | 2013-11-14 | Nec Corporation | Network system, controller, switch and traffic monitoring method |
| US8595262B1 (en) | 2012-03-29 | 2013-11-26 | Amazon Technologies, Inc. | Resource resolution in computing environments using directed graphs |
| US8607306B1 (en) | 2010-11-10 | 2013-12-10 | Google Inc. | Background auto-submit of login credentials |
| US20140041005A1 (en) | 2012-07-18 | 2014-02-06 | Tencent Technology (Shenzhen) Company Limited | Method and system of login authentication |
| US8671453B2 (en) | 2010-08-17 | 2014-03-11 | Facebook, Inc. | Social age verification engine |
| US20140098101A1 (en) | 2012-10-10 | 2014-04-10 | International Business Machines Corporation | Node cluster relationships in a graph database |
| US20140115001A1 (en) | 2012-10-19 | 2014-04-24 | Playence GmBH | Structured query generation |
| US20140115011A1 (en) | 2012-10-22 | 2014-04-24 | Allaquaria, LLC dba Quality Marine | Ornamental organism tracking and information system |
| US20140181944A1 (en) | 2012-12-26 | 2014-06-26 | Cellco Partnership D/B/A Verizon Wireless | Single sign-on for a native application and a web application on a mobile device |
| US20140208191A1 (en) | 2013-01-18 | 2014-07-24 | Microsoft Corporation | Grouping Fixed Format Document Elements to Preserve Graphical Data Semantics After Reflow |
| US20140245443A1 (en) | 2013-02-27 | 2014-08-28 | Sayan Chakraborty | Cyber Defense Systems And Methods |
| US8826403B2 (en) | 2012-02-01 | 2014-09-02 | International Business Machines Corporation | Service compliance enforcement using user activity monitoring and work request verification |
| US20140280068A1 (en) | 2013-03-15 | 2014-09-18 | Bmc Software, Inc. | Adaptive learning of effective troubleshooting patterns |
| US8862524B2 (en) | 2012-08-01 | 2014-10-14 | Yahoo! Inc. | System and method for identifying abusive account registration |
| US20140359558A1 (en) | 2013-06-02 | 2014-12-04 | Mark Spencer Chamberlain | System and methods for end-users to graphically program and manage computers and devices |
| US20140379716A1 (en) | 2013-06-25 | 2014-12-25 | International Business Machines Corporation | Process-Aware Code Migration |
| US20150058619A1 (en) | 2011-08-09 | 2015-02-26 | CloudPassage, Inc. | Systems and methods for implementing computer security |
| US9021583B2 (en) | 2010-01-26 | 2015-04-28 | Emc Corporation | System and method for network security including detection of man-in-the-browser attacks |
| US20150135312A1 (en) | 2012-08-31 | 2015-05-14 | Hitachi, Ltd. | Service performance monitoring method |
| US9037273B2 (en) | 2009-04-20 | 2015-05-19 | Abb Research Ltd. | Operator terminal in a process control system |
| US20150161201A1 (en) | 2009-11-02 | 2015-06-11 | Google Inc. | Clustering query refinements by inferred user intent |
| US20150188751A1 (en) | 2013-12-31 | 2015-07-02 | Cisco Technology, Inc. | Dynamically computing fate sharing in computer networks using learning machines |
| US20150213598A1 (en) | 2014-01-30 | 2015-07-30 | Case Western Reserve University | Spatially Aware Cell Cluster (SPACCL) Graphs |
| US20150341379A1 (en) | 2014-05-22 | 2015-11-26 | Accenture Global Services Limited | Network anomaly detection |
| US20150356144A1 (en) | 2014-06-09 | 2015-12-10 | Cognitive Scale, Inc. | Cognitive Media Content |
| US9225730B1 (en) | 2014-03-19 | 2015-12-29 | Amazon Technologies, Inc. | Graph based detection of anomalous activity |
| US20160063226A1 (en) | 2014-09-03 | 2016-03-03 | Microsoft Corporation | Shared Session Techniques |
| US20160078365A1 (en) | 2014-03-21 | 2016-03-17 | Philippe Baumard | Autonomous detection of incongruous behaviors |
| US20160080404A1 (en) | 2014-09-14 | 2016-03-17 | Cisco Technology, Inc. | Detection of malicious network connections |
| US20160110434A1 (en) | 2014-10-17 | 2016-04-21 | Vmware, Inc. | Method and system that determine whether or not two graph-like representations of two systems describe equivalent systems |
| US9332020B2 (en) | 2006-10-17 | 2016-05-03 | Threatmetrix Pty Ltd | Method for tracking machines on a network using multivariable fingerprinting of passively available information |
| US20160149937A1 (en) | 2014-11-25 | 2016-05-26 | enSilo Ltd. | Systems and methods for malicious code detection |
| US9369450B1 (en) | 2013-12-19 | 2016-06-14 | Ca, Inc. | Methods preserving user identities during login and related systems, devices, and machines |
| US9391978B2 (en) | 2010-05-25 | 2016-07-12 | Novell, Inc. | Multiple access authentication |
| US20160205125A1 (en) | 2015-01-14 | 2016-07-14 | Korea Internet & Security Agency | System and method for analyzing mobile cyber incident |
| US20160218911A1 (en) | 2015-01-26 | 2016-07-28 | CENX, Inc. | Systems and methods for correlating alarms in a network |
| US20160261544A1 (en) | 2015-03-02 | 2016-09-08 | Linkedln Corporation | Increasing interaction between clusters with low connectivity in a social network |
| US20160277355A1 (en) * | 2015-03-18 | 2016-09-22 | Cisco Technology, Inc. | Inter-pod traffic redirection and handling in a multi-pod network environment |
| US20160330206A1 (en) | 2015-05-07 | 2016-11-10 | Alibaba Group Holding Limited | Method, device and server for managing user login sessions |
| US20160330183A1 (en) | 2014-11-13 | 2016-11-10 | Mcafee, Inc. | Conditional login promotion |
| US9516053B1 (en) | 2015-08-31 | 2016-12-06 | Splunk Inc. | Network security threat detection by user/user-entity behavioral analysis |
| US9515999B2 (en) | 2011-12-21 | 2016-12-06 | Ssh Communications Security Oyj | Automated access, key, certificate, and credential management |
| US20160359872A1 (en) | 2015-06-05 | 2016-12-08 | Cisco Technology, Inc. | System for monitoring and managing datacenters |
| US20160359592A1 (en) | 2015-06-05 | 2016-12-08 | Cisco Technology, Inc. | Techniques for determining network anomalies in data center networks |
| US20160373428A1 (en) | 2011-12-22 | 2016-12-22 | Paypal, Inc. | Smart phone login using qr code |
| US9537851B2 (en) | 2014-08-06 | 2017-01-03 | Microsoft Technology Licensing, Llc | Revoking sessions using signaling |
| US9558265B1 (en) | 2016-05-12 | 2017-01-31 | Quid, Inc. | Facilitating targeted analysis via graph generation based on an influencing parameter |
| US9569869B2 (en) | 2014-07-29 | 2017-02-14 | Sap Se | Consolidation and customization of graph-based models |
| US20170063830A1 (en) | 2012-07-19 | 2017-03-02 | Alibaba Group Holding Limited | Method, client, server and system of login verification |
| US9596253B2 (en) | 2014-10-30 | 2017-03-14 | Splunk Inc. | Capture triggers for capturing network data |
| US9596295B2 (en) | 2013-06-29 | 2017-03-14 | Google Inc. | Computing connected components in large graphs |
| US20170076206A1 (en) | 2015-09-16 | 2017-03-16 | International Business Machines Corporation | Cognitive Operations Based on Empirically Constructed Knowledge Graphs |
| US9602526B2 (en) | 2012-11-29 | 2017-03-21 | Beijing Qihoo Technology Company Limited | User login monitoring device and method |
| US9602506B2 (en) | 2014-03-25 | 2017-03-21 | Samsung Electronics Co., Ltd. | Method and apparatus for supporting login through user terminal |
| US20170086069A1 (en) | 2015-09-21 | 2017-03-23 | Lawrence Liu | System and Method of Authentication by Leveraging Mobile Devices for Expediting User Login and Registration Processes Online |
| US20170111245A1 (en) | 2015-10-14 | 2017-04-20 | International Business Machines Corporation | Process traces clustering: a heterogeneous information network approach |
| US9635114B2 (en) * | 2014-01-24 | 2017-04-25 | Netapp, Inc. | Externally initiated application session endpoint migration |
| US20170116315A1 (en) | 2015-10-21 | 2017-04-27 | International Business Machines Corporation | Fast path traversal in a relational database-based graph structure |
| US20170118240A1 (en) | 2015-10-21 | 2017-04-27 | E8 Security, Inc. | Detecting security threats in a local network |
| US9639676B2 (en) | 2012-05-31 | 2017-05-02 | Microsoft Technology Licensing, Llc | Login interface selection for computing environment user login |
| US20170134240A1 (en) | 2014-07-08 | 2017-05-11 | Telefonaktiebolaget Lm Ercisson (Publ) | Network Topology Estimation Based on Event Correlation |
| US9654503B1 (en) | 2015-03-11 | 2017-05-16 | Symantec Corporation | Systems and methods for evaluating networks |
| US9652875B2 (en) | 2012-10-29 | 2017-05-16 | Yahoo! Inc. | Systems and methods for generating a dense graph |
| US9659337B2 (en) | 2010-10-29 | 2017-05-23 | Nhn Corporation | Unified communication system and unified communication method using multi-login, terminal for controlling operation of unified communication tool, and communication method in terminal |
| US20170147646A1 (en) | 2015-11-23 | 2017-05-25 | Sap Se | Conversion of Model Views Into Relational Models |
| US9665660B2 (en) | 2014-03-14 | 2017-05-30 | Xplenty Ltd. | Logical data flow mapping rules for (sub) graph isomorphism in a cluster computing environment |
| US20170163666A1 (en) | 2015-12-07 | 2017-06-08 | Prismo Systems Inc. | Systems and Methods for Detecting and Responding To Security Threats Using Application Execution and Connection Lineage Tracing |
| US9729416B1 (en) | 2016-07-11 | 2017-08-08 | Extrahop Networks, Inc. | Anomaly detection using device relationship graphs |
| US9734040B2 (en) | 2013-05-21 | 2017-08-15 | Microsoft Technology Licensing, Llc | Animated highlights in a graph representing an application |
| US9740744B2 (en) | 2013-07-26 | 2017-08-22 | Helynx, Inc. | Systems and methods for visualizing and manipulating graph databases |
| US9749339B2 (en) | 2015-02-24 | 2017-08-29 | Raytheon Company | Proactive emerging threat detection |
| US20170249069A1 (en) | 2016-02-29 | 2017-08-31 | Vmware, Inc. | Preserving desktop state across login sessions |
| US20170251013A1 (en) | 2016-02-26 | 2017-08-31 | Oracle International Corporation | Techniques for discovering and managing security of applications |
| US9753960B1 (en) | 2013-03-20 | 2017-09-05 | Amdocs Software Systems Limited | System, method, and computer program for dynamically generating a visual representation of a subset of a graph for display, based on search criteria |
| US20170257358A1 (en) | 2016-03-04 | 2017-09-07 | ShoCard, Inc. | Method and System for Authenticated Login Using Static or Dynamic Codes |
| US9760619B1 (en) | 2014-04-29 | 2017-09-12 | Google Inc. | Generating weighted clustering coefficients for a social network graph |
| US20170262521A1 (en) | 2016-03-11 | 2017-09-14 | Linkedin Corporation | Partitioning and replicating data in scalable distributed data stores |
| US20170272344A1 (en) | 2016-03-17 | 2017-09-21 | Nec Laboratories America, Inc. | Real-Time Detection of Abnormal Network Connections in Streaming Data |
| US20170277553A1 (en) | 2016-03-22 | 2017-09-28 | Vmware, Inc. | Anomalous usage of resources by a process in a software defined data center |
| US20170277997A1 (en) | 2016-03-23 | 2017-09-28 | Nec Laboratories America, Inc. | Invariants Modeling and Detection for Heterogeneous Logs |
| US20170279827A1 (en) | 2016-03-24 | 2017-09-28 | Cisco Technology, Inc. | Edge-based detection of new and unexpected flows |
| US9781115B2 (en) | 2013-09-04 | 2017-10-03 | Facebook, Inc. | Systems and methods for authenticating nodes |
| US20170286190A1 (en) | 2016-03-31 | 2017-10-05 | International Business Machines Corporation | Structural and temporal semantics heterogeneous information network (hin) for process trace clustering |
| US20170288974A1 (en) | 2016-04-04 | 2017-10-05 | Nec Laboratories America, Inc. | Graph-based fusing of heterogeneous alerts |
| US9787705B1 (en) | 2016-08-19 | 2017-10-10 | Quid, Inc. | Extracting insightful nodes from graphs |
| US9805080B2 (en) | 2014-08-22 | 2017-10-31 | Xcalar, Inc. | Data driven relational algorithm formation for execution against big data |
| US9805140B2 (en) | 2014-07-21 | 2017-10-31 | Facebook, Inc. | Striping of directed graphs and nodes with improved functionality |
| US9811790B2 (en) | 2003-08-20 | 2017-11-07 | International Business Machines Corporation | E-business value web |
| US9819671B2 (en) | 2014-07-02 | 2017-11-14 | Alibaba Group Holding Limited | Prompting login account |
| US20170337262A1 (en) | 2016-05-19 | 2017-11-23 | Quid, Inc. | Pivoting from a graph of semantic similarity of documents to a derivative graph of relationships between entities mentioned in the documents |
| US9836183B1 (en) | 2016-09-14 | 2017-12-05 | Quid, Inc. | Summarized network graph for semantic similarity graphs of large corpora |
| US20170353853A1 (en) | 2015-08-13 | 2017-12-07 | Google Inc. | Reducing data use in limited data environment |
| US20170359361A1 (en) | 2016-06-09 | 2017-12-14 | Adobe Systems Incorporated | Selecting representative metrics datasets for efficient detection of anomalous data |
| US20170366492A1 (en) | 2016-06-20 | 2017-12-21 | Huawei Technologies Co., Ltd. | System and Method for Messaging Between Operating System Containers |
| US9852230B2 (en) | 2013-06-29 | 2017-12-26 | Google Llc | Asynchronous message passing for large graph clustering |
| US9853968B2 (en) | 2015-08-19 | 2017-12-26 | Winifred Shen | Systems and methods for authenticating users accessing a secure network with one-session-only, on-demand login credentials |
| US20180019932A1 (en) | 2016-07-12 | 2018-01-18 | At&T Intellectual Property I, L.P. | Enterprise server behavior profiling |
| US20180020015A1 (en) | 2016-06-14 | 2018-01-18 | Sdn Systems, Llc | System and method for automated network monitoring and detection of network anomalies |
| US20180025361A1 (en) | 2016-07-19 | 2018-01-25 | Ca, Inc. | Database management methods, systems, and devices for identifying related customer support tickets |
| US20180034840A1 (en) | 2016-07-29 | 2018-02-01 | Accenture Global Solutions Limited | Network security analysis system |
| US9887999B2 (en) | 2014-05-26 | 2018-02-06 | Netease Information Technology(Beijing) Co., Ltd. | Login method and apparatus |
| US20180039688A1 (en) | 2016-08-05 | 2018-02-08 | Linkedin Corporation | Data flow based feature vector clustering |
| US20180063178A1 (en) | 2016-09-01 | 2018-03-01 | Promithius Inc. | Method and systems for real-time internal network threat detection and enforcement |
| US20180067981A1 (en) | 2016-09-06 | 2018-03-08 | International Business Machines Corporation | Automatic Detection and Cleansing of Erroneous Concepts in an Aggregated Knowledge Base |
| US20180069885A1 (en) | 2016-09-06 | 2018-03-08 | Accenture Global Solutions Limited | Graph database analysis for network anomaly detection systems |
| US9923911B2 (en) | 2015-10-08 | 2018-03-20 | Cisco Technology, Inc. | Anomaly detection supporting new application deployments |
| US20180084069A1 (en) | 2016-09-22 | 2018-03-22 | Microsoft Technology Licensing, Llc. | Establishing user's presence on internal on-premises network over time using network signals |
| US20180097793A1 (en) | 2016-09-30 | 2018-04-05 | Ca, Inc. | Secondary authentication using user's login status |
| US20180096047A1 (en) | 2016-10-05 | 2018-04-05 | International Business Machines Corporation | Detecting clusters and relationships in large data sets |
| US9942220B2 (en) | 2012-03-20 | 2018-04-10 | Facebook, Inc. | Preventing unauthorized account access using compromised login credentials |
| US20180103052A1 (en) | 2016-10-11 | 2018-04-12 | Battelle Memorial Institute | System and methods for automated detection, reasoning and recommendations for resilient cyber systems |
| US9946800B2 (en) | 2015-07-06 | 2018-04-17 | International Business Machines Corporation | Ranking related objects using blink model based relation strength determinations |
| US9953014B1 (en) | 2013-11-08 | 2018-04-24 | Instart Logic, Inc. | Collection management in document object model virtualization |
| US20180115578A1 (en) | 2016-10-26 | 2018-04-26 | Elastic Beam, Inc. | Methods and systems for deep learning based api traffic security |
| US20180123864A1 (en) | 2016-11-02 | 2018-05-03 | Servicenow, Inc. | Network Event Grouping |
| US20180137858A1 (en) | 2016-11-17 | 2018-05-17 | BrainofT Inc. | Controlling connected devices using a relationship graph |
| US20180174062A1 (en) | 2016-12-21 | 2018-06-21 | Ca, Inc. | Root cause analysis for sequences of datacenter states |
| US20180173789A1 (en) | 2016-12-21 | 2018-06-21 | Ca, Inc. | Descriptive datacenter state comparison |
| US20180181750A1 (en) | 2016-12-22 | 2018-06-28 | X Development Llc | Computer telemetry analysis |
| US10033611B1 (en) | 2015-02-06 | 2018-07-24 | HCA Holdings, Inc. | Transaction lifecycle management |
| US20180227286A1 (en) | 2017-02-08 | 2018-08-09 | Casio Computer Co., Ltd. | Authentication device and computer-readable recording medium |
| US20180248901A1 (en) | 2017-02-27 | 2018-08-30 | Catbird Networks, Inc. | Behavioral baselining of network systems |
| US20180268078A1 (en) | 2017-03-16 | 2018-09-20 | Raytheon Company | Quantifying consistency of a system architecture by comparing analyses of property graph data models representing different versions of the system architecture |
| US20180288063A1 (en) | 2017-03-31 | 2018-10-04 | Oracle International Corporation | Mechanisms for anomaly detection and access management |
| US10121000B1 (en) | 2016-06-28 | 2018-11-06 | Fireeye, Inc. | System and method to detect premium attacks on electronic networks and electronic devices |
| US10122740B1 (en) | 2015-05-05 | 2018-11-06 | F5 Networks, Inc. | Methods for establishing anomaly detection configurations and identifying anomalous network traffic and devices thereof |
| US10127273B2 (en) | 2014-04-15 | 2018-11-13 | Splunk Inc. | Distributed processing of network data using remote capture agents |
| US20180329958A1 (en) | 2017-05-12 | 2018-11-15 | Battelle Memorial Institute | Performance and usability enhancements for continuous subgraph matching queries on graph-structured data |
| US20180336353A1 (en) | 2017-05-16 | 2018-11-22 | Entit Software Llc | Risk scores for entities |
| US10142357B1 (en) | 2016-12-21 | 2018-11-27 | Symantec Corporation | Systems and methods for preventing malicious network connections using correlation-based anomaly detection |
| US20180357422A1 (en) | 2016-02-25 | 2018-12-13 | Sas Institute Inc. | Simulated attack generator for testing a cybersecurity system |
| US20180367548A1 (en) | 2017-06-14 | 2018-12-20 | Microsoft Technology Licensing, Llc | Detecting malicious lateral movement across a computer network |
| US20190028327A1 (en) | 2016-02-11 | 2019-01-24 | Xieon Networks S.A.R.L. | Service-based loss forwarding in communication networks |
| US20190042879A1 (en) | 2018-06-26 | 2019-02-07 | Intel Corporation | Entropic clustering of objects |
| US20190068505A1 (en) * | 2017-08-31 | 2019-02-28 | Microsoft Technology Licensing, Llc | Non-dsr distributed load balancer with virtualized vips and source proxy on load balanced connection |
| US10237294B1 (en) | 2017-01-30 | 2019-03-19 | Splunk Inc. | Fingerprinting entities based on activity in an information technology environment |
| US20190087480A1 (en) | 2017-09-15 | 2019-03-21 | Adobe Systems Incorporated | Clustering based on a directed graph |
| US20190102280A1 (en) * | 2017-09-30 | 2019-04-04 | Oracle International Corporation | Real-time debugging instances in a deployed container platform |
| US20190109870A1 (en) | 2017-09-14 | 2019-04-11 | Commvault Systems, Inc. | Ransomware detection and intelligent restore |
| US20190132224A1 (en) | 2017-10-26 | 2019-05-02 | Accenture Global Solutions Limited | Systems and methods for identifying and mitigating outlier network activity |
| US10339309B1 (en) | 2017-06-09 | 2019-07-02 | Bank Of America Corporation | System for identifying anomalies in an information system |
| US20190212998A1 (en) * | 2018-01-11 | 2019-07-11 | Robin Systems, Inc. | Implementing Application Entrypoints With Containers of a Bundled Application |
| US20190222597A1 (en) | 2015-10-28 | 2019-07-18 | Fractal Industries, Inc. | System and method for comprehensive data loss prevention and compliance management |
| US10382529B2 (en) | 2016-01-29 | 2019-08-13 | Nicira, Inc. | Directed graph based span computation and configuration dispatching |
| US20190259033A1 (en) | 2015-06-20 | 2019-08-22 | Quantiply Corporation | System and method for using a data genome to identify suspicious financial transactions |
| US20190273683A1 (en) * | 2018-03-01 | 2019-09-05 | Nicira, Inc. | Generic communication channel for information exchange between a hypervisor and a virtual machine |
| US10419468B2 (en) | 2017-07-11 | 2019-09-17 | The Boeing Company | Cyber security system with adaptive machine learning features |
| US10419469B1 (en) | 2017-11-27 | 2019-09-17 | Lacework Inc. | Graph-based user tracking and threat detection |
| US10454753B2 (en) | 2013-07-28 | 2019-10-22 | Lightbend, Inc. | Ranking network anomalies in an anomaly cluster |
| US20190339965A1 (en) | 2018-05-07 | 2019-11-07 | Oracle International Corporation | Method for automatically selecting configuration clustering parameters |
| US20190342282A1 (en) | 2017-01-20 | 2019-11-07 | Google Llc | Multi-User Login Session |
| US20190349305A1 (en) | 2018-05-11 | 2019-11-14 | Huazhong University Of Science And Technology | Container communication method and system for parallel applications |
| US20190364067A1 (en) | 2016-09-20 | 2019-11-28 | F5 Networks, Inc. | Methods for detecting and mitigating malicious network behavior and devices thereof |
| US10496263B2 (en) | 2017-01-03 | 2019-12-03 | Jpmorgan Chase Bank, N.A. | De-anonymization of website visitor identity |
| US10496678B1 (en) | 2016-05-12 | 2019-12-03 | Federal Home Loan Mortgage Corporation (Freddie Mac) | Systems and methods for generating and implementing knowledge graphs for knowledge representation and analysis |
| US10505818B1 (en) | 2015-05-05 | 2019-12-10 | F5 Networks. Inc. | Methods for analyzing and load balancing based on server health and devices thereof |
| US20190379590A1 (en) * | 2018-06-06 | 2019-12-12 | Servicenow, Inc. | Discovery and Mapping of Containerized Software Applications |
| US20190378050A1 (en) | 2018-06-12 | 2019-12-12 | Bank Of America Corporation | Machine learning system to identify and optimize features based on historical data, known patterns, or emerging patterns |
| US10510007B2 (en) | 2015-12-15 | 2019-12-17 | Tata Consultancy Services Limited | Systems and methods for generating performance prediction model and estimating execution time for applications |
| US10521584B1 (en) | 2017-08-28 | 2019-12-31 | Amazon Technologies, Inc. | Computer threat analysis service |
| US10565373B1 (en) | 2017-02-21 | 2020-02-18 | Ca, Inc. | Behavioral analysis of scripting utility usage in an enterprise |
| US20200065857A1 (en) | 2017-05-11 | 2020-02-27 | Hubspot, Inc. | Methods and systems for automated generation of personalized messages |
| US20200074341A1 (en) | 2018-08-30 | 2020-03-05 | NEC Laboratories Europe GmbH | Method and system for scalable multi-task learning with convex clustering |
| US20200076685A1 (en) | 2018-08-30 | 2020-03-05 | Juniper Networks, Inc. | Multiple networks for virtual execution elements |
| US20200080856A1 (en) | 2017-10-19 | 2020-03-12 | rideOS | System and method for routing in a ride-share transportation network |
| US10594718B1 (en) | 2018-08-21 | 2020-03-17 | Extrahop Networks, Inc. | Managing incident response operations based on monitored network activity |
| US10599718B2 (en) | 2015-10-09 | 2020-03-24 | Software Ag | Systems and/or methods for graph based declarative mapping |
| USRE47937E1 (en) | 2012-03-06 | 2020-04-07 | Google Llc | Providing content to a user across multiple devices |
| US20200175042A1 (en) | 2016-08-25 | 2020-06-04 | Cyber Atomics, Inc. | Efficient data clustering |
| US10685295B1 (en) | 2016-12-29 | 2020-06-16 | X Development Llc | Allocating resources for a machine learning model |
| US20200192690A1 (en) | 2018-12-14 | 2020-06-18 | Hewlett Packard Enterprise Development Lp | Application deployment in a container management system |
| US10708082B1 (en) | 2018-08-31 | 2020-07-07 | Juniper Networks, Inc. | Unified control plane for nested clusters in a virtualized computing infrastructure |
| US20200228555A1 (en) | 2010-11-18 | 2020-07-16 | Nant Holdings Ip, Llc | Vector-based anomaly detection |
| US20200252376A1 (en) | 2019-02-01 | 2020-08-06 | NeuVector, Inc. | Network context monitoring within service mesh containerization environment |
| US10754940B2 (en) | 2017-03-06 | 2020-08-25 | Casio Computer Co., Ltd. | Authentication device and computer-readable recording medium |
| US20200272740A1 (en) | 2019-02-27 | 2020-08-27 | Optum Services (Ireland) Limited | Anomalous activity detection in multi-provider transactional environments |
| US20200280592A1 (en) | 2019-03-01 | 2020-09-03 | Netskope, Inc. | Recovery From Failure in a Dynamic Scalable Services Mesh |
| US20200278892A1 (en) | 2019-02-28 | 2020-09-03 | Cisco Technology, Inc. | Remote smart nic-based service acceleration |
| US10791131B2 (en) | 2015-05-28 | 2020-09-29 | Hewlett Packard Enterprise Development Lp | Processing network data using a graph data structure |
| US20200311644A1 (en) | 2018-07-19 | 2020-10-01 | America's Collectibles Network, Inc. | System and method for performing bulk pick of items of a customer order |
| US10798159B2 (en) * | 2017-07-26 | 2020-10-06 | Netapp, Inc. | Methods for managing workload throughput in a storage system and devices thereof |
| US10824675B2 (en) | 2017-11-17 | 2020-11-03 | Microsoft Technology Licensing, Llc | Resource-efficient generation of a knowledge graph |
| US20200403860A1 (en) | 2019-06-19 | 2020-12-24 | Centurylink Intellectual Property Llc | Edge Database Management of The Network Data Plane |
| US10885452B1 (en) | 2016-06-27 | 2021-01-05 | Amazon Technologies, Inc. | Relation graph optimization using inconsistent cycle detection |
| US10904007B2 (en) | 2015-12-23 | 2021-01-26 | Kt Corporation | Authentication device based on biometric information, control server connected to the same, and login method based on biometric information thereof |
| US11036800B1 (en) | 2016-04-29 | 2021-06-15 | Veritas Technologies Llc | Systems and methods for clustering data to improve data analytics |
| US20210328858A1 (en) * | 2020-04-16 | 2021-10-21 | Ribbon Communications Operating Company, Inc. | Communications methods and apparatus for migrating a network interface and/or ip address from one pod to another pod in a kubernetes system |
| US20210329019A1 (en) | 2019-01-28 | 2021-10-21 | Orca Security LTD. | Techniques for securing virtual machines |
| US20220247647A1 (en) * | 2021-01-29 | 2022-08-04 | Tigera, Inc. | Network traffic graph |
| US20220345483A1 (en) | 2021-04-26 | 2022-10-27 | Orca Security LTD. | Prioritizing internet-accessible workloads for cyber security |
-
2022
- 2022-01-31 US US17/589,361 patent/US11792284B1/en active Active
Patent Citations (369)
| Publication number | Priority date | Publication date | Assignee | Title |
|---|---|---|---|---|
| US5584024A (en) | 1994-03-24 | 1996-12-10 | Software Ag | Interactive database query system and method for prohibiting the selection of semantically incorrect query parameters |
| US5806062A (en) | 1995-10-17 | 1998-09-08 | Lucent Technologies Inc. | Data analysis system using virtual databases |
| US6434663B1 (en) | 1996-09-06 | 2002-08-13 | Intel Corporation | Disk block allocation optimization methodology with accommodation for file system cluster size greater than operating system memory page size |
| US6363411B1 (en) | 1998-08-05 | 2002-03-26 | Mci Worldcom, Inc. | Intelligent network |
| US6347339B1 (en) | 1998-12-01 | 2002-02-12 | Cisco Technology, Inc. | Detecting an active network node using a login attempt |
| US20060036896A1 (en) | 1999-03-26 | 2006-02-16 | Microsoft Corporation | Method and system for consistent cluster operational data in a server cluster using a quorum of replicas |
| US20020161889A1 (en) | 1999-03-26 | 2002-10-31 | Rod Gamache | Method and system for consistent cluster operational data in a server cluster using a quorum of replicas |
| US20060090095A1 (en) | 1999-03-26 | 2006-04-27 | Microsoft Corporation | Consistent cluster operational data in a server cluster using a quorum of replicas |
| US6938084B2 (en) | 1999-03-26 | 2005-08-30 | Microsoft Corporation | Method and system for consistent cluster operational data in a server cluster using a quorum of replicas |
| US7054873B2 (en) | 1999-05-04 | 2006-05-30 | Telefonaktiebolaget Lm Ericsson (Publ) | Telecommunications network resource handling arrangement and method |
| US20020059531A1 (en) | 2000-11-16 | 2002-05-16 | Lai On Warren Kwan | Integrated tracking of multi-authentication among web services |
| US20140325631A1 (en) | 2001-01-29 | 2014-10-30 | Ebay Inc. | Method and system for maintaining login preference information of users in a network-based transaction facility |
| US20080072062A1 (en) | 2001-01-29 | 2008-03-20 | Ebay Inc. | Method and system for maintaining login preference information of users in a network-based transaction facility |
| US20110023098A1 (en) | 2001-01-29 | 2011-01-27 | Ebay Inc. | Method and system for maintaining login preference information of users in a network-based transaction facility |
| US9400882B2 (en) | 2001-01-29 | 2016-07-26 | Ebay Inc. | Method and system for maintaining login preference information of users in a network-based transaction facility |
| US7797548B2 (en) | 2001-01-29 | 2010-09-14 | Ebay Inc. | Method and system for maintaining login preference information of users in a network-based transaction facility |
| US8291233B2 (en) | 2001-01-29 | 2012-10-16 | Ebay Inc. | Method and system for maintaining login preference information of users in a network-based transaction facility |
| US7310733B1 (en) | 2001-01-29 | 2007-12-18 | Ebay Inc. | Method and system for maintaining login preference information of users in a network-based transaction facility |
| US20020184225A1 (en) | 2001-05-31 | 2002-12-05 | Hovhannes Ghukasyan | Automatic generation of join graphs for relational database queries |
| US20030037136A1 (en) | 2001-06-27 | 2003-02-20 | Labovitz Craig H. | Method and system for monitoring control signal traffic over a computer network |
| US20030179227A1 (en) | 2001-10-05 | 2003-09-25 | Farhan Ahmad | Methods and apparatus for launching device specific applications on storage area network components |
| US20030233361A1 (en) | 2002-06-13 | 2003-12-18 | Cady C. Conrad | Resumption of user authentication and restoration of interrupted virtual sessions in a stateless network |
| US20040015470A1 (en) | 2002-07-20 | 2004-01-22 | Smith Michael David | Dynamic filtering in a database system |
| US20050060287A1 (en) | 2003-05-16 | 2005-03-17 | Hellman Ziv Z. | System and method for automatic clustering, sub-clustering and cluster hierarchization of search results in cross-referenced databases using articulation nodes |
| US20090271504A1 (en) | 2003-06-09 | 2009-10-29 | Andrew Francis Ginter | Techniques for agent configuration |
| US20090222740A1 (en) | 2003-07-11 | 2009-09-03 | Computer Associates Think, Inc. | System and method for synchronizing login processes |
| US9811790B2 (en) | 2003-08-20 | 2017-11-07 | International Business Machines Corporation | E-business value web |
| US7529801B2 (en) | 2003-11-06 | 2009-05-05 | International Business Machines Corporation | Method and system for multiple instant messaging login sessions |
| US20050102365A1 (en) | 2003-11-06 | 2005-05-12 | International Business Machines Corporation | Method and system for multiple instant messaging login sessions |
| US20050102284A1 (en) | 2003-11-10 | 2005-05-12 | Chandramouli Srinivasan | Dynamic graphical user interface and query logic SQL generator used for developing Web-based database applications |
| US8725587B2 (en) | 2003-11-18 | 2014-05-13 | Bgc Partners, Inc. | System and method for managing relationships between brokers and traders |
| US7562045B2 (en) | 2003-11-18 | 2009-07-14 | Bgc Partners, Inc. | System and method for managing relationships between brokers and traders |
| US20090177573A1 (en) | 2003-11-18 | 2009-07-09 | Beadle Alastair J D | System and method for managing relationships between brokers and traders |
| US20050108142A1 (en) | 2003-11-18 | 2005-05-19 | Espeed, Inc. | System and method for managing relationships between brokers and traders |
| US20050188222A1 (en) | 2004-02-24 | 2005-08-25 | Covelight Systems, Inc. | Methods, systems and computer program products for monitoring user login activity for a server application |
| US8037521B2 (en) | 2004-04-09 | 2011-10-11 | Ricoh Company, Ltd. | Information processing apparatus allowing multiple logins |
| US20050231760A1 (en) | 2004-04-09 | 2005-10-20 | Junichi Minato | Information processing apparatus allowing multiple logins |
| US20050246288A1 (en) | 2004-04-28 | 2005-11-03 | Hitachi, Ltd. | Session information preserving system and method therefor |
| US8341711B1 (en) | 2004-08-24 | 2012-12-25 | Whitehat Security, Inc. | Automated login session extender for use in security analysis systems |
| US20060085437A1 (en) | 2004-10-14 | 2006-04-20 | International Business Machines Corporation | Management of relationships between database tables |
| US20060259470A1 (en) | 2005-05-11 | 2006-11-16 | Sivakumar Chandrasekharan | Apparatus, system, and method for map definition generation |
| US8151107B2 (en) | 2005-05-31 | 2012-04-03 | Nhn Corporation | Method and system for detecting concurrent logins |
| US20080065879A1 (en) | 2005-05-31 | 2008-03-13 | Nhn Corporation | Method and system for detecting concurrent logins |
| US20060288415A1 (en) | 2005-06-16 | 2006-12-21 | Chung Shan Institute Of Science And Technology | Method of detecting network worms |
| US20090165109A1 (en) | 2005-07-21 | 2009-06-25 | Arcot Systems, Inc. | Controlled and client-side authentication module |
| US20130205357A1 (en) | 2005-08-04 | 2013-08-08 | General Instrument Corporation | Ip multicast management and service provision system and method |
| US20070050497A1 (en) | 2005-08-29 | 2007-03-01 | Haley Michael R | System and method for detecting status changes in a network using virtual coordinate mapping |
| US8122122B1 (en) | 2005-11-08 | 2012-02-21 | Raytheon Oakley Systems, Inc. | Event monitoring and collection |
| US20070130330A1 (en) | 2005-11-15 | 2007-06-07 | Aternity Information Systems Ltd. | System for inventing computer systems and alerting users of faults to systems for monitoring |
| US20070168696A1 (en) | 2005-11-15 | 2007-07-19 | Aternity Information Systems, Ltd. | System for inventing computer systems and alerting users of faults |
| US8352589B2 (en) | 2005-11-15 | 2013-01-08 | Aternity Information Systems Ltd. | System for monitoring computer systems and alerting users of faults |
| US20070118909A1 (en) | 2005-11-18 | 2007-05-24 | Nexthink Sa | Method for the detection and visualization of anomalous behaviors in a computer network |
| US20070162605A1 (en) | 2006-01-07 | 2007-07-12 | Chalasani Nanchariah R | Distributed instant messaging |
| US20070162963A1 (en) | 2006-01-10 | 2007-07-12 | Alcatel Lucent | Method of providing a centralised login |
| US20070169175A1 (en) | 2006-01-18 | 2007-07-19 | Hall Kylene J | Killing login-based sessions with a single action |
| US7743153B2 (en) | 2006-01-18 | 2010-06-22 | International Business Machines Corporation | Killing login-based sessions with a single action |
| US8443442B2 (en) | 2006-01-31 | 2013-05-14 | The Penn State Research Foundation | Signature-free buffer overflow attack blocker |
| US20070225956A1 (en) | 2006-03-27 | 2007-09-27 | Dexter Roydon Pratt | Causal analysis in complex biological systems |
| US8032925B2 (en) | 2006-05-15 | 2011-10-04 | Lg Electronics Inc. | Method for enabling login and establishing session for wireless communication terminal |
| US20070266425A1 (en) | 2006-05-15 | 2007-11-15 | Lg Electronics Inc. | Method for enabling login and establishing session for wireless communication terminal |
| US20080034411A1 (en) | 2006-08-03 | 2008-02-07 | Fujitsu Limited | Login administration method and server |
| US8276197B1 (en) | 2006-09-29 | 2012-09-25 | Sprint Communications Company L.P. | Cascading network login |
| US9332020B2 (en) | 2006-10-17 | 2016-05-03 | Threatmetrix Pty Ltd | Method for tracking machines on a network using multivariable fingerprinting of passively available information |
| US20080148180A1 (en) | 2006-12-14 | 2008-06-19 | Microsoft Corporation | Detecting Anomalies in Server Behavior |
| US7926026B2 (en) | 2006-12-20 | 2011-04-12 | Sap Ag | Graphical analysis to detect process object anomalies |
| US20080151893A1 (en) | 2006-12-20 | 2008-06-26 | Sun Microsystems, Inc. | Method and system for virtual routing using containers |
| US20080155335A1 (en) | 2006-12-20 | 2008-06-26 | Udo Klein | Graphical analysis to detect process object anomalies |
| US20080244718A1 (en) | 2007-03-30 | 2008-10-02 | Simon Frost | Systems and Methods for User Login |
| US7996885B2 (en) | 2007-04-19 | 2011-08-09 | International Business Machines Corporation | Password application |
| US20080263643A1 (en) | 2007-04-19 | 2008-10-23 | International Business Machines Corporation | Method and system for password application |
| US20080270451A1 (en) | 2007-04-24 | 2008-10-30 | Interse A/S | System and Method of Generating a Metadata Model for Use in Classifying and Searching for Information Objects Maintained in Heterogeneous Data Stores |
| US20090019160A1 (en) | 2007-07-12 | 2009-01-15 | International Business Machines Corporation | Method and system for workload management utilizing tcp/ip and operating system data |
| US20100172261A1 (en) | 2007-09-04 | 2010-07-08 | Hiroyuki Shinbo | Information collection device, communication error detection device, and computer program |
| US20130219295A1 (en) | 2007-09-19 | 2013-08-22 | Michael R. Feldman | Multimedia system and associated methods |
| US20090228474A1 (en) | 2007-11-01 | 2009-09-10 | Chi-Hsien Chiu | Analyzing event streams of user sessions |
| US8549002B2 (en) | 2008-05-15 | 2013-10-01 | Oracle International Corporation | Cluster health indicator with dynamic load correlation |
| US20090287720A1 (en) | 2008-05-15 | 2009-11-19 | Oracle International Corp | Cluster health indicator with dynamic load correlation |
| US20100094767A1 (en) | 2008-06-12 | 2010-04-15 | Tom Miltonberger | Modeling Users for Fraud Detection and Analysis |
| US10115111B2 (en) | 2008-06-12 | 2018-10-30 | Guardian Analytics, Inc. | Modeling users for fraud detection and analysis |
| US8037284B2 (en) | 2008-08-18 | 2011-10-11 | International Business Machines Corporation | Stream processing in optically linked super node clusters of processors by mapping stream graph to nodes and links |
| US7856544B2 (en) | 2008-08-18 | 2010-12-21 | International Business Machines Corporation | Stream processing in super node clusters of processors assigned with stream computation graph kernels and coupled by stream traffic optical links |
| US20100114931A1 (en) | 2008-10-21 | 2010-05-06 | Microsoft Corporation | Facet, logic and textual-based query composer |
| US7962635B2 (en) | 2009-02-24 | 2011-06-14 | Telcordia Technologies, Inc. | Systems and methods for single session management in load balanced application server clusters |
| US20100217860A1 (en) | 2009-02-24 | 2010-08-26 | Telcordia Technologies, Inc. | Systems and methods for single session management in load balanced application server clusters |
| US9037273B2 (en) | 2009-04-20 | 2015-05-19 | Abb Research Ltd. | Operator terminal in a process control system |
| US20100274785A1 (en) | 2009-04-24 | 2010-10-28 | At&T Intellectual Property I, L.P. | Database Analysis Using Clusters |
| US8497863B2 (en) | 2009-06-04 | 2013-07-30 | Microsoft Corporation | Graph scalability |
| US20100309206A1 (en) | 2009-06-04 | 2010-12-09 | Microsoft Corporation | Graph scalability |
| US8351456B2 (en) | 2009-06-29 | 2013-01-08 | Qualcomm Incorporated | Method and apparatus for radio filtering in a multi-radio device |
| US20100329162A1 (en) | 2009-06-29 | 2010-12-30 | Qualcomm, Incorporated | Method and apparatus for radio filtering in a multi-radio device |
| US20110029952A1 (en) | 2009-07-31 | 2011-02-03 | Xerox Corporation | Method and system for constructing a document redundancy graph |
| US20110055138A1 (en) | 2009-08-27 | 2011-03-03 | Vaibhav Khanduja | Method and system for processing network activity data |
| US9582766B2 (en) | 2009-11-02 | 2017-02-28 | Google Inc. | Clustering query refinements by inferred user intent |
| US20160203411A1 (en) | 2009-11-02 | 2016-07-14 | Google Inc. | Clustering query refinements by inferred user intent |
| US20150161201A1 (en) | 2009-11-02 | 2015-06-11 | Google Inc. | Clustering query refinements by inferred user intent |
| US9323806B2 (en) | 2009-11-02 | 2016-04-26 | Google Inc. | Clustering query refinements by inferred user intent |
| US8359584B2 (en) | 2009-12-18 | 2013-01-22 | Microsoft Corporation | Debugging from a call graph |
| US9021583B2 (en) | 2010-01-26 | 2015-04-28 | Emc Corporation | System and method for network security including detection of man-in-the-browser attacks |
| US9391978B2 (en) | 2010-05-25 | 2016-07-12 | Novell, Inc. | Multiple access authentication |
| US20110302631A1 (en) | 2010-06-07 | 2011-12-08 | Salesforce.Com, Inc. | Systems and methods for logging into an application on a second domain from a first domain in a multi-tenant database system environment |
| US20120005243A1 (en) | 2010-07-02 | 2012-01-05 | At&T Intellectual Property I, Lp | Operating a Network Using Relational Database Methodology |
| US8671453B2 (en) | 2010-08-17 | 2014-03-11 | Facebook, Inc. | Social age verification engine |
| US20120054732A1 (en) | 2010-08-24 | 2012-03-01 | Oracle International Corporation | Reducing downtime while patching binaries on a cluster |
| US11048492B2 (en) | 2010-08-24 | 2021-06-29 | Oracle International Corporation | Reducing downtime while patching binaries on a cluster |
| US8103906B1 (en) | 2010-10-01 | 2012-01-24 | Massoud Alibakhsh | System and method for providing total real-time redundancy for a plurality of client-server systems |
| US20120089875A1 (en) | 2010-10-07 | 2012-04-12 | Microsoft Corporation | Multi-user test framework |
| US20120102029A1 (en) | 2010-10-25 | 2012-04-26 | Ab Initio Technology Llc | Managing data set objects |
| US9659337B2 (en) | 2010-10-29 | 2017-05-23 | Nhn Corporation | Unified communication system and unified communication method using multi-login, terminal for controlling operation of unified communication tool, and communication method in terminal |
| US9231935B1 (en) | 2010-11-10 | 2016-01-05 | Google Inc. | Background auto-submit of login credentials |
| US8607306B1 (en) | 2010-11-10 | 2013-12-10 | Google Inc. | Background auto-submit of login credentials |
| US20200228555A1 (en) | 2010-11-18 | 2020-07-16 | Nant Holdings Ip, Llc | Vector-based anomaly detection |
| US20130269007A1 (en) | 2010-12-16 | 2013-10-10 | Nec Software Kyushu, Ltd. | Authentication system, authentication server, service providing server, authentication method, and computer-readable recording medium |
| US20120158858A1 (en) | 2010-12-16 | 2012-06-21 | Microsoft Corporation | Resource Optimization for Online Services |
| US9053306B2 (en) | 2010-12-16 | 2015-06-09 | Nec Solution Innovators, Ltd. | Authentication system, authentication server, service providing server, authentication method, and computer-readable recording medium |
| US20120173541A1 (en) | 2010-12-30 | 2012-07-05 | Venkateshwaran Venkataramani | Distributed Cache for Graph Data |
| US20130304915A1 (en) | 2011-01-17 | 2013-11-14 | Nec Corporation | Network system, controller, switch and traffic monitoring method |
| US20120317149A1 (en) | 2011-06-09 | 2012-12-13 | Salesforce.Com, Inc. | Methods and systems for processing graphs using distributed memory and set operations |
| US20120317151A1 (en) | 2011-06-09 | 2012-12-13 | Thomas Walter Ruf | Model-Based Method for Managing Information Derived From Network Traffic |
| US20120323956A1 (en) | 2011-06-16 | 2012-12-20 | Microsoft Corporation | Composable SQL Query Generation |
| US9497224B2 (en) | 2011-08-09 | 2016-11-15 | CloudPassage, Inc. | Systems and methods for implementing computer security |
| US20150058619A1 (en) | 2011-08-09 | 2015-02-26 | CloudPassage, Inc. | Systems and methods for implementing computer security |
| US20170230183A1 (en) | 2011-08-09 | 2017-08-10 | CloudPassage, Inc. | Systems and methods for implementing computer security |
| US8843646B2 (en) | 2011-09-12 | 2014-09-23 | Microsoft Corporation | Multi-desktop interaction using nested remote desktop sessions |
| US20130067100A1 (en) | 2011-09-12 | 2013-03-14 | Microsoft Corporation | Multi-desktop interaction using nested remote desktop sessions |
| US20130081118A1 (en) | 2011-09-23 | 2013-03-28 | Canon U.S.A., Inc. | Method, system, and computer-readable storage medium for establishing a login session |
| US8561157B2 (en) | 2011-09-23 | 2013-10-15 | Canon U.S.A., Inc. | Method, system, and computer-readable storage medium for establishing a login session |
| US20130086667A1 (en) | 2011-10-04 | 2013-04-04 | Salesforce.Com, Inc. | Method and system for providing login as a service |
| US9830435B2 (en) | 2011-10-04 | 2017-11-28 | Salesforce.Com, Inc. | Method and system for providing login as a service |
| US8655989B2 (en) | 2011-10-14 | 2014-02-18 | Sap Ag | Business network access protocol for the business network |
| US20130097320A1 (en) | 2011-10-14 | 2013-04-18 | Sap Ag | Business Network Access Protocol for the Business Network |
| US9515999B2 (en) | 2011-12-21 | 2016-12-06 | Ssh Communications Security Oyj | Automated access, key, certificate, and credential management |
| US20160373428A1 (en) | 2011-12-22 | 2016-12-22 | Paypal, Inc. | Smart phone login using qr code |
| US20130173915A1 (en) | 2011-12-28 | 2013-07-04 | Pitney Bowes Inc. | System and method for secure nework login |
| US8826403B2 (en) | 2012-02-01 | 2014-09-02 | International Business Machines Corporation | Service compliance enforcement using user activity monitoring and work request verification |
| USRE47937E1 (en) | 2012-03-06 | 2020-04-07 | Google Llc | Providing content to a user across multiple devices |
| USRE47952E1 (en) | 2012-03-06 | 2020-04-14 | Google Llc | Providing content to a user across multiple devices |
| US9942220B2 (en) | 2012-03-20 | 2018-04-10 | Facebook, Inc. | Preventing unauthorized account access using compromised login credentials |
| US8595262B1 (en) | 2012-03-29 | 2013-11-26 | Amazon Technologies, Inc. | Resource resolution in computing environments using directed graphs |
| US9639676B2 (en) | 2012-05-31 | 2017-05-02 | Microsoft Technology Licensing, Llc | Login interface selection for computing environment user login |
| US10614200B2 (en) | 2012-05-31 | 2020-04-07 | Microsoft Technology Licensing, Llc | Login interface selection for computing environment user login |
| US9246897B2 (en) | 2012-07-18 | 2016-01-26 | Tencent Technology (Shenzhen) Company Limited | Method and system of login authentication |
| US20140041005A1 (en) | 2012-07-18 | 2014-02-06 | Tencent Technology (Shenzhen) Company Limited | Method and system of login authentication |
| US20170063830A1 (en) | 2012-07-19 | 2017-03-02 | Alibaba Group Holding Limited | Method, client, server and system of login verification |
| US9954842B2 (en) | 2012-07-19 | 2018-04-24 | Alibaba Group Holding Limited | Method, client, server and system of login verification |
| US8862524B2 (en) | 2012-08-01 | 2014-10-14 | Yahoo! Inc. | System and method for identifying abusive account registration |
| US20150135312A1 (en) | 2012-08-31 | 2015-05-14 | Hitachi, Ltd. | Service performance monitoring method |
| US9741138B2 (en) | 2012-10-10 | 2017-08-22 | International Business Machines Corporation | Node cluster relationships in a graph database |
| US20140098101A1 (en) | 2012-10-10 | 2014-04-10 | International Business Machines Corporation | Node cluster relationships in a graph database |
| US20140115001A1 (en) | 2012-10-19 | 2014-04-24 | Playence GmBH | Structured query generation |
| US20140115011A1 (en) | 2012-10-22 | 2014-04-24 | Allaquaria, LLC dba Quality Marine | Ornamental organism tracking and information system |
| US9652875B2 (en) | 2012-10-29 | 2017-05-16 | Yahoo! Inc. | Systems and methods for generating a dense graph |
| US9602526B2 (en) | 2012-11-29 | 2017-03-21 | Beijing Qihoo Technology Company Limited | User login monitoring device and method |
| US20140181944A1 (en) | 2012-12-26 | 2014-06-26 | Cellco Partnership D/B/A Verizon Wireless | Single sign-on for a native application and a web application on a mobile device |
| US8959608B2 (en) | 2012-12-26 | 2015-02-17 | Cellco Partnership | Single sign-on for a native application and a web application on a mobile device |
| US20140208191A1 (en) | 2013-01-18 | 2014-07-24 | Microsoft Corporation | Grouping Fixed Format Document Elements to Preserve Graphical Data Semantics After Reflow |
| US20140245443A1 (en) | 2013-02-27 | 2014-08-28 | Sayan Chakraborty | Cyber Defense Systems And Methods |
| US20140280068A1 (en) | 2013-03-15 | 2014-09-18 | Bmc Software, Inc. | Adaptive learning of effective troubleshooting patterns |
| US9753960B1 (en) | 2013-03-20 | 2017-09-05 | Amdocs Software Systems Limited | System, method, and computer program for dynamically generating a visual representation of a subset of a graph for display, based on search criteria |
| US9734040B2 (en) | 2013-05-21 | 2017-08-15 | Microsoft Technology Licensing, Llc | Animated highlights in a graph representing an application |
| US20140359558A1 (en) | 2013-06-02 | 2014-12-04 | Mark Spencer Chamberlain | System and methods for end-users to graphically program and manage computers and devices |
| US20140379716A1 (en) | 2013-06-25 | 2014-12-25 | International Business Machines Corporation | Process-Aware Code Migration |
| US9239873B2 (en) | 2013-06-25 | 2016-01-19 | International Business Machines Corporation | Process-aware code migration |
| US9852230B2 (en) | 2013-06-29 | 2017-12-26 | Google Llc | Asynchronous message passing for large graph clustering |
| US9596295B2 (en) | 2013-06-29 | 2017-03-14 | Google Inc. | Computing connected components in large graphs |
| US9740744B2 (en) | 2013-07-26 | 2017-08-22 | Helynx, Inc. | Systems and methods for visualizing and manipulating graph databases |
| US10454753B2 (en) | 2013-07-28 | 2019-10-22 | Lightbend, Inc. | Ranking network anomalies in an anomaly cluster |
| US9781115B2 (en) | 2013-09-04 | 2017-10-03 | Facebook, Inc. | Systems and methods for authenticating nodes |
| US9953014B1 (en) | 2013-11-08 | 2018-04-24 | Instart Logic, Inc. | Collection management in document object model virtualization |
| US9369450B1 (en) | 2013-12-19 | 2016-06-14 | Ca, Inc. | Methods preserving user identities during login and related systems, devices, and machines |
| US20150188751A1 (en) | 2013-12-31 | 2015-07-02 | Cisco Technology, Inc. | Dynamically computing fate sharing in computer networks using learning machines |
| US9635114B2 (en) * | 2014-01-24 | 2017-04-25 | Netapp, Inc. | Externally initiated application session endpoint migration |
| US20150213598A1 (en) | 2014-01-30 | 2015-07-30 | Case Western Reserve University | Spatially Aware Cell Cluster (SPACCL) Graphs |
| US9430830B2 (en) | 2014-01-30 | 2016-08-30 | Case Western Reserve University | Spatially aware cell cluster (SPACCL) graphs |
| US9665660B2 (en) | 2014-03-14 | 2017-05-30 | Xplenty Ltd. | Logical data flow mapping rules for (sub) graph isomorphism in a cluster computing environment |
| US9225730B1 (en) | 2014-03-19 | 2015-12-29 | Amazon Technologies, Inc. | Graph based detection of anomalous activity |
| US20160078365A1 (en) | 2014-03-21 | 2016-03-17 | Philippe Baumard | Autonomous detection of incongruous behaviors |
| US9602506B2 (en) | 2014-03-25 | 2017-03-21 | Samsung Electronics Co., Ltd. | Method and apparatus for supporting login through user terminal |
| US10127273B2 (en) | 2014-04-15 | 2018-11-13 | Splunk Inc. | Distributed processing of network data using remote capture agents |
| US9760619B1 (en) | 2014-04-29 | 2017-09-12 | Google Inc. | Generating weighted clustering coefficients for a social network graph |
| US20150341379A1 (en) | 2014-05-22 | 2015-11-26 | Accenture Global Services Limited | Network anomaly detection |
| US9887999B2 (en) | 2014-05-26 | 2018-02-06 | Netease Information Technology(Beijing) Co., Ltd. | Login method and apparatus |
| US20150356144A1 (en) | 2014-06-09 | 2015-12-10 | Cognitive Scale, Inc. | Cognitive Media Content |
| US9819671B2 (en) | 2014-07-02 | 2017-11-14 | Alibaba Group Holding Limited | Prompting login account |
| US20170134240A1 (en) | 2014-07-08 | 2017-05-11 | Telefonaktiebolaget Lm Ercisson (Publ) | Network Topology Estimation Based on Event Correlation |
| US9805140B2 (en) | 2014-07-21 | 2017-10-31 | Facebook, Inc. | Striping of directed graphs and nodes with improved functionality |
| US9569869B2 (en) | 2014-07-29 | 2017-02-14 | Sap Se | Consolidation and customization of graph-based models |
| US20170085553A1 (en) | 2014-08-06 | 2017-03-23 | Microsoft Technology Licensing, Llc | Revoking sessions using signaling |
| US20180139200A1 (en) | 2014-08-06 | 2018-05-17 | Microsoft Technology Licensing, Llc | Revoking sessions using signaling |
| US10104071B2 (en) | 2014-08-06 | 2018-10-16 | Microsoft Technology Licensing, Llc | Revoking sessions using signaling |
| US9537851B2 (en) | 2014-08-06 | 2017-01-03 | Microsoft Technology Licensing, Llc | Revoking sessions using signaling |
| US9805080B2 (en) | 2014-08-22 | 2017-10-31 | Xcalar, Inc. | Data driven relational algorithm formation for execution against big data |
| US20160063226A1 (en) | 2014-09-03 | 2016-03-03 | Microsoft Corporation | Shared Session Techniques |
| US9495522B2 (en) | 2014-09-03 | 2016-11-15 | Microsoft Technology Licensing, Llc | Shared session techniques |
| US20160080404A1 (en) | 2014-09-14 | 2016-03-17 | Cisco Technology, Inc. | Detection of malicious network connections |
| US20160110434A1 (en) | 2014-10-17 | 2016-04-21 | Vmware, Inc. | Method and system that determine whether or not two graph-like representations of two systems describe equivalent systems |
| US9596253B2 (en) | 2014-10-30 | 2017-03-14 | Splunk Inc. | Capture triggers for capturing network data |
| US10237254B2 (en) | 2014-11-13 | 2019-03-19 | Mcafee, Llc | Conditional login promotion |
| US20160330183A1 (en) | 2014-11-13 | 2016-11-10 | Mcafee, Inc. | Conditional login promotion |
| US20160149937A1 (en) | 2014-11-25 | 2016-05-26 | enSilo Ltd. | Systems and methods for malicious code detection |
| US20160205125A1 (en) | 2015-01-14 | 2016-07-14 | Korea Internet & Security Agency | System and method for analyzing mobile cyber incident |
| US20160218911A1 (en) | 2015-01-26 | 2016-07-28 | CENX, Inc. | Systems and methods for correlating alarms in a network |
| US10033611B1 (en) | 2015-02-06 | 2018-07-24 | HCA Holdings, Inc. | Transaction lifecycle management |
| US9749339B2 (en) | 2015-02-24 | 2017-08-29 | Raytheon Company | Proactive emerging threat detection |
| US20160261544A1 (en) | 2015-03-02 | 2016-09-08 | Linkedln Corporation | Increasing interaction between clusters with low connectivity in a social network |
| US9654503B1 (en) | 2015-03-11 | 2017-05-16 | Symantec Corporation | Systems and methods for evaluating networks |
| US20160277355A1 (en) * | 2015-03-18 | 2016-09-22 | Cisco Technology, Inc. | Inter-pod traffic redirection and handling in a multi-pod network environment |
| US10122740B1 (en) | 2015-05-05 | 2018-11-06 | F5 Networks, Inc. | Methods for establishing anomaly detection configurations and identifying anomalous network traffic and devices thereof |
| US10505818B1 (en) | 2015-05-05 | 2019-12-10 | F5 Networks. Inc. | Methods for analyzing and load balancing based on server health and devices thereof |
| US20190149553A1 (en) | 2015-05-07 | 2019-05-16 | Alibaba Group Holding Limited | Method, device and server for managing user login sessions |
| US10182058B2 (en) | 2015-05-07 | 2019-01-15 | Alibaba Group Holding Limited | Method, device and server for managing user login sessions |
| US20160330206A1 (en) | 2015-05-07 | 2016-11-10 | Alibaba Group Holding Limited | Method, device and server for managing user login sessions |
| US10791131B2 (en) | 2015-05-28 | 2020-09-29 | Hewlett Packard Enterprise Development Lp | Processing network data using a graph data structure |
| US20160359872A1 (en) | 2015-06-05 | 2016-12-08 | Cisco Technology, Inc. | System for monitoring and managing datacenters |
| US20160359592A1 (en) | 2015-06-05 | 2016-12-08 | Cisco Technology, Inc. | Techniques for determining network anomalies in data center networks |
| US20190259033A1 (en) | 2015-06-20 | 2019-08-22 | Quantiply Corporation | System and method for using a data genome to identify suspicious financial transactions |
| US9946800B2 (en) | 2015-07-06 | 2018-04-17 | International Business Machines Corporation | Ranking related objects using blink model based relation strength determinations |
| US10149148B2 (en) | 2015-08-13 | 2018-12-04 | Google Llc | Reducing data use in limited data environment |
| US20170353853A1 (en) | 2015-08-13 | 2017-12-07 | Google Inc. | Reducing data use in limited data environment |
| US9853968B2 (en) | 2015-08-19 | 2017-12-26 | Winifred Shen | Systems and methods for authenticating users accessing a secure network with one-session-only, on-demand login credentials |
| US9596254B1 (en) | 2015-08-31 | 2017-03-14 | Splunk Inc. | Event mini-graphs in data intake stage of machine data processing platform |
| US9516053B1 (en) | 2015-08-31 | 2016-12-06 | Splunk Inc. | Network security threat detection by user/user-entity behavioral analysis |
| US20190342311A1 (en) | 2015-08-31 | 2019-11-07 | Splunk Inc. | Processing anomaly data to identify threats to network security |
| US10911470B2 (en) | 2015-08-31 | 2021-02-02 | Splunk Inc. | Detecting anomalies in a computer network based on usage similarity scores |
| US20170063908A1 (en) | 2015-08-31 | 2017-03-02 | Splunk Inc. | Sharing Model State Between Real-Time and Batch Paths in Network Security Anomaly Detection |
| US20170063912A1 (en) | 2015-08-31 | 2017-03-02 | Splunk Inc. | Event mini-graphs in data intake stage of machine data processing platform |
| US20170063910A1 (en) | 2015-08-31 | 2017-03-02 | Splunk Inc. | Enterprise security graph |
| US11575693B1 (en) | 2015-08-31 | 2023-02-07 | Splunk Inc. | Composite relationship graph for network security |
| US10904270B2 (en) | 2015-08-31 | 2021-01-26 | Splunk Inc. | Enterprise security graph |
| US20170063906A1 (en) | 2015-08-31 | 2017-03-02 | Splunk Inc. | Complex event processing of computer network data |
| US20170076206A1 (en) | 2015-09-16 | 2017-03-16 | International Business Machines Corporation | Cognitive Operations Based on Empirically Constructed Knowledge Graphs |
| US10664757B2 (en) | 2015-09-16 | 2020-05-26 | International Business Machines Corporation | Cognitive operations based on empirically constructed knowledge graphs |
| US20170086069A1 (en) | 2015-09-21 | 2017-03-23 | Lawrence Liu | System and Method of Authentication by Leveraging Mobile Devices for Expediting User Login and Registration Processes Online |
| US9923911B2 (en) | 2015-10-08 | 2018-03-20 | Cisco Technology, Inc. | Anomaly detection supporting new application deployments |
| US10599718B2 (en) | 2015-10-09 | 2020-03-24 | Software Ag | Systems and/or methods for graph based declarative mapping |
| US20170111245A1 (en) | 2015-10-14 | 2017-04-20 | International Business Machines Corporation | Process traces clustering: a heterogeneous information network approach |
| US20170116315A1 (en) | 2015-10-21 | 2017-04-27 | International Business Machines Corporation | Fast path traversal in a relational database-based graph structure |
| US20170118240A1 (en) | 2015-10-21 | 2017-04-27 | E8 Security, Inc. | Detecting security threats in a local network |
| US10389742B2 (en) | 2015-10-21 | 2019-08-20 | Vmware, Inc. | Security feature extraction for a network |
| US20190222597A1 (en) | 2015-10-28 | 2019-07-18 | Fractal Industries, Inc. | System and method for comprehensive data loss prevention and compliance management |
| US20170147646A1 (en) | 2015-11-23 | 2017-05-25 | Sap Se | Conversion of Model Views Into Relational Models |
| US20200404008A1 (en) | 2015-12-07 | 2020-12-24 | Prismo Systems Inc. | Systems and Methods for Detecting and Responding to Security Threats Using Application Execution and Connection Lineage Tracing |
| US10812497B2 (en) | 2015-12-07 | 2020-10-20 | Prismo Systems Inc. | Systems and methods for detecting and responding to security threats using application execution and connection lineage tracing |
| US20170163666A1 (en) | 2015-12-07 | 2017-06-08 | Prismo Systems Inc. | Systems and Methods for Detecting and Responding To Security Threats Using Application Execution and Connection Lineage Tracing |
| US10510007B2 (en) | 2015-12-15 | 2019-12-17 | Tata Consultancy Services Limited | Systems and methods for generating performance prediction model and estimating execution time for applications |
| US10904007B2 (en) | 2015-12-23 | 2021-01-26 | Kt Corporation | Authentication device based on biometric information, control server connected to the same, and login method based on biometric information thereof |
| US10382529B2 (en) | 2016-01-29 | 2019-08-13 | Nicira, Inc. | Directed graph based span computation and configuration dispatching |
| US20190028327A1 (en) | 2016-02-11 | 2019-01-24 | Xieon Networks S.A.R.L. | Service-based loss forwarding in communication networks |
| US20180357422A1 (en) | 2016-02-25 | 2018-12-13 | Sas Institute Inc. | Simulated attack generator for testing a cybersecurity system |
| US20170251013A1 (en) | 2016-02-26 | 2017-08-31 | Oracle International Corporation | Techniques for discovering and managing security of applications |
| US10249266B2 (en) | 2016-02-29 | 2019-04-02 | Vmware, Inc. | Preserving desktop state across login sessions |
| US20170249069A1 (en) | 2016-02-29 | 2017-08-31 | Vmware, Inc. | Preserving desktop state across login sessions |
| US20170257358A1 (en) | 2016-03-04 | 2017-09-07 | ShoCard, Inc. | Method and System for Authenticated Login Using Static or Dynamic Codes |
| US10587609B2 (en) | 2016-03-04 | 2020-03-10 | ShoCard, Inc. | Method and system for authenticated login using static or dynamic codes |
| US20170262521A1 (en) | 2016-03-11 | 2017-09-14 | Linkedin Corporation | Partitioning and replicating data in scalable distributed data stores |
| US20170272344A1 (en) | 2016-03-17 | 2017-09-21 | Nec Laboratories America, Inc. | Real-Time Detection of Abnormal Network Connections in Streaming Data |
| US20170277553A1 (en) | 2016-03-22 | 2017-09-28 | Vmware, Inc. | Anomalous usage of resources by a process in a software defined data center |
| US20170277997A1 (en) | 2016-03-23 | 2017-09-28 | Nec Laboratories America, Inc. | Invariants Modeling and Detection for Heterogeneous Logs |
| US20170279827A1 (en) | 2016-03-24 | 2017-09-28 | Cisco Technology, Inc. | Edge-based detection of new and unexpected flows |
| US20170286190A1 (en) | 2016-03-31 | 2017-10-05 | International Business Machines Corporation | Structural and temporal semantics heterogeneous information network (hin) for process trace clustering |
| US10656979B2 (en) | 2016-03-31 | 2020-05-19 | International Business Machines Corporation | Structural and temporal semantics heterogeneous information network (HIN) for process trace clustering |
| US20170288974A1 (en) | 2016-04-04 | 2017-10-05 | Nec Laboratories America, Inc. | Graph-based fusing of heterogeneous alerts |
| US11036800B1 (en) | 2016-04-29 | 2021-06-15 | Veritas Technologies Llc | Systems and methods for clustering data to improve data analytics |
| US9558265B1 (en) | 2016-05-12 | 2017-01-31 | Quid, Inc. | Facilitating targeted analysis via graph generation based on an influencing parameter |
| US10496678B1 (en) | 2016-05-12 | 2019-12-03 | Federal Home Loan Mortgage Corporation (Freddie Mac) | Systems and methods for generating and implementing knowledge graphs for knowledge representation and analysis |
| US10824813B2 (en) | 2016-05-19 | 2020-11-03 | Quid Inc. | Pivoting from a graph of semantic similarity of documents to a derivative graph of relationships between entities mentioned in the documents |
| US20170337262A1 (en) | 2016-05-19 | 2017-11-23 | Quid, Inc. | Pivoting from a graph of semantic similarity of documents to a derivative graph of relationships between entities mentioned in the documents |
| US20170359361A1 (en) | 2016-06-09 | 2017-12-14 | Adobe Systems Incorporated | Selecting representative metrics datasets for efficient detection of anomalous data |
| US20180020015A1 (en) | 2016-06-14 | 2018-01-18 | Sdn Systems, Llc | System and method for automated network monitoring and detection of network anomalies |
| US20170366492A1 (en) | 2016-06-20 | 2017-12-21 | Huawei Technologies Co., Ltd. | System and Method for Messaging Between Operating System Containers |
| US10885452B1 (en) | 2016-06-27 | 2021-01-05 | Amazon Technologies, Inc. | Relation graph optimization using inconsistent cycle detection |
| US10121000B1 (en) | 2016-06-28 | 2018-11-06 | Fireeye, Inc. | System and method to detect premium attacks on electronic networks and electronic devices |
| US10382303B2 (en) | 2016-07-11 | 2019-08-13 | Extrahop Networks, Inc. | Anomaly detection using device relationship graphs |
| US9729416B1 (en) | 2016-07-11 | 2017-08-08 | Extrahop Networks, Inc. | Anomaly detection using device relationship graphs |
| US20180013650A1 (en) | 2016-07-11 | 2018-01-11 | Extrahop Networks, Inc. | Anomaly detection using device relationship graphs |
| US10797974B2 (en) | 2016-07-12 | 2020-10-06 | At&T Intellectual Property I, L.P. | Enterprise server behavior profiling |
| US20180019932A1 (en) | 2016-07-12 | 2018-01-18 | At&T Intellectual Property I, L.P. | Enterprise server behavior profiling |
| US20190312796A1 (en) | 2016-07-12 | 2019-10-10 | At&T Intellectual Property I, L.P. | Enterprise server behavior profiling |
| US10367704B2 (en) | 2016-07-12 | 2019-07-30 | At&T Intellectual Property I, L.P. | Enterprise server behavior profiling |
| US20180025361A1 (en) | 2016-07-19 | 2018-01-25 | Ca, Inc. | Database management methods, systems, and devices for identifying related customer support tickets |
| US20180034840A1 (en) | 2016-07-29 | 2018-02-01 | Accenture Global Solutions Limited | Network security analysis system |
| US20180039688A1 (en) | 2016-08-05 | 2018-02-08 | Linkedin Corporation | Data flow based feature vector clustering |
| US10592535B2 (en) | 2016-08-05 | 2020-03-17 | Microsoft Technology Licensing, Llc | Data flow based feature vector clustering |
| US9787705B1 (en) | 2016-08-19 | 2017-10-10 | Quid, Inc. | Extracting insightful nodes from graphs |
| US20200175042A1 (en) | 2016-08-25 | 2020-06-04 | Cyber Atomics, Inc. | Efficient data clustering |
| US20180063178A1 (en) | 2016-09-01 | 2018-03-01 | Promithius Inc. | Method and systems for real-time internal network threat detection and enforcement |
| US20180069885A1 (en) | 2016-09-06 | 2018-03-08 | Accenture Global Solutions Limited | Graph database analysis for network anomaly detection systems |
| US10331659B2 (en) | 2016-09-06 | 2019-06-25 | International Business Machines Corporation | Automatic detection and cleansing of erroneous concepts in an aggregated knowledge base |
| US20180067981A1 (en) | 2016-09-06 | 2018-03-08 | International Business Machines Corporation | Automatic Detection and Cleansing of Erroneous Concepts in an Aggregated Knowledge Base |
| US9836183B1 (en) | 2016-09-14 | 2017-12-05 | Quid, Inc. | Summarized network graph for semantic similarity graphs of large corpora |
| US20190364067A1 (en) | 2016-09-20 | 2019-11-28 | F5 Networks, Inc. | Methods for detecting and mitigating malicious network behavior and devices thereof |
| US20180084069A1 (en) | 2016-09-22 | 2018-03-22 | Microsoft Technology Licensing, Llc. | Establishing user's presence on internal on-premises network over time using network signals |
| US20180097793A1 (en) | 2016-09-30 | 2018-04-05 | Ca, Inc. | Secondary authentication using user's login status |
| US20180096047A1 (en) | 2016-10-05 | 2018-04-05 | International Business Machines Corporation | Detecting clusters and relationships in large data sets |
| US10515095B2 (en) | 2016-10-05 | 2019-12-24 | International Business Machines Corporation | Detecting clusters and relationships in large data sets |
| US20180103052A1 (en) | 2016-10-11 | 2018-04-12 | Battelle Memorial Institute | System and methods for automated detection, reasoning and recommendations for resilient cyber systems |
| US20180115578A1 (en) | 2016-10-26 | 2018-04-26 | Elastic Beam, Inc. | Methods and systems for deep learning based api traffic security |
| US20180123864A1 (en) | 2016-11-02 | 2018-05-03 | Servicenow, Inc. | Network Event Grouping |
| US10447526B2 (en) | 2016-11-02 | 2019-10-15 | Servicenow, Inc. | Network event grouping |
| US20180137858A1 (en) | 2016-11-17 | 2018-05-17 | BrainofT Inc. | Controlling connected devices using a relationship graph |
| US20180174062A1 (en) | 2016-12-21 | 2018-06-21 | Ca, Inc. | Root cause analysis for sequences of datacenter states |
| US10142357B1 (en) | 2016-12-21 | 2018-11-27 | Symantec Corporation | Systems and methods for preventing malicious network connections using correlation-based anomaly detection |
| US20180173789A1 (en) | 2016-12-21 | 2018-06-21 | Ca, Inc. | Descriptive datacenter state comparison |
| US20180181750A1 (en) | 2016-12-22 | 2018-06-28 | X Development Llc | Computer telemetry analysis |
| US10685295B1 (en) | 2016-12-29 | 2020-06-16 | X Development Llc | Allocating resources for a machine learning model |
| US10496263B2 (en) | 2017-01-03 | 2019-12-03 | Jpmorgan Chase Bank, N.A. | De-anonymization of website visitor identity |
| US20190342282A1 (en) | 2017-01-20 | 2019-11-07 | Google Llc | Multi-User Login Session |
| US20200287927A1 (en) | 2017-01-30 | 2020-09-10 | Splunk Inc. | Anomaly detection based on changes in an entity relationship graph |
| US20190158524A1 (en) | 2017-01-30 | 2019-05-23 | Splunk Inc. | Anomaly detection based on information technology environment topology |
| US10237294B1 (en) | 2017-01-30 | 2019-03-19 | Splunk Inc. | Fingerprinting entities based on activity in an information technology environment |
| US10701051B2 (en) | 2017-02-08 | 2020-06-30 | Casio Computer Co., Ltd. | Authentication device and computer-readable recording medium |
| US20180227286A1 (en) | 2017-02-08 | 2018-08-09 | Casio Computer Co., Ltd. | Authentication device and computer-readable recording medium |
| US10565373B1 (en) | 2017-02-21 | 2020-02-18 | Ca, Inc. | Behavioral analysis of scripting utility usage in an enterprise |
| US10205736B2 (en) | 2017-02-27 | 2019-02-12 | Catbird Networks, Inc. | Behavioral baselining of network systems |
| US20180248901A1 (en) | 2017-02-27 | 2018-08-30 | Catbird Networks, Inc. | Behavioral baselining of network systems |
| US10754940B2 (en) | 2017-03-06 | 2020-08-25 | Casio Computer Co., Ltd. | Authentication device and computer-readable recording medium |
| US20180268078A1 (en) | 2017-03-16 | 2018-09-20 | Raytheon Company | Quantifying consistency of a system architecture by comparing analyses of property graph data models representing different versions of the system architecture |
| US20180288063A1 (en) | 2017-03-31 | 2018-10-04 | Oracle International Corporation | Mechanisms for anomaly detection and access management |
| US20200065857A1 (en) | 2017-05-11 | 2020-02-27 | Hubspot, Inc. | Methods and systems for automated generation of personalized messages |
| US20180329958A1 (en) | 2017-05-12 | 2018-11-15 | Battelle Memorial Institute | Performance and usability enhancements for continuous subgraph matching queries on graph-structured data |
| US20180336353A1 (en) | 2017-05-16 | 2018-11-22 | Entit Software Llc | Risk scores for entities |
| US10339309B1 (en) | 2017-06-09 | 2019-07-02 | Bank Of America Corporation | System for identifying anomalies in an information system |
| US20180367548A1 (en) | 2017-06-14 | 2018-12-20 | Microsoft Technology Licensing, Llc | Detecting malicious lateral movement across a computer network |
| US10419468B2 (en) | 2017-07-11 | 2019-09-17 | The Boeing Company | Cyber security system with adaptive machine learning features |
| US10798159B2 (en) * | 2017-07-26 | 2020-10-06 | Netapp, Inc. | Methods for managing workload throughput in a storage system and devices thereof |
| US10521584B1 (en) | 2017-08-28 | 2019-12-31 | Amazon Technologies, Inc. | Computer threat analysis service |
| US20190068505A1 (en) * | 2017-08-31 | 2019-02-28 | Microsoft Technology Licensing, Llc | Non-dsr distributed load balancer with virtualized vips and source proxy on load balanced connection |
| US20190109870A1 (en) | 2017-09-14 | 2019-04-11 | Commvault Systems, Inc. | Ransomware detection and intelligent restore |
| US10642867B2 (en) | 2017-09-15 | 2020-05-05 | Adobe Inc. | Clustering based on a directed graph |
| US20190087480A1 (en) | 2017-09-15 | 2019-03-21 | Adobe Systems Incorporated | Clustering based on a directed graph |
| US20190102280A1 (en) * | 2017-09-30 | 2019-04-04 | Oracle International Corporation | Real-time debugging instances in a deployed container platform |
| US20200080856A1 (en) | 2017-10-19 | 2020-03-12 | rideOS | System and method for routing in a ride-share transportation network |
| US10775183B2 (en) | 2017-10-19 | 2020-09-15 | rideOS, Inc. | System and method for routing in a ride-share transportation network |
| US20190132224A1 (en) | 2017-10-26 | 2019-05-02 | Accenture Global Solutions Limited | Systems and methods for identifying and mitigating outlier network activity |
| US10824675B2 (en) | 2017-11-17 | 2020-11-03 | Microsoft Technology Licensing, Llc | Resource-efficient generation of a knowledge graph |
| US10419469B1 (en) | 2017-11-27 | 2019-09-17 | Lacework Inc. | Graph-based user tracking and threat detection |
| US10581891B1 (en) | 2017-11-27 | 2020-03-03 | Lacework Inc. | Using graph-based models to identify datacenter anomalies |
| US10986114B1 (en) | 2017-11-27 | 2021-04-20 | Lacework Inc. | Graph-based user tracking and threat detection |
| US10425437B1 (en) | 2017-11-27 | 2019-09-24 | Lacework Inc. | Extended user session tracking |
| US20190212998A1 (en) * | 2018-01-11 | 2019-07-11 | Robin Systems, Inc. | Implementing Application Entrypoints With Containers of a Bundled Application |
| US20190273683A1 (en) * | 2018-03-01 | 2019-09-05 | Nicira, Inc. | Generic communication channel for information exchange between a hypervisor and a virtual machine |
| US20190339965A1 (en) | 2018-05-07 | 2019-11-07 | Oracle International Corporation | Method for automatically selecting configuration clustering parameters |
| US10735329B2 (en) | 2018-05-11 | 2020-08-04 | Huazhong University Of Science And Technology | Container communication method and system for parallel applications |
| US20190349305A1 (en) | 2018-05-11 | 2019-11-14 | Huazhong University Of Science And Technology | Container communication method and system for parallel applications |
| US20190379590A1 (en) * | 2018-06-06 | 2019-12-12 | Servicenow, Inc. | Discovery and Mapping of Containerized Software Applications |
| US20190378050A1 (en) | 2018-06-12 | 2019-12-12 | Bank Of America Corporation | Machine learning system to identify and optimize features based on historical data, known patterns, or emerging patterns |
| US20190042879A1 (en) | 2018-06-26 | 2019-02-07 | Intel Corporation | Entropic clustering of objects |
| US20200311644A1 (en) | 2018-07-19 | 2020-10-01 | America's Collectibles Network, Inc. | System and method for performing bulk pick of items of a customer order |
| US10594718B1 (en) | 2018-08-21 | 2020-03-17 | Extrahop Networks, Inc. | Managing incident response operations based on monitored network activity |
| US20200074341A1 (en) | 2018-08-30 | 2020-03-05 | NEC Laboratories Europe GmbH | Method and system for scalable multi-task learning with convex clustering |
| US20200076685A1 (en) | 2018-08-30 | 2020-03-05 | Juniper Networks, Inc. | Multiple networks for virtual execution elements |
| US10708082B1 (en) | 2018-08-31 | 2020-07-07 | Juniper Networks, Inc. | Unified control plane for nested clusters in a virtualized computing infrastructure |
| US20200192690A1 (en) | 2018-12-14 | 2020-06-18 | Hewlett Packard Enterprise Development Lp | Application deployment in a container management system |
| US11431735B2 (en) | 2019-01-28 | 2022-08-30 | Orca Security LTD. | Techniques for securing virtual machines |
| US20210329019A1 (en) | 2019-01-28 | 2021-10-21 | Orca Security LTD. | Techniques for securing virtual machines |
| US20210336976A1 (en) | 2019-01-28 | 2021-10-28 | Orca Security LTD. | Techniques for securing virtual machines |
| US20210377287A1 (en) | 2019-01-28 | 2021-12-02 | Orca Security LTD. | Techniques for securing virtual cloud assets at rest against cyber threats |
| US20200252376A1 (en) | 2019-02-01 | 2020-08-06 | NeuVector, Inc. | Network context monitoring within service mesh containerization environment |
| US20200272740A1 (en) | 2019-02-27 | 2020-08-27 | Optum Services (Ireland) Limited | Anomalous activity detection in multi-provider transactional environments |
| US20200278892A1 (en) | 2019-02-28 | 2020-09-03 | Cisco Technology, Inc. | Remote smart nic-based service acceleration |
| US20200280592A1 (en) | 2019-03-01 | 2020-09-03 | Netskope, Inc. | Recovery From Failure in a Dynamic Scalable Services Mesh |
| US20200403860A1 (en) | 2019-06-19 | 2020-12-24 | Centurylink Intellectual Property Llc | Edge Database Management of The Network Data Plane |
| US20210328858A1 (en) * | 2020-04-16 | 2021-10-21 | Ribbon Communications Operating Company, Inc. | Communications methods and apparatus for migrating a network interface and/or ip address from one pod to another pod in a kubernetes system |
| US20220247647A1 (en) * | 2021-01-29 | 2022-08-04 | Tigera, Inc. | Network traffic graph |
| US20220345483A1 (en) | 2021-04-26 | 2022-10-27 | Orca Security LTD. | Prioritizing internet-accessible workloads for cyber security |
| US20220345481A1 (en) | 2021-04-26 | 2022-10-27 | Orca Security | Systems and Methods for Disparate Risk Information Aggregation |
| US20220345480A1 (en) | 2021-04-26 | 2022-10-27 | Orca Security LTD. | Systems and methods for managing cyber vulnerabilities |
| US20220342690A1 (en) | 2021-04-26 | 2022-10-27 | Orca Security | Forward and Rearward Facing Attack Vector Visualization |
| US11489863B1 (en) | 2021-04-26 | 2022-11-01 | Orca Security LTD. | Foundation of sidescanning |
| US20220350931A1 (en) | 2021-04-26 | 2022-11-03 | Orca Security LTD. | Hybrid deployment of ephemeral scanners (as amended) |
Non-Patent Citations (28)
| Title |
|---|
| Ai-Yaseen, et al.,"Real-time intrusion detection system using multi-agent system", IAENG International Journal of Computer Science 43, No. 1 (2016): 80-90. |
| Akoglu, et al.,"Graph-based Anomaly Detection and Description: A Survey", Apr. 28, 2014. |
| Amidon, et al., "Program Fracture and Recombination for Efficient Automatic Code Reuse", 2015 IEEE High Performance Extreme Computing Conference (HPEC), (2015), pp. 1-6, doi: 10.1109/HPEC.2015.7396314. |
| Ammar, et al.,"Query Optimization Techniques in Graph Databases", International Journal of Database Management Systems (IIDMS), vol. 8, No. 4, Aug. 2016, pp. 1-14 (Year: 2016). |
| Balasubramaniyan, et al.,"An architecture for intrusion detection using autonomous agents", in Proceedings 14th annual computer security applications conference {Cal. No. 98EX217), pp. 13-24. IEEE, 1998. |
| Beutel, et al.,User Behavior Modeling with Large-Scale Graph Analysis, Computer Science Department, Carnegie Mellon University, May 2016. |
| Bugiel, et al.,"Towards Taming Privilege-Escalation Attacks on Android", in NOSS (vol. 17, p. 19). Feb. 2012. |
| Chang, et al.,"Reality bites-progressive querying and result visualization in logical and VR spaces", doi: 10.1109NL.1994.363635, 1994, pp. 100-109 (year 1994). |
| Chesson, et al.,"Communication and control in a cluster network", ACM '74: Proceedings of the 1974 annual ACM conference—vol. 2, Jan. 1974, pp. 509-514, http://doi.org/101145/1408839 (Year 1974). |
| Crosbie, et al.,"Defending a computer system using autonomous agents", Department of Computer Science Technical Reports, Paper 1200, (1995). |
| Hautamaki, et al.,"Outlier detection using k-nearest neighbour graph", Proceedings ofthe 17th International Conference on Pattern Recognition, 2004. ICPR 2004. vol. 3. IEEE, 2004. |
| Hooper, et al.,"Medusa: a simple tool for interaction graph analysis", Bioinformatics, vol. 21 No. 24, 2005, pp. 1432-4433. {Year: 2005). |
| Koutra, et al.,"Exploring and Making Sense of Large Graphs", Computer Science Department, Carnegie Mellon University, Aug. 2015. |
| Leopold, et al.,"A visual query system for the specification and scientific analysis of continual queries", doi: 10.1109/HCC.2001.995260, 2001, pp. 203-211, (Year: 2001). |
| Liao, et al.,"Visualizing graph dynamics and similarity for enterprise network security and management", Proceedings of the seventh international symposium on visualization for cyber security. ACM, 2010. |
| Long, et al., Automatic Input Rectification, 2012 34th International Conference on Software Engineering (ICSE), (2012), pp. 80-90, doi: 10.1109/ICSE.2012.6227204. |
| Mateescu, et al.,"Join-Graph Propagatio Algorithm", Journal of Artificial Intelligence Research 37, 2010, pp. 279-328. (Year: 2010). |
| Moriano, et al.,"Insider Threat Event Detection in User-System Interactions", MIST '17: Proceedings of the 2017 International Workshop on Managing Insider Security Threats, Oct. 2017, pp. 1-12 https://doi.Jrg/10.1145/3139923.3139928 (Year: 2017). |
| Perkins, et al., "Automatically Patching Errors in Deployed Software", SOSP '09: Proceedings of the ACM SIGOPS 22nd symposium on Operating systems principles, Oct. 2009, p. 87-102, https://doi.org/10.1145/1629575.1629585. |
| Ranshous, et al.,"Anomaly detection in dynamic networks: a survey", WIREs Comput Stat, May/Jun. 2015. |
| Rinard, "Living in the Comfort Zone", OOPSLA'07, Oct. 21-25, 2007, Montreal, Quebec, Canada, pp. 611-622. |
| Rinard, "Manipulating Program Functionality to Eliminate Security Vulnerabilities", Moving Target Defense. Springer, New York, NY, (2011). pp. 109-115. |
| Samuel, et al., Let's Parse to Prevent Pwnage Invited Position Paper, LEET'12: Proceedings of the 5th USENIX conference on Large-Scale Exploits and Emergent Threats, Apr. 2012, pp. 3-6. |
| Shen, et al., "Active Learning for Inference and Regeneration of Applications that Access Databases", ACM Trans. Program. Lang. Syst. 42, 4, Article 18 (Jan. 2021), 119 pages, https://doi.org/10.1145/3430952. |
| Tamassia, et al.,"Graph drawing for security visualization", International Symposium on Graph Drawing. Springer, Berlin, Heidelberg, 2008. |
| Vaas, et al.,"Detecting disguised processes using application-behavior profiling", in 2017 IEEE International Symposium on Technologies for Homeland Security {HST), pp. 1-6. IEEE, 2017. |
| Vasilakis, et al., "Supply-Chain Vulnerability Elimination via Active Learning and Regeneration", Proceedings of the 2021 ACM SIGSAC Conference on Computer and Communications Security (CCS '21), Nov. 15-19, 2021, Virtual Event, Republic of Korea. ACM, New York, NY, USA, 16 pages, https://doi.org/10.1145/3460120.3484736. |
| Yu, et al.,"Recommending Join Queries Based on Path Frequency", IEEE, doi: 10.1109/WISA.2015.52, 2015, pp. 21-26. {Year: 2015). |
Cited By (7)
| Publication number | Priority date | Publication date | Assignee | Title |
|---|---|---|---|---|
| US20240039914A1 (en) * | 2020-06-29 | 2024-02-01 | Cyral Inc. | Non-in line data monitoring and security services |
| US20220131880A1 (en) * | 2020-10-27 | 2022-04-28 | Level 3 Communications, Llc | Autonomous network security scaling |
| US20230283595A1 (en) * | 2021-06-28 | 2023-09-07 | Cisco Technology, Inc. | Dynamic proxy response from application container |
| US20230275912A1 (en) * | 2022-02-25 | 2023-08-31 | Microsoft Technology Licensing, Llc | Graph-based analysis of security incidents |
| US20230336554A1 (en) * | 2022-04-13 | 2023-10-19 | Wiz, Inc. | Techniques for analyzing external exposure in cloud environments |
| US20230336550A1 (en) * | 2022-04-13 | 2023-10-19 | Wiz, Inc. | Techniques for detecting resources without authentication using exposure analysis |
| US20230336578A1 (en) * | 2022-04-13 | 2023-10-19 | Wiz, Inc. | Techniques for active inspection of vulnerability exploitation using exposure analysis |
Similar Documents
| Publication | Publication Date | Title |
|---|---|---|
| US11882141B1 (en) | Graph-based query composition for monitoring an environment | |
| US11785104B2 (en) | Learning from similar cloud deployments | |
| US11849000B2 (en) | Using real-time monitoring to inform static analysis | |
| US20220329616A1 (en) | Using static analysis for vulnerability detection | |
| US11741238B2 (en) | Dynamically generating monitoring tools for software applications | |
| US20220311794A1 (en) | Monitoring a software development pipeline | |
| US11916947B2 (en) | Generating user-specific polygraphs for network activity | |
| US11909752B1 (en) | Detecting deviations from typical user behavior | |
| US11895135B2 (en) | Detecting anomalous behavior of a device | |
| US11894984B2 (en) | Configuring cloud deployments based on learnings obtained by monitoring other cloud deployments | |
| US11792284B1 (en) | Using data transformations for monitoring a cloud compute environment | |
| US20230075355A1 (en) | Monitoring a Cloud Environment | |
| US11765249B2 (en) | Facilitating developer efficiency and application quality | |
| US11770398B1 (en) | Guided anomaly detection framework | |
| US20220303295A1 (en) | Annotating changes in software across computing environments | |
| US20220224707A1 (en) | Establishing a location profile for a user device | |
| US20230254330A1 (en) | Distinguishing user-initiated activity from application-initiated activity | |
| US20220360600A1 (en) | Agentless Workload Assessment by a Data Platform | |
| US20220294816A1 (en) | Ingesting event data into a data warehouse | |
| US20230275917A1 (en) | Identifying An Attack Surface Of A Cloud Deployment | |
| US20230319092A1 (en) | Offline Workflows In An Edge-Based Data Platform | |
| US20230328086A1 (en) | Detecting Anomalous Behavior Using A Browser Extension | |
| US11818156B1 (en) | Data lake-enabled security platform | |
| WO2023081098A1 (en) | Agentless workload assessment by a data platform | |
| WO2023034444A1 (en) | Generating user-specific polygraphs for network activity |
Legal Events
| Date | Code | Title | Description |
|---|---|---|---|
| FEPP | Fee payment procedure |
Free format text: ENTITY STATUS SET TO UNDISCOUNTED (ORIGINAL EVENT CODE: BIG.); ENTITY STATUS OF PATENT OWNER: LARGE ENTITY |
|
| STCF | Information on status: patent grant |
Free format text: PATENTED CASE |