WO2012029900A1 - Lc-maldiで得られたデータの比較解析方法 - Google Patents
Lc-maldiで得られたデータの比較解析方法 Download PDFInfo
- Publication number
- WO2012029900A1 WO2012029900A1 PCT/JP2011/069885 JP2011069885W WO2012029900A1 WO 2012029900 A1 WO2012029900 A1 WO 2012029900A1 JP 2011069885 W JP2011069885 W JP 2011069885W WO 2012029900 A1 WO2012029900 A1 WO 2012029900A1
- Authority
- WO
- WIPO (PCT)
- Prior art keywords
- sample
- precursor
- precursor ions
- ions
- determined
- Prior art date
- Legal status (The legal status is an assumption and is not a legal conclusion. Google has not performed a legal analysis and makes no representation as to the accuracy of the status listed.)
- Ceased
Links
Images

Classifications
-
- H—ELECTRICITY
- H01—ELECTRIC ELEMENTS
- H01J—ELECTRIC DISCHARGE TUBES OR DISCHARGE LAMPS
- H01J49/00—Particle spectrometers or separator tubes
- H01J49/0027—Methods for using particle spectrometers
- H01J49/0036—Step by step routines describing the handling of the data generated during a measurement
Definitions
- the present invention relates to a method for analyzing data acquired by matrix-assisted laser desorption / ionization mass spectrometry (hereinafter sometimes abbreviated as MALDI-MS) using liquid chromatography as a pretreatment.
- MALDI-MS matrix-assisted laser desorption / ionization mass spectrometry
- MS mass spectrometers
- MALDI matrix-assisted laser desorption ionization
- a reagent called a matrix is mixed with an analysis sample, and a laser is applied to the reagent to ionize matrix molecules and sample molecules.
- the matrix effectively absorbs the energy of the laser and assists ionization of the sample molecules.
- the matrix After the matrix is dissolved in the solvent, it is crystallized together with the analysis sample on a conductive plate called a MALDI sample plate.
- the sample plate is inserted into a sample chamber in the mass spectrometer, where the mixed crystal is irradiated with laser.
- Matrix molecules and analysis sample molecules ionized by the energy of the laser are separated according to the mass and electric charge in the mass analysis unit, and reach the detector.
- the detected charges are processed in time series to become a mass spectrum.
- Examples of the on-line system in which the chromatography and the mass spectrometer are directly connected include LC / MS to which a liquid chromatography device (hereinafter referred to as LC) is connected, and GC / MS to which a gas chromatography device (hereinafter referred to as GC) is connected.
- Electrospray ionization (ESI) and atmospheric pressure chemical ionization (APCI) methods are used for the ionization part of LC / MS, and electron impact ionization (EI) and chemical ionization (CI) methods are used for the ionization part of GC / MS. Is done. In general, when referring to LC / MS or GC / MS, these are directly connected devices.
- LC / MS adopting ESI method, etc. is excellent in throughput and completeness because liquid phase analysis samples separated by LC can be sequentially ionized and sent to the mass spectrometer. Therefore, LC / MS is often used for large-scale proteome analysis.
- LC / MS has a large market scale, and freeware (Non-Patent Document 1) and commercial software compatible with various analysis methods are published (Non-Patent Documents 2 and 3).
- LC-MALDI The advantage of LC-MALDI is that it is possible to perform proteomic analysis with high completeness using the popular MALDI-MS, and it is possible to separate LC and MALDI processes physically and temporally. In addition, it is possible to divide each process between distant laboratories and research institutions, to be able to repeatedly analyze the sample spotted on the MALDI sample plate, and to distribute ion to many wells to suppress the ionization characteristic peculiar to the MALDI method And that the MALDI method makes it difficult to generate multivalent ions, so that the interpretation and processing of the mass spectrum is easy.
- LC-MALDI LC-MALDI
- a fraction collector is required, the throughput is inferior to LC / MS due to the process of spotting and crystallization, and the sample is spotted together at a fixed volume.
- the resolution of LC elution time is lost and many peaks are included in one spectrum. For the same reason, accurate elution time information from LC is lost for each peak.
- TWiP As software specialized for LC-MALDI data analysis, there is TWiP (Non-patent Document 8) manufactured by DYNACOM. TWiP is software for expression level fluctuation analysis using LC-MALDI and the NBS reagent kit (Non-patent Document 9), which is an isotope reagent of Shimadzu Corporation. A sample to be analyzed and a reference sample are labeled with isotopes having different mass numbers, and a homologous peak is detected based on a mass difference to capture a quantitative change.
- the method based on TWiP and isotope labeling recognizes only the peptide fragments present in both the sample to be analyzed and the reference sample in order to recognize the paired peak expected from the mass difference.
- the presence of a specific peak that exists only in one sample is overlooked, which is the most significant difference between samples.
- An object of the present invention is to provide data analysis software using the system characteristics of LC-MALDI.
- TWiP only supports analysis of the primary mass spectrum of peptide fragments obtained by digesting proteins with trypsin or the like, so-called precursor ion spectrum.
- MS / MS tandem mass spectrometry
- PSD post-source decomposition
- CID collision-induced dissociation
- the present inventors have developed software for performing comparative analysis of a large amount of data obtained by combining LC-MALDI and MS / MS.
- the terms related to mass spectrometry are based on the mass spectrometry-related glossary (2009, ISBN IV 4-906661-02-2) edited by the Japan Mass Spectrometry Society.
- An exception is the use of a mass-to-charge ratio not recommended in the glossary for m / z, which is a dimensionless quantity obtained by dividing the mass of an ion by the unit of atomic mass and the number of charges of the ion. There is. This is because there is no term that expresses m / z descriptively in Japanese, and in view of the circumstances that have been treated by those skilled in the art as having an equivalent mass-to-charge ratio with m / z. Therefore, in this specification, the mass-to-charge ratio and m / z are used interchangeably.
- Precursor ion m / z The position on the sample plate where the precursor ion was obtained (specifically, the position of the well) 3) Product ion spectrum obtained by performing MS / MS on the precursor ion 4) m / z of the product ion group constituting the product ion spectrum 5) Peak intensity of the product ion group
- Precursor ion spectrum is a primary spectrum composed of ionized molecules by irradiating a sample spotted in each well of the MALDI sample plate with a laser.
- an ion selected as a target of MS / MS is called a precursor ion.
- the precursor ion is uniquely identified by the m / z of the ion and the position of the well from which the ion was obtained.
- a secondary spectrum obtained by performing MS / MS on a specific precursor ion is a product ion spectrum. Ions corresponding to individual peaks constituting the product ion spectrum are called product ions.
- a group of product ions derived from one precursor ion is referred to as a product ion group. It is assumed that the data to be the object of the method of the present invention includes information of contents 1) to 5) or contents equivalent thereto.
- the present inventors considered that such information is useful as a parameter for judging the homology of data obtained from LC-MALDI, and paid attention to it.
- the feature of the present invention is that the position on the sample plate from which the precursor ion is obtained is used as one of the parameters for determining homology.
- the position on the sample plate where the precursor ions were obtained reflects the time when the fraction collector spotted the droplet containing the precursor ions on the well, that is, the time when the precursor ions were eluted from the LC.
- the elution time is a factor uniquely determined from the physical properties of the precursor ion and the implementation conditions such as the column and extraction solvent used in the LC. Therefore, when the execution conditions are the same, the same precursor ion is expected to be contained in the same or in the vicinity of the well, although there are disturbances due to differences in the analysis sample itself. Therefore, the positional information on the sample plate is useful as a parameter for judging the homology of the precursor ions contained therein.
- Patent Document 1 JP-A-2009-156722 (Patent Document 1) and JP-A-2004-502934 (Patent Document 2), in LC-MALDI, the same component is present in several portions close to the LC retention time. It states that there is a possibility, but does not disclose any use or usefulness of the position information on the sample plate. In addition, since the location information on the sample plate is usually stored in the final MS / MS data, it is possible to improve the accuracy of homology determination using only the contents contained in the final MS / MS data. .
- the position information on the sample plate is used.
- the accuracy of the first step can be improved, the frequency of shifting to the comparison of the second step with a large amount of calculation can be reduced, and the time required for analysis can be shortened.
- brute force comparison between product ion groups is performed, so that the amount of calculation increases in proportion to the square of the number of product ions. By minimizing the number of times this is performed, it is possible to quickly analyze a large amount of data generated in the process of proteome analysis with less computer resources.
- the present inventors have established a method for determining the homology of data obtained from LC-MALDI. Furthermore, a method for collectively processing a large number of data has been established, and the present invention has been completed.
- the following method is provided.
- the fractions of the sample separated by liquid chromatography are spotted on the sample plate in a predetermined order at predetermined positions, and these fractions are subjected to a tandem mass spectrometer equipped with an ionization part by matrix-assisted laser desorption ionization.
- a precursor derived from a second sample relative to a position on a sample plate from which the precursor ion derived from the first sample is obtained. If the position on the sample plate from which the ions were acquired satisfies a predetermined relationship, and (2) the product ions of both precursor ions are compared, it is determined that both precursor ions are homologous.
- a method comprising the step of determining.
- a pair of precursor ions to be compared (where one precursor ion is obtained from the first sample and the other precursor ion is obtained from the second sample) is the requirement of the above (1) And the above requirement (2) is satisfied, it is determined that there is homology.
- the determination of the requirement (1) and the determination of the requirement (2) may be preceded.
- the determination of the requirement (2) is more appropriate for the determination of the requirement (2) as described above. This is preferable because the calculation amount is reduced.
- said step comprises (1) The position on the sample plate from which the precursor ion derived from the second sample satisfies the predetermined relationship with respect to the position on the sample plate from which the precursor ion derived from the first sample is acquired.
- a first step of determining (2) Second step of determining whether or not both precursor ions are homologous by comparing the product ions of both precursor ions determined to be within a predetermined range in the first step.
- the fraction of the sample separated by liquid chromatography is spotted on the sample plate in a predetermined order at a predetermined position, and which fraction is spotted on which position on the sample plate. It is only necessary to record the elution order of each spotted fraction, and it is not always necessary to spot adjacent fractions in adjacent wells of the sample plate. However, from the viewpoint of simplicity, it is preferable that the fractions are sequentially spotted in the adjacent wells of the sample plate in the order of elution, and the adjacent fractions are spotted in the adjacent wells.
- the first sample and the second sample are preferably separated by liquid chromatography under the same conditions.
- the first step may further include a step of determining that the mass-to-charge ratio of both precursor ions satisfies a predetermined relationship, as in the known method. That is, even if it is determined in the first step that the position on the sample plate from which both precursor ions are obtained satisfies the predetermined relationship, it is determined that the mass-to-charge ratio of both precursor ions does not satisfy the predetermined relationship. If it is determined that there is no homology, and if it is determined that the mass-to-charge ratio of both precursor ions satisfies a predetermined relationship, the homology may be determined in the second step.
- the comparison of the product ion groups of both precursor ions in the requirement (2) of the present invention can usually be performed by comparing the mass-to-charge ratio and the peak intensity of the product ion groups.
- the method of the present invention can be applied not only to one-to-one comparison of precursor ions but also to many-to-one and many-to-many comparisons. That is, when determining the homology between a plurality of precursor ions derived from the first sample and a single precursor ion derived from the second sample (many-to-one), After determining the homology between one precursor ion selected from the precursor ions and a single precursor ion derived from the second sample according to the method of the present invention, it is selected from a plurality of precursor ions derived from the first sample.
- the homology can be determined by repeating the procedure for determining the homology between the other precursor ion thus determined and the single precursor ion derived from the second sample according to the method of the present invention. Similarly, when determining homology between a single precursor ion derived from the first sample and a plurality of precursor ions derived from the second sample (many-to-one), or a plurality derived from the first sample In the case of determining the homology between a plurality of precursor ions derived from the second precursor ion and a plurality of precursor ions derived from the second sample (many-to-many), the homology can be determined by repeating the method of the present invention in the same manner as described above.
- the present invention may further comprise a step of extracting a set of precursor ions determined to have homology or a set of precursor ions determined to have no homology from a plurality of precursor ions determined to be homologous. Furthermore, a display step of outputting the set to a display or a printed material may be provided.
- the method of the present invention can be carried out using a computer. Therefore, according to another aspect, the present invention provides the following invention.
- the fractions of the sample separated by liquid chromatography are spotted on the sample plate in a predetermined order at predetermined positions, and these fractions are subjected to a tandem mass spectrometer equipped with an ionization part by matrix-assisted laser desorption ionization.
- a computer program comprising the step of determining that there is a sex, or Computer readable recording medium recording the computer program.
- the present invention it is possible to compare data obtained by performing MS / MS using LC-MALDI and determine whether they are homologous or different with high accuracy. It became. In addition, it is possible to quickly compare a large amount of data and easily obtain a set of data having homology, or conversely, a set of data included only in a specific sample. By passing the data selected by the method of the present invention as a query to the database search program, it is possible to identify substances contained in a plurality of samples in common and substances contained only in a specific sample with high accuracy.
- the data format obtained by LC-MALDI is typically a text file in which ion information is described.
- the analysis result of the text file format corresponding to the database search software MASCOT and MASCOT Daemon can get. Some of them are shown in the examples.
- the scope of application of the present invention is not limited to data recorded in a text file, and any format may be used as long as it includes information necessary for carrying out the method of the present invention. It is assumed that various types of data are handled depending on the type of mass spectrometer and software used for the analysis, and the user data management method.
- the data may be a binary file or data stored as a record in a relational database instead of a file.
- the data may be stored as a data list in a single file for each analysis sample, or may be a plurality of files divided in arbitrary units.
- the software that implements the present invention may be described in any programming language. For example, it can be selected according to the application of the practitioner, such as describing in an interpreter programming language when frequent code changes are required, and using a compiler programming language when processing a large amount of data at high speed.
- the hardware on which the software that implements the present invention operates may be any hardware as long as the software operates. Personal computers can be selected for small-scale analysis, and workstations and large computers can be selected for large-scale analysis, depending on the application of the practitioner.
- the hardware may be a general-purpose computer, or may be provided as a dedicated device incorporating software that implements the method of the present invention or an analysis system including the dedicated device.
- the “predetermined relationship” in the requirement (1) that needs to be set when carrying out the present invention for example, the allowable limit of the difference in elution order between fractions from which a pair of precursor ions to be compared is derived
- a threshold value such as a “predetermined relationship” of the mass-to-charge ratio of the precursor ions determined as desired in the first step (for example, an allowable limit of the difference in mass-to-charge ratio of a pair of precursor ions to be compared)
- the practitioner can set as appropriate based on the accuracy of the analytical instrument to be used and the past experience of the practitioner.
- the threshold value can also be set dynamically by automating the process of numerical determination as described above by software and linking it with the method of the present invention.
- the first step and the second step are independent processes. For example, if there is a high probability that the precursor ions determined to satisfy the predetermined relationship in the first step are homologous. Lower the threshold used in the comparison in the second step, and conversely, if the probability that the precursor ions determined to satisfy the predetermined relationship in the first step are homologous is low, increase the threshold in the second step. Thus, modifications such as making a stricter judgment can be considered.
- the results compared by the method of the present invention can be output as a work log in a text format, or can be output as a visible comparison matrix diagram or a Venn diagram indicating the data inclusion relationship.
- a new term or field can be provided in the data file or record to be processed, and the determination result can be described there.
- the process of outputting the comparison result can be omitted, and only a set of homologous data or a set of non-homologous data can be created.
- the following experiment was conducted using the chloroplast division apparatus of the unicellular red alga Cyanidioschyzon merolae.
- schizon a method for isolating organelles has been established, culture that synchronizes the cell cycle with light conditions is possible, and genome information has been completely deciphered.
- the analytical sample was prepared according to the method of Yoshida et al. 2006. Interphase cells and mitotic cells were sampled from a culture system of schizon whose cell cycle was synchronized by light-synchronized culture. After the cells were physically disrupted by a French press, the membrane system was lysed by surfactant treatment, and the chloroplast division apparatus was isolated by density gradient centrifugation.
- LC-MALDI The equipment configuration of LC-MALDI is explained.
- LC was HPLC of Shimadzu Prominence series.
- LC-20Adnano was used for the liquid feeding unit, L-column ODS for the trap column, and monolith type ODS for the separation column.
- the detector used was a UV-visible detector MU701 from GL Sciences, Shimadzu AccuSpot as the fraction collector, and AXIMA-TOF2 from Shimadzu as the mass spectrometer.
- Trifluoroacetic acid (TFA) and acetonitrile (MeCN) were used as the mobile phase of HPLC.
- TFA Trifluoroacetic acid
- MeCN acetonitrile
- CHCA solvent 0.1% TFA + 70% MeCN, flow rate at the time of addition 2.7 ⁇ l / min
- the eluted samples were sequentially spotted by AccuSpot every 10 seconds into wells on the MALDI sample plate, and 768 spots were obtained from interphase samples and mitotic samples, for a total of 768 spots.
- the order of spots followed the order of numbering of wells.
- Mass spectrometry was performed in the automatic analysis mode of reflectron mode from Shimadzu Biotech Launchpad manufactured by Kratos Analytical, which is control software of AXIMA-TOF2. Analysis settings were performed as follows. 1) First, acquire a precursor ion spectrum for one well. 2) From the precursor ion spectrum, a maximum of 9 significant precursor ions are selected based on the peak intensity. If a precursor ion with a strength worthy of selection is not included, the following procedure is omitted, and the analysis proceeds to the next well. 3) MS / MS is performed on each precursor ion to obtain a product ion spectrum. 4) Select 40 product ions from the product ion spectrum based on the peak intensity. 5) Record the acquired information and move on to analysis of the next well.
- 1770 precursor ions were selected for interphase samples and 2000 precursor ions for mitotic samples.
- Product ion spectra were obtained from these precursor ions, and m / z and peak intensity of 70800 product ions and 80000 product ions were obtained, respectively.
- the file format is a text file.
- the structure of the above data will be described.
- the first line starting with the # symbol is a comment line automatically added by the application.
- a line including a # symbol like this line is treated as a comment after the # symbol and is not processed.
- the BEGIN IONS and END IONS lines indicate the start and end of ion information, and the interval between them is data for one precursor ion and the product ion group derived from it.
- the TITLE line is information including well position information and uniquely identifies a precursor ion.
- the PEPMASS line indicates the m / z of the precursor ion.
- the information from the line following the PEPMASS line to the line before END ⁇ IONS is the product ion group information, the left number is the product ion m / z, and the right number is the product ion peak intensity.
- Perl Active Perl v5.6.1
- Microsoft® Windows® XP an operating system
- Fig. 1 shows the flow of software processing as a flowchart.
- the data group of the interphase samples was processed as data list A in the figure
- the data group of mitotic samples was processed as data list B.
- Data of interphase samples are extracted one by one from the beginning, and each of them is compared with all data of mitotic samples. The collation is performed from the first-stage comparison described later, and the second-stage comparison is performed only when the reference is exceeded.
- the absolute value of the difference was obtained and compared with the error tolerance $ rttolmin.
- the value of $ rttolmin was 38 based on 10% of the total number of wells (384).
- the value of $ rttolmin is generally preferably set in the range of 3% to 15% of the total number of wells.
- the above comparison was made in a round robin manner by scanning two-dimensionally from 1st to 1770th for i and 1st to 2000th for j. When both Formula 1 and Formula 2 were true, it was judged that the precursor ion similarity exceeded the standard, and a second-stage comparison was performed.
- the absolute value of these differences was determined and compared to the error tolerance $ fragmasstol.
- the value of $ fragmasstol was set to 1.3 based on the error tolerance at the time of data acquisition. In general, the value of $ fragmasstol is preferably set in the range of 0.5 to 2.0. Further, in the second stage comparison, the comparison of peak intensities was based on the following formula 4.
- $ divfragion [1] [$ i] [$ k] + $ intfragion [1] [$ j] [$ l]> $ pithreshold formula 4
- $ divfragion [1] [$ i] [$ k] is the peak intensity of the kth product ion derived from the ith precursor ion of the mitotic sample
- $ intfragion [1] [$ j] [$ l ] Is the peak intensity of the l-th product ion derived from the j-th precursor ion of the interphase sample.
- $ pithreshold is preferably set as appropriate according to the quality of the spectrum, the accuracy of peak recognition of product ions, a numerical algorithm, and the like.
- the above comparison was performed in a round robin manner by scanning the first to the 40th of k and l two-dimensionally. When both Equation 3 and Equation 4 were true, it was determined that the product ion similarity exceeded the standard.
- $ similarity was defined to record the result of the second comparison.
- $ similarity is a variable that is initialized to 0 each time when moving from the first-level comparison to the second-level comparison. If both Expression 3 and Expression 4 are true in the second-stage comparison, 1 is added to the value of $ similarity.
- $ similarity is 10 or more, that is, if at least 10 product ions out of 40 are similar, the precursor ions are determined to be homologous.
- schizon A MASCOT search was performed on the genome database.
- Table 1 shows the search results.
- the ranking of genes of known proteins involved in organelle division such as CMN262C and CME019C and genes of GTP-binding proteins such as CMD101C and CMJ069C were remarkably increased after treatment.
- GTP-binding proteins are a family of proteins that bind to GTP and its hydrolyzate GDP and have various functions, and are involved in the regulation of biosynthesis and transport of cytoskeletal proteins and the like.
- these GTP binding proteins are also expected to be related to the control of cell division.
- the genes of the photosynthetic proteins encoded by chloroplasts such as CMV157C, CMV051C, CMV063C, and CMV158C did not change or declined. This indicates that the precursor ions derived from these proteins are also present in the interphase sample, which has been subtracted by comparative analysis. Therefore, these proteins are expected to be non-specifically expressed proteins in the cell cycle.
- the protein of the present invention was able to efficiently extract a protein that is expected to exist specifically in the mitotic phase.
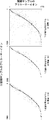
- FIG. 2 illustrates a comparison matrix obtained as a result of collating the interphase sample and the mitotic sample with different settings.
- the horizontal axis represents the precursor ion of the interphase sample, and represents the 1st to 1770th in order from the left.
- the vertical axis represents the precursor ion of the mitotic sample, and represents the first to 2000th in order from the top.
- a black dot at the intersection of the vertical axis and the horizontal axis indicates that the corresponding precursor ions on the vertical axis and the horizontal axis are determined to be homologous.
- (I) is a matrix in the case where determination is made only by m / z of the precursor ion without considering the position of the well in the comparison of the precursor ion at the first stage. Black spots are concentrated in the sigmoid type from the upper left to the lower right, and it is expected that the black spots along this curve are determined to be homologous between the precursor ions that are truly homologous. However, in (I), many black spots are distributed throughout the matrix other than the vicinity of the curve. It is expected that these are due to false positive judgments that originally considered different precursor ions as homologous.
- (II) shows the result of raising the threshold of judgment over the setting of (I) in the second stage product ion matching.
- the precursor ion was determined to be homologous, but this criterion was changed to 15 or more. is there.
- the black spots along the curve are also reduced. This is presumably due to an increase in false negative judgments that overlooked combinations that should be regarded as homologous.
- the reduction of black spots on the curve is particularly noticeable at the lower right of the matrix.
- the threshold at the time of product ion matching is returned to 10, and the position of the well is taken into consideration in the first stage comparison (III).
- This setting is the same as in the above embodiment.
- (III) compared with (I), the number of black spots scattered throughout the entire matrix was reduced, while the decrease in black spots along the curve was suppressed more than in (II). From these results, it was shown that adding well position information in the first-stage comparison is effective in determining the homology of precursor ions.
- the present invention is versatile as a method for processing data obtained by LC-MALDI, and can be used in various aspects.
- the present invention enables differential analysis of various samples such as biological tissue, extracts derived therefrom, or chemical industrial products. For example, by comparing the proteome of normal tissue and pathological tissue in the present invention, it is possible to find a factor that is specifically expressed in the latter or a factor that is lost in the latter, a so-called biomarker. . Incorporating this into the drug discovery process is expected to improve productivity in pharmaceuticals and discover new drug discovery targets. Also, in the chemical and food industries, by comparing multiple identical products, you can check product quality variations and contamination contained in the products, or compare new products with aged products over time.
- the flowchart which shows the procedure of the analysis method of this invention in the case of comparing many-to-many data.
- the comparison matrix figure of a processing result which shows the usefulness of adding the positional information on a well in determination of the homology of a precursor ion.
Landscapes
- Chemical & Material Sciences (AREA)
- Analytical Chemistry (AREA)
- Other Investigation Or Analysis Of Materials By Electrical Means (AREA)
Applications Claiming Priority (2)
| Application Number | Priority Date | Filing Date | Title |
|---|---|---|---|
| JP2010196367A JP5636614B2 (ja) | 2010-09-02 | 2010-09-02 | Lc−maldiで得られたデータの比較解析方法 |
| JP2010-196367 | 2010-09-02 |
Publications (1)
| Publication Number | Publication Date |
|---|---|
| WO2012029900A1 true WO2012029900A1 (ja) | 2012-03-08 |
Family
ID=45772975
Family Applications (1)
| Application Number | Title | Priority Date | Filing Date |
|---|---|---|---|
| PCT/JP2011/069885 Ceased WO2012029900A1 (ja) | 2010-09-02 | 2011-09-01 | Lc-maldiで得られたデータの比較解析方法 |
Country Status (2)
| Country | Link |
|---|---|
| JP (1) | JP5636614B2 (enExample) |
| WO (1) | WO2012029900A1 (enExample) |
Cited By (2)
| Publication number | Priority date | Publication date | Assignee | Title |
|---|---|---|---|---|
| JP2013195115A (ja) * | 2012-03-16 | 2013-09-30 | Shimadzu Corp | 質量分析装置 |
| US20220189751A1 (en) * | 2019-04-24 | 2022-06-16 | Shimadzu Corporation | Imaging mass spectrometer |
Families Citing this family (3)
| Publication number | Priority date | Publication date | Assignee | Title |
|---|---|---|---|---|
| KR101326280B1 (ko) | 2012-08-21 | 2013-11-11 | 한국항공우주연구원 | 소형 무게중심 측정장치 및 방법 |
| JP6148540B2 (ja) * | 2013-06-07 | 2017-06-14 | 株式会社島津製作所 | 質量分析装置を用いたグラニュリンペプチドの定量分析方法、および分析用プログラム |
| WO2022209075A1 (ja) * | 2021-03-30 | 2022-10-06 | 株式会社島津製作所 | 分析システム及び分析システム用プログラム |
Citations (4)
| Publication number | Priority date | Publication date | Assignee | Title |
|---|---|---|---|---|
| JP2004529325A (ja) * | 2001-01-17 | 2004-09-24 | アイアールエム,エルエルシー | 試料載置方法及びシステム |
| JP2006525520A (ja) * | 2003-04-30 | 2006-11-09 | パーキンエルマー・エルエーエス・インコーポレーテッド | マトリックス支援レーザ脱離およびイオン化質量分光分析を使用して電気伝導性領域に隣接する領域のサンプルプレート表面マスクをスキャンする方法 |
| JP2008249440A (ja) * | 2007-03-30 | 2008-10-16 | Hitachi High-Technologies Corp | クロマトグラフィー質量分析方法、及びクロマトグラフ質量分析装置 |
| JP2009156722A (ja) * | 2007-12-27 | 2009-07-16 | Hitachi High-Technologies Corp | 質量分析スペクトル分析方法 |
-
2010
- 2010-09-02 JP JP2010196367A patent/JP5636614B2/ja not_active Expired - Fee Related
-
2011
- 2011-09-01 WO PCT/JP2011/069885 patent/WO2012029900A1/ja not_active Ceased
Patent Citations (4)
| Publication number | Priority date | Publication date | Assignee | Title |
|---|---|---|---|---|
| JP2004529325A (ja) * | 2001-01-17 | 2004-09-24 | アイアールエム,エルエルシー | 試料載置方法及びシステム |
| JP2006525520A (ja) * | 2003-04-30 | 2006-11-09 | パーキンエルマー・エルエーエス・インコーポレーテッド | マトリックス支援レーザ脱離およびイオン化質量分光分析を使用して電気伝導性領域に隣接する領域のサンプルプレート表面マスクをスキャンする方法 |
| JP2008249440A (ja) * | 2007-03-30 | 2008-10-16 | Hitachi High-Technologies Corp | クロマトグラフィー質量分析方法、及びクロマトグラフ質量分析装置 |
| JP2009156722A (ja) * | 2007-12-27 | 2009-07-16 | Hitachi High-Technologies Corp | 質量分析スペクトル分析方法 |
Cited By (2)
| Publication number | Priority date | Publication date | Assignee | Title |
|---|---|---|---|---|
| JP2013195115A (ja) * | 2012-03-16 | 2013-09-30 | Shimadzu Corp | 質量分析装置 |
| US20220189751A1 (en) * | 2019-04-24 | 2022-06-16 | Shimadzu Corporation | Imaging mass spectrometer |
Also Published As
| Publication number | Publication date |
|---|---|
| JP2012052940A (ja) | 2012-03-15 |
| JP5636614B2 (ja) | 2014-12-10 |
Similar Documents
| Publication | Publication Date | Title |
|---|---|---|
| Alseekh et al. | Mass spectrometry-based metabolomics: a guide for annotation, quantification and best reporting practices | |
| Dunn et al. | Mass appeal: metabolite identification in mass spectrometry-focused untargeted metabolomics | |
| Cagney et al. | De novo peptide sequencing and quantitative profiling of complex protein mixtures using mass-coded abundance tagging | |
| Karpievitch et al. | Liquid chromatography mass spectrometry-based proteomics: biological and technological aspects | |
| US9040903B2 (en) | Precursor selection using an artificial intelligence algorithm increases proteomic sample coverage and reproducibility | |
| Aebersold et al. | Mass spectrometry-based proteomics | |
| Zimmer et al. | Advances in proteomics data analysis and display using an accurate mass and time tag approach | |
| Cooper et al. | An assessment of AcquireX and Compound Discoverer software 3.3 for non-targeted metabolomics | |
| Elias et al. | Comparative evaluation of mass spectrometry platforms used in large-scale proteomics investigations | |
| Swanson et al. | The continuing evolution of shotgun proteomics | |
| Beausoleil et al. | A probability-based approach for high-throughput protein phosphorylation analysis and site localization | |
| Graham et al. | Microbial proteomics: a mass spectrometry primer for biologists | |
| Yuan et al. | Mass spectrometric analysis of histone proteoforms | |
| US8455818B2 (en) | Mass spectrometry data acquisition mode for obtaining more reliable protein quantitation | |
| Vitorino et al. | De novo sequencing of proteins by mass spectrometry | |
| Van Riper et al. | Mass spectrometry-based proteomics: basic principles and emerging technologies and directions | |
| Patrie et al. | Top Down Mass Spectrometry of< 60-kDa Proteins from Methanosarcina acetivorans Using Quadrupole FTMS with Automated Octopole Collisionally Activated Dissociation* S | |
| JP5636614B2 (ja) | Lc−maldiで得られたデータの比較解析方法 | |
| Kislinger et al. | Multidimensional protein identification technology: current status and future prospects | |
| Webb-Robertson et al. | Current trends in computational inference from mass spectrometry-based proteomics | |
| Paša‐Tolić et al. | Gene expression profiling using advanced mass spectrometric approaches | |
| Paulo | Isobaric labeling: Expanding the breadth, accuracy, depth, and diversity of sample multiplexing | |
| Merkley et al. | A proteomics tutorial | |
| VerBerkmoes et al. | Mass spectrometric approaches for characterizing bacterial proteomes | |
| Carr et al. | Spectral averaging with outlier rejection algorithms to increase identifications in top‐down proteomics |
Legal Events
| Date | Code | Title | Description |
|---|---|---|---|
| 121 | Ep: the epo has been informed by wipo that ep was designated in this application |
Ref document number: 11821915 Country of ref document: EP Kind code of ref document: A1 |
|
| NENP | Non-entry into the national phase |
Ref country code: DE |
|
| 122 | Ep: pct application non-entry in european phase |
Ref document number: 11821915 Country of ref document: EP Kind code of ref document: A1 |