WO2012008264A1 - 生活可視化システム、サーバ及び生活データの処理方法 - Google Patents
生活可視化システム、サーバ及び生活データの処理方法 Download PDFInfo
- Publication number
- WO2012008264A1 WO2012008264A1 PCT/JP2011/063782 JP2011063782W WO2012008264A1 WO 2012008264 A1 WO2012008264 A1 WO 2012008264A1 JP 2011063782 W JP2011063782 W JP 2011063782W WO 2012008264 A1 WO2012008264 A1 WO 2012008264A1
- Authority
- WO
- WIPO (PCT)
- Prior art keywords
- data
- time
- life
- display
- sleep
- Prior art date
- Legal status (The legal status is an assumption and is not a legal conclusion. Google has not performed a legal analysis and makes no representation as to the accuracy of the status listed.)
- Ceased
Links
Images
























Classifications
-
- A—HUMAN NECESSITIES
- A61—MEDICAL OR VETERINARY SCIENCE; HYGIENE
- A61B—DIAGNOSIS; SURGERY; IDENTIFICATION
- A61B5/00—Measuring for diagnostic purposes; Identification of persons
- A61B5/103—Measuring devices for testing the shape, pattern, colour, size or movement of the body or parts thereof, for diagnostic purposes
- A61B5/11—Measuring movement of the entire body or parts thereof, e.g. head or hand tremor or mobility of a limb
- A61B5/1118—Determining activity level
-
- A—HUMAN NECESSITIES
- A61—MEDICAL OR VETERINARY SCIENCE; HYGIENE
- A61B—DIAGNOSIS; SURGERY; IDENTIFICATION
- A61B5/00—Measuring for diagnostic purposes; Identification of persons
- A61B5/0002—Remote monitoring of patients using telemetry, e.g. transmission of vital signals via a communication network
-
- A—HUMAN NECESSITIES
- A61—MEDICAL OR VETERINARY SCIENCE; HYGIENE
- A61B—DIAGNOSIS; SURGERY; IDENTIFICATION
- A61B5/00—Measuring for diagnostic purposes; Identification of persons
- A61B5/48—Other medical applications
- A61B5/4806—Sleep evaluation
-
- A—HUMAN NECESSITIES
- A61—MEDICAL OR VETERINARY SCIENCE; HYGIENE
- A61B—DIAGNOSIS; SURGERY; IDENTIFICATION
- A61B5/00—Measuring for diagnostic purposes; Identification of persons
- A61B5/68—Arrangements of detecting, measuring or recording means, e.g. sensors, in relation to patient
- A61B5/6801—Arrangements of detecting, measuring or recording means, e.g. sensors, in relation to patient specially adapted to be attached to or worn on the body surface
- A61B5/6802—Sensor mounted on worn items
- A61B5/681—Wristwatch-type devices
-
- A—HUMAN NECESSITIES
- A61—MEDICAL OR VETERINARY SCIENCE; HYGIENE
- A61B—DIAGNOSIS; SURGERY; IDENTIFICATION
- A61B2562/00—Details of sensors; Constructional details of sensor housings or probes; Accessories for sensors
- A61B2562/02—Details of sensors specially adapted for in-vivo measurements
- A61B2562/0219—Inertial sensors, e.g. accelerometers, gyroscopes, tilt switches
Definitions
- the present invention relates to a measurement method for measuring life information indicating the life of a subject for a long period of time, an output device for outputting the life information of the subject, and a control method for the output device.
- Non-Patent Document 1 is a device that measures physical activity as life data by wearing a wristwatch-type acceleration sensor in order to visualize the measured life data. is there.
- a doctor grasps the state of daily life of the patient and confirms signs of illness and progress of recovery.
- Examples of a method for visualizing the entire life data of a long-term and high-resolution obtained from a device such as a life microscope include methods disclosed in Patent Document 1 and Patent Document 2.
- the amount of activity on the date and time is shown by color and shade of color on a plane in which the horizontal axis (horizontal axis of the display screen) is time and the vertical axis (vertical axis of the display screen) is date. It is a visualization method that makes it easy to grasp the trend of activities over a long period.
- the resolution is too fine, and it is difficult to grasp the color in association with the actual action during browsing.
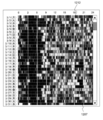
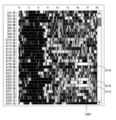
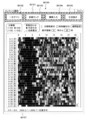
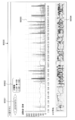
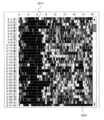
- life data for one month and half drawn with a resolution of 1 minute is shown in FIG. 26A.
- the date increases from 0 o'clock to 24:00 on the horizontal axis and the vertical axis moves downward.
- a black region is drawn from around 2 o'clock to around 6 o'clock, and it can be easily imagined by the viewer that this represents sleep.
- the walking section (commuting) around 7:00 to 8:00 the black period continues and there is no visual difference from sleep.
- desk work is performed in this section, and the stationary period and the active period are repeated in a cycle of a few minutes. For this reason, it is difficult for a viewer to distinguish between sleep and awakening periods from life data drawn with a resolution of 1 minute, and life data cannot be grasped effectively.
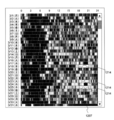
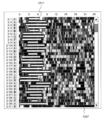
- FIG. 26B shows life data in which the resolution is 120 minutes, that is, the maximum amount of activity every 120 minutes is expressed in color.
- the problem that the sleep period and the awakening period cannot be distinguished from each other is solved, and the awakening period is clearly displayed in white, so that it is easy to grasp the outline visually.
- the detailed tendency of activity is lost from this figure.
- FIG. 26A features such as commuting earlier than usual on September 3 and September 19, and awakening during sleep on September 15 and September 21, etc. I can read. However, this is smoothed by life data with a resolution of 120 minutes and cannot be read.
- An object of the present invention is to solve the above-mentioned problems, and by displaying life data using an appropriate resolution based on human behavior characteristics, an overall picture of life can be easily obtained. It is possible to grasp.
- a typical example of the invention disclosed in the present application is as follows. That is, a sensor node that is attached to a human body and measures biological information, transmits a sensing data including the measured biological information and the date and time when the biological information was measured, a processor, a storage unit, and an interface And a computer connected to the sensor node for receiving the sensing data, storing the received sensing data in the storage unit, and calculating life data from the stored sensing data.
- the computer totals the stored sensing data at a predetermined time interval, and generates a time-series total data relating to the behavior of the person wearing the sensor node, and life data is output.
- a setting acquisition unit that receives a period of time and a resolution indicating a time width of each life data to be output; With respect to the total data within the received period, by calculating a representative value of the total data for each time width indicated by the resolution, a life data generation unit that generates life data, and according to the value of the life data, A color data conversion unit that converts life data into color data, and the resolution is set to a preset time width from 2 minutes to 16 minutes, and the counting unit totals the sensing data The predetermined time interval to be set is set to be less than the minimum value of the resolution.
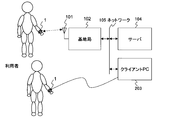
- FIG. 1 is a block diagram illustrating a configuration example of a life visualization system according to the first embodiment of this invention.
- the life visualization system of this embodiment uses the bracelet type sensor node 1 provided with an acceleration sensor as a sensor for detecting the operation (or state) of the user of the system, and detects the acceleration of the arm as biological information.
- the bracelet type sensor node 1 is worn on the user's (or participant's) arm to detect acceleration, and the acceleration data detected at a predetermined cycle is used as sensing data (biological information) from the antenna 101 via the wireless network.
- the data is transmitted to the base station 102 and further transmitted to the client computer (PC) 103. If wired communication is possible, the data may be transmitted directly to the PC 103 via a USB connection or the like.
- the PC 103 communicates with a plurality of bracelet type sensor nodes 1, receives sensing data corresponding to the movement of the user from each bracelet type sensor node 1, analyzes and aggregates the received sensing data, and further The representative value of the total value is calculated with resolution and output as display data (or life data).
- the output display data can be viewed on the PC 103 operated by the user.
- FIG. 2 is an explanatory view showing a configuration example of the bracelet type sensor node 1 constituting the life visualization system of the present embodiment, where (a) is a front view of the bracelet type sensor node 1 and (b) is a bracelet type sensor node. 1 is a side sectional view.
- This bracelet type sensor node 1 mainly measures a user's movement (acceleration).
- the bracelet type sensor node 1 includes a case 11 for storing the sensor and the control device, and a band 12 for attaching the case 11 to a human arm.
- a substrate 10 including a microcomputer 3 (see FIG. 3), a sensor 6 (see FIG. 3), and the like is stored as shown in FIG.
- the sensor 6 for measuring the movement of the human body (living body) an example is shown in which an acceleration sensor for measuring the triaxial acceleration of XYZ in the figure is employed.
- the bracelet type sensor node 1 includes a temperature sensor and a pulse sensor (not shown), measures the user's body temperature and pulse, and outputs the measured data together with the acceleration. Further, the bracelet type sensor node 1 may be provided with a pressure sensor or a capacitance sensor (not shown), and whether or not the user wears the wristwatch type sensor node 1 may be output as a wearing state.
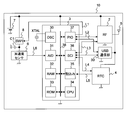
- FIG. 3 is a block diagram of an electronic circuit attached to the substrate 10 of the bracelet type sensor node 1.
- a wireless communication unit 2 is connected to an antenna 5 that communicates with the base station 102.
- the USB communication unit 39 is connected to the PC 103 by a wire.
- the microcomputer 3 controls the sensor 6 and the wireless communication unit 2.
- the real time clock 4 is a timer for starting the microcomputer 3 intermittently.
- the battery 7 supplies power to each unit.
- the switch 8 controls power supply to the sensor 6.
- a bypass capacitor C1 is connected between the switch 8 and the sensor 6 to remove noise. Further, it is possible to suppress wasteful power consumption by controlling the switch 8 so as to reduce the number of times of charging / discharging the bypass capacitor C1.
- the microcomputer 3 interrupts the CPU 34 based on a CPU 34 that executes arithmetic processing, a ROM 33 that stores programs executed by the CPU 34, a RAM 32 that stores data and the like, and a signal (timer interrupt) from the RTC 4.
- Serial communication interface SCI
- SCI Serial communication interface
- a / D converter 31 that converts the analog signal output from the sensor 6 into a digital signal
- the wireless communication unit 2 36 a parallel interface (PIO) 37 that transmits and receives control signals to and from the wireless communication unit 2, the USB communication unit 39, and the switch 8, and an oscillation unit (OSC) 30 that supplies a clock to each of the units in the microcomputer 3.
- PIO parallel interface
- OSC oscillation unit
- the above-described units in the microcomputer 3 are connected via a system bus 38.
- the RTC 4 outputs an interrupt signal (timer interrupt) at a preset period to the interrupt control unit 35 of the microcomputer 3 and outputs a reference clock to the SCI 36.
- the PIO 37 controls the power supply to the sensor 6 by controlling ON / OFF of the switch 8 in accordance with a command from the CPU 34.
- the bracelet type sensor node 1 starts the microcomputer 3 at a predetermined cycle (for example, 1 second), acquires sensing data from the sensor 6, and an identifier for identifying the bracelet type sensor node 1 in the acquired sensing data; A time stamp is added and sensing data is transmitted to the base station 102.
- the details of the control of the bracelet type sensor node 1 can be made the same as, for example, Japanese Patent Laid-Open No. 2008-59058.
- the bracelet type sensor node 1 may periodically transmit the acquired sensing data to the base station 102.
- the cycle for acquiring the sensing data is not limited to 1 second, and may be any cycle that allows grasping of human behavior. In this embodiment, 1 second is used to reduce the amount of data transmitted by the sensor node 1, but a period of 100 msec to 500 msec may be used.
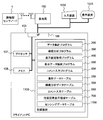
- FIG. 4 is a block diagram showing components of the life visualization system of the present embodiment shown in FIG.
- Sensing data transmitted from the bracelet type sensor node 1 is stored in the sensing data table 1150 of the storage device 1100 of the PC 103 via the base station 102.
- the bracelet type sensor node 1 and the PC 103 may communicate directly via wired communication (USB or the like) (not shown).
- the PC 103 is connected with a display device 1031 for displaying various types of information and an input device 1032 that allows various information to be input by user operations.
- the display device 1031 may be a display terminal such as a liquid crystal display or a CRT display, and may be a printer or an image file output device.
- the input device 1032 is an input device such as a keyboard and a mouse.
- the display device 1031 and the input device 1032 may be a single device having both functions, such as a touch panel display.
- the PC 103 is a computer including a processor 107, a memory 108, and a storage device 1100.
- the storage device 1100 records various programs and various data tables described later, and is, for example, a hard disk drive, a CD-ROM drive, a flash memory, or the like. Various programs and various data tables may be divided and recorded in a plurality of storage devices.
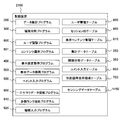
- the processor 107 implements various functions by reading out various programs recorded in the storage device 1100 to the memory 108 and executing them. Specifically, by executing the data totaling program 200, the sensing data (biological information) measured by the acceleration sensor of the user's bracelet type sensor node 1 is totaled, and unit time (for example, one minute) is counted. The amount of exercise is calculated as total data (life data), and the calculated total data is stored in the total data table 250 of the storage device 1100. Further, by executing the sleep analysis program 300, the calculated aggregate data for each unit time is analyzed, all sleep states are detected, and the detected sleep states are stored in the sleep analysis data table 350 of the storage device 1100. .
- a GUI screen is displayed on the display device 1031.
- display data obtained by collecting the aggregated data is rendered. Get display settings for.
- the display data drawing program 500 based on the display settings acquired by the display setting acquisition program 400, the aggregated data of the specified user is aggregated to calculate display data, and the calculated display data is calculated.
- the display data is generated and output to the display device 1031.
- the display data drawing program 500 refers to a position-specific display area table 700 that manages display positions, as will be described later.
- the position specific display area table 700 is stored in the storage device 1100.
- the comment input program 600 receives a comment and a display position given to the display data, stores the received comment and the display position in the comment input table 650, and the display data drawing program 500 outputs the display data. Comments on the comment input table 650 are displayed on the display device 1031.
- the PC 103 executes the data aggregation program 200 and the sleep analysis program 300 based on a periodic cycle or communication with the wristwatch-type sensor node 1, and further operates the input device 1032 or the PC 103.
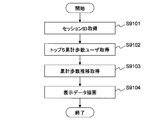
- FIG. 5 is an overall flowchart of data processing executed by the life visualization system of this embodiment.
- step S1 the base station 102 transfers sensing data (biological information) every predetermined cycle (for example, 1 second) transmitted from the bracelet type sensor node 1 to the PC 103, and the sensing data table 1150 of the PC 103 stores the sensing data. Store the data. Further, an identifier for identifying the sensor node and time information indicating the time when the sensing data is acquired are stored in the sensing data table. Furthermore, the PC 103 executes the data totalization program 200 due to the operation of the input device 1032, calculates the exercise frequency (equivalent amount of exercise) and the number of walks per unit time from the sensing data stored in the storage device 1100, The calculated exercise frequency and the number of walks are stored in the total data table 250 of the storage device 1100. In addition, you may perform execution of the data totalization program 200 for every predetermined period (for example, 5 minutes).
- step S ⁇ b> 2 the PC 103 executes the sleep analysis program 300 to detect an area in which the user is estimated to be in a sleep state from the aggregate data stored in the aggregate data table 250, and for all sleep areas.
- a set of start time and end time is stored in the sleep analysis data table 350.
- the sleep analysis program 300 detects the main sleep that is the longest sleep period of the day, adds the main sleep tag to the main sleep tag among the stored sleep areas, and sleeps the main sleep tag. Store in the analysis data table 350.
- the sleep analysis program 300 may be executed every predetermined cycle (for example, 5 minutes), or may be executed due to the end of the data totalization program 200. Alternatively, the sleep analysis program 300 may be executed when a predetermined input is received from the input device 1032.
- step S3 the display setting acquisition program 400 is executed to output a life data display window 1200 (see FIG. 12) to the display device 1031. Then, by the operation of the input device 1032 by the user, setting of resolution indicating a period from 2 minutes to 16 minutes, setting of screen alignment, setting of main sleep display, setting of time line display, setting of display area, and setting of display period Is received, and the received setting is stored in the memory 108.
- the display setting acquisition program 400 can execute the display setting acquisition program 400 after receiving a predetermined input from the input device 1032.
- step S4 the display data drawing program 500 is executed, and based on the display settings stored in the memory 108, the total data stored in the total data table 250 of the storage device 1100 and the sleep analysis data table 350 are displayed. Display data (life data) is generated from the sleep analysis data stored in, and the display data is stored in the memory 108.
- step S5 the display data stored in the memory 108 is drawn in the drawing area 1207 (see FIG. 12) of the life data display window 1200 of the display device 1031.
- FIG. 6 is a flowchart showing an example of processing by execution of the data totaling program 200 of the PC 103.
- the PC 103 reads the sensing data corresponding to the user identifier from the sensing data table 1150 (step S11).
- the amount of sensing data to be read is a predetermined time interval (for example, 1 minute) that is the sensing data aggregation cycle, or the last amount already stored in the aggregation data table 250 by the execution of the past data aggregation program 200. What is necessary is just to set to everything after the total time.
- a value received in advance from the input device 1032 can be used as the identifier of the aggregation target user.
- a total value is calculated every predetermined time interval (for example, 1 minute) using the acceleration data of the read sensing data.
- predetermined time interval for example, 1 minute
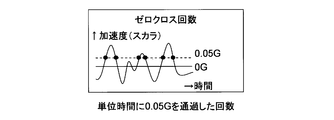
- the number of zero crosses indicating the frequency of exercise of the wearer (user) of the bracelet type sensor node 1 within a predetermined time interval is used as the total value.
- the scalar amount of the X, Y, and Z axis acceleration is set to (X2 + Y2 + Z2) 1/2.
- Calculate step S12).
- a bandpass filter by filtering the calculated scalar quantity using a bandpass filter, only a predetermined frequency band (for example, 0.1 Hz to 5 Hz) is extracted, and noise components are removed (step S13). .
- the calculated scalar quantity is calculated as a value of zero crossing that passes a predetermined threshold (for example, 0.05 G), and the frequency of occurrence of the zero crossing within a predetermined time interval is calculated. Then, this appearance frequency is output as an exercise frequency at a predetermined time interval (for example, 1 minute) (step S14).
- a predetermined threshold for example, 0.05 G
- the exercise frequency calculated in step S14 is data obtained by sorting the exercise frequencies for each unit time in time series as shown in FIG.
- FIG. 8 is a graph showing the exercise frequency (bar graph in the figure) and temperature (line graph) in time series. Note that the motion frequency may be summed up by counting the number of times that the acceleration values in the X, Y, and Z directions vibrate positively and negatively (frequency) for each direction within a predetermined time. In the embodiment, a method of calculating the number of zero crossings is employed in order to simplify the calculation.
- an integrated value of the scalar amounts of the three-axis accelerations of X, Y, and Z within a predetermined time interval is calculated, and this integrated value is set as the exercise intensity (equivalent amount of exercise) (step S15). Also, an average temperature within a predetermined time interval is calculated for the temperature included in the sensing data (step S16).
- the number of steps that appear within a predetermined time interval is output as the number of steps (step S17).
- the vertical acceleration changes periodically (landing for each step), and the longitudinal acceleration repeats the forward and backward directions in synchronization with the vertical acceleration (speed for each landing) Change), or the acceleration waveform in the left-right direction can be observed regularly (swing to the left and right of the body at every step) in synchronization with the acceleration in the vertical direction. Can be observed. For this reason, it can be determined whether it is a walking state within the said time interval by whether a waveform corresponds to these conditions. It is also possible to detect the reciprocal of the zero crossing period as the number of walks.
- a known method may be used.
- “a human using an acceleration / angular velocity sensor attached to an arm” may be used.
- ⁇ Analysis of walking and running motion '' S.-W.Lee and K.Mase, ⁇ Recognition of Walking Behaviors for Pedestrian Navigation '', Proc. IEEE Conf. Control Applications (CCA01), IEEE Control Systems Soc., Piscataway, NJ, 2001, pp.1152-1155.
- a flag representing the state of data within a predetermined time interval is calculated (step S18).
- the ratio of valid data that is, data having three-axis acceleration data of X, Y, and Z within a predetermined range
- the time interval is determined as missing data. If the data is missing data, the flag within the time interval is set to “missing value”.
- the wristwatch type sensor node 1 when the data of the time interval is not missing data, the wristwatch type sensor node 1 outputs the wearing state on the human body, and the ratio of wearing data out of the predetermined time interval is less than a predetermined threshold
- the time interval is determined as non-wearing data. For example, when the bracelet type sensor node 1 is attached or not attached, for example, the value of the sensing data detected by the temperature sensor of the bracelet type sensor node 1 is less than a predetermined threshold (for example, 30 degrees Celsius) for determining the human body temperature. Sometimes it is determined that it is not mounted, and in other cases it is determined that it is mounted. If the data is non-wearing data, the flag within the time interval is set to “non-wearing”. If the data within the time interval is neither missing data nor non-attached data, a flag is set to “data present” indicating valid data.
- a predetermined threshold for example, 30 degrees Celsius
- the flag of the data state of the time interval is determined as one of “data present”, “missing value”, and “non-attached”.
- the data tabulation program 200 calculates the exercise frequency, average temperature, exercise intensity, number of walks, and flag for each predetermined time interval (here 1 minute) by the above processing, and as shown in FIG. Total data for each time interval is generated and stored in the total data table 250 of the storage device 1100 (step S19).
- Sensing data measured by the bracelet type sensor node 1 at a predetermined cycle (1 second) is stored in the sensing data table 1150, and then aggregated into total data at predetermined time intervals (1 minute) by the above processing. Total data is stored in the total data table 250.
- FIG. 9 is an explanatory diagram showing an example of the data format of the total data table 250.
- a user ID 251 for storing an identifier of a wearer (user of the life visualization system) of the bracelet type sensor node 1 and a sensor data ID 252 for storing an identifier of the bracelet type sensor node 1 included in the sensing data
- the user identifier may be referred to a table (not shown) set in advance based on the identifier of the bracelet type sensor node 1.
- a table (not shown) set in advance based on the identifier of the bracelet type sensor node 1.
- “0” indicates “data present”
- “1” indicates “missing value”
- “2” indicates “non-attached”.
- the PC 103 By executing the data totaling program 200, the PC 103 reads the sensing data in the sensing data table 1150 and generates the total data table 250 for the specified user identifier.
- FIG. 10 is a flowchart showing an example of processing by execution of the sleep analysis program 300 of the PC 103.
- the sleep analysis program 300 first reads the aggregated data for each unit time aggregated by executing the data aggregate program 200 from the aggregated data table 250 (step S21).
- the total data to be read may be set to, for example, all the data after the end time of the last sleep already stored in the sleep analysis data table 350 by the execution of the past sleep analysis program 300, or the like.
- step S22 by executing the sleep analysis program 300, a region group estimated to be in a sleep state is detected from the aggregate data read in step S21.
- the frequency of exercise during sleep is extremely low, but the human body does exercise such as turning over during sleep, so the frequency of exercise does not become zero.
- Several methods are known for determining sleep, such as the Cole method (Cole RJ, Kripke DF, Gruen W, Mullaney DJ, Gillin JC. Automatic sleep / wake identification from wrist activity. Sleep 1992; 15: 491-469 ), Or a method of determining aggregate data with an exercise frequency equal to or less than a predetermined threshold as a sleep state.
- each sleep state area detected from the aggregate data by such a method as a sleep area candidate group temporary storage (not shown) (part of the storage area of the memory 108 or the storage device 1100), etc.
- temporary storage (not shown) (part of the storage area of the memory 108 or the storage device 1100), etc.
- the exercise frequency is almost zero and may be determined as sleep.
- the wristwatch-type sensor node includes a non-wearing determination unit, when reading the unit time totaling data table 250, the data indicating that the flag 258 is not worn is handled in the same way as data with high exercise frequency. It is possible to prevent erroneous determination as a sleep state.
- step S23 adjacent ones of the plurality of sleep region candidates detected in step S22 are combined.
- the sleep region candidate is divided at the time of the temporary wakeup.
- the next sleep area candidate starts within a predetermined time (for example, 30 minutes) after the end of the sleep area candidate, the two sleep area candidates are combined and handled as one large sleep area.
- a predetermined time for example, 30 minutes
- step S24 those that are inappropriate as sleep region candidates are excluded.
- a sleep region in which the duration of the sleep state is a predetermined time (for example, 10 minutes) or less is excluded. If the end time of the last sleep area candidate in the sleep area candidate group is within a predetermined time (for example, 30 minutes) from the latest measurement time of the total data read by execution of the sleep analysis program 300, the next time
- the sleep analysis program 300 may be combined with a sleep region newly listed as a candidate. For this reason, such a region is also excluded.
- the sleep region candidate group processed as described above is determined as the sleep region group.
- step S25 main sleep is extracted from the sleep region group determined in step S24, the sleep type is determined as "main sleep", and sleep other than "main sleep” is determined as "nap”.
- the sleep analysis program 300 first calculates a calendar date (calendar date) to which each sleep region belongs.
- a calendar date (calendar date) to which each sleep region belongs.
- the end time of the sleep region is a predetermined time, for example, from 0:00 to 20:00, it is determined to belong to the same day, and when it is from 20:00 to 24:00, it is determined to belong to the next day. For example, a sleep region that starts at 16:30 on July 23 and ends at 20:30 belongs to July 24.
- the longest sleeping area is extracted in each calendar day, and these extracted sleeping areas are set as the main sleep of the calendar day. That is, the actual end time of the sleep region is treated as the main sleep of the calendar day. For example, when the sleep region starting at 16:30 on July 23 and ending at 20:30 is the longest among the sleep regions belonging to July 24, the end time of the main sleep on July 24 is , 20:30 on July 23rd.
- the sleep type of the main sleep calculated by the above process is determined as “main sleep”, and the other sleep type is determined as “nap sleep”.
- step S25 the sleep region group determined in step S25 is stored in the sleep analysis data table 350 of the storage device 1100 (step S26).
- a sleep area group is calculated at predetermined time intervals, and each sleep area is stored in the sleep analysis data table 350 of the storage device 1100 as shown in FIG.
- FIG. 11 is a diagram for explaining an example of the format of the sleep analysis data table 350.
- a user ID 351 that stores the identifier of the wearer (user of the life visualization system) of the bracelet type sensor node 1
- a measurement date and time 352 that stores the start time of the sleep region
- an end time of the sleep region One entry is configured from the end time 353 for storing the sleep type and the sleep type 354 for storing the sleep type (whether it is main sleep or nap).
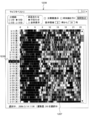
- FIG. 12 shows a life data display window 1200 which is a GUI screen related to processing by execution of the display setting acquisition program 400 and the display data drawing program 500 of the PC 103.
- the display setting acquisition program 400 outputs a life data display window 1200 to the display device 1031, and “2 minutes” and “5 minutes” are operated by operating the resolution radio button 1201 in the life data display window 1200 via the input device 1032. ], “10 minutes”, or “15 minutes” is acquired as the resolution setting.
- the display setting acquisition program 400 acquires one of “width adjustment” and “entire display” as a screen adjustment setting by operating the screen adjustment radio button 1202 in the life data display window 1200. To do.
- the display setting acquisition program 400 acquires a main sleep display presence / absence setting for setting whether to highlight main sleep by operating the main sleep display check box 1203 in the life data display window 1200.
- the display setting acquisition program 400 acquires a time line display presence / absence setting for setting whether or not to draw a time line by operating a check box 1204 for drawing a time line in the life data display window 1200.
- the display setting acquisition program 400 displays the period setting dialog 12050 shown in FIG. 15 by the operation of the period setting button 1205 in the life data display window 1200 and indicates the start date and the end date for drawing the display data.
- the display period setting is acquired, and the display area setting for setting the range of the horizontal axis of the display data (display start time to display end time) is acquired by inputting to the display area text box 1206.
- the display setting acquisition program 400 may make it easier for the user to check the status of the program by displaying a message to that effect on the status label 1208 when the setting is changed in each of the above processes.
- a radio button is one of the basic components that make up the GUI, and one of the grouped radio buttons can be selected by operating an input device such as a mouse. For example, “10 minutes” is selected in the resolution check box 1201 shown in FIG. 12, but the selection of “10 minutes” is canceled by clicking the “2 minutes” check box with the mouse. And “2 minutes” is selected.
- the check box is one of the basic components constituting the GUI, and toggles the state selected by operating an input device such as a mouse. For example, the main sleep display check box 1203 in FIG. 12 is not selected, but when this check box is clicked with the mouse, this check box is selected (a check mark is added). State). When the check box is selected, the mouse is clicked again to return to the state where the check box is not selected.
- the display data drawing program 500 draws display data based on the display settings acquired by the display setting program 400 and displays the display data in the drawing area 1207. At this time, by displaying a message summarizing the contents of each process constituting the display data drawing program 500 on the status label 1208, the user can easily recognize the program status.
- the display data drawing program 500 may be executed as a result of mouse input to an execution button (not shown), may be executed at a predetermined cycle (such as every 10 seconds), or the display setting acquisition program 400 may perform display settings. It may be executed due to the fact that one of the above has been changed.
- the display data drawing program 500 is set so that the horizontal axis is 0 o'clock on the left, the right is 24 o'clock, and the time increases from left to right.
- the display data is displayed in a tapestry or tile form for 0 to 24:00 on the specified date.
- the display data drawing program 500 displays one display data as a rectangular drawing region (block) with the selected resolution setting (time width), and from 0 o'clock to 24 o'clock at the resolution setting time interval. Are displayed continuously in the horizontal direction within the drawing area 1207. Then, the display data drawing program 500 continuously displays a plurality of display data in the horizontal direction in the drawing area 1207 with the resolution setting selected for each date, so that the tapestry or tile shape along the time series is displayed. Display data can be arranged on the screen, and the behavioral characteristics of the person associated with the display data can be presented.
- FIG. 13 is a flowchart showing an example of processing by execution of the display setting acquisition program 400 of the PC 103.
- these processes show an example of receiving a command by an operation of the input device 1032 to the life data display window 1200.
- settings regarding display may be written in a setting file that can be changed from the outside.
- the setting may be directly written in the display setting acquisition program 400 or the display data drawing program 500.
- the PC 103 acquires the resolution setting from the resolution radio button 1201 of the life data display window 1200.
- the resolution setting is a numerical value between “2 minutes” and “16 minutes” that sets a time width indicated by one drawing segment of display data.
- the time width indicates the number of aggregate data per minute stored in the aggregate data table 250, and is a value for displaying a representative value of a plurality of aggregate data included in the time width as one display data. is there.
- time width when the time interval for totaling data is 1 minute as described above, if the time width is set to “2 minutes”, one display data is a color representing a representative value of two total data (described later) When the time width is set to “16 minutes”, one display data is displayed in a color (to be described later) representing the representative value of the 16 total data.
- the time width value the higher the resolution, and the larger the time width value, the lower the resolution.
- the resolution setting is a value that can divide the maximum number of data per day (for example, 1440).
- the resolution can be set to one of “2 minutes”, “5 minutes”, “10 minutes”, and “15 minutes” by the resolution radio button 1201 of the life data display window 1200.
- a text box may be prepared so that any numerical value from “2 minutes” to “16 minutes” can be input.
- the PC 103 stores the resolution setting acquired in the life data display window 1200 in an area (not shown) defined in the temporary memory 108.
- the set resolution setting (for example, “the resolution has been set to“ 10 minutes ””) is displayed on the status label 1208, so that the contents of the process can be displayed. It can be easily visible.
- a fine resolution cannot be selected according to the display capability of the display device 1031.
- the number of pixels that can be displayed on one screen is small, such as a mobile terminal, it is desirable to be able to specify a fine resolution because it is easier to grasp the behavior when displayed with a rough resolution. That is, when the minimum value of the time width is “2 minutes” as described above, and the number of pixels in the display area of the display device 1031 is less than 720 pixels, the aggregated data for 24 hours is represented by the display data for each “2 minutes”. Since it cannot be displayed, it is desirable to appropriately regulate the minimum value of the time width according to the number of pixels that can be displayed on the display device 1031.
- step S32 the PC 103 acquires screen alignment settings.
- the screen alignment setting when display data is displayed in the drawing area 1207 of the display device 1031, the horizontal width of the display data is adjusted to the maximum width allowed by the horizontal width of the drawing area 1207, and the vertical length of the display data is the drawing area.
- “width adjustment” configured to display a portion of display data that could not be displayed at once, and the horizontal width of the display data are displayed in the drawing area.
- the display data is adjusted by adjusting the vertical width of the display data to the maximum width allowed by the vertical length of the drawing area 1207 and the display data by reducing the horizontal width of the display data accordingly. Is selected by operating the input device 1032.
- step S33 the PC 103 acquires the main sleep display presence / absence setting.
- the main sleep display presence / absence setting sets whether or not the main sleep included in the display period in the sleep area stored in the sleep analysis data table 350 is highlighted on the display data in the drawing area 1207.
- FIG. 14A shows an example of a screen displayed with emphasis on main sleep.
- the main sleep in the detected sleep area is highlighted by the white band sleep area 1211 drawn in the drawing area 1207.
- step S34 the PC 103 acquires the setting of whether or not to display the time line.
- the time line display presence / absence setting is a setting as to whether or not to display a vertical line representing a change in time on the display data in the drawing area 1207 in the life data display window 1200.
- the PC 103 temporarily stores the time line display presence / absence setting acquired in step S34 in an area (not shown) defined in the temporary memory 108.
- An example of a screen in which a time line is displayed on the display data in the drawing area 1207 is shown in FIG. 14B. In the screen example shown in FIG.
- a white vertical time line 1212 representing the time is displayed every 3 hours, but the interval between the time lines 1212 is not limited to every 3 hours.
- the life data display window 1200 may be provided with a text box or a dialog (not shown) so that the interval of the time line to be displayed can be designated.
- step S35 the PC 103 acquires the display area setting.
- the display area setting is a time setting on the left and right ends of the horizontal axis of the display data in the drawing area 1207.
- an example is shown in which the left and right end times are set by two numerical values input to the display area text box 1206 in the life data display window 1200.
- the PC 103 temporarily stores the main sleep display presence / absence setting acquired in step S35 in an area (not shown) defined in the memory 108.
- FIG. 12 illustrates an example in which the display area setting is designated from 0 o'clock to 24 o'clock. For example, a person who wears the bracelet type sensor node 1 only during business hours is within a fixed time (8 o'clock).
- the time at the right end is not 24:00.
- the display area setting (for example, “the display area was set from 9 o'clock to 17:30”) is displayed on the status label 1208 when the processing is completed. It can be easily recognized by the user.
- step S36 the PC 103 acquires the display period setting.
- the display period setting is a setting of a period (a start date to an end date) that includes two dates of a start date and an end date, and is a date on which display data is displayed in the drawing area 1207.
- the PC 103 temporarily stores the period setting acquired in step S36 in an area (not shown) defined in the memory 108.
- an example is shown in which the period setting dialog 12050 shown in FIG. 15 is presented due to a click operation on the period setting button 1205 in the life data display window 1200.
- the period setting dialog 12050 shown in FIG. 15 displays the last one month from the last date and time in the last month based on the last date and time of the user data stored in the total data table 250 by the period radio button 12051. Displays the last three months from the date and time, the last six months from the last date to the last half year, the last year from the last date to the last year, and all the user data stored in the summary data table. It is possible to select one of the whole period and the period designation for designating the display period by the period setting text box 12052. The selected setting is determined as the period setting by clicking the OK button 12053 with the mouse. In addition, when this processing is completed, the determined display period setting (eg, “the display period has been set from March 1, 2009 to March 31, 2009”) is displayed on the status label 1208. This makes it easy for the user to visually recognize the contents of the processing.
- the period setting radio button 12051 is set to “period specification” in advance, and the drawing area 1207 is operated by dragging the mouse.
- the period designation text box 12052 may acquire a period corresponding to the area 1213 selected in the drawing area 1207.
- FIG. 16 is a flowchart showing an example of processing performed by the display data drawing program 500 of the PC 103.
- the display data drawing program 500 secures a drawing buffer (not shown) sufficient for drawing in the memory 108, and starts drawing after making the drawing buffer blank.
- step S ⁇ b> 41 total data for each unit time totalized by executing the data totalization program 200 is read from the total data table 250.
- the period of the total data read in step S41 is determined from the display period setting and the display area setting acquired by the display setting acquisition program 400 by the above-described processing. That is, the start date and time of the period in which the PC 103 acquires the aggregate data from the aggregate data table 250 is the display area setting start time and the display period setting start date.
- the end date and time of the period to be acquired is the display region setting end time and the display region setting end time if the display region setting end time is earlier than 24:00. If it is after 24:00, it is the end time of the display area setting on the day after the end date of the display period setting. Further, by displaying the contents of the process (eg, “starting data capture”) on the status label 1208 at the start of this process, the contents of the process can be easily seen by the user.
- start date capture e.g., “starting data capture”
- step S42 the resolution of the display data is lowered to the set value (resolution set value) by setting any resolution for calculating the representative value from the total data read in step S41. That is, in the life visualization system of the present embodiment, the total data is a value for every minute and the total data for the day is 1440, but the display of the day is displayed by applying the setting of the resolution “10 minutes”. Convert the data so that there are 144 records.
- the exercise frequency, exercise intensity, or number of walks of the aggregate data read in step S41 is aggregated into a plurality of aggregate data based on the resolution setting, and the sample value, maximum value, minimum value, average value, or center of the aggregate data Values are calculated as representative values.
- ⁇ Set the value of a predetermined part such as the first value and the tenth value among the values of the ten aggregate data included in “10 minutes”, which is the set resolution, as the sample value.
- the maximum value is the maximum value among the 10 data.
- the minimum value is the first value of 10 data.
- the average value is an arithmetic average value of 10 data.
- the median is the value of the fifth data when 10 data are arranged in descending order.
- the resolution setting process for reducing the resolution is known or publicly known in addition to the above as long as the resolution setting is a process for calculating one value representative of a plurality of aggregate data included in one display data. The method can be applied.
- the data period may be corrected by excluding the missing data.
- the ratio of missing data in the data period is equal to or greater than a predetermined threshold, it is desirable to use a corrected representative value marked as a missing value. For example, by including an abnormal value such as “ ⁇ 1”, it can be clearly indicated that a missing value is included.
- the data period may be corrected by excluding the non-wearing data.
- the percentage of non-wearing data in the data period is equal to or greater than a predetermined threshold, it is desirable to use a value after correction marked as non-wearing data. For example, by setting the value to an abnormal value such as “ ⁇ 2”, it can be clearly indicated that non-wearing data is included.
- start data resolution setting By displaying the contents of the process (for example, “start data resolution setting”) on the status label 1208 at the start of this process, the contents of the process can be easily seen by the user.
- each value of the representative value generated from the resolution setting value output in step S42 is converted into a color (addition of color data), so that the display data corresponding to the resolution setting is time-sequentially.
- a typical color array For example, if the saturation and lightness are fixed to the maximum using the motion frequency and hue conversion formulas shown in FIG. 17, when the motion frequency is 0 (still), the hue is 270 ° (blue) When the frequency is 250 or more, the hue is 0 ° (red), and the higher the exercise frequency, the warmer the color becomes.
- step S42 the missing value is ignored and the remaining aggregate data is used to correct the resolution. In this data period, the saturation is determined according to the proportion of the effective aggregate data.
- the brightness may be set to half.
- sections with more missing data in the aggregated data become closer to gray, so that the missing part of the aggregated data can be easily understood visually.
- the value of the total data is marked as non-wearing, it may be easy to visually grasp the non-wearing period by setting this to a predetermined characteristic color such as dark gray.
- the processing content for example, “data is converted to color”
- the processing content can be easily seen by the user.
- step S44 the date axis is drawn in the drawing area 1207.
- the date and day of the week to which the oldest data of the tabulated data acquired in step S41 belongs is displayed at the top on the left side of the drawing area 1207 shown in FIG.
- the Saturday date and day of the week may be displayed in blue
- the Sunday date and the day of the week may be displayed in red
- the date specified by a separate table or external input means may be displayed in a different color. In this way, clarifying the change of the week or highlighting holidays has the effect of making it easy to understand the reasons for changes in life.
- the height of each line may be set so that the ratio of the line height to the width is fixed when the screen alignment setting is “width alignment”, and the height may be changed according to the width of the drawing area 1207. . Furthermore, the height may be changed in accordance with the width of the drawing area 1207, and a restriction may be added that the height of each row does not fall below a predetermined minimum value that is readable by the display capability of the display device 1031. Further, when the screen alignment setting is “entire display”, the height of the line is naturally determined by the height of the drawing area 1207 / the number of display days.
- the date display size is increased and the date is set every other week.
- the readability of the date can be increased.
- the row height may be changed by, for example, a mouse wheel operation or an operation on a zoom button (not shown).
- a mouse wheel operation for example, when the mouse wheel is turned in one direction, the display is enlarged in the vertical direction, and when the mouse wheel is turned in the opposite direction, the display is reduced in the vertical direction.
- the display data (one drawing area) is enlarged in the drawing area 1207 by setting the enlargement operation at the time of the mouse wheel operation only in the vertical direction, and the set display area (for example, 0:00) 24 o'clock) can be displayed.
- the set display area for example, 0:00
- step S45 the time axis is drawn in the drawing area 1207.
- the display area setting start time set by the display setting acquisition program 400 is displayed in the leftmost drawing area 1207 shown in FIG. 12, and the display area setting end time set by the display setting acquisition program 400 is displayed in the drawing area 1207. It is displayed on the far right and the time is evenly arranged between the start time and the end time.
- the time axis is a guide in the horizontal axis direction in the figure for determining the position of display data, and can be drawn in any color or colorless. In the present embodiment, an example in which the time axis is drawn with no color is shown.
- the screen alignment setting is “width alignment”
- the drawing is performed such that the left end of the axis is the left end of the drawing area 1207 and the right end of the axis is the right end of the drawing area 1207.
- the length of the axis may be reduced so that the ratio of the length and width of one line is constant.
- the display size of the time may be reduced so as to be associated with the axis, may be a predetermined fixed value, or several hours instead of being displayed every other hour so that it can be displayed with a specific fixed value. The time may be displayed everywhere.
- the effect of displaying the time indicated by the scale on the time axis is not greatly impaired.
- attention can be drawn to a specific time zone by changing the color of a specific time such as 0:00 or 12:00 or changing the size of a character.
- the time specified by the user may be displayed on the time axis by inputting the time from an input means (not shown). Thereby, the display emphasized according to the needs of an individual's life pattern can be performed.
- the processing content for example, “drawing the time axis”
- the processing content can be easily seen by the user.
- the left end of the time axis does not depend on the display area set by the display setting program 400, but the sleep type 354 value of the sleep area group stored in the sleep analysis data table 350 is the main sleep.
- the end time of the sleep region that is, the wake-up time of the main sleep may be the left end of the axis.
- a person's day does not start at 0:00, but the sensation begins with getting up. Therefore, by displaying the wake-up time as the origin, it is possible to present life data that better matches the sense of life of the person.
- FIGS. 46A and 46B This display example is shown in FIGS. 46A and 46B.
- FIG. 46A is a screen image of the drawing area 1207 when the sleep region 1211 is highlighted.
- FIG. 46B is a screen image of the drawing area 1207 when the sleep region 1211 is excluded.
- the sleep region 1211 of the display period is highlighted, but in FIG. 46B, the wake-up time of each day is displayed at the left end.
- the time axis does not represent time, but represents “elapsed time after waking up”. For example, in subjects suffering from diseases that make it difficult to maintain a high activity level for a long time after waking up, such as sleep disorders and chronic fatigue, the amount of activity is not ⁇ time '' but rather the time that has elapsed since waking up Interested in those who check in.
- this display method it can be expected that the time zone in which the amount of activity decreases in the life of a person suffering from such a disease is displayed in a position that is easy to see vertically, and thus the degree of the disease can be visualized. . And if you live a regular life, the width of the day should be close to 24 hours. For this reason, there is an effect that it is possible to confirm how much of one's life has been varied by confirming how much the length of the day varies with 24 hours as a reference. In order to make it easy to visually recognize the criterion of this determination, a vertical line may be drawn at a 24-hour position.
- the horizontal axis represents the ascending order of time and the vertical axis represents the descending order of date.
- the present invention is not limited to this, and the horizontal axis may be the date and the vertical axis may be the time.
- the ascending order may be reversed.
- step S46 the color array generated in step S43 is drawn for each display data.
- One display data corresponds to one representative value calculated in step S42.
- the display data width corresponds to the value selected by the resolution radio button 1201.
- the PC 103 sets each color included in the color array to the position indicated by the date axis drawn in step S44 and the time axis drawn in step S45, with the width set by the row height and resolution set in step S44. Draw a rectangle. At this time, in order to make it easy to see between the rows, a horizontal line (for example, gray) may be drawn between the rows.
- a horizontal line for example, gray
- step S47 when the main sleep display presence / absence setting set by the display setting acquisition program 400 is valid, the main sleep region 1211 is drawn.
- the value of the sleep type 354 is the main sleep
- the end time 353 is after the start date and time of the period acquired in step S41.
- An area having a start time 352 before the end date / time of the period acquired in step S41 is acquired.
- these periods are visually displayed such as white in a part of the height of the row indicated by the date axis drawn in step S45 and the time axis drawn in step S45. Draw with distinguishable colors.
- the main sleep may be displayed in a form that only partially hides the row in the height direction, such as the upper half and the lower half, or may be displayed using the entire height of the row.
- the behavior data behind may be displayed visually while emphasizing the sleep region by subjecting the display of the sleep region to transparent processing.
- evaluation information (0: bad sleep to 5: good sleep) and comments input or derived by calculation in another input means (not shown) and stored are acquired, and the sleep area is drawn on the drawing area.
- You may visualize the time-series changes in the quality of sleep by displaying on the screen.
- step S48 supplementary information is given to the viewer of the display device 1031 by displaying, in a predetermined expression method, a portion where a predetermined human behavior that can be discriminated other than sleep is detected.
- an example of highlighting the jogging period is shown as an example. Since the exercise intensity during walking is stable in human behavior, it is possible to set a threshold of exercise intensity that distinguishes between normal walking and jogging. For example, it is possible to determine the jogging period by determining walking when the number of walks is 0 or more and the exercise intensity is equal to or less than a predetermined threshold value, and jogging when the exercise intensity is equal to or greater than the threshold value. Therefore, a visually distinguishable display is performed in a predetermined color (for example, white) as shown in FIG. 24A in the region 1214 where the jogging state has continued for a predetermined time (for example, “10 minutes”). This makes it easier to visually grasp the period during jogging. For example, since a person who frequently jogs often starts jogging at the same time every day, long-term fluctuations in jogging time can be confirmed by displaying in this form.
- a predetermined color for example, white
- the number of walks (running pitch) at that time is displayed as a line graph on the highlighted display of the region 1214 shown in FIG. 24A, thereby changing the running pitch during jogging. It can also make it easier to grasp visually. By displaying in this form, it is possible to confirm the fluctuation of the pitch during jogging.
- the pulse may be illustrated as a line graph.
- the wristwatch-type sensor node 1 moves less frequently, but the position is moving. Indicates that the vehicle is on a vehicle. Further, by comparing the moving position with the map information, it is possible to determine whether the locus of movement is on a track or on a road, that is, whether it is a train movement or a car movement. Furthermore, since it is possible to determine whether the plane is moving by referring to the altitude information of the position, the section is highlighted and displayed in a single color on the drawing area 1207 in the time zone in which it is determined that the vehicle is on the vehicle. By displaying an icon representing a vehicle, the usage pattern of the vehicle in life can be visualized.
- step S49 the PC 103 displays the comments stored in the comment input table 650 on the drawing area 1207.
- the comment input table 650 is input by executing a comment input program 600 described in detail later.
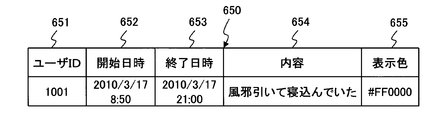
- FIG. 22 is an explanatory diagram showing an example of the format of the comment input table 650.
- a user ID 651 that stores the identifier of the wearer of the bracelet type sensor node 1 (user of the life visualization system)
- a start date and time 652 that stores the start date and time of the section in which the comment is displayed
- the comment One entry includes an end date and time 653 for storing the end date and time of the displayed section, a content 654 for storing the content of the comment, and a display color 655 for storing the background color specified when displaying the content of the comment. Composed.
- step S49 among the comments stored in the comment input table 650, a comment whose end date / time 653 is after the start date / time of the period acquired in step S41 and whose start date / time 652 is before the end date / time of the period acquired in step S41.
- a comment whose end date / time 653 is after the start date / time of the period acquired in step S41 and whose start date / time 652 is before the end date / time of the period acquired in step S41.
- the entire area 1215 of the row height indicated by the date axis drawn in step S44 and the time axis drawn in step S45 is displayed in the display color 655.
- the color specified in is displayed in a visually distinguishable manner.
- the comment section may be displayed in such a form that the line is only partially hidden in the height direction, such as the upper half, the lower half, and the center.
- the character string 1216 of the comment content 654 is drawn in a color that can be visually recognized on the display color 655. For example, by drawing the comment content 654 in the color opposite to the display color 655, the character string becomes visible. At this time, by transparently processing the display of the comment, the action data behind may be made visible while emphasizing the comment.
- the comment 1216 by placing the comment 1216 not on the display data but next to the display data, the comment can be browsed without impairing the visibility of the data.
- the above configuration allows the display of life data and comments on the life data at the same time, rather than a diary or blog that simply displays comments. It is possible to build a life visualization system that presents a rich life record.
- step S491 when the time line drawing presence / absence setting set by the display setting acquisition program 400 is valid, the time line is drawn on the drawing area 1207.
- the time line 1212 may draw a vertical line representing the time from each time represented by the time axis, or may be drawn every hour or every predetermined time.
- the image may be drawn at every time or time set by another input means (not shown).
- the color of the time line 1212 is preferably a color that is easily emphasized, such as white, but is not limited to white.
- step S5 the contents of the drawing buffer existing on the memory 108 drawn in steps S41 to S491 are output to the display device 1031 and displayed in the data drawing area 1207 of the life data display window 1200 which is a GUI screen.
- a vertical scroll bar may be arranged as shown in FIG.
- the date 1216 at the position where the cursor is located is displayed on the date axis with the display color and the background color. It may be highlighted by changing it. Note that only the display color may be changed, only the background color may be changed, or the display size may be changed.
- the time selected with the cursor and the amount of exercise at that date may be displayed on the status label 1208. As a result, the user can easily know the date and contents of the data he / she is interested in.
- the user clicks on the drawing area 1207 with a mouse or the like, and the region 1213 from the clicked position to the last dragged point is selected as shown in FIG. You may display so that it can distinguish. Further, by displaying the selected period and the length of the period on the status label 1208, the contents of the date and time of the area in which the user is interested can be simplified.
- the resolution set in step S42 is the same for all data
- the row height set in step S44 is the same for all rows.
- the resolution and line height may be defined as a function of the cursor position of the mouse and the date and time during drawing. For example, within 2 days before and after the date indicated by the cursor, the line height is drawn at 10 pixels with a resolution of “2 minutes”, and within 2 days before and after 2 days before and after the line height with a resolution of “5 minutes”. It is preferable to draw with 5 pixels, and draw the other areas with a resolution of “10 minutes” and a row height of 2 pixels.
- the position of the cursor is considered to represent the area that the user is paying attention to.
- the above function does not depend on the cursor position, but sets the latest date and time of the displayed data to the highest resolution and line height, and the resolution gradually increases from there. You may define as a function which becomes small. In general, since the past data becomes less interesting to the user, the past fine actions are less meaningful. Therefore, past data is displayed in such a small and coarse manner, so that recent data that is interested in fine behavior is displayed in a fine resolution and large lines, and past data that is not interested in fine behavior is displayed in rough resolution. It has the effect of being displayed small.
- the display area information acquired by the display setting acquisition program 400 is as follows. You may restrict
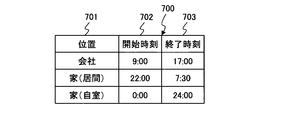
- FIG. 25 is an explanatory diagram showing an example of the format of the position-specific display area table 700.
- one entry is constituted by a position 701 for cross-referencing with the current location of the display device 1031, a start time 702 of the display area to be restricted, and an end time 703 of the display area to be restricted. Is done.
- step S ⁇ b> 35 the display setting acquisition program 400 uses the position-specific display area table 700 to acquire two numerical values input to the display area text box 1206 as temporary display area settings, and then outputs them from the display device 1031.
- Value for example, “company”
- an entry having the same value as this value at the position 701 is acquired from the position-specific display area table 700, and the start time 702 and end time of the acquired entry are acquired.
- the period indicated by 703 is acquired as the display restriction area.
- the later of the acquired provisional display area setting start time and the display restriction area start time is determined as the display area setting start time.
- the earlier one of the acquired temporary display area setting end time and the display restriction area end time is determined as the display area setting end time.
- the display area setting is acquired.
- the company defines that the display area is limited from 9:00 to 17:00.
- the display setting program 400 refers to the position-specific display area table 700 to limit the display. Information with the area from 9:00 to 17:00 is obtained, and the display area is set to 10:00 to 17:00.
- the contents of the position-specific display area table 700 may be added or edited by the user on a GUI screen (not shown), or may be defined in advance in the program.
- the PC 103 is a mobile terminal such as a mobile phone
- data generated outside the company is confirmed by a person other than itself, and privacy is not violated.
- the display area is limited.
- the display period may be set similarly, and for example, the company may be configured to be able to define restrictions such as not displaying weekend data.
- the display data drawing program 500 executes the comment input program 600 due to a click operation of a mouse or the like on a comment input button (not shown).
- FIG. 21 is an explanatory diagram showing an example of a comment input dialog 12090 which is a GUI screen related to processing by execution of the comment input program 600 of the PC 103.
- the comment input program 600 receives an input from the input device 1032 to the comment section text box 12091, acquires a section in which a comment is displayed, acquires the display content of the comment by input to the comment content text box 12092, and displays it.
- the background color of the comment displayed by the input to the color text box 12093 is acquired.
- the display color is input to the text box 12093. If the GUI function of the OS of the PC 103 has a control for selecting a color, a function for selecting one of a plurality of colors can be used instead. Also good.
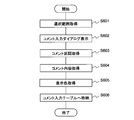
- FIG. 20 is a flowchart showing an example of processing by execution of the comment input program 600 of the PC 103.
- step S601 when the PC 103 provides the drawing area 1207 with the period selection function (area selection function) shown in FIG. 19, the area selected by the operation of the input device 1032 is acquired as the comment input section. .
- the PC 103 extracts the start date and time and the end date and time as the comment input section from the area selected by the input device 1032.
- step S602 the comment input dialog 12090 shown in FIG. 21 is displayed on the display device 1031.
- the comment input section is acquired in step S601
- the acquired comment input section is displayed in the comment section text box 12091.
- Step S603 is executed due to the operation of the OK button 12094. Specifically, the content of the comment section text box 12091 is acquired as a comment section.
- step S604 the content input in the comment content text box 12092 is acquired as the comment content.
- step S605 the content input in the display color text box 12093 is acquired as the display color.
- step S606 the comment section (start date / time, end date / time), contents, and display color are acquired, and the acquired data is stored in the comment input table 650 of the storage device 1100.
- the comment input program 600 can be started by a predetermined operation, and the period, content and display color for adding the annotation can be set. it can.
- FIG. 27A is an example of a graph showing the relationship between the resolution setting of the present invention and the exercise frequency.
- FIG. 27B is an example of a graph showing the relationship between the resolution setting and the exercise intensity of the present invention.
- step S14 of FIG. 6 with respect to the total data of users of a certain bracelet type sensor node 1, an exercise frequency is calculated every minute, an autocorrelation R ( ⁇ ) of the exercise frequency is calculated, and ⁇ ( FIG. 27A shows a graph plotted by changing (time).
- the autocorrelation R ( ⁇ ) is obtained by applying a well-known autocorrelation function to the aggregated data every minute. As shown in FIG.
- the range (behavior half-life) affected by a certain behavior that is, the autocorrelation R ( ⁇ ) is less than 0.5.
- the time (window width in the figure) ⁇ is around “16 minutes”.
- the exercise intensity per minute is calculated in step S15 of FIG. 6, the autocorrelation R ( ⁇ ) of the exercise intensity is calculated, and the time (window width in the figure) ⁇ is changed and plotted.
- the resulting graph is shown in FIG. 27B.
- the autocorrelation R ( ⁇ ) falls below 0.5 when the time (window width in the figure) ⁇ is around “15 minutes”. From this, it can be seen that it is possible to present human behavior in a form that is easy to grasp by showing data with a resolution close to “16 minutes” as in the case of the exercise frequency.
- one display data (life data) is aggregated every minute for a maximum of 16 minutes, that is, the time width of one display data is 16 By setting the minutes, it is possible to easily grasp the characteristics of human behavior.
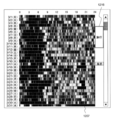
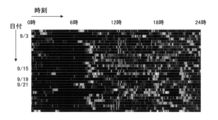
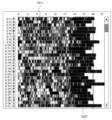
- the display is as shown in FIG. 26C.
- the distinction between the sleep period and the awakening period is easy to understand, and the content of each action is displayed at a level that can be inferred.
- the minimum value of the resolution setting range is set to a small value (for example, 1 minute), as shown in FIG. 26A of the conventional example, it becomes difficult to distinguish between sleep and awake periods, It cannot be grasped effectively.
- the total data per minute included in one display data is set to a minimum of two minutes, that is, the time width of one display data is set to two minutes that is twice the time interval (1 minute) of the total data.
- the display resolution is important in order to grasp the whole image of long-term data representing human behavior. As shown in FIG. 26A and FIG. 26B, life data cannot be effectively visualized if the resolution is too high or too low.
- life data is obtained by consolidating a plurality of aggregated data into representative values so that the viewer can easily understand. Then, the values of life data are converted into color data and displayed. Thereby, life data indicating human behavior can be obtained as time-series color data from human sensing data over a long period of time, and information that can easily identify a sleep period or awake period is output to the display device 1031. It becomes possible to do.
- the display data drawing program 500 further displays a sleeping area, a jogging area, a comment, and the like on the drawn life data in steps S47, S48, and S49.
- additional information is information that hinders looking over the entire life data. Therefore, the sleep area, jogging area, and comment may be displayed within a predetermined number of days from the date and time indicated by the cursor position of the mouse, or within a predetermined number of days from the latest date of all displayed data.
- the sleep area, jogging area, and comment are displayed within one day from the cursor position
- the sleep area and jogging area are displayed within two to four days of the cursor
- the sleep is displayed within five to seven days of the cursor.
- the amount of supplementary information may be reduced in stages, such as displaying an area. As a result, detailed information such as sleep and jogging can be obtained only in the region to be noticed, and the data can be browsed as an outline in the region that is not desired to be noticed.
- the difference in the activity amount (exercise frequency or exercise intensity) of the life data is expressed by the difference in color.
- the magnitude of activity may be expressed by intensity.
- the acceleration sensor 6 of the bracelet type sensor node 1 measures the amount of exercise of the user, the measured amount of exercise is stored in the storage device 1100 of the PC 103, and the measured amount of exercise is analyzed to obtain “2 minutes
- the life data can be presented in a form that is easy for the user to grasp at a resolution between “16 minutes” and “16 minutes”.
- the acceleration sensor 6 of the bracelet type sensor node 1 is used to detect the amount of exercise of the user (human body) as a life visualization system.
- a living body that can detect the amount of exercise of the human body.
- a sensor that detects a pulse, the number of steps, or the like can be used, or the amount of exercise of the human body may be measured from a combination of these pieces of biological information.
- the degree of concentration and / or the degree of rest may be presented using an electroencephalogram measuring apparatus.
- biometric information not only biometric information but also position information of a human body acquired by position information such as GPS and / or a mobile terminal may be used, or device operation history in an office and a device such as an active RFID tag are used. Then, a face-to-face history with a person may be used.
- the example in which the bracelet type sensor node 1 measures the acceleration is 1 second.
- this period is not limited to 1 second, and the acceleration sensor is a period in which a person's momentum can be grasped. 6 may detect the acceleration.
- the example is shown in which the PC 103 calculates the total data with the time interval for totaling the sensing data as one minute.
- this time interval is not limited to one minute, and the minimum time width of resolution setting (this The time interval may be shorter than 2 minutes in the embodiment.
- aggregate data is calculated from sensing data measured by a bracelet sensor node 1 attached to a plurality of people (users), and the calculated aggregate data is used as a server on a network.
- a life visualization system collected in 104 and presented to the user's client computer (PC) 203 will be described.
- FIG. 28 is a block diagram illustrating a configuration example of a life visualization system according to the second embodiment.
- the life visualization system according to the present embodiment uses the bracelet type sensor node 1 including the acceleration sensor in the same manner as in the first embodiment in order to detect the operation (or state) of the user of the system.
- the acceleration of the arm is detected as biometric information.
- the bracelet type sensor node 1 is the same as in the first embodiment described above, is mounted on the user's (or participant's) arm, detects acceleration, and uses the detected acceleration data as sensing data at a predetermined cycle. It transmits by radio to the base station 102 via the antenna 101. When wired communication is possible, the bracelet type sensor node 1 transmits sensing data to the PC 203 via a USB connection or the like.
- the base station 102 and / or the client computer (PC) 203 communicates with a plurality of bracelet type sensor nodes 1, and receives and receives sensing data corresponding to the movement of the user from each bracelet type sensor node 1. Sensing data is transferred to the server 104 via the network 105.
- the server 104 stores the received sensing data in the storage device 2100, calculates the total data of each user by performing the same analysis as in the first embodiment, and represents the representative value of the total data based on the resolution setting. Generate display data.
- the server 104 is configured to accept an operation from the PC 203 by the user, and output display data of the user or other users to the display device 2031 or the like connected to the PC 203 so that the user can browse.
- the PC 203 transmits sensing data measured by the bracelet type sensor node 1 to the server 104, and the server 104 generates display data.
- part or all of the analysis is performed by the PC 203 instead of the server 104. May be.
- the number of zero crossings per minute which will be described later, may be analyzed by the PC 203 and zero cross data may be transmitted to the server 104 instead of sensing data.
- 24 [hours] ⁇ 60 [minutes] ⁇ 60 [seconds] ⁇ 20 [samples] ⁇ 3 [axis] 24 [hours] instead of 5,184,000 bytes of sensing data per day.
- ⁇ 60 [minutes] 1440 bytes of zero-cross data only need to be transmitted, so that even in an environment where the data communication speed of the network 105 is low, the load on the network 105 is small and the same effect can be obtained.
- FIG. 29A and FIG. 29B are block diagrams illustrating components of the life visualization system according to the second embodiment.
- the sensing data transmitted by the bracelet type sensor node 1 is stored in the sensing data table 1150 of the storage device 2100 of the server 104 via the base station 102 or the PC 203 and the network 105.
- the PC 203 is connected to a display device 1031 that displays various types of information as in the first embodiment and an input device 1032 that allows various information to be input by user operations.
- the processing executed by the PC 203 includes processing for transferring sensing data from the base station 102 to the server 104 and receiving content such as windows, text, and drawing data from the server 104. Then, processing to output to the display device 1031 and processing to transmit input data received from the input device 1032 to the server 104 are executed.
- the PC 203 can execute processing for transmitting / receiving content and input data to / from the server 104 using a web browser or the like.
- the display device 1031 may be a display terminal such as a liquid crystal display or a CRT display, and may be a printer or an image file output device.
- the input device 1032 is an input device such as a keyboard and a mouse.
- the display device 1031 and the input device 1032 may be a single device having both functions, such as a touch panel display.
- the server 104 includes a network interface 1106, a processor 1107, a memory 1108, and a storage device 2100.
- the network interface 1106 is an interface for connecting to the network 105.
- the storage device 2100 is a device for recording various programs and various data tables to be described later, such as a hard disk drive, a CD-ROM drive, and a flash memory. Various programs and various data tables may be divided and recorded in a plurality of storage devices.
- the processor 1107 implements various functions by reading various programs stored in the storage device 2100 into the memory 1108 and executing them.
- symbol is attached
- the sensing data measured by the acceleration sensor 6 of the user's arm is totaled, and the total value for each unit time (for example, one minute) is calculated and stored.
- the data is stored in the total data table 250 of the device 2100.
- the sleep analysis program 300 the calculated total value for each unit time is analyzed, all sleep states are detected, and the detected sleep states are stored in the sleep analysis data table 350 of the storage device 2100. .
- the user authentication GUI screen 80000 is displayed on the display device 1031 of the PC 203, and the user ID and password of the user who operates the PC 203 are received by operating the input device 1032;
- the user of the PC 203 is authenticated by collating with the user management table 850, an identifier for identifying the user and a session ID are issued, and the correspondence between the session ID and the user ID is stored in the session ID table 860. Further, by transmitting the issued session ID to the PC 203, the PC 203 can identify its own communication at the next and subsequent communications.
- the session ID issued from the PC 203 is acquired, and only the content that the user corresponding to the session ID is permitted to view.
- a content selection window 80100 (see FIG. 34) is displayed on the display device 1031.
- the content selection window 80100 includes a GUI control for selecting each content permitted by the user of the PC 203.
- the life data display window 1200 Upon receiving the operation of the input device 1032 on the content selection window 80100, the life data display window 1200, the daily summary.
- a data display window 90000, a step count rank window 91000, a sleep input window 92000, and the like are displayed.
- the configuration and operation of the life data display window 1200, the display setting acquisition program 400, the display data drawing program 500, the comment input program 600, the comment input table 650, and the position specific display area table 700 are the same as those in the first embodiment. Those descriptions are omitted.
- the server 104 outputs a daily summary data display window 90000 to the PC 203 due to the operation on the content selection window 80100, and executes the daily summary data drawing program 900 to obtain daily activity data.
- An effective display screen for bird's-eye view is displayed on the display device 1031 and presented to the user.
- the server 104 outputs the step rank window 91000 to the PC 203 due to the operation on the content selection window 80100, and executes the step rank drawing program 910, so that the user can accumulate the day compared with other users.
- An effective display screen for grasping the transition of the number of steps is displayed on the display device 1031 and presented to the user.
- the server 104 uses the sleep data generated by the sleep analysis program 300 by outputting the sleep input window 92000 to the PC 203 and executing the sleep input program 920 based on the operation on the content selection window 80100.
- a display screen that allows the user to correct the activity data while viewing his / her activity data is displayed on the display device 1031 and presented to the user.
- the server 104 executes the data aggregation program 200 and the sleep analysis program 300 based on a periodic cycle or reception of sensing data from the wristwatch-type sensor node 1, and further, the input device 1032 of the PC 203.
- the user authentication program 800, the content selection program 801, the display data drawing program 500, the one-day summary data drawing program 900, the step count rank drawing program 910, and the sleep input program 920 are executed due to the input operation from will be described.
- FIG. 30 shows a user authentication window 80000 which is a GUI screen related to processing by execution of the user authentication program 800 of the server 104.
- a user authentication window 80000 is displayed on the display device 1031 of the PC 203.
- a web browser is executed on the PC 203, and a user authentication window 80000 can be displayed on the web browser.
- the user authentication program 800 acquires the user ID input to the user ID text box 80001 on the web browser of the PC 203 via the input device 1032, and acquires the password input to the password text box 80002. At this time, as shown in FIG. 30, in the password text box 80002, each character is displayed as “*” or the like on the browser screen so that the currently input character string is hidden. It is preferable to be replaced with the characters.
- the user authentication program 800 obtains the user ID and password input on the web browser of the PC 203 via the network 105 due to the click operation of the confirmation button 80004 by the mouse or the like, in the authentication confirmation step described later. If the authentication is successful, the user authentication window 80000 is hidden and a content selection program 810 described later is executed. If the authentication fails, a message such as “User ID / password is incorrect” is displayed in a dialog box (not shown).
- FIG. 31 is a flowchart showing an example of processing by execution of the user authentication program 800 of the server 104.
- step S8001 the server 104 transmits the above-described user authentication window 80000 to the PC 203, receives an operation by the input device 1032 of the PC 203, and receives the input user ID and password.
- step S8002 the server 104 receives from the PC 203 via the network 105 that the confirmation button 80004 of the user authentication window 80000 has been clicked, and acquires the input user ID and password.
- step S8003 the server 104 encrypts the character string of the acquired password.
- Encryption is an operation to convert a character string by calculating a character string using an arbitrary function.
- the function used here has two properties: irreversible (encrypted character string) It is difficult to infer the character string before being encrypted from) and non-collisionality (the property that two different passwords are less likely to become the same character string after encryption) It is preferable.
- a known method may be used, for example, MD5 (Kaliski B, Robshaw M; Message Authentication with MD5) or the like is known.
- step S8004 the server 104 authenticates the acquired user ID and the encrypted password.
- the server 104 refers to a user management table 850 to be described later, and determines that the authentication is successful if there is an entry having the acquired user ID and encrypted password in the user ID 851 and the password 853, and if not, the authentication fails. Is determined. If it is determined that the authentication has failed, the user's PC 203 is notified to that effect by means of a dialog box or the like, and the user authentication window 80000 is again accepted. If the authentication is successful, the process proceeds to step S8005.
- the server 104 issues a session ID that is associated with each user ID in advance and is valid only for a short period (tens of minutes to several hours).
- the session ID must be a character string that does not include an entry including a duplicate session ID in the session ID table 860 described later, and is a long character string generated by a random number (for example, about 60 characters). Preferably there is.
- a session ID is issued, it is recorded in the session ID table 860 together with the user ID for specifying the user and the date and time of issue.
- the PC 203 transmits the issued session ID each time to prove that the data transmitted from the PC 203 is regular communication.
- the server 104 has an effect of reducing the risk of transmitting a password every time communication is performed by using a session ID instead of a password in communication with the PC 203.
- a predetermined time tens of minutes to several hours
- the communication using the session ID is treated as invalid, thereby ensuring the safety of communication.
- the issued session ID is stored in the session ID table 860 together with the user ID and the issue date and time, and the session ID is returned to the PC 203.
- step S8006 the server 104 executes a content selection program 801 to be described later, passes the issued session ID to the content selection program, and simultaneously instructs the PC 203 to hide the user authentication window 80000 on the display device 1031. Send.
- FIG. 32 is an explanatory diagram showing an example of the format of the user management table 850.
- a user ID 851 for storing an identifier of a wearer of the bracelet type sensor node 1 a group ID 852 for storing an identifier of a group to be described later to which the wearer belongs, and a password 853 for storing an encrypted password,
- an entry may be added to the user management table 850 by an external program (not shown).
- FIG. 33 is an explanatory diagram showing an example of the format of the session ID table 860.
- the session ID table 860 the session ID 861 for storing the session ID described above, the user ID 861 for storing the identifier of the wearer of the bracelet type sensor node 1 to which the session ID is issued, and the date and time when the session ID is issued
- One entry is configured from the issue date and time 862 for storing.
- the entry is invalidated after a predetermined time has elapsed from the issue date and time. Therefore, an entry that has passed a predetermined time or more from the issue date and time may be periodically deleted by a program (not shown).
- FIG. 34 is an explanatory diagram showing an example of a content selection window 80100 that is a GUI screen related to processing by execution of the content selection program 801 of the server 104.
- a content selection window 80100 is displayed on the display device 1031 of the PC 203 due to the execution of the content selection program 801.
- the display device 1031 is preferably configured by a liquid crystal display, for example, and a content selection window 80100 is preferably displayed on the web browser.
- the content selection program 801 uses the session ID sent from the user authentication program 800 and, based on the settings described later, a content selection button that represents all the content that is permitted by the user using the PC 203 in the content selection area 80101. Send a command to be displayed.
- FIG. 34 shows an example in which buttons 80102 to 80105 for selecting four contents of “daily summary”, “step count rank”, “sleep input”, and “life display” are displayed in the content selection area 80101.
- the content selection program 801 receives a click operation on these buttons 80102 to 80105 from the PC 203, the content selection program 801 transmits to the PC 203 an instruction to display the content corresponding to the selected buttons 80102 to 80105 in the content display area 80107.
- FIG. 34 shows an example in which the life data display window 1200 is displayed in the content display area 80107.
- the content selection program 801 receives a click operation of the life display button 80105 from the PC 203
- the life data display window 1200 displays content (display command) for the server 104 to display the life data display window 1200 in the content display area 80107.
- the life data display window 1200 is displayed in the content display area 80107 in the display device 1031 of the PC 203.
- the content display area 80107 is an area excluding the content selection area 80101 in the content selection window 80100 displayed on the display device 1031.
- the server 104 transmits content (display command) for displaying the daily summary data display window 90000 in the content display area 80107 to the PC 203. .
- the server 104 transmits content (display command) for displaying the step rank window 91000 in the content display area 80107 to the PC 203.
- the server 104 transmits content (display command) for displaying the sleep input window 92000 in the content display area 80107 to the PC 203.
- FIG. 35 is a flowchart showing an example of processing by execution of the content selection program 801 of the server 104.
- step S8011 the server 104 acquires a session ID issued to the user from the user authentication program 800 described above.
- step S8012 the server 104 acquires a valid entry including the acquired session ID from the session ID table 860.
- a valid entry is an entry whose issue date 862 is within a predetermined time from the current time.
- the server 104 may execute the user authentication program 800 when there are no entries that can be acquired.
- the server 104 acquires the user ID included in the entry, and searches for all entries including the user ID in the display content management table 870 described later.
- the content ID included in these entries is the content ID permitted for the user. For example, in the example shown in FIG. 34, four entries representing four contents of “daily summary”, “step rank”, “sleep input”, and “life display” can be selected.
- step S8013 the server 104 transmits the content of the content selection window 80100 described above and causes the display device 1031 to display the content on the PC 203. Furthermore, the server 104 displays the screen as shown in FIG. 34 on the display device 1031 of the PC 203 by including the content of the content selection button corresponding to the acquired content permitted by the user in the content selection area 80101.
- the server 104 receives the clicked button among the content selection buttons in the content selection window 80100, transmits the content corresponding to the button to the PC 203, and displays it in the content display area 80107 of the display device 1031.
- the PC 203 receives the content from the server 104, displays a display window (for example, the 1-day summary data display window 90000) in the content selection window 80100, and further displays the server 104.
- Means to execute a program for drawing content for example, the daily summary data drawing program 900
- send the session ID to the PC 203 for example, the daily summary data drawing program 900.
- FIG. 36 is an explanatory diagram showing an example of the format of the content management table 870.
- one entry is composed of a user ID 871 for storing the identifier of the user of the PC 203 and a content ID 872 for storing the identifier of the content permitted for the user.
- the content management table 870 is preferably added, edited, or deleted by an external program (not shown).
- FIG. 37 is an explanatory diagram showing an example of a daily summary data display window 90000 which is a GUI screen related to processing by execution of the daily summary data drawing program 900 of the server 104.
- An outline of the operation of the one-day summary data drawing program 900 will be described from the viewpoint of the GUI.
- the server 104 executes the daily summary data drawing program 900 and displays it in the daily summary data window 9000.
- Content display command
- the PC 203 displays the daily summary data display window 90000 received from the server 104 in the content display area 80107 of the content selection window 80100 of the display device 1031.
- the daily summary data drawing program 900 When the daily summary data drawing program 900 receives an operation to the date selection control 90001 or the resolution selection radio button 90002 from the PC 203, the daily data specified by the date selection control 90001 is designated by the resolution radio button 90002.
- the activity amount / exercise graph 90003 and the XYZ average graph 90004 are transmitted to the PC 203 at a resolution and displayed on the display device 1031.
- the date selection control 90001 displays the selected date in the center text box, selects the previous day of the selected date due to the click operation of the left arrow button, and results from the click operation of the right arrow button. The next day after the selected date is selected. Alternatively, the date may be selected by direct input from the keyboard into the central text box.
- the summary data drawing program 900 redraws the activity amount / temperature graph 90003 and the XYZ average graph 90004 due to selection of a new date in any method of selecting a date.
- the resolution selection radio button 90002 represents the resolution of data drawn on the graph, and it is preferable to select any resolution from “2 minutes” to “15 minutes” as shown in the figure.
- the activity / temperature graph 90003 is a bar graph in which time is plotted on the horizontal axis and exercise frequency is plotted on the vertical axis. Since it is represented with a resolution of “2 minutes” to “15 minutes”, the transition of daily activity is visually recognized. This is an effective visualization method. As illustrated, the temperature measured by the sensor node 1 may be displayed as a line graph. Further, the time when the number of walks is 1 or more can be displayed with a darker color so that the walking period can be easily recognized.
- the XYZ average graph 90004 is a graph showing local average values according to the set resolution of the time on the horizontal axis and the X-axis, Y-axis, and Z-axis sensors at that time on the vertical axis.
- the Z-axis is preferably displayed in a distinguishable color such as red, green, and blue.
- red, green, and blue For example, when the bracelet type sensor node 1 is attached to the left arm, the Z axis (blue) tends to have a high value during deskwork work such as hitting a keyboard, and the Y axis (green) has a high value during walking.
- the local average value of the X-axis, Y-axis, and Z-axis values is unique. For this reason, displaying together with the activity amount / temperature graph has an effect of making it easier for the user to grasp his / her own behavior.
- the activity amount / temperature graph 90003 is a graph representing the exercise frequency, but the exercise intensity and the number of walks may be represented instead. Moreover, the exercise intensity graph and the walking number graph may be displayed together.
- FIG. 38 is a flowchart showing an example of processing by executing the daily summary data drawing program 900 of the server 104.
- step S9001 the server 104 acquires the session ID sent from the content selection program 801 and acquires a valid entry including the acquired session ID from the session ID table 860.
- a valid entry is an entry whose issue date 862 is within a predetermined time from the current time. If there is no entry that can be acquired, the user authentication program 800 may be executed. If there is an entry that can be acquired, the user ID included in the entry is acquired.
- step S9002 the server 104 acquires the date selected by the date selection control 90001 from the PC 203 as the target date.
- step S9003 the server 104 acquires the resolution selected by the resolution radio button 90002 from the PC 203 as the display resolution.
- step S9004 the server 104 generates content constituting the activity amount / exercise graph 90003 and the XYZ average graph 90004 from the total data according to the designated target date and the display resolution, and transmits the content to the PC 203.
- step S9005 the PC 203 outputs the received content to the daily summary data display window 90000 in the content display area 80107 of the display device 1031.
- the summary data drawing program 900 acquires all the entries in which the user ID 251 is the acquired user ID and the measurement date 253 is included in the target date from the total data table 250, and the time width corresponding to the specified display resolution Every time, an average value, a maximum value, a minimum value, or a maximum likelihood value of the exercise frequency is calculated as a representative value of the time width, and a bar graph content is generated.
- the minimum value of the vertical axis of the bar graph is preferably fixed to 0, and the maximum value is also preferably fixed to a value such as 350. Regardless of the size of the values included in the aggregated data, fixing the vertical scale has the effect of making it easier to visually grasp the difference in daily activity.
- an X-axis average value, a Y-axis average value, and a Z-axis average value (not shown) included in the acquired total data table 250 are acquired. These average values are calculated by calculating the average value of each axis for the X-axis sensor value, the Y-axis sensor value, and the Z-axis sensor value for each predetermined time in the data totaling program 200, and entering the total data table 250. Is stored.
- the summary data drawing program 900 calculates the average value, the maximum value, the minimum value, or the maximum likelihood value of the exercise frequency for each designated display resolution as a representative value of the time (time width), and the contents of the line graph Is generated. At this time, it is preferable that 0G is displayed at the center of the graph by fixing the minimum value on the vertical axis of the line graph to -4G, the maximum value to 4G, and the like.
- FIG. 39 is an explanatory diagram showing an example of a walking rank window 91000 that is a GUI screen related to processing by execution of the walking rank drawing program 910 of the server 104.
- the outline of the operation of the walking rank drawing program 910 will be described from the viewpoint of the GUI.
- the server 104 executes the walking rank drawing program 910, generates the walking rank content, and transmits the generated walking rank content to the PC 203.
- the PC 203 displays the walking rank window 91000 in the content display area 80107 in the content selection window 80100 of the display device 1031.
- the walking rank drawing program 910 aggregates the sensing data of a plurality of users collected in the server 104, calculates the total number of steps after a predetermined time (for example, 3 o'clock) on a specified date for each user, For the top five users and the user indicated by the session ID sent from the content selection program 910, the transition of the total number of steps from “2 minutes” to “16 minutes” after the predetermined time (3 o'clock) The content of the step count graph 91001 is generated with this resolution.
- the user name of the user represented by each line graph may be acquired from a user name management table (not shown) and displayed in the name label area 91002.
- FIG. 40 is a flowchart illustrating an example of processing by executing the step count rank drawing program 910 of the server 104.
- step S9101 the server 104 acquires the session ID transmitted from the content selection program 801, and acquires a valid entry including the acquired session ID from the session ID table 860.
- a valid entry is an entry whose issue date and time 862 is within a predetermined time from the current date and time. If there is no entry that can be acquired, the user authentication program 800 may be executed. When there is an entry that can be acquired, the user ID included in the entry is acquired as “display user”.
- step S9102 the server 104 acquires the top five user IDs of the total number of steps at the current date and time from the acquired sensing data.
- a specified time for example, 3 o'clock
- today is set as the “display date”
- the previous day is set as the “display date”
- the display date at 3 o'clock is “start” Time.
- the server 104 acquires all entries whose measurement date and time 253 is after the start time from the total data table 250, and calculates the total number of walks 257 for each user ID. Among the calculated total number of steps, the top five cases and the display users acquired in step S9101 are acquired as a display user group in a total of six persons (if the top five cases include display users).
- step S9103 for each user included in the display user group, all entries included in the aggregated data table 250, in which the user ID 251 is the user ID and the measurement date 253 is after the start time are listed in the order of measurement date.
- the total number of steps after the start time is calculated for each predetermined resolution and determined as the accumulated step count data of the user.
- step S 9104 the server 104 generates the determined cumulative step count data as the content of the line graph in the step count graph 91001 for each user included in the display user group.
- the top user may be displayed in gold, the second user in silver, the third user in copper, and the display user in red.
- a character string for identifying the user who is the origin of each line graph may be displayed in the name label area 91002.
- an example of acquiring and displaying information on the top five users in addition to the user has been shown.
- information on the top three users may be displayed, and information on the top user and the lowest user may be displayed.
- information of a user who is one rank higher than the user may be displayed.
- it is assumed that the user who has the largest number of intersections with the user is the “rival” of the user, and only the “rival” information is displayed. Also good. Further, only information on users included in the group to which the user belongs may be displayed.
- FIG. 41 is an explanatory diagram showing an example of a sleep input window 92000 that is a GUI screen related to processing by execution of the sleep input program 920 of the server 104.
- the outline of the operation of the sleep input program 920 will be described from the viewpoint of the GUI.
- the server 104 receives a click operation on the sleep input button 80104 of the content selection window 80100 from the PC 203, the server 104 executes the sleep input program 920, generates the sleep input window 92000, and transmits the generated sleep input window 92000 to the PC 203. Then, the PC 203 displays the sleep input window 92000 in the content display area 80107 in the content selection window 80100 of the display device 1031.
- the sleep input window 92000 enables the user of the bracelet type sensor node 1 to view and edit the sleep period of the user calculated by the sleep analysis program 300.
- FIG. 41 is an example of a screen representing a state in which the sleep period automatically generated by the server 104 is being browsed.
- the date selection control 92003 displays the selected date in the center text box, selects the previous day of the selected date due to the click operation of the left arrow button, and results from the click operation of the right arrow button. Select the next day after the selected date.
- the date may be selected by direct input from the keyboard into the central text box.
- the sleep input program 920 redraws (regenerates content) due to the selection of a new date. In sleep input, by setting 24 hours from 15:00 to 15:00 on the day before the selected day as the display period, the sleep period can be displayed without being divided in many cases.
- the scene display area 92001 displays the scene in the display period in different colors.
- a scene is a period during which the same action continues.
- the action is a type of activity that can be discriminated from the sensor node 1 such as walking or resting.
- Scene extraction can be performed, for example, in the same manner as the method disclosed in Japanese Patent Application No. 2008-321728, and “rest”, “light work”, “work”, “Exercise”, “still” and “walking” scenes can be extracted.
- a “rest” scene that lasts from 15:00 to 18:00 is a “walk” scene in which the user is resting from 15:00 to 18:00 and continues from 18:00 to 19:30. Represents that the user is in a walking state from 18:00 to around 19:30.
- the sleep input program 920 is included in the display period, acquires all the sleep periods of the user from the sleep analysis data table 350, and highlights the acquired sleep period as the sleep region 92002.
- the sleep area 92002 includes a character string representing the sleep type 354 in the sleep period, such as “main sleep: 22:10 to 05:20”, and a start of sleep at an easily visible position such as the lower right of the area. It is preferable that the time 352 and the end time 353 are displayed.
- the sleep analysis data table 350 stores, for each entry, the source that generated the sleep period (ie, “automatic” generation by sleep analysis or “manual” input by the sleep input window). Information may be added.
- each of these scenes is a target of a click operation, and the user can easily edit the sleep period of one day by clicking the scene.
- FIG. 42A and FIG. 42B are diagrams for explaining operations for newly adding and deleting sleep in the sleep input window 92000.
- FIG. 42A shows the state of the sleep input window 92000 before editing.
- one sleep period from 22:10 to 02:50 is displayed.
- the user can select a still scene that lasts from about 03:20 to about 05:50 by clicking with the input device 1032 and can add a new sleep period 92004 as shown in FIG. 42B. It becomes possible.
- the added sleep period 92004 is added to the sleep analysis data table 350 as a new entry having the user ID of the user, the start time and the end time of the stationary period. On the contrary, it is also possible to delete the sleep period by clicking again on the scene registered as the sleep period.
- FIG. 43A and FIG. 43B are diagrams for explaining sleep combining and separation processing in the sleep input window 92000.
- FIG. 43A shows the state of the screen before editing.
- two sleeps of a sleep period 92002 that lasts from 22:10 to 02:50 and a sleep period 92004 that lasts from 03:20 to 05:50 are displayed.
- the user of the PC 203 selects the “rest” scene 92005 that continues from 02:50 to 03:20 by clicking the input device 1032, and combines the two sleep periods as shown in FIG. 43B.
- the sleep period 92006 lasts from 22:10 to 05:50.
- 43A when there is no lower sleep period 92004, that is, when there is only the sleep period 92002 of 22:10 to 02:50, the sleep time can be obtained by clicking the “rest” scene 90005.
- a sleep period from 22:10 to 03:20 is generated. On the contrary, it is possible to divide or shorten the sleep period by clicking the scene included in the sleep period.
- FIG. 44 is a flowchart illustrating an example of processing by execution of the sleep input program 920 of the server 104.
- step S9201 the server 104 acquires the session ID passed from the content selection program 801, and acquires a valid entry including the acquired session ID from the session ID table 860.
- a valid entry is an entry whose issue date 862 is within a predetermined time from the current time. If there is no entry that can be acquired, the user authentication program 800 may be executed. When there is an entry that can be acquired, the user ID included in the entry is acquired as “display user”.
- step S9202 the date selected by the date selection control 92003 is acquired as the “display date”, and the display period is set to 24 hours from 15:00 to 15:00 on the day before the display date.
- the server 104 acquires all scenes included in the display period of the display user (user corresponding to the display data) from a scene table (not shown).
- the scene includes four pieces of information including a start time, an end time, a user ID, and an action content
- the display user's scene means that the user ID of the scene is a display user, and is included in the display period. It means that the end time of the display period is after the start time of the scene, or the start time of the display period is before the end time of the scene.
- the action content is one of “rest”, “light work”, “work”, “exercise”, “still”, “walk”. It is preferable that the acquired scenes do not overlap each other.
- step S9204 the server 104 acquires, from the sleep analysis data table 350, all entries in which the user ID 351 is a display user and the sleep period overlaps the display period.
- the acquired sleep period is stored as a sleep group in the memory 1108 or a temporary storage area (not shown) of the storage device 2100.
- a new sleep group that temporarily stores a new sleep period caused by editing, a sleep group to be changed that temporarily stores a sleep period that is changed by editing, and a sleep period that is deleted by editing
- An area for storing the sleep group to be deleted stored in the temporary storage area is secured.
- step S9205 the server 104 generates the content of the sleep input window 92000, and transmits the generated content to the PC 203.
- the PC 203 draws the sleep input window 92000 on the display device 1031.
- a time that fits within the window is defined on the vertical axis, and the horizontal axis is defined according to the width of the window.
- the server 104 instructs the PC 203 to draw a scene showing the sleep period from the start time to the end time of the scene in accordance with a table that defines the display color of the action content (not shown).
- the display color is from a cold color to a warm color according to the amount of activity during the action. For example, it is easy to visually recognize the action content by drawing using blue (cold color) during exercise and red (warm color) during exercise.
- a character string representing the action content of the scene is drawn at a predetermined position of the drawn scene, for example, at the upper left. Further, the server 104 draws a sleep group on the PC 203.
- the PC 203 draws each sleep period 92002 on the drawn scene by matching the start time and end time of each sleep period with the vertical axis. At this time, by making the drawing color translucent or transparent and making the border of the region darker, the sleep period can be easily seen, and at the same time, the color of the scene drawn below can be easily seen. In addition, the sleep period can be more visually recognized by extending the predetermined number of pixels to the left and right of the scene. Moreover, the character string showing the information regarding a sleep period is drawn in the predetermined position (for example, lower right) of the drawn sleep period. For example, the type of sleep in the sleep period (for example, main sleep or nap) is drawn, and a character string representing the start time and the end time is drawn.
- a character string representing the generation means may be drawn.
- a button corresponding to the drawn sleep period may be provided, and a sleep questionnaire asking about the quality of sleep (not shown) may be displayed based on a click operation on the button, and stored in association with the sleep period.
- step S9206 the server 104 edits the sleep group due to the click operation of the scene by the user of the PC 203.
- the scene subject to the click operation does not overlap with any sleep period included in the sleep group, and the end time of the scene is not the start time of any sleep period. It is executed when it is not the end time of the sleep period.
- the adding process generates a sleep period in which the start time is the start time of the scene and the end time is the end time of the scene, and adds the generated sleep period to the sleep group. Further, the additional processing newly adds the generated sleep period to the sleep group. Further, the additional processing sets the “sleep type” of the longest sleep among all the sleep periods included in the sleep group as main sleep, and sets the rest as nap. At this time, an additional process adds the sleep period originally changed from the main sleep to the nap to the change target sleep group. Moreover, an additional process adds the sleep period originally changed from the nap to the main sleep to a change object sleep group.
- the deletion process is included in the sleep period included in the sleep group for the clicked scene, the scene start time is the sleep start time, and the scene end time is the sleep end time. Performed when sleep is present.
- the sleep period is deleted from the sleep group and added to the deletion target sleep period group.
- the “sleep type” of the longest sleep among all the sleep periods included in the sleep group is set as main sleep, and the others are set as nap.
- the deletion process adds the sleep period originally changed from main sleep to nap to the change target sleep group.
- a deletion process adds the sleep period originally changed from nap to main sleep to a change object sleep group.
- the scene in which the click operation is performed does not overlap with any sleep period included in the sleep group, and, among the sleep periods included in the sleep group, the scene start time is the sleep end time, Alternatively, it is executed when the end time of the scene is the sleep start time. In this case, the scene may touch up to two sleep periods (ie both at the start time and at the end time). In the case where there is only one scene in contact, the combining process changes the start time or the end time so that the sleep period in contact includes the scene, and adds the sleep period to the sleep group to be changed.
- the combining process deletes the sleep period with a late end time from the sleep group, adds the sleep period to the deletion target sleep group, and sets the end time of the sleep period with the early end time as the end time. It is set to the end time of the late sleep period and added to the change target sleep period group. Further, in the combining process, the “sleep type” of the longest sleep among all the sleep periods included in the sleep group is set as the main sleep, and the rest is set as the nap. At this time, the combination process adds the sleep period originally changed from main sleep to nap to the change target sleep group. Moreover, a connection process adds the sleep period originally changed from nap to main sleep to a change object sleep group.
- the separation process is a process other than the process described above, that is, the scene where the click operation is performed is included in one of the sleep periods included in the sleep group, and the start time of the scene is different from the start time of the sleep period, or This is executed when the end time of the scene is different from the end time of the sleep period. If the start time of the sleep period is the same as the start time of the scene, the separation process sets the start time of the sleep period as the end time of the scene and adds the sleep period to the change target sleep group. In addition, in the separation process, if the end time of the sleep period is the same as the end time of the scene, the end time of the sleep period is set as the start time of the scene, and the sleep period is added to the change target group.
- the separation process newly generates a sleep period having the end time of the scene as the start time and the end time of the sleep period as the end time.
- the end time of the original sleep period is set as the start time of the scene and added to the sleep group to be changed.
- the “sleep type” of the longest sleep among all the sleep periods included in the sleep group is set to main sleep, and the others are set to nap.
- the separation process adds the sleep period originally changed from main sleep to nap to the change target sleep group.
- a separation process adds the sleep period originally changed from nap to main sleep to a change object sleep group.
- step S9208 If it is determined in step S9208 that the server 104 receives a notification indicating that the user operation of the PC 203 is the date selection control 92003, an operation for closing the screen, or a click operation on the “OK” button (not shown), the process advances to step S9209. If not, the process returns to step S9205 to repeat the above processing.
- step S9209 the server 104 writes the new sleep group, the change target sleep group, and the deletion target sleep group held in the temporary storage in the sleep analysis data table 350 of the storage device 2100. That is, all sleeps included in the new sleep group are added to the sleep analysis data table 350. At this time, if the sleep analysis data table 350 has an area for storing the means (not shown) that generated the sleep period, the means that generated the added sleep period is set to “sleep input”. Furthermore, all sleeps included in the sleep group to be changed are updated on the sleep analysis data table 350. At this time, when the sleep analysis data table 350 has an area for storing the means for generating the sleep period, the means for generating the updated sleep period is set to “sleep input”. Further, all sleeps included in the deletion target sleep group are deleted from the sleep analysis data table 350.
- the user of the PC 203 can easily record the sleep period while looking back on the activities of his / her life. Compared to the case of recording on the questionnaire sheet or using only the automatic sleep determination. Thus, it is possible to acquire the sleep period with high accuracy and less burden on the user.
- the example in which the entire display period of the day is displayed on the window of the display device 1031 has been described.
- a mouse scroll is performed.
- the data near the mouse cursor may be zoomed and displayed by accepting an operation on the wheel.
- the present invention can be applied to a computer or a computer system that collects biological information and visualizes a long-term behavior record of a person on a display device.
Landscapes
- Health & Medical Sciences (AREA)
- Life Sciences & Earth Sciences (AREA)
- Engineering & Computer Science (AREA)
- Surgery (AREA)
- General Health & Medical Sciences (AREA)
- Biophysics (AREA)
- Biomedical Technology (AREA)
- Heart & Thoracic Surgery (AREA)
- Medical Informatics (AREA)
- Molecular Biology (AREA)
- Physics & Mathematics (AREA)
- Animal Behavior & Ethology (AREA)
- Pathology (AREA)
- Public Health (AREA)
- Veterinary Medicine (AREA)
- Computer Networks & Wireless Communication (AREA)
- Physiology (AREA)
- Dentistry (AREA)
- Oral & Maxillofacial Surgery (AREA)
- Measuring And Recording Apparatus For Diagnosis (AREA)
- Measuring Pulse, Heart Rate, Blood Pressure Or Blood Flow (AREA)
- Measurement Of The Respiration, Hearing Ability, Form, And Blood Characteristics Of Living Organisms (AREA)
Abstract
人体に装着されたセンサノードから生体情報と測定日時を含むセンシングデータを受信し、前記受信したセンシングデータを所定の時間間隔で集計して、人の行動に関する時系列の集計データを生成し、設定された期間内の集計データについて、分解能が示す時間幅毎に前記集計データの代表値を算出することによって、生活データとを生成し、生活データの値に応じて、前記生活データを色データに変換し、前記分解能は2分から16分までの間の予め設定された時間幅に設定され、前記所定の時間間隔は前記分解能の最小値未満に設定される。
Description
本出願は、平成22年(2010年)7月16日に出願された日本特許出願特願2010-161432の優先権を主張し、その内容を参照することにより、本出願に取り込む。
本発明は、対象者の生活を示す生活情報を長期的に測定する測定方法、該対象者の生活情報を出力する出力装置、及び出力装置の制御方法に関するものである。
近年、超小型の省電力センサ及び大容量メモリ技術の発達により、人の活動を長期間にわたって継続的に測定し、記録することが可能となっている。例として非特許文献1に示す日立製作所製『ライフ顕微鏡』は、計測された生活データを可視化するために、腕時計型の加速度センサを身に着けることによって身体の活動を生活データとして計測するデバイスである。例えば、医療では、このようなデバイスを患者が身につけることによって、医師が患者の日々の生活の状態を把握し、疾病の予兆や回復の経過を確認している。この応用例では、医師が、限られた時間の面談中に、生活データを一目で見て、生活の全貌を把握する必要がある。そのため、数年以上の長期間の生活データの全体を効果的に俯瞰することを可能とする可視化方法が必要である。同様の内容は、非特許文献2にも開示されている。
ライフ顕微鏡のようなデバイスから得られる長期間かつ高分解能の生活データの全貌を可視化する方法として、例えば、特許文献1及び特許文献2に開示されている方法が挙げられる。この方法は、横軸(表示画面の水平方向の軸)が時刻、縦軸(表示画面の垂直方向の軸)が日付である平面上に、色彩や色の濃淡によりその日時の活動量を示すことによって、長期にわたる活動の傾向を把握しやすくする可視化方法である。
鈴木 敬 他著、「ライフ顕微鏡:20人のライフタペストリーが語る人とセンサとITの未来」、日立評論、株式会社日立製作所、2007年12月、VOL.89、No.12、914-915、pp30-35
Life Microscope: Continuous daily-activity recording system with tiny wireless sensor, T.Tanaka et al., 2008, INSS 2008. 5th International Conference on Networked Sensing Systems
しかし、上記される従来の技術では、生活データを表示するための適切な分解能の決定方法が開示されていないため、閲覧者が把握しやすいように生活データを表示することができない問題がある。
例えば、上記ライフ顕微鏡は、活動量を一分毎に算出するため、一日分のデータは、24[時間]×60[分]=1440件の活動量データで構成される。しかし、一日を1440件のデータ全て使って表示すると、分解能が細かすぎるため、閲覧時に色を実際の行動と結び付けて把握することが困難となる。
一例として、分解能を1分として描いた1ヶ月半分の生活データを図26Aに示す。横軸が0時から24時、縦軸が下に向かって日付が増大する。この図を見ると、2時付近から6時付近まで黒の領域が描かれており、これが睡眠を表していることは閲覧者には容易に想像がつく。一方で、7時~8時付近の歩行の区間(通勤)を過ぎた先も、やはり黒い期間が続き、視覚的には睡眠と差が見られない。実際にはこの区間ではデスクワークを行っており、静止期間と活動期間とを2,3分周期で繰り返している。そのため分解能1分で描かれた生活データからは、閲覧者は睡眠と覚醒中の期間を区別することが困難となり、生活データを効果的に把握することができない。
この問題の単純な解決策として、低い分解能で表示することが考えられる。例として、分解能120分、即ち120分毎の活動量の最大値を色で表した生活データを図26Bに示す。この図では、先ほどの睡眠期間と覚醒期間との区別がつかない問題は解消されており、覚醒中の期間は明確に白く表示されているため、視覚的に概要を把握しやすい。一方で、この図からは活動の細かい傾向が失われている。例えば、図26Aからは、9月3日及び9月19日は、普段より早く通勤している、9月15日及び9月21日は睡眠中に中途覚醒をしている、などの特徴が読み取れる。しかし、これは分解能120分の生活データでは平滑化されてしまっており、読み取ることはできない。
本発明の目的は、上記の問題点を解決するためになされたものであって、人間の行動特性に基づいた適切な分解能を用いて生活データを表示することによって、容易に生活の全体像を把握することを可能とすることである。
本願において開示される発明の代表的な一例を示せば以下の通りである。すなわち、人体に装着されて生体情報を測定するセンサを有し、前記測定された生体情報と該生体情報が測定された日時とを含むセンシングデータを送信するセンサノードと、プロセッサ、記憶部及びインターフェースを有し、前記センサノードに接続されて前記センシングデータを受信し、前記受信したセンシングデータを前記記憶部に格納し、前記格納されたセンシングデータから生活データを算出する計算機と、を備えた生活可視化システムにおいて、前記計算機は、前記格納されたセンシングデータを所定の時間間隔で集計して、前記センサノードを装着した人の行動に関する時系列の集計データを生成する集計部と、生活データが出力される期間と、前記出力される各生活データの時間幅を示す分解能とを受ける設定取得部と、前記受けた期間内の集計データについて、前記分解能が示す時間幅毎に前記集計データの代表値を算出することによって、生活データを生成する生活データ生成部と、前記生活データの値に応じて、前記生活データを色データに変換する色データ変換部と、を有し、前記分解能は、2分から16分までの間の予め設定された時間幅に設定され、前記集計部は、前記センシングデータを集計する前記所定の時間間隔を、前記分解能の最小値未満に設定する。
本発明の代表的な実施の形態によれば、生活データを、所望の分解能で、人の行動の全体像を把握しやすい形で表示することが可能となる。
以下、本発明の一実施形態を添付図面に基づいて説明する。
<第1実施形態>
図1は、本発明の第1の実施形態の生活可視化システムの構成例を示すブロック図である。本実施形態の生活可視化システムは、当該システムの利用者の動作(または状態)を検出するセンサとして、加速度センサを備えた腕輪型センサノード1を用い、腕の加速度を生体情報として検出する。
図1は、本発明の第1の実施形態の生活可視化システムの構成例を示すブロック図である。本実施形態の生活可視化システムは、当該システムの利用者の動作(または状態)を検出するセンサとして、加速度センサを備えた腕輪型センサノード1を用い、腕の加速度を生体情報として検出する。
腕輪型センサノード1は、利用者(または参加者)の腕に装着されて加速度を検出し、所定の周期で検出した加速度データをセンシングデータ(生体情報)として、アンテナ101から無線ネットワークを介して基地局102へ送信し、さらに、クライアント計算機(PC)103へ送信する。また、有線通信が可能な場合はUSB接続などを介して直接PC103へ送信してもよい。
図1において、PC103は複数の腕輪型センサノード1と通信し、各腕輪型センサノード1から利用者の動きに応じたセンシングデータを受信し、受信したセンシングデータを解析及び集計し、さらに新たな分解能で集計値の代表値を算出して表示データ(または生活データ)として出力する。出力される表示データは、利用者が操作するPC103で閲覧することができる。
図2は、本実施形態の生活可視化システムを構成する腕輪型センサノード1の構成例を示す説明図で、(a)は腕輪型センサノード1の正面図で、(b)は腕輪型センサノード1を側方断面図である。この腕輪型センサノード1は主に利用者の動き(加速度)を測定する。
腕輪型センサノード1は、センサ及び制御装置を格納するケース11と、ケース11を人体の腕に装着するバンド12とを備える。
ケース11の内部には、図2(b)のようにマイクロコンピュータ3(図3参照)及びセンサ6(図3参照)等を備えた基板10が格納される。そして、人体(生体)の動きを測定するセンサ6としては、図中X-Y-Zの3軸の加速度を測定する加速度センサを採用した例を示す。なお、本実施形態では、腕輪型センサノード1には図示を省略する温度センサ、脈拍センサを備え、利用者の体温、脈拍を測定し、加速度とともにセンシングデータとして出力する。また、腕輪型センサノード1が図示しない感圧センサや静電容量センサを備え、利用者が腕時計型センサノード1を装着しているか否かを装着状態として出力してもよい。
図3は、腕輪型センサノード1の基板10に取り付けられた電子回路のブロック図である。図3において、基板10には、無線通信部2、USB通信部39、マイクロコンピュータ3、リアルタイムクロック4、電池7及びスイッチ8が配置される。無線通信部2は、基地局102と通信するアンテナ5に接続される。USB通信部39は、PC103と有線で接続する。マイクロコンピュータ3は、センサ6及び無線通信部2を制御する。リアルタイムクロック4は、マイクロコンピュータ3を間欠的に起動するためのタイマである。電池7は、各部に電力を供給する。スイッチ8は、センサ6への電力の供給を制御する。また、スイッチ8とセンサ6との間には、バイパスコンデンサC1が接続されて、ノイズを除去する。また、バイパスコンデンサC1への充放電回数を減らすようにスイッチ8を制御することによって、無駄な電力消費を抑えることが可能になる。
マイクロコンピュータ3は、演算処理を実行するCPU34と、CPU34で実行されるプログラムなどを格納するROM33と、データなどを格納するRAM32と、RTC4からの信号(タイマ割り込み)に基づいてCPU34に割り込みをかける割込制御部35と、センサ6から出力されたアナログ信号をデジタル信号に変換するA/Dコンバータ31と、無線通信部2との間でシリアル信号にて信号を送受信するシリアルコミュニケーションインターフェース(SCI)36と、無線通信部2、USB通信部39及びスイッチ8と制御信号を送受信するパラレルインターフェース(PIO)37と、マイクロコンピュータ3内の上記各部へクロックを供給する発振部(OSC)30とを含む。
そして、マイクロコンピュータ3内の上記各部はシステムバス38を介して接続される。RTC4は、マイクロコンピュータ3の割込制御部35に予め設定されている周期で割込信号(タイマ割り込み)を出力し、また、SCI36へ基準クロックを出力する。PIO37はCPU34からの指令に応じて、スイッチ8のON/OFFを制御することによって、センサ6への電力供給を制御する。
腕輪型センサノード1は、所定の周期(例えば、1秒等)でマイクロコンピュータ3を起動して、センサ6からセンシングデータを取得し、取得したセンシングデータに腕輪型センサノード1を特定する識別子及びタイムスタンプを付与して、基地局102へセンシングデータを送信する。なお、腕輪型センサノード1の制御の詳細は、例えば、特開2008-59058号公報等と同様にすることができる。また、腕輪型センサノード1は、連続的に取得したセンシングデータを、周期的に基地局102へ送信してもよい。また、センシングデータを取得する周期は、1秒に限定されるものではなく、人の行動が把握可能な周期であればよい。本実施形態では、センサノード1が送信するデータ量を削減するために1秒としたが、100msec~500msecの周期としてもよい。
図4は、図1に示した本実施形態の生活可視化システムの構成要素を示すブロック図である。腕輪型センサノード1が送信したセンシングデータは、基地局102を介してPC103の記憶装置1100のセンシングデータテーブル1150に格納される。又は、図示しない有線通信(USB等)を介して腕輪型センサノード1とPC103とが直接通信してもよい。
PC103には、各種情報を表示する表示装置1031、及び利用者の操作によって様々な情報の入力を可能とする入力装置1032が接続される。
表示装置1031は、液晶ディスプレイ又はCRTディスプレイ等の表示端末でよく、プリンタ又は画像ファイル出力装置でもよい。入力装置1032は、キーボード、マウス等の入力デバイスである。また、表示装置1031及び入力装置1032は、タッチパネル式ディスプレイのような、両方の機能を備える単体の機器でもよい。
また、PC103は、プロセッサ107と、メモリ108及び記憶装置1100を備える計算機である。記憶装置1100は、後述する各種プログラム、各種データテーブルを記録し、例えば、ハードディスクドライブやCDーROMドライブ、フラッシュメモリなどである。なお、複数の記憶装置に各種プログラム、各種データテーブルを分割して記録してもよい。
プロセッサ107は、記憶装置1100に記録されている各種プログラムをメモリ108に読み出して、実行することによって各種機能を実現する。具体的には、データ集計プログラム200を実行することによって、利用者の腕輪型センサノード1の加速度センサで測定されたセンシングデータ(生体情報)を集計し、単位時間(例えば、1分間)毎の運動量を集計データ(生活データ)として算出し、算出された集計データを記憶装置1100の集計データテーブル250に格納する。また、睡眠分析プログラム300を実行することによって、算出した単位時間毎の集計データを解析し、全ての睡眠状態を検知し、検知された睡眠状態を記憶装置1100の睡眠分析データテーブル350に格納する。また、表示設定取得プログラム400を実行することによって、表示装置1031にGUI画面を表示し、GUI画面上での入力装置1032のユーザによる操作を受けて、集計データを集約した表示データを描画するための表示設定を取得する。また、表示データ描画プログラム500を実行することによって、表示設定取得プログラム400が取得した表示設定を基に、指定されたユーザの集計データを集約して表示データを算出し、算出された表示データを生成して、表示データを表示装置1031に出力する。また、表示データ描画プログラム500は、後述するように、表示位置を管理する位置固有表示領域テーブル700を参照する。位置固有表示領域テーブル700は、記憶装置1100に格納される。
また、コメント入力プログラム600は、表示データに付与されるコメントと表示位置を受け付けて、受け付けたコメントと表示位置をコメント入力テーブル650に格納し、表示データ描画プログラム500が表示データを出力する際にコメント入力テーブル650のコメントを表示装置1031に表示させる。
なお、以下では、PC103が、データ集計プログラム200と睡眠分析プログラム300とを、定期的な周期又は腕時計型センサノード1との通信を起因として、実行し、さらに、入力装置1032の操作又はPC103の起動を起因として、表示設定取得プログラム400を実行することによって表示設定を取得し、さらに、入力装置1032の操作により表示データ描画プログラム500を実行することによって、表示装置1031に表示データを提示する例を示す。
図5は、本実施の形態の生活可視化システムで実行されるデータ処理の全体のフローチャートである。
まず、ステップS1では、腕輪型センサノード1が送信した所定の周期(例えば、1秒)毎のセンシングデータ(生体情報)を、基地局102がPC103へ転送し、PC103のセンシングデータテーブル1150はセンシングデータを格納する。また、センシングデータに付与されている、センサノードを特定するための識別子と当該センシングデータを取得した時刻を示す時刻情報とをセンシングデータテーブルに格納する。さらに、入力装置1032の操作を起因としてPC103がデータ集計プログラム200を実行して、記憶装置1100に格納されたセンシングデータから単位時間毎の運動頻度(運動量相当値)と歩行数とを算出し、算出された運動頻度と歩行数とを記憶装置1100の集計データテーブル250に格納する。なお、データ集計プログラム200の実行を所定の周期(例えば、5分間)毎に実行してもよい。
次に、ステップS2では、PC103は睡眠分析プログラム300を実行して、集計データテーブル250に格納された集計データから利用者が睡眠状態にあると推定される領域を検出し、全ての睡眠領域の開始時刻と終了時刻との組みを睡眠分析データテーブル350に格納する。また、睡眠分析プログラム300は、一日の最長の睡眠期間である主睡眠を検出し、上記格納された睡眠領域のうち主睡眠であるものに主睡眠タグを付加して、主睡眠タグを睡眠分析データテーブル350に格納する。なお、睡眠分析プログラム300を、所定の周期(例えば、5分間)毎に実行してもよいし、データ集計プログラム200の終了を起因として実行してもよい。又は、入力装置1032から所定の入力を受け付けたときに、睡眠分析プログラム300を実行してもよい。
次に、ステップS3では、表示設定取得プログラム400を実行して、表示装置1031に生活データ表示ウィンドウ1200(図12参照)を出力する。そして、入力装置1032のユーザによる操作によって、2分から16分迄の期間を示す分解能の設定、画面合わせの設定、主睡眠表示の設定、時刻線表示の設定、表示領域の設定及び表示期間の設定を含む表示設定を受け付けて、受け付けた設定をメモリ108に格納する。なお、表示設定取得プログラム400は、入力装置1032から所定の入力を受け付けた後に、表示設定取得プログラム400を実行することができる。
次に、ステップS4では、表示データ描画プログラム500を実行して、上記メモリ108に格納した表示設定を基に、記憶装置1100の集計データテーブル250に格納された集計データと、睡眠分析データテーブル350に格納された睡眠分析データとから、表示データ(生活データ)を生成し、表示データをメモリ108に格納する。
次に、ステップS5では、メモリ108に格納された表示データを表示装置1031の生活データ表示ウィンドウ1200の描画エリア1207(図12参照)に描画する。
図6は、PC103のデータ集計プログラム200の実行による処理の例を示すフローチャートである。
まず、PC103は、利用者の識別子に対応するセンシングデータをセンシングデータテーブル1150から読み込む(ステップS11)。ここで、読み込むセンシングデータの量は、センシングデータの集計周期である所定の時間間隔(例えば、1分間)、又は過去のデータ集計プログラム200の実行によって既に集計データテーブル250へ格納されている最後の集計時刻以降の全て、等に設定すればよい。また、集計対象の利用者の識別子は、入力装置1032から予め受け付けた値を用いることができる。
次に、読み込んだセンシングデータの加速度データを用いて所定の時間間隔(例えば、1分)毎の集計値を算出する。本実施形態では、所定の時間間隔内での腕輪型センサノード1の装着者(利用者)の運動の頻度を示すゼロクロス回数を集計値として用いる。
腕輪型センサノード1が検出したセンシングデータにはX、Y、Z軸の加速度データが含まれているので、X、Y、Zの3軸の加速度のスカラー量を、(X2+Y2+Z2)1/2を算出する(ステップS12)。次に、算出されたスカラー量を、バンドパスフィルタを用いて、フィルタ処理することによって、所定の周波数帯域(例えば、0.1Hz~5Hz)のみを抽出し、ノイズ成分を除去する(ステップS13)。
そして、図7に示すように、算出されたスカラー量が、所定の閾値(例えば、0.05G)を通過する値をゼロクロス回数として算出し、ゼロクロス回数が所定時間間隔内に出現する頻度を算出し、この出現頻度を、所定の時間間隔(例えば、1分間)の運動頻度として出力する(ステップS14)。
上記ステップS14において算出された運動頻度は、図8に示すように単位時間毎の運動頻度を時系列順にソートしたデータとなる。図8は、運動頻度(図中棒グラフ)と温度(折れ線グラフ)を時系列的に示したグラフである。なお、運動頻度は、X、Y、Zの各方向の加速度の値が正と負に振動した回数(振動数)を各方向毎に所定時間内に数えて合計してもよいが、本実施形態では、計算を簡略化するため、ゼロクロス回数を算出する方法を採用している。
次に、所定の時間間隔内のX、Y、Zの3軸の加速度のスカラー量の積算値を算出し、この積分値を運動強度(運動量相当値)とする(ステップS15)。また、センシングデータに含まれる温度についても所定の時間間隔内の平均温度を算出する(ステップS16)。
さらに、所定時間間隔内に出現する歩行のステップ数を歩行数として出力する(ステップS17)。歩行中は、上下方向の加速度が周期的に変化する(一歩ごとの着地)、前後方向の加速度が上下方向の加速度と同期して規則的に前方向と後方向を繰り返す(着地するごとの速度変化)、又は、左右方向の加速度が上下方向の加速度に同期して規則的に繰り返す(一歩ごとの体の左右へのゆれ)などの加速度の波形が観測でき、さらに腕の振りが重なった波形が観測できる。このため、波形がこれらの条件に一致するかによって、当該時間間隔内に歩行状態であるか否かを判定できる。また、ゼロクロスの周期の逆数を歩行数として検知することも可能である。これらの人体に装着した加速度センサ6から歩行状態を検知する手法、及びステップ数を算出する手法は、公知の手法を用いればよく、例えば、「腕に装着した加速度・角速度センサを用いた人間の歩行・走行運動の解析」(S.-W.Lee and K.Mase、「Recognition of Walking Behaviors for Pedestrian Navigation」、 Proc. IEEE Conf. Control Applications (CCA01)、 IEEE Control Systems Soc.、 Piscataway、 N.J.、 2001、 pp.1152-1155.)などが知られている。
次に、所定時間間隔内のデータの状態を表すフラグを算出する(ステップS18)。まず、所定時間間隔内に存在するデータのうち、有効なデータ(即ち、所定の範囲内のX、Y、Zの3軸の加速度データがあるもの)の割合が所定の閾値より少ない場合、該時間間隔を欠損データとして決定する。データが欠損データである場合は、当該時間間隔内のフラグが「欠損値」に設定される。
また、該時間間隔のデータが欠損データではなく、腕時計型センサノード1が人体への装着状態を出力し、所定時間間隔内に存在するデータのうち装着中である割合が所定の閾値より少ない場合、該時間間隔を非装着データとして決定する。なお、腕輪型センサノード1の装着、非装着は、例えば、腕輪型センサノード1の温度センサが検出したセンシングデータの値が、人体温を判定する所定の閾値(例えば、摂氏30度)未満のときに非装着と判定し、その他の場合を装着中と判定する。データが非装着データである場合は、当該時間間隔内のフラグが「非装着」に設定される。当該時間間隔内のデータが、欠損データでも非装着データでもない場合、有効なデータを示す「データ有り」にフラグが設定される。
以上によって、該時間間隔のデータの状態のフラグを「データ有り」、「欠損値」及び「非装着」のうちのいずれか一つに決定する。
次に、データ集計プログラム200は、所定の時間間隔(ここでは1分)毎の、運動頻度、平均温度、運動強度、歩行数、フラグを上記処理によって算出し、図9に示すように、所定の時間間隔毎の集計データを生成し、記憶装置1100の集計データテーブル250へ格納する(ステップS19)。
腕輪型センサノード1が所定の周期(1秒)で測定したセンシングデータは、センシングデータテーブル1150に格納された後、上記処理によって、所定の時間間隔(1分)毎の集計データに集計されて、集計データが集計データテーブル250に格納される。
図9は、集計データテーブル250のデータフォーマットの例を示す説明図である。
集計データテーブル250において、腕輪型センサノード1の装着者(生活可視化システムの利用者)の識別子を格納するユーザID251と、センシングデータに含まれる腕輪型センサノード1の識別子を格納するセンサデータID252と、所定の時間間隔の開始時刻(測定日時)を格納する測定日時253と、データ集計プログラム200の実行により算出した平均温度を格納する温度254と、データ集計プログラム200の実行により算出した運動頻度を格納する運動頻度255と、データ集計プログラム200の実行により算出した運動強度を格納する運動強度256と、データ集計プログラム200の実行により算出した歩行のステップ数を格納する歩行数257と、データ集計プログラム200の実行により算出したデータの状態フラグを格納するフラグ258とから、一つのエントリが構成される。なお、利用者の識別子は、腕輪型センサノード1の識別子に基づいて、予め設定した図示しないテーブルを参照すればよい。また、フラグ258は、「0」が「データ有り」を示し、「1」が「欠損値」を、「2」が「非装着」を示す。
上記データ集計プログラム200の実行により、PC103はセンシングデータテーブル1150のセンシングデータを読み込んで、指定された利用者の識別子について集計データテーブル250を生成する。
図10は、PC103の睡眠分析プログラム300の実行による処理の例を示すフローチャートである。
睡眠分析プログラム300は、まず、データ集計プログラム200の実行によって集計した単位時間毎の集計データを、集計データテーブル250から読み込む(ステップS21)。ここで、読み込む集計データは、例えば、過去の睡眠分析プログラム300の実行によって既に睡眠分析データテーブル350に格納されている最後の睡眠の終了時刻以降のデータ全て、等に設定すればよい。
次に、ステップS22では、睡眠分析プログラム300の実行によって、上記ステップS21で読み込んだ集計データから睡眠状態であると推定される領域群を検出する。睡眠中の運動頻度は極めて低いが、睡眠中でも人体は寝返りなどの運動をするため、運動頻度はゼロにはならない。睡眠を判定する手法はいくつか知られており、例えば、Cole法(Cole RJ、Kripke DF、 Gruen W、 Mullaney DJ、 Gillin JC. Automatic sleep/wake identification from wrist activity. Sleep 1992; 15: 491-469)や、運動頻度が所定の閾値以下の集計データを睡眠状態と判定するなどの手法を適用すればよい。このような手法によって集計データから検出された各睡眠状態の領域の開始時刻と終了時刻とを睡眠領域の候補群として、図示しない一時ストレージ(メモリ108や記憶装置1100の記憶領域の一部)等に格納する。また、利用者が腕輪型センサノード1を装着していない場合、運動頻度はほぼゼロになり、睡眠として判定されてしまう場合もある。しかし、例えば、腕時計型センサノードが非装着判定手段を備えている場合、単位時間集計データテーブル250を読み込む際にフラグ258が非装着を示すデータは運動頻度が高いデータと同等に扱うことによって、睡眠状態と誤判定することを防ぐことが可能である。
次に、ステップS23では、上記ステップS22で検出された複数の睡眠領域の候補の中で近接するもの同士を結合する。睡眠検出の手法によっては、例えば、目覚まし時計を止めるために一時的に起床し、再び睡眠に入った場合でも、一時的に起きた時刻で睡眠領域候補が区切れてしまう。しかし、生理活動としての睡眠は確かにそこで区切れているが、生活行動としての睡眠をそこで区切ることは望ましくない。そのため、睡眠領域候補の終了後、所定時間(例えば、30分)以内に、次の睡眠領域候補が開始している場合、二つの睡眠領域候補を結合し、一つの大きな睡眠領域として扱う。このようにして睡眠領域候補群の中で結合できるものを探索し、探索された睡眠領域候補群を結合する。
次に、ステップS24では、睡眠領域の候補として不適切であるものを排除する。まず睡眠状態の継続時間が所定時間(例えば、10分)以下の睡眠領域を排除する。睡眠領域の候補群の中の最後の睡眠領域候補の終了時刻が、もし睡眠分析プログラム300の実行によって、読み込んだ集計データの最新測定時刻から所定時間(例えば、30分)以内である場合、次回の睡眠分析プログラム300の実行によって新しく候補に挙がる睡眠領域と結合される可能性がある。このため、このような領域も排除する。以上のように処理した睡眠領域候補群を睡眠領域群として決定する。
次に、ステップS25では、ステップS24で決定した睡眠領域群の中から、主睡眠を抽出し、睡眠の種類を「主睡眠」として決定し、「主睡眠」以外の睡眠を「うたた寝」として決定する。睡眠分析プログラム300は、まず、各睡眠領域の所属するカレンダー日(calendar date)を算出する。これは、睡眠領域の終了時刻が所定時刻、例えば、0時から20時までである場合は同日に所属すると判定し、20時から24時までである場合は次の日に所属すると判定する。例えば、7月23日の16時半に開始し20時半に終了する睡眠領域は、7月24日に所属する。このようにして算出したカレンダー日の最古のカレンダー日から最新のカレンダー日まで、各カレンダー日において最長の睡眠領域を抽出し、これらの抽出された睡眠領域をそのカレンダー日の主睡眠とする。つまり、実際の睡眠領域の終了時刻をカレンダー日の主睡眠として取り扱う。例えば、7月23日の16時半に開始し20時半に終了する睡眠領域が、7月24日に属する睡眠領域の中で最長である場合、7月24日の主睡眠の終了時刻を、7月23日の20時半とする。以上の処理によって算出した主睡眠の睡眠の種類を「主睡眠」として決定し、それ以外の睡眠の種類を「うたた寝」として決定する。
最後に、上記ステップS25で決定した睡眠領域群を記憶装置1100の睡眠分析データテーブル350に格納する(ステップS26)。
睡眠分析プログラム300の実行によって、所定の時間間隔毎に、睡眠領域群を算出し、図11に示すように、各睡眠領域を記憶装置1100の睡眠分析データテーブル350へ格納する。
図11は、睡眠分析データテーブル350のフォーマットの例を説明する図である。
睡眠分析データテーブル350において、腕輪型センサノード1の装着者(生活可視化システムの利用者)の識別子を格納するユーザID351と、睡眠領域の開始時刻を格納する測定日時352と、睡眠領域の終了時刻を格納する終了時刻353と、睡眠の種類(主睡眠であるか、うたた寝であるか)を格納する睡眠の種類354とから、一つのエントリが構成される。
図12は、PC103の表示設定取得プログラム400、および表示データ描画プログラム500の実行による処理に関するGUI画面である生活データ表示ウィンドウ1200を表す。
表示設定取得プログラム400の動作の概要をGUIの観点から説明する。表示設定取得プログラム400は、表示装置1031に生活データ表示ウィンドウ1200を出力し、生活データ表示ウィンドウ1200内の分解能ラジオボタン1201への入力装置1032を介した操作によって、「2分」、「5分」、「10分」、「15分」のうちの何れか一つを、分解能の設定として取得する。
さらに、表示設定取得プログラム400は、生活データ表示ウィンドウ1200内の画面合わせラジオボタン1202への操作によって、「巾合わせ」、「全体表示」のうちの何れか一つを、画面合わせの設定として取得する。
また、表示設定取得プログラム400は、生活データ表示ウィンドウ1200内の主睡眠表示チェックボックス1203への操作によって、主睡眠を強調表示するか否かを設定する主睡眠表示有無設定を取得する。
また、表示設定取得プログラム400は、生活データ表示ウィンドウ1200内の時刻線を引くチェックボックス1204への操作によって、時刻線を引くか否かを設定する時刻線表示有無設定を取得する。また、表示設定取得プログラム400は、生活データ表示ウィンドウ1200内の期間設定ボタン1205への操作によって、図15に示す期間設定ダイアログ12050を表示して表示データを描画する開始日と終了日とを示す表示期間設定を取得し、表示領域テキストボックス1206への入力によって、表示データの横軸の範囲(表示開始時刻から表示終了時刻)を設定する表示領域設定を取得する。
また、表示設定取得プログラム400は、上記各処理において設定が変更された際に、その旨を伝えるメッセージをステータスラベル1208に表示することによって、ユーザがプログラムの状況を確認しやすくしてもよい。
なお、ラジオボタンとはGUIを構成する基本的な部品の一つであり、マウス等の入力機器の操作によって、グループ化されたラジオボタンのうち一つの選択を可能とする。例えば、図12で示される分解能チェックボックス1201では「10分」が選択された状態であるが、「2分」のチェックボックスをマウスでクリック操作をすることによって、「10分」の選択が解除され、「2分」が選択される。また、チェックボックスは、GUIを構成する基本的な部品の一つであり、マウス等の入力機器の操作により選択された状態をトグル切り替えする。例えば、図12の主睡眠表示チェックボックス1203は選択されていない状態であるが、このチェックボックスに対してマウスでクリック操作をすることによって、このチェックボックスが選択された状態(チェックマークがついた状態)に遷移する。チェックボックスが選択された状態で、再度、マウスのクリック操作をすることによって、このチェックボックスが選択されていない状態に戻る。
また、表示データ描画プログラム500は、表示設定プログラム400が取得した表示設定を基に、表示データを描画し、描画エリア1207に表示する。この際、表示データ描画プログラム500を構成する各処理の内容を要約するメッセージをステータスラベル1208に表示することによって、ユーザがプログラムの状況を視認しやすくできる。
表示データ描画プログラム500は、図示しない実行ボタンへのマウス入力を起因として実行してもよいし、所定の周期(10秒おきなど)に実行してもよいし、表示設定取得プログラム400において表示設定のいずれかが変更されたことを起因として実行してもよい。
表示データ描画プログラム500は、図12において、描画エリア1207内で、横軸が左側が0時で、右側が24時で、左から右に時刻が増大するように設定し、縦軸が下に向かって日付が増大するように設定し、各日付には選択された分解能の時間幅を持つ矩形の描画領域(=表示データを表示する一つのブロック)を図中横方向に連続して表示し、指定された日付の0~24時について表示データをタペストリ又はタイル状に表示する。
以上のように、表示データ描画プログラム500は、選択された分解能設定(時間幅)で一つの表示データを矩形の描画領域(ブロック)として表示し、分解能設定の時間間隔で0時から24時までの複数の表示データを描画エリア1207内の水平方向で連続的に表示する。そして、表示データ描画プログラム500は、各日付毎に選択された分解能設定で、複数の表示データを描画エリア1207内の水平方向で連続的に表示することによって、時系列に沿ったタペストリ又はタイル状に表示データを配置し、表示データに関連付けられた人の行動の特徴を提示することができる。
図13は、PC103の表示設定取得プログラム400の実行による処理の例を示すフローチャートである。
本実施形態においては、これらの処理が、生活データ表示ウィンドウ1200への入力装置1032の操作による指令を受け付ける例を示すが、表示に関する設定が外部から変更できる設定ファイルに書き込まれていてもよく、設定が表示設定取得プログラム400や表示データ描画プログラム500内に直接書き込まれてもよい。
まず、ステップS31では、PC103は生活データ表示ウィンドウ1200の分解能ラジオボタン1201から分解能設定を取得する。分解能設定は、表示データの一つの描画セグメントが示す時間幅を設定する、「2分」から「16分」迄の間の数値である。ここで、時間幅は、集計データテーブル250に格納された1分毎の集計データの数を示し、時間幅に含まれる複数の集計データの代表値を一つの表示データで表示するための値である。例えば、集計データを集計した時間間隔が、上述のように1分である場合、時間幅を「2分」に設定すると、一つの表示データは2つの集計データの代表値を表す色(後述)で表示され、時間幅を「16分」に設定すると、一つの表示データは16の集計データの代表値を表す色(後述)で表示される。時間幅の値が小さいほど分解能は高くなり、時間幅の値が大きいほど分解能は低くなる。
分解能設定は一日の最大データ数(例えば、1440件)を割り切れる値であることが望ましい。つまり、本実施形態では、所定の時間間隔を1分として、センシングデータの値を集計したので、集計データの数は、1日当たり24時間×60分=1440個となる。このため、1日の集計データの数の約数となるように時間幅の値を設定するのが望ましい。
本実施形態では、生活データ表示ウィンドウ1200の分解能ラジオボタン1201によって、分解能の設定を「2分」、「5分」、「10分」、「15分」のうちの一つに設定できる例を示したが、例えば、テキストボックスを用意することによって「2分」から「16分」迄のどの数値も入力できるように構成してもよい。PC103は、生活データ表示ウィンドウ1200で取得した分解能設定を一時メモリ108に定義された図示しない領域に格納する。また、分解能設定の処理が完了した際には、設定された分解能設定(例えば、「分解能が「10分」に設定されました」)をステータスラベル1208に表示することによって、処理の内容をユーザに視認しやすくできる。
また、表示装置1031の表示能力に応じて細かい分解能を選択できないように構成してもよい。例えば、携帯端末のように1画面に表示可能な画素数が少ない場合、荒い分解能で表示したほうが行動を把握しやすいため、細かい分解能が指定できないようになっていることが望ましい。つまり、時間幅の最小値が上述した「2分」の場合、表示装置1031の表示領域の画素数が720ピクセル未満の場合では、24時間分の集計データを「2分」ごとの表示データによって表示できないので、表示装置1031で表示可能な画素数に応じて、時間幅の最小値を適宜規制することが望ましい。
次に、ステップS32では、PC103は画面合わせ設定を取得する。画面合わせ設定は、表示データを表示装置1031の描画エリア1207に表示する際に、表示データの横幅を描画エリア1207の横幅が許容する最大の巾に合わせ、表示データの縦の長さが描画エリア1207の縦の長さよりも長い場合に縦スクロールバーをGUIに加えることによって、一度に表示できなかった表示データの部分を表示できるように構成する「巾合わせ」と、表示データの横幅を描画エリア1207の横幅が許容する最大の巾に合わせ、表示データの縦の長さを描画エリア1207の縦の長さが許容する最大の巾に合わせ、その分表示データの横幅を縮小することによって表示データの全域を閲覧することを可能とする「全体表示」の何れか一方を、入力装置1032の操作により選択する。
本実施形態では、画面合わせラジオボタン1202で「巾合わせ」か「全体表示」かのうち一つを設定できる例を示した。「巾合わせ」表示にした場合、描画エリア1207が全てデータで埋まり、何も表示していない領域がないため、データの量や表示装置1031の能力にかかわらず、スクリーン(表示装置1031の表示領域)上の無駄を低減させることができる効果がある。また「全体表示」の効果として、データの全域を見渡すことが可能である効果がある。また、この処理が完了した際に、設定された画面合わせ設定(例:「画面合わせが巾合わせに設定されました」)の内容をステータスラベル1208に表示することによって、処理の内容をユーザに視認しやすくできる。
次に、ステップS33では、PC103は主睡眠表示有無設定を取得する。主睡眠表示有無設定は、睡眠分析データテーブル350に格納した睡眠領域のうち表示期間に含まれる主睡眠を、描画エリア1207の表示データ上に強調表示するか否かを設定する。
本実施形態では、生活データ表示ウィンドウ1200内の主睡眠表示チェックボックス1203への操作によって、この設定をする例を示した。PC103は、ステップS33で取得した主睡眠表示有無設定を、メモリ108に定義された図示しない領域に一時的に格納する。主睡眠を強調して表示した画面の例を図14Aに示す。図14Aに示す画面例では、描画エリア1207内に描かれた白い帯の睡眠領域1211によって、検出された睡眠領域のうちの主睡眠を強調表示している。このように主睡眠を強調表示することによって、腕輪型センサノード1の利用者の長期的な睡眠パターンを把握しやすくする効果がある。また、この処理が完了した際、設定された主睡眠表示有無設定(例:「主睡眠を『表示する』に設定されました」)をステータスラベル1208に表示することによって、処理の内容をユーザに視認しやすくできる。
次に、ステップS34では、PC103は時刻線表示有無の設定を取得する。時刻線表示有無設定は、生活データ表示ウィンドウ1200内の描画エリア1207の表示データ上に時刻の変わり目を表す縦線を表示するか否かの設定である。本実施形態では時刻線を引く設置をするためのチェックボックス1204への操作によって、この設定をする例を示した。PC103は、ステップS34で取得した時刻線表示有無設定を一時メモリ108に定義された図示しない領域に一時的に格納する。描画エリア1207内の表示データ上に時刻線を表示した画面の例を図14Bに示す。図14Bに示す画面例では、3時間毎に時刻を表す白い縦線の時刻線1212を表示しているが、時刻線1212の間隔は3時間毎に限定されない。また、生活データ表示ウィンドウ1200に、図示しないテキストボックスやダイアログを設けて、表示する時刻線の間隔を指定できるように構成してもよい。このように時刻線を表示することによって、表示データの中心部など、時刻が分かりにくい部分でも時刻が分かりやすくなる。また、視覚的に縦の直線が分かりやすくなるため、例えば、毎日同じ時刻に行っている行動が実際は少しずつ遅れている、などの事象を視覚的に捉えやすくなる効果がある。また、この処理が完了した際、設定された時刻線設定(例:「時刻線を『表示する』に設定されました」)をステータスラベル1208に表示することによって、処理の内容をユーザに視認しやすくできる。
次に、ステップS35では、PC103は表示領域設定を取得する。表示領域設定は、描画エリア1207内の表示データの横軸の左端と右端の時刻の設定である。本実施形態では、生活データ表示ウィンドウ1200内の表示領域テキストボックス1206に入力される二つの数値によって、左端と右端の時刻を設定する例を示した。PC103は、ステップS35で取得した主睡眠表示有無設定をメモリ108に定義された図示しない領域に一時的に格納する。図12には、表示領域設定として0時から24時までが指定されている例が図示されているが、例えば、腕輪型センサノード1を業務時間中にしか装着しない人は定時内(8時半から17時など)に設定することによって、PC103のユーザに興味のある領域のみしか表示しないことができる。また、右端の時刻は24時ではなく、例えば、表示領域を4時から4時に設定することによって、その日の朝4時を左端に、次の日の朝4時を右端になるように表示させることもできる。また、この処理が完了した際、設定された表示領域設定(例:「表示領域が9時から17時30分に設定されました」)をステータスラベル1208に表示することによって、処理の内容をユーザに視認しやすくできる。
次に、ステップS36では、PC103は表示期間設定を取得する。表示期間設定は、開始日と終了日の二つの日付を含み、描画エリア1207内で表示データが表示される日にちの期間(開始日から終了日)の設定である。PC103は、ステップS36で取得した期間設定をメモリ108に定義された図示しない領域に一時的に格納する。本実施形態では生活データ表示ウィンドウ1200内の期間設定ボタン1205へのクリック操作を起因として、図15に示す期間設定ダイアログ12050が提示される例を示した。
図15に示す期間設定ダイアログ12050は、期間ラジオボタン12051によって、集計データテーブル250に格納された該ユーザのデータの最終日時を基に、最終日時から過去一ヶ月間を表示する直近一カ月、最終日時から過去三カ月を表示する直近三カ月、最終日時から過去半年を表示する直近半年、最終日時から過去一年を表示する直近一年、集計データテーブルに格納された該ユーザのデータ全てを表示する全期間、期間設定テキストボックス12052によって表示期間を指定する期間指定、のうち一つの選択を可能とする。OKボタン12053へのマウスによるクリック操作によって、選択された設定を期間設定として決定する。また、この処理が完了した際、決定された表示期間設定(例:「表示期間が2009年3月1日~2009年3月31日に設定されました」)をステータスラベル1208に表示することによって、処理の内容をユーザに視認しやすくできる。
また、図19で示すようなマウス操作による期間(領域)の選択機能が備わっている場合、予め期間設定ラジオボタン12051が「期間指定」に設定されており、マウスのドラッグ操作により描画エリア1207で領域1213を選択した状態において期間設定ボタン1205をクリック操作をすると、期間指定テキストボックス12052が描画エリア1207で選択された領域1213に対応する期間を取得するように構成してもよい。これによりデータを確認しながら、視覚的に期間を選択できるようになり、操作が簡便になる効果がある。
図16は、PC103の表示データ描画プログラム500の実行にる処理の一例を示すフローチャートである。以下において、表示データ描画プログラム500は、描画するのに十分な描画バッファ(図示省略)をメモリ108に確保し、この描画バッファを空白にした後で描画を開始する。
まず、ステップS41では、データ集計プログラム200の実行によって集計した単位時間毎の集計データを集計データテーブル250から読み込む。ステップS41で読み込まれる集計データの期間は、表示設定取得プログラム400が上述の処理で取得した表示期間設定と表示領域設定とから決定される。即ち、PC103が集計データテーブル250から集計データを取得する期間の開始日時は、表示期間設定の開始日の、表示領域設定の開始時刻である。また、取得する期間の終了日時は、もし表示領域設定の終了時刻が24時より前であるならば表示期間設定の終了日の、表示領域設定の終了時刻であり、表示領域設定の終了時刻が24時以降であるならば、表示期間設定の終了日の翌日の、表示領域設定の終了時刻である。また、この処理の開始時に、処理の内容(例:「データの取り込みを開始します」)をステータスラベル1208に表示することによって、処理の内容をユーザに視認しやすくできる。
次に、ステップS42では、ステップS41で読み込んだ集計データから代表値を算出するための、いずれかの分解能を設定することによって、表示データの分解能を該設定値(分解能設定値)まで下げる。すなわち、本実施形態の生活可視化システムにおいて、集計データは1分毎の値であり、一日の集計データは1440件であるが、分解能「10分」の設定を適用することによって一日の表示データが144件となるように変換する。なお、ステップS41で読み込んだ集計データの運動頻度、運動強度又は歩行数は、分解能設定に基づいて複数の集計データに集計され、該集計データのサンプル値、最大値、最小値、平均値又は中央値が代表値として計算される。
設定された分解能である「10分」間に含まれる10件の集計データの値のうち1番目の値、10番目の値などの予め決められた箇所の値をサンプル値に設定する。最大値は10件のデータのうち最大の値である。最小値とは10件のデータのうち最初の値である。平均値とは10件のデータの相加平均値である。中央値とは、10件のデータを降順にならべた際に5件目のデータの値である。また、この時、分解能を落とすための分解能設定処理は、分解能設定で一つの表示データに含まれる複数の集計データを代表する値を一つ算出する処理であれば、上述の他に周知又は公知の方法を適用することができる。
以上では、分解能が「10分」の場合について説明したが、分解能が何れの値であっても、以上の処理は計算される代表値の一般的な数学的定義に基づいて行えばよい。また、上記データ期間の中に、フラグ258が欠損データであることを示しているデータがある場合、欠損データを除いて補正してもよい。一方で該データ期間のうち欠損データの割合が所定の閾値以上である場合、補正後の代表値は欠損値としてマークされたものを用いることが望ましい。例えば、値を「-1」のような異常値とすることによって、欠損値を含むことを明示できる。また、該データ期間の中に、フラグ258が非装着データであることを示すデータがある場合、非装着データを除いて補正してもよい。一方で、該データ期間のうち非装着データの割り合いが所定の閾値以上である場合、補正後の値は非装着データとしてマークされたものを用いることが望ましい。例えば、値を「-2」のような異常値にすることによって、非装着データを含むことを明示できる。この処理の開始時に、処理の内容(例えば、「データの分解能設定を開始します」)を、ステータスラベル1208に表示することによって、処理の内容をユーザに視認しやすくできる。
次に、ステップS43では、ステップS42の出力である分解能の設定値から生成された代表値の各値を色に変換(色データの付加)することによって、分解能設定に対応する表示データから時系列的な色配列を生成する。例えば、図17に示す運動頻度と色相の変換式とを利用し、彩度、明度を最大に固定した場合、運動頻度が0(静止中)の時は色相が270°(青)となり、運動頻度が250以上の時は色相が0°(赤)となり、運動頻度が高いほど暖色になるため視覚的に運動の強さが把握しやすくなる。また、ステップS42では、欠損値を無視して、残りの集計データを利用して分解能を補正しているが、このデータ期間のうち有効な集計データの件数の割り合いに応じて彩度を決定し、明度を半分に設定してもよい。この処理を実行することによって、集計データに欠損が多い区間程、灰色に近くなるため、集計データの欠損箇所が視覚的に分かりやすくなる。また、集計データの値が非装着としてマークされている場合、これを濃い灰色等の予め設定した特徴的な色に設定することによって、非装着期間を視覚的に把握しやすくしてもよい。この処理の開始時に、処理の内容(例えば、「データを色に変換しています」)をステータスラベル1208に表示することによって、処理の内容をユーザに視認しやすくできる。
次に、ステップS44では、描画エリア1207に日付軸を描画する。ステップS41で取得した集計データの最古のデータが属する日付及び曜日を、図12に示した描画エリア1207の左側の一番上に表示し、下に向かって各行に次の日の日付及び曜日を、ステップS41で取得した集計データの最新のデータが属する日付又はその前日迄を、表示領域の設定に応じて表示する。この時、土曜日の日付及び曜日は青色で表示し、日曜日の日付及び曜日は赤色で表示、また図示しない別テーブルや外部入力手段によって指定される日を別色で表示してもよい。このように、週の変わり目を明確にしたり、祝日を強調表示したりすることによって、生活の変化の理由が分かりやすくなる効果がある。また、各行の高さは、画面合わせ設定が「巾合わせ」の場合は行の高さと巾の比率が固定になるように設定し、描画エリア1207の巾に応じて高さを変えてもよい。さらに、描画エリア1207の巾に応じて高さを変えて、かつ、各行の高さが表示装置1031の表示能力で可読である所定の最小値以下にはならないという制限を加えてもよい。また、画面合わせの設定が「全体表示」の場合は、行の高さは描画エリア1207の高さ/表示日数に自ずと決定される。
以上に説明したような行の高さの設定方法では、一行が所定の高さ未満になってしまい、日付表示の可読性が損なわれる場合、日付の表示サイズを大きくし、日付を一週間おきにしか表示しないことによって、日付の可読性を増すことができる。この処理の開始時に、処理の内容(例えば、「日付軸を描画しています」)をステータスラベル1208に表示することによって、処理の内容をユーザに視認しやすくできる。
また、各行の高さを固定にするのではなく、例えば、マウスのホイール操作や、図示しないズームボタンへの操作によって、行の高さの変更を可能にしてもよい。これによって、例えば、マウスホイールを一方に回すと表示が上下方向に拡大され、逆の方向に回すと表示が上下方向に縮小されるため、ユーザが詳細に注目したい箇所について、自由に表示の大小を変更できる効果がある。
マウスホイール操作では画面の表示上の上下だけでなく、左右も同時に拡大表示されることが一般的な表示効果であるが、図45Aに示すマウスのホイール操作前と、図45Bに示すマウスのホイール操作後のように、マウスホイール操作時の拡大操作を上下方向だけにすることによって、描画エリア1207内で表示データ(一つの描画領域)を拡大しつつ、上記設定した表示領域(例えば、0時から24時)を表示することができる。更に、ホイール操作時にはマウスポインタの位置(例えば、図では3月12日)を中心として拡大表示されることが望ましい。即ち、図45Aでは描画エリア1207の上から2/5程の箇所にマウスポインタがあり、3月12日がその高さに位置しているが、ホイール操作後の図45Bにおいてもポインタの箇所に3月12日が表示されている。
次に、ステップS45では、描画エリア1207に時刻軸を描画する。表示設定取得プログラム400が設定した表示領域設定の開始時刻を図12に示した描画エリア1207一番左に表示し、表示設定取得プログラム400が設定した表示領域設定の終了時刻を描画エリア1207の一番右に表示し、開始時刻と終了時刻の間に時刻を均等に配置する。なお、時刻軸は表示データの位置を決定するための図中横軸方向のガイドであり、任意の色又は無色で描画することができる。本実施形態では無色で時刻軸を描画した例を示す。この時、画面合わせの設定が「巾合わせ」である場合は、軸の左端は描画エリア1207の左端で、軸の右端は描画エリア1207の右端に来るように描画し、画面合わせ設定が「全体表示」の場合は、一行の縦と横の比率が一定になるように軸の長さを縮小してもよい。また、時刻の表示サイズは、軸と対応づけられるように縮小してもよいし、所定の固定値でもよいし、特定の固定値で表示できるように一時間置きに表示するのではなく数時間置きに時刻を表示してもよい。これによって、時刻軸の目盛りが示す時刻、すなわち、表示データの時刻が分かりやすく表示できる効果を大きく損なうことがない。また、0時及び12時などの特定の時刻の色を変える又は文字の大きさを変えすることによって、特定の時間帯に注意を導くことができる。また、例えば図示しない入力手段から時刻を入力することによって、ユーザ指定の時刻を時刻軸上に表示してもよい。これにより、個人の生活パターンのニーズに応じて強調した表示をすることができる。この処理の開始時に、処理の内容(例えば、「時刻軸を描画しています」)をステータスラベル1208に表示することによって、処理の内容をユーザに視認しやすくできる。
また、時刻軸の左端は表示設定プログラム400で設定した表示領域に依存するのではなく、睡眠分析データテーブル350に格納した睡眠領域群のうち、睡眠の種類354の値が主睡眠になっている睡眠領域の終了時刻、即ち主睡眠の起床時刻、を軸の左端としてもよい。人の一日は0時に始まるわけではなく、感覚としては起床を原点として始まるものである。そのため、起床時刻を原点として表示することによって、より人の生活の感覚に即した生活データの提示が可能となる。この表示例を図46A、図46Bに示す。図46Aは、睡眠領域1211を強調表示した場合の描画エリア1207の画面イメージである。図46Bは、睡眠領域1211を除外した場合の描画エリア1207の画面イメージである。
図46Aは表示期間の睡眠領域1211が強調表示されているが、図46Bでは各日の起床時刻が左端になるよう表示されている。図46A及び図46Bにおいて、時刻軸は、時刻を表さず、「起床後の経過時間」を表す。例えば、睡眠障害、慢性疲労のように、起床後に長時間高い活動レベルを保つことが困難になる疾病を罹患している対象者では、活動量は「時刻」ではなく、むしろ起床後経過した時間で確認する方に関心がある。この表示方法によれば、このような疾病の罹患者の生活において、活動量が減る時間帯が縦に見やすい位置に表示されることが期待できるため、疾病の度合いを可視化することが可能となる。また規則正しい生活を送っている場合は、一日の幅は24時間に近くなるはずである。このため、24時間を基準として一日の帯の長さがどれだけばらつくかを確認することによって、自らの生活がどれだけばらついているか確認することが可能となる効果がある。この判断の基準を視認しやすくするために、24時間の位置に縦線を引いてもよい。
また、本実施形態では横軸を時刻の昇順、縦軸を日付の降順で表したが、これに限定されるものではなく、横軸を日付、縦軸を時刻にしてもよいし、また降順、昇順を逆にしてもよい。
次に、ステップS46では、ステップS43で生成した色配列を表示データ毎に描画する。一つの表示データは、ステップS42で算出した一つの代表値に対応する。そして、表示データの幅は分解能ラジオボタン1201で選択された値に対応する。PC103は、色配列に含まれる各色を、ステップS44で描画した日付軸と、ステップS45で描画した時刻軸が示す位置に、ステップS44で設定された行の高さ及び分解能で設定された幅で、矩形で描画する。この時、行と行の間を見やすくするために、行と行の間に(例えば、灰色の)横線を引いてもよい。また、色を描画する際、色配列が示す単色を長方形に塗りつぶすのではなく、例えば右端のピクセルの色を薄くし、下端のピクセルの色を濃くすることによって3次元的な効果をあたえ、視覚的美観効果を高めてもよい。この処理の開始時に、処理の内容(例えば、「色データを描画しています」)をステータスラベル1208に表示することによって、処理の内容をユーザに視認しやすくできる。
次に、ステップS47では、表示設定取得プログラム400によって設定された主睡眠表示有無設定が有効であった場合に、主睡眠の領域1211を描画する。睡眠分析プログラム300で抽出され、睡眠分析データテーブル350に格納された睡眠領域群のうち、睡眠の種類354の値が主睡眠であり、終了時刻353がステップS41で取得した期間の開始日時以降であり、かつ、開始時刻352がステップS41で取得した期間の終了日時以前である領域を取得する。これらの期間を図14Aの主睡眠領域1211に示されるように、ステップS45で描画した日付軸とステップS45で描画した時刻軸が示す行の高さの一部の領域を白色等の、視覚的に区別可能な色で描画する。なお、この主睡眠は、上半分、下半分など、行を高さ方向に部分的にしか隠さない形態で表示してもよく、行の高さ全体を用いて表示してもよい。この時、睡眠領域の表示を透過処理することによって、睡眠領域を強調しつつ、背後の行動データも可視に表示してもよい。また、図示しない別の入力手段において入力され又は算出によって導出され、及び、格納された、睡眠に対する評価情報(0:悪い眠り~5:良い眠り)やコメントを取得し、睡眠領域の描画域上に表示することによって、睡眠の質の時系列的変化を可視化してもよい。この処理の開始時に、処理の内容(例:「主睡眠を描画しています」)をステータスラベル1208に表示することによって、処理の内容をユーザに視認しやすくできる。
次に、ステップS48では、睡眠以外に判別可能な、人の所定の行動が検出された箇所を所定の表現方法で表示することによって、表示装置1031の閲覧者に補足情報を与える。
この説明では例として、ジョギング期間を強調表示する例を示す。人の行動において歩行中の運動強度は安定しているため、通常の歩行とジョギングとを区別する運動強度の閾値を設けることが可能である。例えば、歩行数が0以上であり、運動強度が所定の閾値以下であれば歩行、該閾値以上であればジョギング、と判定することによって、ジョギング期間を判別することが可能となる。そこで、所定の時間(例えば、「10分」)以上ジョギング状態が継続している領域1214に、図24Aで示すように所定の色(例えば、白)で、視覚的に区別可能な表示をすることによって、ジョギング中の期間を視覚的に把握しやすくできる。例えば、頻繁にジョギングをする人は、毎日同じ時刻にジョギングを開始することが多いため、この形態で表示することによって、ジョギング時間の長期的な変動を確認することができる。
また、図24Bに示すように、上記図24Aに示した領域1214の強調表示の上に、その時刻における歩行数(走行ピッチ)を線グラフで表示することによって、ジョギング中の走行ピッチの変動を視覚的に把握しやすくすることもできる。この形態で表示することによってジョギング中のピッチの変動を確認することができる。また、ジョギング中のピッチだけではなく、例えば腕時計型センサ1が脈拍センサを備えている場合、脈拍を線グラフで図示してもよい。
また腕時計型センサノード1が取得したデータだけではなく、例えば、図示しないGPSデバイスで装着者の位置情報を取得することによって、腕時計型センサノード1の運動頻度が少ないが、位置は移動中であることを示している場合、乗り物に乗っていることが推定できる。また移動している位置を地図情報と照合することによって、移動の軌跡が線路上か道路上か、つまり電車移動か、車移動かが判別できる。さらに、位置の高度情報を参照することによって、飛行機による移動かが判別できるため、乗り物に乗車中と判別された時間帯に、描画エリア1207上で、その区間を単色で強調表示し、判別された乗り物を表すアイコンを表示することによって、生活における乗り物の利用パターンを視覚化することができる。
以上の説明では、ジョギング行動又は乗り物への乗車を検出し、描画する例を示したが、これに限られるものではなく、腕時計型センサノード1のデータを解析することによって判別できる行動、また、それ以外の図示しない入力手段に入力された行動を判別し、表示してもよい。
次に、ステップS49では、PC103は、コメント入力テーブル650に格納されたコメントを描画エリア1207上に表示する。コメント入力テーブル650は、後に詳細に説明するコメント入力プログラム600の実行によって入力される。
図22は、コメント入力テーブル650のフォーマットの例を示す説明図である。
コメント入力テーブル650において、腕輪型センサノード1の装着者(生活可視化システムの利用者)の識別子を格納するユーザID651と、コメントが表示される区間の開始日時を格納する開始日時652と、コメントが表示される区間の終了日時を格納する終了日時653と、コメントの内容を格納する内容654と、コメントの内容を表示する際に指定する背景色を格納する表示色655とから、一つのエントリが構成される。
ステップS49の処理では、コメント入力テーブル650に格納されたコメントのうち、終了日時653がステップS41で取得した期間の開始日時以降、開始日時652がステップS41で取得した期間の終了日時以前であるコメントを取得する。これらの期間(開始日時から終了日時)は、図23Aで示すように、ステップS44で描画した日付軸とステップS45で描画した時刻軸が示す行の高さの全体の領域1215を、表示色655で指定された色で、視覚的に区別可能に表示する。なお、このコメント区間は、上半分、下半分、中央など、行を高さ方向に部分的にしか隠さない形態で表示してもよい。更に、この上に、コメント内容654の文字列1216が、表示色655の上に描画されても視認可能な色で描画される。例えば、表示色655の反対色でコメント内容654を描画することによって、文字列が視認可能となる。また、この時、コメントの表示を透過処理することによって、コメントを強調しつつ、背後の行動データも視認可能にしてもよい。
また、図23Bで示すように、コメント1216を表示データの上ではなく、表示データの隣に配置することによって、データの可視性を損なうことなく、コメントを閲覧することができる。
生活データを意味する表示データは、過去のイベントを想起させる効果があるため、上記構成により、生活データと当該生活データに対するコメントを同時に表示することによって、単にコメントを表示させる日記やブログなどよりも豊かな生活記録を提示する生活可視化システムを構築することが可能となる。
次に、ステップS491では、表示設定取得プログラム400が設定した時刻線描画有無設定が有効であった場合に、時刻線を描画エリア1207上に描画する。図14Bで示されるように、時刻線1212は、時刻軸で表される各時刻から、当該時刻を表す縦線を描いてもよいし、一時間毎又は所定の時間毎に描いてもよいし、図示しない別の入力手段により設定される時間毎又は時刻に描いてもよい。この時刻線1212の色は白などの強調されやすい色が望ましいが、白色に限るものではない。この処理の開始時に、処理の内容(例えば「時刻線を描画しています」)をステータスラベル1208に表示することによって、処理の内容をユーザに視認しやすくできる。
次に、ステップS5では、ステップS41~S491で描画されたメモリ108上に存在する描画バッファの内容を表示装置1031に出力し、GUI画面である生活データ表示ウィンドウ1200のデータ描画エリア1207に表示する。この際、描画バッファの縦巾がデータ描画エリア1207より大きい場合は、図12で示すように縦スクロールバーを配置してもよい。この処理の開始時に、処理の内容(例えば「画面上に描画しています」)をステータスラベル1208に表示することによって、処理の内容をユーザに視認しやすくできる。
また、この時マウス等のカーソルが描画エリア1207上に置かれたことに起因し、図18で示すように、カーソルが位置している箇所の日付1216を日付軸上で表示色及び背景色を変えることによって強調表示してもよい。なお、表示色のみを変えても、背景色のみを変えても、これ以外に、表示サイズを変えてもよい。また、カーソルで選択中の時刻と、その日時の運動量をステータスラベル1208に表示してもよい。これによって、ユーザは興味を持ったデータの日時と内容を簡便に知ることが可能となる。
また、マウスなどで描画エリア1207上をクリック操作をし、ドラッグされたことに起因し、クリック操作がされた位置からドラッグされた最終地点までの領域1213を図19のように選択し、視覚的に区別できるように表示してもよい。またステータスラベル1208に選択された期間や、期間の長さを表示することによって、ユーザが興味を持った領域の日時の内容を簡便にすることができる。
また、以上の説明において、ステップS42で設定された分解能は全てのデータで同一であり、またステップS44で設定された行の高さは全ての行で同一であった。しかし、分解能と行の高さとを、マウスのカーソル位置と、描画中の日時との関数として定義してもよい。例えば、カーソルが指示している日の前後二日間以内は、分解能「2分」で行の高さを10ピクセルで描画し、前後二日から四日以内は分解能「5分」で行の高さ5ピクセルで描画し、それ以外の領域は分解能「10分」で行の高さ2ピクセルで描画するとよい。カーソルの位置は、ユーザが注目している領域を表していると考えられる。そのため、このように、カーソル位置付近の日付方向の分解能を段階的に細かくし、行の高さを大きくすることによって、ユーザが注目したい領域では細かい行動が見やすくなり、ユーザが注目していない領域では概要が表示されるため、ユーザの注目を阻害せずに、全体の概要の情報を与えられる効果がある。
また、上記関数はカーソル位置に依存するのではなく、表示されているデータの最新日時を最高の分解能と行の高さに設定し、そこから段階的に分解能が荒くなり、行の高さが小さくなる関数として定義してもよい。一般に、ユーザにとって過去のデータほど興味が薄れるため、過去の細かい行動は意味が薄くなる。そのため、このように過去のデータは小さく且つ粗く表示されることによって、細かい行動に興味がある最近のデータは細かい分解能且つ大きい行で表示され、細かい行動に興味が薄い過去のデータは荒い分解能で小さく表示される効果がある。
また、以上の説明では、表示設定取得プログラム400で設定された表示期間内の全ての日が最終的に表示されていた。しかし、腕輪型センサノード1の利用者が会社員である場合は、会社における就業時間などの制約を有する平日の過ごし方と、それ以外の休日(週末や祝日など)の過ごし方とは、別の要因により規定される活動であるため、並べて比較する必要がない。例えば、週末や、その他の図示しない外部入力手段によって設定される特定の日(祝日など)のみを表示したり、又は、平日だけを表示することによって、類似した行動要因がある日を並べることができ、全ての日を並べるよりも利用者にとって自信の生活の変化を把握しやすく表示できる効果がある。この場合、表示設定取得プログラム400が、平日と休日の何れを選択するかを受け付ければよい。
また、表示装置1031又はPC103が、現在地(例えば、会社、家(居間)、家(自室)等)を検出する手段を備えている場合に、表示設定取得プログラム400が取得する表示領域の情報は現在地情報に応じて制限されてもよい。即ち、表示設定取得プログラム400が表示領域テキストボックス1206への入力を表示領域の設定として取得する際に、図25に示す記憶装置1100の位置固有表示領域テーブル700の現在位置を示すエントリの開始時刻と終了時刻との間に表示期間が収まるように表示領域の設定を変更することによって、最終的な表示領域が現在位置によって制限されるように構成する。
図25は、位置固有表示領域テーブル700のフォーマットの例を示す説明図である。
位置固有表示領域テーブル700においては、表示装置1031の現在地と相互参照するための位置701と、制限する表示領域の開始時刻702と、制限する表示領域の終了時刻703とから、一つのエントリが構成される。
ステップS35において、表示設定取得プログラム400は、位置固有表示領域テーブル700を利用して、表示領域テキストボックス1206に入力される二つの数値を仮の表示領域設定として取得した後、表示装置1031から出力される現在地情報を表す値(例えば、『会社』)を取得し、この値と同じ値を位置701に持つエントリを位置固有表示領域テーブル700から取得し、取得したエントリの開始時刻702から終了時刻703が示す期間を表示制限領域として取得する。次に、上記取得した仮の表示領域設定の開始時刻と表示制限領域の開始時刻のうち遅い方、表示領域設定の開始時刻として決定する。また、上記取得した仮の表示領域設定の終了時刻と表示制限領域の終了時刻のうち早い方を、表示領域設定の終了時刻として決定する。これによって、表示領域設定を取得する。
図25では例として、会社では、表示領域が9時から17時までに制限されていることが定義されている。例えば、表示装置1031が会社に設置されており、表示領域テキストボックス1206へ10:00~20:00を入力した場合、表示設定プログラム400は、位置固有表示領域テーブル700を参照することによって表示制限領域が9:00~17:00である情報を得て、表示領域を10:00~17:00に設定する。
位置固有表示領域テーブル700の内容は、図示しないGUI画面によってユーザが自ら追加又は編集してもよいし、予めプログラム内に定義されてもよい。
以上の構成によって、例えば、PC103が携帯電話機などの携帯端末である場合に、自分以外の人間に会社外で生成されたデータを確認されて、プライバシーが侵害されることを防ぎつつ、業務時間中のデータは確認可能にすることによって、業務において行動データを利用することを妨げずに、プライバシーを確保することが可能となる。
また、以上では、表示領域を制限することを説明したが、同様に表示期間を設定し、例えば、会社では週末のデータは表示しない、等の制限を定義できるように構成してもよい。
また、表示データ描画プログラム500は、図示しないコメント入力ボタンに対するマウス等のクリック操作等を起因として、コメント入力プログラム600を実行する。
図21は、PC103のコメント入力プログラム600の実行による処理に関するGUI画面であるコメント入力ダイアログ12090の例を示す説明図である。
コメント入力プログラム600の動作の概要を、GUIの観点から説明する。コメント入力プログラム600は、コメント区間テキストボックス12091への入力装置1032からの入力を受け付けて、コメントを表示する区間を取得し、コメント内容テキストボックス12092への入力によってコメントの表示内容を取得し、表示色テキストボックス12093への入力によって表示されるコメントの背景色を取得する。また、この例では表示色はテキストボックス12093に入力されるが、PC103のOSのGUI機能に、色彩を選択できるコントロールが備わっている場合、複数の色彩の何れかを選択する機能で代用してもよい。
なお、テキストによるコメントではなく、ファイルを指定し、指定されたファイルをアップロードできるように構成してもよい。このように構成すると、画像、音声等の様々な形式のファイルを、生活データに対応づけることができる。
図20は、PC103のコメント入力プログラム600の実行による処理の例を示すフローチャートである。
まず、ステップS601では、PC103が図19で示した期間選択機能(領域選択機能)を描画エリア1207に提供している場合、入力装置1032の操作によって選択されている領域をコメント入力区間として取得する。PC103は、入力装置1032によって選択された領域から、開始日時と終了日時とをコメント入力区間として抽出する。
次に、ステップS602では、図21で示すコメント入力ダイアログ12090を表示装置1031に表示する。この時、ステップS601でコメント入力区間を取得した場合、取得したコメント入力区間をコメント区間テキストボックス12091に表示する。
次に、ステップS603は、OKボタン12094の操作を起因として実行される。具体的には、コメント区間テキストボックス12091の内容をコメント区間として取得する。
次に、ステップS604では、コメント内容テキストボックス12092に入力された内容をコメント内容として取得する。
次に、ステップS605では、表示色テキストボックス12093に入力された内容を表示色として取得する。
次に、ステップS606では、コメントの区間(開始日時、終了日時)、内容、表示色を取得し、取得したデータを記憶装置1100のコメント入力テーブル650へ格納する。
以上の処理により、生活データ表示ウィンドウ1200内の表示データに注釈を加えたい場合には、コメント入力プログラム600を所定の操作によって起動して、注釈を加える期間と内容及び表示色を設定することができる。
次に、本実施形態の分解能設定について以下に説明する。
図27Aは、本発明の分解能設定と運動頻度の関係を示すグラフの一例である。図27Bは、本発明の分解能設定と運動強度の関係を示すグラフの一例である。
本願の発明者らは、人の長期間の行動記録を表示装置1031において可視化するためには「2分」から「16分」の間の分解能が本質的に最適であることを見いだした。これは、人の行動に固有の特性として一つの行動の影響の半減期が約「16分」であるという観測に基づいている。ある腕輪型センサノード1の利用者の集計データに関して、図6のステップS14で示したように、一分毎に運動頻度を算出し、運動頻度の自己相関R(τ)を算出し、τ(時間)を変化させてプロットしたグラフを図27Aに示す。なお、自己相関R(τ)は、1分ごとの集計データについて周知の自己相関関数を適用したものである。図27Aで示すように、1分ごとの人の行動を示す集計データでは、ある行動の影響が及ぶ範囲(行動の半減期)、即ち、自己相関R(τ)が0.5を下回るのは時間(図中ウィンドウ幅)τが「16分」前後である。
また、運動頻度と同様に、図6のステップS15で1分ごとの運動強度を算出し、運動強度の自己相関R(τ)を算出し、時間(図中ウィンドウ幅)τを変化させてプロットしたグラフを図27Bに示す。図27Bも同様に、自己相関R(τ)が0.5を下回るのは時間(図中ウィンドウ幅)τが「15分」前後の時である。このことから、上記運動頻度と同様に「16分」に近い分解能でデータを示すことにより人の行動を把握しやすい形で提示することが可能になることが分かる。
したがって、人の行動を運動頻度及び運動強度から把握するためには、一つの表示データ(生活データ)を、1分ごとの集計データを最大16分、すなわち、一つの表示データの時間幅を16分間とすることによって、人の行動の特徴を容易に把握することができる。
すなわち、図26Bで示したように、分解能(=時間幅)を120分とした場合では、実際の人の行動の詳細を読み取ることができず、行動の起点を示す起床時刻などの時間帯を把握することができない。
一方、本実施形態のように、表示データの時間幅が「16分」以内の「10分」とした場合には、図26Cのように表示される。
図26Cで示すように、分解能=「10分」として10個の集計データを、一つの表示データに集約し、描画エリア1207内に複数の表示データを時系列的なタペストリ又はタイル状に並べて表示した場合、睡眠期間と覚醒期間との区別も分かりやすく、また各行動の内容が類推できるレベルで表示される。
一方、分解能の設定範囲の最小値を小さな値(例えば、1分)とすると、前記従来例の図26Aで示したように、睡眠と覚醒中の期間を区別することが困難となり、生活データを効果的に把握することができない。
そこで、本発明では一つの表示データが含む1分ごとの集計データを最小2分、すなわち、一つの表示データの時間幅を集計データの時間間隔(1分)の2倍である2分とすることによって、人の行動の特徴を容易に把握することができる。
以上のように、人の行動を表す長期間データの全体像を把握するためには、表示の分解能が重要となる。図26Aや図26Bのように、分解能が高すぎても低すぎても生活データを効果的に可視化することができない。
そこで、本実施形態の図26Cのように、生活データを効果的に把握する点を考慮して、運動頻度や運動強度の自己相関が示す行動の半減期から、分解能を最小値=「2分」、最大値=「16分」と決定することによって、閲覧者が把握しやすいように複数の集計データを代表値に集約したものを生活データとする。そして、生活データの値を色データに変換して表示する。これにより、長期間に渡る人のセンシングデータから人の行動を示す生活データを時系列的な色データとして得ることができ、睡眠期間や覚醒期間を容易に識別可能な情報を表示装置1031に出力することが可能となる。
なお、上記第1の実施形態において、表示データ描画プログラム500はステップS47、S48及びS49で、描画した生活データの上に、更に睡眠領域、ジョギング領域、コメント等を表示している。しかし、これらの追加情報は生活データの全体を見渡すことを阻害する情報である。そこで、マウスのカーソル位置で示される日時から所定の日数以内、又は表示されている全データの最新日から所定の日数以内において、睡眠領域、ジョギング領域及びコメントを表示してもよいし、マウスのカーソル位置で示される日時から所定の日数以内、又は表示されているデータの最新日から所定の日数以内より外の睡眠領域、ジョギング領域及びコメントの表示の透過度を所定のレベルまで上げることによって、視覚的なインパクトを下げてもよい。また、例えばカーソルの位置から一日以内では睡眠領域、ジョギング領域及びコメントを表示し、カーソルの2日から4日以内では睡眠領域及びジョギング領域を表示し、カーソルの5日から7日以内では睡眠領域を表示する、等のように段階的に補足情報の量を減らしてもよい。これにより、注目したい領域のみで睡眠やジョギングなどの詳細な情報が得られ、注目したくない領域ではデータを概要として閲覧することが可能となる。
また、以上の説明において生活データの活動量(運動頻度または運動強度)の違いは色彩の違いで表現されていたが、例えばGIFアニメーション等の再生速度に活動量の値を割り当てることによって、動きの激しさで活動量の大小を表現してもよい。
本実施形態では、腕輪型センサノード1の加速度センサ6が利用者の運動量を測定して、測定された運動量はPC103の記憶装置1100に格納され、測定された運動量を解析して、「2分」から「16分」の間の分解能でユーザに把握しやすい形態で生活データを提示することができる。
なお、上記実施形態では、生活可視化システムとして利用者(人体)の運動量を検出するために、腕輪型センサノード1の加速度センサ6を用いた例を示したが、人体の運動量を検知可能な生体情報であればよく、例えば、脈拍や歩数などを検出するセンサを用いることができ、又は、これらの複数の生体情報の組み合せから人体の運動量を測定してもよい。また、運動量だけでなく、脳波測定装置を用いて集中度合い及び/又は安静度合いを提示してもよい。また、生体情報だけではなく、GPS及び/又は携帯端末等の位置情報で取得した人体の位置情報を用いてもよいし、オフィスにおける機器の操作履歴、及び、アクティブRFIDタグのようなデバイスを利用して人との対面履歴を用いてもよい。
また、上記実施形態では、腕輪型センサノード1が加速度を測定する周期を1秒とした例を示したが、この周期は1秒に限定されず、人の運動量を把握可能な周期で加速度センサ6が加速度を検出すればよい。
また、上記実施形態では、PC103がセンシングデータを集計する時間間隔を1分として集計データを算出する例を示したが、この時間間隔は1分に限定されず、分解能設定の最小時間幅(本実施形態では2分)より短い時間間隔であればよい。
<第2実施形態>
本発明が適用される第2の実施形態として、複数の人(利用者)に装着した腕輪型センサノード1によって測定したセンシングデータから集計データを算出し、算出された集計データをネットワーク上のサーバ104に収集し、利用者のクライアント計算機(PC)203に提示する生活可視化システムについて説明する。
本発明が適用される第2の実施形態として、複数の人(利用者)に装着した腕輪型センサノード1によって測定したセンシングデータから集計データを算出し、算出された集計データをネットワーク上のサーバ104に収集し、利用者のクライアント計算機(PC)203に提示する生活可視化システムについて説明する。
なお、上記第1の実施形態の生活可視化システムと同一の構成には同一符号を付すことによって、重複する構成及び動作の説明は省略する。
図28は、第2の実施の形態の生活可視化システムの構成例を示すブロック図である。本実施形態の生活可視化システムは、当該システムの利用者の動作(又は、状態)を検出するために、上記第1の実施形態と同様に、加速度センサを備えた腕輪型センサノード1を用い、生体情報として腕の加速度を検出する。
腕輪型センサノード1は、上記第1の実施形態と同様であり、利用者(又は、参加者)の腕に装着されて加速度を検出し、検出した加速度データをセンシングデータとして、所定の周期でアンテナ101を介して基地局102へ無線によって送信する。また、有線通信が可能な場合、腕輪型センサノード1はUSB接続などを介してPC203へセンシングデータを送信する。
図28において、基地局102及び/又はクライアント計算機(PC)203は複数の腕輪型センサノード1と通信し、各腕輪型センサノード1から利用者の動きに応じたセンシングデータを受信し、受信したセンシングデータをネットワーク105を介してサーバ104へ転送する。
サーバ104は、受信したセンシングデータを記憶装置2100に格納し、前記第1の実施形態と同様の解析をすることによって各利用者の集計データを計算し、分解能設定に基づいて集計データの代表値の表示データを生成する。
サーバ104は利用者によるPC203からの操作を受け付けて、該利用者、若しくはその他の利用者の表示データをPC203に接続された表示装置2031等に出力し、利用者が閲覧できるように構成する。
また、本実施形態では腕輪型センサノード1で測定したセンシングデータをPC203がサーバ104に送信し、サーバ104が表示データを生成するが、解析の一部又は全てをサーバ104ではなくPC203で実行してもよい。例えば、後述する一分毎のゼロクロス回数をPC203で解析し、センシングデータではなくゼロクロスデータをサーバ104に送信してもよい。このような実施形態によって、一日につき24[時間]×60[分]×60[秒]×20[サンプル]×3[軸]=5,184,000バイトのセンシングデータではなく、24[時間]×60[分]=1440バイトのゼロクロスデータを送信すればよいため、ネットワーク105のデータ通信速度が遅い環境においてもネットワーク105への負荷が少なく、同等の効果を得ることが可能となる。
図29A、図29Bは、第2の実施の形態の生活可視化システムの構成要素を示すブロック図である。腕輪型センサノード1が送信したセンシングデータは、基地局102又はPC203及びネットワーク105を介し、サーバ104の記憶装置2100のセンシングデータテーブル1150に格納される。
PC203には、上記第1の実施形態と同様に各種情報を表示する表示装置1031、及び利用者の操作によって様々な情報の入力を可能とする入力装置1032が接続される。なお、本第2の実施形態では、PC203が実行する処理は、基地局102からセンシングデータを受信した場合にサーバ104へ転送する処理と、サーバ104からウィンドウ、テキスト、描画データ等のコンテンツを受信して表示装置1031に出力する処理と、入力装置1032から受け付けた入力データをサーバ104へ送信する処理とを実行する。PC203は、コンテンツ及び入力データをサーバ104と送受信する処理をウェブブラウザなどで実行することができる。
表示装置1031は、液晶ディスプレイ又はCRTディスプレイ等の表示端末でよく、プリンタ又は画像ファイル出力装置でもよい。入力装置1032は、キーボード、マウス等の入力デバイスである。また、表示装置1031及び入力装置1032は、タッチパネル式ディスプレイのような、両方の機能を備える単体の機器でもよい。
サーバ104は、ネットワークインターフェース1106、プロセッサ1107、メモリ1108及び記憶装置2100を備える。ネットワークインターフェース1106は、ネットワーク105に接続するためのインターフェースである。記憶装置2100は、後述する各種プログラム、各種データテーブルを記録する装置であり、例えば、ハードディスクドライブ、CDーROMドライブ、フラッシュメモリなどである。なお、複数の記憶装置に各種プログラム、各種データテーブルを分割して記録してもよい。
プロセッサ1107は、記憶装置2100に格納されている各種プログラムをメモリ1108に読み出して実行することによって各種機能を実現する。なお、メモリ1108に格納されたプログラムについて、上記第1の実施形態のPC103と同一のものには同一の符号を付して、重複した説明を省略する。
具体的には、データ集計プログラム200を実行することによって、利用者の腕の加速度センサ6で測定されたセンシングデータを集計し、単位時間(例えば、1分間)毎の集計値を算出し、記憶装置2100の集計データテーブル250に格納する。また、睡眠分析プログラム300を実行することによって、算出した単位時間毎の集計値を解析し、全ての睡眠状態を検知し、検知された睡眠状態を記憶装置2100の睡眠分析データテーブル350に格納する。
また、ユーザ認証プログラム800を実行することによって、PC203の表示装置1031にユーザ認証GUI画面80000を表示し、入力装置1032の操作によってPC203を操作する利用者のユーザIDとパスワードの入力を受けて、ユーザ管理テーブル850と照合することによってPC203の利用者を認証し、利用者を識別するための識別子及びセッションIDを発行し、セッションIDとユーザIDとの対応をセッションIDテーブル860に格納する。また、発行したセッションIDをPC203に送信することによって、次回以降の通信時にPC203が自らの通信を識別することを可能とする。
また、上記ユーザ認証プログラムの終了を起因として、コンテンツ選択プログラム801を実行することによって、PC203から発行されたセッションIDを取得し、該セッションIDに対応する利用者が閲覧を許可されているコンテンツのみを選択可能とするコンテンツ選択ウィンドウ80100(図34参照)を表示装置1031に表示する。
コンテンツ選択ウィンドウ80100は、PC203の利用者に許可された各コンテンツを選択するGUIコントロールを具備し、コンテンツ選択ウィンドウ80100上での入力装置1032の操作を受けて、生活データ表示ウィンドウ1200、一日サマリデータ表示ウィンドウ90000、歩数ランクウィンドウ91000、睡眠入力ウィンドウ92000などを表示する。
生活データ表示ウィンドウ1200、表示設定取得プログラム400、表示データ描画プログラム500、コメント入力プログラム600、コメント入力テーブル650、位置固有表示領域テーブル700の構成及び動作は、第1の実施形態と同一のため、それらの説明を省略する。
また、サーバ104は、上記コンテンツ選択ウィンドウ80100への操作を起因として、1日サマリデータ表示ウィンドウ90000をPC203に出力し、一日サマリデータ描画プログラム900を実行することによって、1日の活動データを俯瞰するために効果的な表示画面を表示装置1031に表示し、利用者に提示する。
また、サーバ104は、上記コンテンツ選択ウィンドウ80100への操作を起因として、歩数ランクウィンドウ91000をPC203に出力し、歩数ランク描画プログラム910を実行することによって、ユーザが他のユーザと比べたその日の累積歩数の推移を把握するために効果的な表示画面を表示装置1031に表示し、利用者に提示する。
また、サーバ104は、上記コンテンツ選択ウィンドウ80100への操作を起因として、睡眠入力ウィンドウ92000をPC203に出力し、睡眠入力プログラム920を実行することによって、上記睡眠分析プログラム300が生成した睡眠データを利用者が自らの活動データを見ながら修正することを可能とする表示画面を表示装置1031に表示し、利用者に提示する。
なお、以下では、サーバ104が、データ集計プログラム200と睡眠分析プログラム300を、定期的な周期又は腕時計型センサノード1からのセンシングデータの受信を起因として、実行し、更に、PC203の入力装置1032からの入力操作を起因として、ユーザ認証プログラム800、コンテンツ選択プログラム801、表示データ描画プログラム500、一日サマリデータ描画プログラム900、歩数ランク描画プログラム910及び睡眠入力プログラム920を実行する例について説明する。
図30は、サーバ104のユーザ認証プログラム800の実行による処理に関するGUI画面であるユーザ認証ウィンドウ80000を表す。
ユーザ認証プログラム800の動作の概要をGUIの観点から説明する。ユーザ認証プログラム800の実行を起因として、PC203の表示装置1031にユーザ認証ウィンドウ80000が表示される。PC203で、例えば、ウェブブラウザが実行され、ウェブブラウザ上にユーザ認証ウィンドウ80000を表示することができる。
ユーザ認証プログラム800は、入力装置1032を介した、PC203のウェブブラウザ上のユーザIDテキストボックス80001へ入力されたユーザIDを取得し、パスワードテキストボックス80002へ入力されたパスワードを取得する。この時、図30に図示されるように、パスワードテキストボックス80002への入力は、現在入力されている文字列が隠蔽されるよう、ブラウザ画面への表示上は各文字が「*」等の他の文字で置き換えられることが好ましい。ユーザ認証プログラム800は、マウスによる確認ボタン80004のマウスによるクリック操作等を起因として、PC203のウェブブラウザ上に入力されたユーザID及びパスワードをネットワーク105を経由して取得し、後述する認証確認ステップにおける認証が成功した場合、ユーザ認証ウィンドウ80000を非表示にして、後述するコンテンツ選択プログラム810を実行する。また、前記認証が失敗した場合、「ユーザID・パスワードが間違っています」などのメッセージを、図示しないダイアログボックスなどに表示する。
図31は、サーバ104のユーザ認証プログラム800の実行による処理の一例を示すフローチャートである。
本実施形態においては、これらの処理がPC203の表示装置1031上のユーザ承認ウィンドウ80000に対する入力装置1032の操作によって実行される例を示すが、入力装置1032から入力される設定に代わって、当該設定がプログラムによって外部から変更できる設定ファイルに書き込まれたり、設定値がプログラム内に直接書き込まれてもよい。
まず、ステップS8001では、サーバ104は、上記したユーザ認証ウィンドウ80000をPC203に送信し、PC203の入力装置1032による操作を受け付け、入力されたユーザID及びパスワードを受信する。
ステップS8002では、サーバ104は、ユーザ認証ウィンドウ80000の確認ボタン80004にマウスのクリック操作がされたことを、ネットワーク105を介してPC203から受信し、入力されたユーザID及びパスワードを取得する。
ステップS8003では、サーバ104は、上記取得したパスワードの文字列を暗号化する。暗号化とは、任意の関数を用いて、文字列を演算することによって、違う文字列に変換する作業であり、ここで用いる関数は、二つの性質:非可逆性(暗号化された文字列から暗号化される前の文字列を推定することが困難であるという性質)と、非衝突性(違う二つのパスワードが暗号化後に同じ文字列になる可能性が少ないという性質)の両方を有することが好ましい。このステップでは公知の手法を用いればよく、例えばMD5(Kaliski B、 Robshaw M; Message Authentication with MD5)などが知られている。
ステップS8004では、サーバ104は、上記取得したユーザIDと、暗号化後のパスワードを認証する。サーバ104は、後述するユーザ管理テーブル850を参照し、上記取得したユーザIDと暗号化後パスワードを、ユーザID851とパスワード853に持つエントリが存在すれば認証成功と判定し、存在しなければ認証失敗と判定する。認証失敗と判定した場合は、その旨をダイアログボックスなどの手段によって利用者のPC203に通知し、再度ユーザ認証ウィンドウ80000への操作を受け付ける状態にする。認証が成功した場合はステップS8005に移行する。
ステップS8005では、サーバ104はユーザID毎に予め関連づけられた、短期(数十分~数時間)の間だけ有効なセッションIDを発行する。セッションIDは、発行時には、後述するセッションIDテーブル860に重複するセッションIDを含むエントリが存在しない文字列であることが必要であり、乱数により生成された長い(例えば、60文字程度)文字列であることが好ましい。セッションIDの発行時には、該利用者を特定するユーザIDと、発行日時と共にセッションIDテーブル860に記録される。これ以降のサーバ104との通信において、PC203は、発行されたセッションIDを毎回送信することによって、PC203から送信されるデータが正規の通信であることを証明する。サーバ104は、PC203との通信において、パスワードではなくセッションIDを用いることによって、通信のたびにパスワードを送信する危険性を低減させる効果がある。また、上記セッションIDの発行日時から所定の時間(数十分~数時間)が経過した後、該セッションIDを用いた通信は無効として扱うことによって、通信の安全性が確保できる効果がある。本ステップでは、発行されたセッションIDを、ユーザID、発行日時とともにセッションIDテーブル860に格納し、セッションIDをPC203に返信する。
ステップS8006では、サーバ104が、後述するコンテンツ選択プログラム801を実行し、上記発行されたセッションIDをコンテンツ選択プログラムに渡し、同時にユーザ認証ウィンドウ80000を表示装置1031上で非表示にさせる指令をPC203に送信する。
図32は、ユーザ管理テーブル850のフォーマットの例を示す説明図である。
ユーザ管理テーブル850において、腕輪型センサノード1の装着者の識別子を格納するユーザID851と、装着者が属する後述のグループの識別子を格納するグループID852と、暗号化されたパスワードを格納するパスワード853とから、一つのエントリが構成される。ユーザ管理テーブル850は、図示しない外部プログラムによりエントリが追加されてもよい。
図33は、セッションIDテーブル860のフォーマットの例を示す説明図である。
セッションIDテーブル860において、上記したセッションIDを格納するセッションID861と、セッションIDが発行された対象である腕輪型センサノード1の装着者の識別子を格納するユーザID861と、セッションIDが発行された日時を格納する発行日時862とから、一つのエントリが構成される。本実施の形態では、発行日時から所定の時間が経過した後にエントリが無効化されるため、図示しないプログラムによって、発行日時から所定の時間以上が経過したエントリを定期的に削除してもよい。
図34は、サーバ104のコンテンツ選択プログラム801の実行による処理に関するGUI画面であるコンテンツ選択ウィンドウ80100の例を示す説明図である。
コンテンツ選択プログラム801の動作の概要をGUIの観点から説明する。コンテンツ選択プログラム801の実行を起因としてコンテンツ選択ウィンドウ80100がPC203の表示装置1031に表示される。この表示装置1031は、例えば、液晶ディスプレイによって構成され、コンテンツ選択ウィンドウ80100がウェブブラウザ上に表示されることが好ましい。
コンテンツ選択プログラム801は、上記ユーザ認証プログラム800から送られたセッションIDを利用し、後述する設定に基づき、該PC203を利用するユーザが許可される全てのコンテンツを表すコンテンツ選択ボタンをコンテンツ選択エリア80101に表示させる指令を送信する。
図34ではコンテンツ選択エリア80101に、「一日サマリ」、「歩数ランク」、「睡眠入力」及び「生活表示」の四つのコンテンツを選択するボタン80102~80105が表示されている例を示す。コンテンツ選択プログラム801はこれらのボタン80102~80105に対するクリック操作をPC203から受信すると、選択されたボタン80102~80105に対応するコンテンツをコンテンツ表示領域80107で表示させる指令をPC203に送信する。
図34では、生活データ表示ウィンドウ1200がコンテンツ表示領域80107に表示されている例を示す。生活データ表示ウィンドウ1200は、コンテンツ選択プログラム801が生活表示ボタン80105のクリック操作をPC203から受信すると、サーバ104が生活データ表示ウィンドウ1200をコンテンツ表示領域80107表示するためのコンテンツ(表示指令)をPC203に送信し、PC203の表示装置1031内のコンテンツ表示領域80107で、生活データ表示ウィンドウ1200が表示される。なお、コンテンツ表示領域80107は、表示装置1031上に表示するコンテンツ選択ウィンドウ80100内で、コンテンツ選択エリア80101を除く領域である。
コンテンツ選択プログラム801が一日サマリボタン80102のクリック操作をPC203から受信すると、サーバ104は、一日サマリデータ表示ウィンドウ90000をコンテンツ表示領域80107に表示するためのコンテンツ(表示指令)をPC203に送信する。
コンテンツ選択プログラム801が歩数ランクボタン80103のクリック操作をPC203から受信すると、サーバ104は、歩数ランクウィンドウ91000をコンテンツ表示領域80107に表示するためのコンテンツ(表示指令)をPC203に送信する。
コンテンツ選択プログラム801が睡眠入力ボタン80104のクリック操作をPC203から受信すると、サーバ104は、睡眠入力ウィンドウ92000をコンテンツ表示領域80107に表示するためのコンテンツ(表示指令)をPC203に送信する。
図35は、サーバ104のコンテンツ選択プログラム801の実行による処理の例を示すフローチャートである。
まず、ステップS8011では、サーバ104は、上記したユーザ認証プログラム800から該ユーザに対して発行されたセッションIDを取得する。
ステップS8012では、サーバ104は、取得したセッションIDを含む有効なエントリをセッションIDテーブル860から取得する。有効なエントリとは、発行日時862が現時点から所定の時間以内であるエントリである。サーバ104は、取得できるエントリが無い場合、ユーザ認証プログラム800を実行してもよい。一方、サーバ104は取得できるエントリがある場合、該エントリに含まれるユーザIDを取得し、後述する表示コンテンツ管理テーブル870でユーザIDを含む全てのエントリを検索する。これらのエントリに含まれるコンテンツIDが、該ユーザに許可されたコンテンツIDである。例えば、図34で示された例では、「一日サマリ」、「歩数ランク」、「睡眠入力」、「生活表示」の四つのコンテンツを表す四つのエントリが選択可能である。
ステップS8013では、サーバ104は、上記したコンテンツ選択ウィンドウ80100のコンテンツを送信し、PC203で表示装置1031に表示させる。更に、サーバ104は、上記取得した、ユーザに許可されたコンテンツに対応したコンテンツ選択ボタンの内容をコンテンツ選択エリア80101に含めることによって、図34で示したような画面をPC203の表示装置1031に表示させる。
サーバ104は、コンテンツ選択ウィンドウ80100のコンテンツ選択ボタンのうちクリック操作がされたボタンを受信し、当該ボタンに対応するコンテンツをPC203に送信して表示装置1031のコンテンツ表示領域80107に表示させる。ここで、コンテンツを表示するとは、PC203がサーバ104からコンテンツを受信し、コンテンツ選択ウィンドウ80100内で表示ウィンドウ(例えば、一日サマリデータ表示ウィンドウ90000)をコンテンツ表示領域80107に表示し、更にサーバ104は、コンテンツを描画するプログラム(例えば、一日サマリデータ描画プログラム900)を実行し、該セッションIDをPC203に送ることを意味する。
図36は、コンテンツ管理テーブル870のフォーマットの例を示す説明図である。
コンテンツ管理テーブル870において、PC203のユーザの識別子を格納するユーザID871と、該ユーザに対して許可されたコンテンツの識別子を格納するコンテンツID872とから、一つのエントリが構成される。なお、コンテンツ管理テーブル870は、図示しない外部のプログラムによりエントリの追加、編集、削除が行われることが好ましい。
図37は、サーバ104の一日サマリデータ描画プログラム900の実行にによる処理に関するGUI画面である一日サマリデータ表示ウィンドウ90000の例を示す説明図である。
一日サマリデータ描画プログラム900の動作の概要をGUIの観点から説明する。コンテンツ選択プログラム801が上記したコンテンツ選択ウィンドウ80100の一日サマリボタン80102へのクリック操作をPC203から受信すると、サーバ104は、一日サマリデータ描画プログラム900を実行し、一日サマリデータウィンドウ9000に表示するためのコンテンツ(表示指令)をPC203に送信する。PC203は、表示装置1031のコンテンツ選択ウィンドウ80100のコンテンツ表示領域80107にサーバ104から受信した一日サマリデータ表示ウィンドウ90000を表示する。
一日サマリデータ描画プログラム900は、日付選択コントロール90001又は分解能選択ラジオボタン90002への操作をPC203から受信すると、日付選択コントロール90001で指定された一日のデータについて、分解能ラジオボタン90002で指定された分解能で活動量・運動グラフ90003、及びXYZ平均グラフ90004をPC203へ送信し、表示装置1031に表示させる。
日付選択コントロール90001は、選択されている日付を中央のテキストボックスに表示し、左矢印ボタンのクリッ操作クに起因して選択されている日付の前日を選択し、右矢印ボタンのクリック操作に起因して選択されている日付の次の日を選択する。また、中央のテキストボックスへのキーボードからの直接の入力によって日付が選択されてもよい。日付を選択する何れの方法においても新たな日付が選択されたことに起因して、サマリデータ描画プログラム900は、活動量・温度グラフ90003、XYZ平均グラフ90004を再描画する。
分解能選択ラジオボタン90002は、グラフに描画されるデータの分解能を表し、図示されるように「2分」から「15分」のうちの何れかの分解能が選べることが好ましい。
活動量・温度グラフ90003は、横軸に時刻、縦軸に運動頻度を表すバーグラフであり、「2分」から「15分」の分解能で表すため、一日の活動量の推移を視認するための効果的な可視化方法である。図示されるように、センサノード1で測定された温度が折れ線グラフで表示されてもよい。また、歩行数が1以上である時刻に関しては色を濃くして表示することによって、歩行期間を視認しやすくできる。
XYZ平均グラフ90004は、横軸に時刻、縦軸に、その時刻のX軸、Y軸、Z軸センサの、設定された分解能による局所的な平均値を表すグラフであり、X軸、Y軸、Z軸がそれぞれ赤、緑、青などのように互いに区別が可能な色で表示されていることが好ましい。例えば、腕輪型センサノード1が左腕に装着されている場合、キーボードを打っている等のデスクワーク作業中はZ軸(青)が高い値になりやすく、歩行中はY軸(緑)が高い値になりやすいなど、行動に応じてX軸、Y軸、Z軸の値の局所的な平均値には特色がある。このため、活動量・温度グラフと合わせて表示することによって、利用者が自らの行動を把握しやすくなる効果がある。
また、図示した実施の形態では、活動量・温度グラフ90003は運動頻度を表すグラフであるが、運動強度、歩行数を代わりに表してもよい。また、運動強度グラフ、歩行数グラフが合わせて表示されていてもよい。
図38は、サーバ104の一日サマリデータ描画プログラム900の実行による処理の例を示すフローチャートである。
まず、ステップS9001では、サーバ104は、上記したコンテンツ選択プログラム801から送られたセッションIDを取得し、取得したセッションIDを含む有効なエントリをセッションIDテーブル860から取得する。有効なエントリとは、発行日時862が現時点から所定の時間以内であるエントリである。取得できるエントリが無い場合、ユーザ認証プログラム800を実行してもよい。取得できるエントリがある場合、該エントリに含まれるユーザIDを取得する。
ステップS9002では、サーバ104は、PC203より日付選択コントロール90001で選択されている日付を対象日として取得する。
ステップS9003では、サーバ104は、PC203より分解能ラジオボタン90002で選択されている分解能を表示分解能として取得する。
ステップS9004では、サーバ104は、指定された対象日と、表示分解能に応じて活動量・運動グラフ90003、XYZ平均グラフ90004を構成するコンテンツを集計データから生成し、PC203へ送信する。ステップS9005では、PC203は、受信したコンテンツを、表示装置1031のコンテンツ表示領域80107の一日サマリデータ表示ウィンドウ90000に出力する。
サマリデータ描画プログラム900は、ユーザID251が上記取得したユーザIDであり、測定日時253が対象日に含まれる全てのエントリを、集計データテーブル250から取得し、指定された表示分解能に対応する時間幅毎に運動頻度の平均値、最大値、最小値、最尤値の何れかを当該時間幅の代表値として算出し、バーグラフのコンテンツを生成する。この時、バーグラフの縦軸の最小値は0に固定されていることが好ましく、また、最大値も350等の値に固定されていることが好ましい。集計データに含まれる値の大小にかかわらず縦軸のスケールを固定することにより、日毎の活動量の違いを視覚的に把握しやすくなる効果がある。
更に、上記取得した集計データテーブル250に含まれる、図示しないX軸平均値、Y軸平均値、Z軸平均値を取得する。これらの平均値は、データ集計プログラム200において、所定の時間毎のX軸センサの値、Y軸センサの値、Z軸センサの値について各軸の平均値を算出し、集計データテーブル250のエントリに格納したものである。サマリデータ描画プログラム900は、指定された表示分解能毎に運動頻度の平均値、最大値、最小値、最尤値の何れかをその時刻(時間幅)の代表値として算出し、線グラフのコンテンツを生成する。この時、線グラフの縦軸の最小値は-4G、最大値は4G等の値に固定されることによって、0Gがグラフの中央に表示されることが好ましい。
図39は、サーバ104の歩行ランク描画プログラム910の実行による処理に関するGUI画面である歩行ランクウィンドウ91000の例を示す説明図である。
歩行ランク描画プログラム910の動作の概要をGUIの観点から説明する。上記コンテンツ選択ウィンドウ80100の歩数ランクボタン80103のクリック操作をPC203から受信すると、サーバ104は、歩行ランク描画プログラム910を実行し、歩行ランクのコンテンツを生成し、生成した歩行ランクのコンテンツをPC203に送信する。PC203は、表示装置1031のコンテンツ選択ウィンドウ80100内のコンテンツ表示領域80107に歩行ランクウィンドウ91000を表示する。
歩行ランク描画プログラム910は、サーバ104に収集された複数の利用者のセンシングデータを集計し、指定された日付の所定の時刻(例えば、3時)以降の総歩数を利用者ごとに算出し、上位5ユーザと、コンテンツ選択プログラム910から送られたセッションIDによって示されるユーザについて、所定の時刻(3時)以降、現時点までの累計歩数の推移を「2分」から「16分」までの何れかの分解能で算出し、歩数グラフ91001のコンテンツを生成する。この時、各線グラフが表す利用者のユーザ名を図示しないユーザ名管理テーブルから取得し、名前ラベル領域91002に表示するとよい。
図40は、サーバ104の歩数ランク描画プログラム910の実行による処理の例を示すフローチャートである。
まず、ステップS9101では、サーバ104は、上記コンテンツ選択プログラム801から送られたセッションIDを取得し、取得したセッションIDを含む有効なエントリをセッションIDテーブル860から取得する。有効なエントリとは、発行日時862が現日時から所定の時間以内であるエントリである。取得できるエントリが無い場合、ユーザ認証プログラム800を実行してもよい。取得できるエントリがある場合、該エントリに含まれるユーザIDを「表示ユーザ」として取得する。
ステップS9102では、サーバ104は、取得したセンシングデータのうち、現日時の累計歩数のトップ5名のユーザIDを取得する。まず、現時刻が指定時刻(例えば、3時)以降ならば今日を「表示日」とし、指定時刻(3時)前であるなら前日を「表示日」とし、表示日の3時を「開始時刻」とする。
サーバ104は、集計データテーブル250から、測定日時253が開始時刻以降である全てのエントリを取得し、各ユーザID毎に歩行数257の合計を算出する。算出した合計歩数のうち、上位5件、及びステップS9101で取得した表示ユーザの、計6名(上位5件に表示ユーザが含まれる場合は5件)を、表示ユーザ群として取得する。
ステップS9103では、表示ユーザ群に含まれる各ユーザ毎に、集計データテーブル250に含まれる、ユーザID251が該ユーザIDであり、かつ、測定日時253が開始時刻以降である全てのエントリを測定日時順に取得し、所定の分解能毎に、開始時刻以降の総歩数を算出し、該ユーザの累積歩数データとして確定する。
ステップS9104では、サーバ104は表示ユーザ群に含まれる各ユーザ毎に、上記確定した累積歩数データを歩数グラフ91001に線グラフのコンテンツとして生成する。この時、トップであるユーザは金色、二位であるユーザは銀色、三位であるユーザは銅色、表示ユーザは赤色にて表示してもよい。また、各線グラフの元となったユーザを識別する文字列を名前ラベル領域91002に表示してもよい。以上のように、歩数グラフによると、自らがどのような日を送ったか、一日に沢山歩く人はどのような生活を送るか、を視覚的に把握することができ、競争心を刺激することによって歩行を促す効果がある。
本実施形態では、該ユーザ以外にトップ5人のユーザの情報を取得し表示する例を示したが、トップ3人の情報を表示しもよいし、トップユーザと最下位のユーザの情報を表示してもよいし、該ユーザより一つランクが上のユーザの情報を表示してもよい。また、過去の所定の日数の各日の累計歩数推移によって、該ユーザと累計歩数が交わる回数が一番多いユーザを該ユーザの「ライバル」と仮定し、「ライバル」の情報のみを表示してもよい。また、該ユーザが属するグループに含まれるユーザの情報のみを表示してもよい。
図41は、サーバ104の睡眠入力プログラム920の実行による処理に関するGUI画面である睡眠入力ウィンドウ92000の例を示す説明図である。
睡眠入力プログラム920の動作の概要をGUIの観点から説明する。サーバ104は、上記コンテンツ選択ウィンドウ80100の睡眠入力ボタン80104へのクリック操作をPC203から受信すると、睡眠入力プログラム920を実行し、睡眠入力ウィンドウ92000を生成し、生成した睡眠入力ウィンドウ92000をPC203へ送信し、PC203は、表示装置1031のコンテンツ選択ウィンドウ80100内のコンテンツ表示領域80107に睡眠入力ウィンドウ92000を表示する。
睡眠入力ウィンドウ92000は、腕輪型センサノード1の利用者は上記睡眠分析プログラム300が算出した利用者の睡眠期間を閲覧、編集することを可能とする。
図41は、サーバ104で自動生成された睡眠期間を閲覧している状態を表す画面の例である。
日付選択コントロール92003は、選択されている日付を中央のテキストボックスに表示し、左矢印ボタンのクリック操作に起因して選択されている日付の前日を選択し、右矢印ボタンのクリック操作に起因して選択されている日付の次の日を選択する。また、中央のテキストボックスへのキーボードからの直接の入力によって日付が選択されてもよい。日付を選択する何れの方法においても新たな日付が選択されたことに起因して、睡眠入力プログラム920は、再描画(コンテンツの再生成)をする。睡眠入力においては、選択された日の前日の15時から、当日15時までの24時間を表示期間とすることによって、多くの場合、睡眠期間が区切られることなく表示できる。
シーン表示領域92001は、表示期間におけるシーンを色分けして表示する。シーンとは、同じ行動が続く期間である。行動とは、例えば歩行や安静など、センサノード1から判別できる活動の種別である。シーンの抽出は、例えば、特願2008-321728等に開示された方法と同様に行うことができ、腕輪型センサノード1が取得した加速度データから「安静」、「軽作業」、「作業」、「運動」、「静止」、「歩行」のシーンを抽出することができる。
図41に表される表示例では、15時から18時まで続く「安静」のシーンは、該ユーザが15時から18時まで安静状態にあり、18時から19時半まで続く「歩行」シーンは、該ユーザが18時から19時半頃まで歩行状態にあることを表している。
更に、睡眠入力プログラム920は、表示期間に含まれ、該ユーザの全ての睡眠期間を、睡眠分析データテーブル350から取得し、取得した睡眠期間を睡眠領域92002として強調表示する。睡眠領域92002は、領域の右下などの視認しやすい位置に「主睡眠:22:10~05:20」等のように、該睡眠期間の睡眠の種類354を表す文字列と、睡眠の開始時刻352と終了時刻353が表示されていることが好ましい。更に、睡眠分析データテーブル350に、睡眠期間を生成した発生源(即ち、睡眠分析による「自動」生成か、睡眠入力ウィンドウによる「手動」入力か)を各エントリ毎に保存している場合、この情報を付記してもよい。
睡眠入力ウィンドウ92000では、これら各シーンがクリック操作の対象となっており、利用者はシーンにクリック操作をすることによって、簡便に一日の睡眠期間を編集することが可能となる。
図42A、図42Bは、睡眠入力ウィンドウ92000での睡眠の新規追加、削除の操作を説明するための図である。
図42Aは、編集前の睡眠入力ウィンドウ92000の状態を表している。ここでは22:10から02:50まで続く睡眠期間が一件表示されている。ここで、利用者は03:20から05:50頃まで続く静止シーンを、入力装置1032からクリック操作をすることによって選択し、図42Bに示すように、新たな睡眠期間92004を追加することが可能となる。この追加された睡眠期間92004は、該ユーザのユーザID、この静止期間の開始時刻、終了時刻を持つ新たなエントリとして睡眠分析データテーブル350に追加される。また、これとは逆に、即ち、睡眠期間として登録されているシーンに再度クリック操作をすることによって、睡眠期間を削除することも可能である。
図43A、図43Bは、睡眠入力ウィンドウ92000での睡眠の結合、分離処理を説明するための図である。
図43Aは、編集前の画面の状態を表している。図43Aでは、22:10から02:50まで続く睡眠期間92002と、03:20から05:50まで続く睡眠期間92004の二件の睡眠が表示されている。PC203の利用者は、02:50から03:20まで続く「安静」シーン92005を入力装置1032からクリック操作をすることによって選択し、図43Bで示すように、二つの睡眠期間を結合し、一つの22:10から05:50まで続く睡眠期間92006に変えることができる。また、図43Aで下の睡眠期間92004が無かった場合、即ち22:10~02:50の睡眠期間92002しかなかった場合においても、該「安静」シーン90005をクリック操作をすることによって睡眠時間が継ぎ足され、22:10から03:20迄の睡眠期間が生成される。また、これとは逆に、即ち、睡眠期間に含まれるシーンにクリック操作をすることによって、睡眠期間を分割又はは短縮することが可能である。
図44は、サーバ104の睡眠入力プログラム920の実行による処理の一例を示すフローチャートである。
まず、ステップS9201では、サーバ104は、上記したコンテンツ選択プログラム801から渡されたセッションIDを取得し、取得したセッションIDを含む有効なエントリをセッションIDテーブル860から取得する。有効なエントリとは、発行日時862が現時点から所定の時間以内であるエントリである。取得できるエントリが無い場合、ユーザ認証プログラム800を実行してもよい。取得できるエントリがある場合、該エントリに含まれるユーザIDを「表示ユーザ」として取得する。
ステップS9202では、日付選択コントロール92003で選択された日を「表示日」として取得し、表示日の前日の15時から、当日15時までの24時間を表示期間に設定する。
ステップS9203では、サーバ104は、図示しないシーンテーブルから、表示ユーザ(表示データに対応する利用者)の、表示期間に含まれる全てのシーンを取得する。シーンは、開始時刻、終了時刻、ユーザID及び行動内容の四つの情報を含み、表示ユーザのシーンとは、シーンのユーザIDが表示ユーザであることを意味し、表示期間に含まれるとは、表示期間の終了時刻がシーンの開始時刻より後であり、又は、表示期間の開始時刻がシーンの終了時刻より前であることを意味する。また、行動内容は「安静」、「軽作業」、「作業」、「運動」、「静止」、「歩行」の一つである。取得したシーンは、互いに重複しないことが好ましい。
ステップS9204では、サーバ104は、ユーザID351が表示ユーザであり、かつ、睡眠期間が表示期間に重なる全てのエントリを、睡眠分析データテーブル350から取得する。取得した睡眠期間を睡眠群として、メモリ1108又は記憶装置2100の図示しない一時記憶領域等に保持する。また、編集によって生じた新たな睡眠期間を一時的に保管する新規睡眠群、編集によって変更される睡眠期間を一時的に保管する変更対象睡眠群、及び、編集によって削除される睡眠期間を一時的に保管する削除対象睡眠群を保持する領域を一時記憶領域等に確保する。
ステップS9205では、サーバ104は、睡眠入力ウィンドウ92000のコンテンツを生成して、生成されたコンテンツをPC203へ送信する。PC203は、表示装置1031に睡眠入力ウィンドウ92000を描画する。図41に図示されるように、ウィンドウ内に収まるような時刻を縦軸に定義し、横軸はウィンドウの巾に応じて定義する。
サーバ104は、睡眠期間を示すシーンを、シーンの開始時刻から終了時刻まで、図示しない行動内容の表示色を定義するテーブルに従って、行動内容を表す色で描画するようPC203へ指令する。この時、表示色は行動中の活動量に応じて寒色から暖色が使われることが好ましい。例えば、静止中は青(寒色系)、運動中は赤(暖色系)を用いて描画することによって行動内容が視認しやすくなる。また、描画したシーンの所定の位置、例えば、左上にシーンの行動内容を表す文字列を描画する。更に、サーバ104は、PC203に睡眠群を描画する。PC203は、各睡眠期間の開始時刻及び終了時刻を縦軸に合わせて、各睡眠期間92002を前記描画したシーンの上に描画する。この時、描画色を半透明又は透明で領域のボーダーを濃い色にすることによって、睡眠期間を視認しやすくし、同時に下に描画されているシーンの色も視認しやすくできる。また、睡眠期間は、シーンよりも所定のピクセル数左右に伸びていることによって、睡眠期間がより視認しやすくできる。また、描画した睡眠期間の所定の位置(例えば、右下)に睡眠期間に関する情報を表す文字列を描画する。例えば、睡眠期間の睡眠の種類(例えば、主睡眠か、うたた寝か)を描画し、また開始時刻及び終了時刻を表す文字列を描画する。更に、睡眠データテーブル350が睡眠期間を生成した手段を保管する領域を有する場合、生成手段を表す文字列を描画してもよい。また、描画した睡眠期間に対応するボタンを設け、このボタンへのクリック操作を起因として、図示しない睡眠の質を問う睡眠アンケートを表示させ、睡眠期間に対応づけて保管してもよい。
ステップS9206では、PC203の利用者によるシーンのクリック操作を起因として、サーバ104は、睡眠群を編集する。編集には、追加、削除、結合、分離の4種類がある。以下にそれぞれの処理が実行される条件と、処理の内容を説明する。
追加処理は、クリック操作の対象となったシーンが、睡眠群に含まれるいずれの睡眠期間とも重ならず、更にシーンの終了時刻がいずれの睡眠期間の開始時刻ではなく、シーンの開始時刻がいずれの睡眠期間の終了時刻ではない場合に実行される。追加処理は、開始時刻がシーンの開始時刻であり、終了時刻がシーンの終了時刻である睡眠期間を生成し、生成された睡眠期間を睡眠群に追加する。更に、追加処理は、上記生成された睡眠期間を、新規に睡眠群に追加する。更に、追加処理は、睡眠群に含まれる全ての睡眠期間のうち、最長の睡眠の「睡眠の種類」を主睡眠に設定し、その他をうたた寝に設定する。この時、追加処理は、元々主睡眠からうたた寝に変更された睡眠期間を変更対象睡眠群に追加する。また、追加処理は、元々うたた寝から主睡眠に変更された睡眠期間を変更対象睡眠群に追加する。
削除処理は、クリック操作がされたシーンについて、睡眠群に含まれる睡眠期間に含まれ、シーンの開始時刻が睡眠の開始時刻であり、かつ、シーンの終了時刻が睡眠の終了時刻であるような睡眠が存在する場合に実行される。削除処理は、該睡眠期間を睡眠群から削除し、削除対象睡眠期間群に追加する。更に、削除処理は、睡眠群に含まれる全ての睡眠期間のうち、最長の睡眠の「睡眠の種類」を主睡眠に設定し、その他をうたた寝に設定する。この時、削除処理は、元々主睡眠からうたた寝に変更された睡眠期間を変更対象睡眠群に追加する。また、削除処理は、元々うたた寝から主睡眠に変更された睡眠期間を変更対象睡眠群に追加する。
結合処理は、クリック操作がされたシーンが、睡眠群に含まれるいずれの睡眠期間とも重ならず、更に睡眠群に含まれる睡眠期間のうち、シーンの開始時刻が睡眠の終了時刻であるか、又は、シーンの終了時刻が睡眠の開始時刻である場合に実行される。この場合、該シーンは最大で二つの(即ち、開始時刻と終了時刻の両方において)睡眠期間と接触し得る。接触するシーンが一つの場合は、結合処理は、接触する睡眠期間が該シーンを含むように、開始時刻又は終了時刻を変更し、該睡眠期間を変更対象睡眠群に追加する。二つのシーンと接触する場合、結合処理は、終了時刻が遅い睡眠期間を睡眠群から削除し、削除対象睡眠群に追加し、終了時刻が早い睡眠期間の睡眠期間の終了時刻を、終了時刻が遅い睡眠期間の終了時刻に設定し、変更対象睡眠期間群に追加する。更に、結合処理は、睡眠群に含まれる全ての睡眠期間のうち、最長の睡眠の「睡眠の種類」を主睡眠に設定し、その他をうたた寝に設定する。この時、結合処理は、元々主睡眠からうたた寝に変更された睡眠期間を変更対象睡眠群に追加する。また、結合処理は、元々うたた寝から主睡眠に変更された睡眠期間を変更対象睡眠群に追加する。
分離処理は、前述した処理以外の場合、即ちクリック操作がされたシーンが、睡眠群に含まれる睡眠期間のいずれかに含まれ、かつ、シーンの開始時刻は睡眠期間の開始時刻と異なる、又は、シーンの終了時刻が睡眠期間の終了時刻と異なる場合に実行される。もし睡眠期間の開始時刻がシーンの開始時刻と同じである場合、分離処理は、睡眠期間の開始時刻をシーンの終了時刻に設定し、該睡眠期間を変更対象睡眠群に追加する。また、分離処理は、もし睡眠期間の終了時刻がシーンの終了時刻と同じである場合、睡眠期間の終了時刻をシーンの開始時刻に設定し、該睡眠期間を変更対象群に追加する。また、それ以外の場合、分離処理は、新たに、シーンの終了時刻を開始時刻に持ち、該睡眠期間の終了時刻を終了時刻に持つ睡眠期間を生成し、この新たな睡眠期間を睡眠群及び新規睡眠期間群に追加し、更に元の睡眠期間の終了時刻をシーンの開始時刻に設定し、変更対象睡眠群に追加する。更に、分離処理は、睡眠群に含まれる全ての睡眠期間のうち、最長の睡眠の「睡眠の種類」を主睡眠に設定し、その他をうたた寝に設定する。この時、分離処理は、元々主睡眠からうたた寝に変更された睡眠期間を変更対象睡眠群に追加する。また、分離処理は、元々うたた寝から主睡眠に変更された睡眠期間を変更対象睡眠群に追加する。
ステップS9208では、PC203の利用者の操作が日付選択コントロール92003や、画面を閉じる操作、または図示しない「確定」ボタンへのクリック操作であることを示す通知をサーバ104が受信した場合、ステップS9209へ進み、そうでない場合には、ステップS9205へ戻って上記処理を繰り返す。
ステップS9209では、サーバ104は、一時ストレージに保持している新規睡眠群、変更対象睡眠群、及び削除対象睡眠群を、記憶装置2100の睡眠分析データテーブル350に書き込む。即ち、新規睡眠群に含まれる全ての睡眠を睡眠分析データテーブル350に追加する。この時、睡眠分析データテーブル350に睡眠期間を生成した手段(図示省略)を保管する領域を有する場合、追加される睡眠期間を生成した手段を「睡眠入力」に設定する。更に、変更対象睡眠群に含まれる全ての睡眠を睡眠分析データテーブル350上で更新する。この時、睡眠分析データテーブル350が睡眠期間を生成した手段を保管する領域を有する場合、更新される睡眠期間を生成した手段を「睡眠入力」に設定する。更に、削除対象睡眠群に含まれる全ての睡眠を睡眠分析データテーブル350から削除する。
以上の処理によって、PC203の利用者は簡便に自らの生活の活動を振り返りながら睡眠期間を記録することができるため、アンケート用紙に記録したり、自動的な睡眠判定のみを利用した場合と比較して、精度よく、利用者の負担少なく、睡眠期間を取得することが可能となる。
また、上記第2の実施形態では、表示装置1031のウィンドウ上に一日の全ての表示期間が表示される例を説明したが、前記第1実施形態の図45Bと同様に、例えばマウスのスクロールホイールに対する操作を受け付けることによって、マウスカーソル付近のデータをズームして表示してもよい。
以上、本発明を添付の図面を参照して詳細に説明したが、本発明はこのような具体的構成に限定されるものではなく、添付した請求の範囲の趣旨内における様々な変更及び同等の構成を含むものである。
以上のように、本発明は生体情報を収集して、人の長期間の行動記録を表示装置上で可視化する計算機または計算機システムに適用することができる。
Claims (20)
- 人体に装着されて生体情報を測定するセンサを有し、前記測定された生体情報と該生体情報が測定された日時とを含むセンシングデータを送信するセンサノードと、
プロセッサ、記憶部及びインターフェースを有し、前記センサノードに接続されて前記センシングデータを受信し、前記受信したセンシングデータを前記記憶部に格納し、前記格納されたセンシングデータから生活データを算出する計算機と、を備えた生活可視化システムにおいて、
前記計算機は、
前記格納されたセンシングデータを所定の時間間隔で集計して、前記センサノードを装着した人の行動に関する時系列の集計データを生成する集計部と、
生活データが出力される期間と、前記出力される各生活データの時間幅を示す分解能とを受ける設定取得部と、
前記受けた期間内の集計データについて、前記分解能が示す時間幅毎に前記集計データの代表値を算出することによって、生活データを生成する生活データ生成部と、
前記生活データの値に応じて、前記生活データを色データに変換する色データ変換部と、を有し、
前記分解能は、2分から16分までの間の予め設定された時間幅に設定され、
前記集計部は、前記センシングデータを集計する前記所定の時間間隔を、前記分解能の最小値未満に設定することを特徴とする生活可視化システム。 - 請求項1に記載の生活可視化システムであって、
前記センサは、前記生体情報として加速度を測定する加速度センサであって、
前記集計部は、前記センシングデータに含まれる加速度から運動量相当値を算出して、前記時系列の集計データを生成し、
前記生活データ生成部は、前記期間内の集計データの運動量相当値の代表値を算出して、生活データの値を設定し、
前記色データ変換部は、前記生活データの値に応じて、予め設定された色データを選択することを特徴とする生活可視化システム。 - 請求項2に記載の生活可視化システムであって、
前記分解能として設定された2分から16分の時間幅は、前記運動量相当値の自己相関の値が半減するまでの範囲に設定することを特徴とする生活可視化システム。 - 請求項1に記載の生活可視化システムであって、
前記色データ変換部は、前記生活データの値が大きいほど色データに暖色を設定し、前記生活データの値が小さいほど色データに寒色を設定することを特徴とする生活可視化システム。 - 請求項1に記載の生活可視化システムであって、
前記センサは、前記生体情報として加速度を測定する加速度センサと、前記生体情報として温度を測定する温度センサとを含み、
前記集計部は、
前記温度が所定の体温判別閾値未満である集計データを、前記センサノードの非装着状態と判定し、
前記センシングデータに加速度が観測されない集計データを、前記センシングデータの欠損状態と判定し、
前記色データ変換部は、前記非装着状態又は前記センシングデータの欠損状態と判定された集計データを、他の状態と区別可能な予め設定した色データに変換することを特徴とする生活可視化システム。 - 請求項1に記載の生活可視化システムであって、
前記計算機は、前記色データ変換部によって変換される色データによって表される領域を表示装置に表示する描画データを生成する描画部をさらに有し、
前記集計部は、前記生体情報が測定された日時に基づいて前記集計データの日時を設定し、
前記生活データ生成部は、前記設定された集計データの日時に基づいて生活データの日時を設定し、
前記描画部は、前記色データ変換部から出力される色データによって表される領域を、前記設定された生活データの日時の順に並べて表示する描画データを生成することを特徴とする生活可視化システム。 - 請求項6に記載の生活可視化システムであって、
前記計算機は、前記色データに付加されるテキストが入力されるコメント入力部をさらに有し、
前記コメント入力部は、前記色データに付加されるテキスト、及び当該テキストを付加するテキスト表示期間の入力を受けて、
前記描画部は、前記色データに加えて、前記コメント入力部に入力されたテキスト表示期間の色データに対応する位置に前記付加されるテキストを配置した描画データを生成することを特徴とする生活可視化システム。 - 請求項6に記載の生活可視化システムであって、
前記計算機は、前記表示装置に出力する色データによって表される領域の拡大または縮小の指令を受ける入力部をさらに有し、
前記描画部は、
前記表示装置の表示画面の水平方向に時間軸を設定し、前記表示画面の垂直方向に日付軸を設定し、
前記入力部が拡大または縮小の指令を受けた場合、前記日付軸方向で、前記色データによって表される領域を、前記指令された拡大または縮小をして表示する描画データを生成することを特徴とする生活可視化システム。 - 請求項6に記載の生活可視化システムであって、
前記計算機は、前記表示装置に出力する色データによって表される領域の拡大若しくは縮小の指令、または、前記表示装置の表示画面上のカーソル位置の指定を受ける入力部をさらに有し、
前記描画部は、
前記表示画面の水平方向に時間軸を設定し、前記表示画面の垂直方向に日付軸を設定し、
前記入力部が拡大または縮小の指令を受けた場合、前記指定されたカーソル位置から所定の範囲内の日の前記色データによって表される領域を、前記日付軸方向に、前記指令された拡大または縮小をして表示する描画データを生成することを特徴とする生活可視化システム。 - 請求項6に記載の生活可視化システムであって、
前記計算機は、前記表示装置に出力する色データによって表される領域の拡大若しくは縮小の指令、または、前記表示装置の表示画面上のカーソル位置の指定を受ける入力部をさらに有し、
前記描画部は、
前記表示画面の水平方向に時間軸を設定し、前記表示画面の垂直方向に日付軸を設定し、
前記入力部が拡大または縮小の指令を受けた場合、最新の日付から所定の範囲内の日の前記色データによって表される領域を、前記日付軸方向に、前記指令された拡大または縮小をして表示する描画データを生成することを特徴とする生活可視化システム。 - 請求項6に記載の生活可視化システムであって、
前記設定取得部は、前記出力する生活データの日付及び時間の範囲を受け、
前記描画部は、前記日付と時刻の時系列で色データによって表される領域を、前記設定取得部が受けた時間の範囲で、前記表示装置の表示画面の水平方向に前記時系列に配置し、前記設定取得部が受けた日付の範囲で、前記表示装置の垂直方向に前記時系列に配置して、前記色データによって表される領域を表示する描画データを生成することを特徴とする生活可視化システム。 - 請求項6に記載の生活可視化システムであって、
前記計算機は、前記集計データから睡眠状態を検出し、前記検出された睡眠状態の集計データに睡眠状態を示す情報を付加する睡眠状態推定部をさらに有し、
前記描画部は、前記表示装置の表示画面の水平方向に時間軸を設定し、前記時間軸の起点を前記睡眠状態が終了した時刻に設定し、当該起点から時系列で前記色データによって示される領域を配置することを特徴とする生活可視化システム。 - 請求項6に記載の生活可視化システムであって、
前記計算機は、前記集計データから所定の運動状態を検出し、前記検出された運動状態の集計データに運動状態を示す情報を付加する運動状態推定部をさらに有し、
前記描画部は、前記日付と時刻の時系列で色データによって表される領域に、前記運動状態を付加して、予め設定したパターンで表示するための描画データを生成することを特徴とする生活可視化システム。 - 請求項13に記載の生活可視化システムであって、
前記運動状態推定部は、前記所定の運動状態として走行状態及び走行ピッチを検出し、
前記描画部は、前記日付と時刻の時系列で色データによって表される領域に、前記検出された走行ピッチのグラフを重畳して表示する描画データを生成することを特徴とする生活可視化システム。 - プロセッサ、記憶部及びインターフェースを備え、人体に装着されて生体情報を測定するセンサノードから前記生体情報と該生体情報が測定された日時とを含むセンシングデータを受信し、前記受信したセンシングデータを前記記憶部に格納し、前記格納されたセンシングデータから生活データを算出するサーバにおいて、
前記格納されたセンシングデータを所定の時間間隔で集計して、前記センサノードを装着した人の行動に関する時系列の集計データを生成する集計部と、
生活データが出力される期間と、前記出力される各生活データの時間幅を示す分解能とを受ける設定取得部と、
前記受けた期間内の集計データについて、前記分解能が示す時間幅毎に前記集計データの代表値を算出することによって、生活データを生成する生活データ生成部と、
前記生活データの値に応じて、前記生活データを色データに変換する色データ変換部と、を備え、
前記分解能は、2分から16分までの間の予め設定された時間幅に設定され、
前記集計部は、前記センシングデータを集計する前記所定の時間間隔を、前記分解能の最小値未満に設定することを特徴とするサーバ。 - 請求項15に記載のサーバであって、
前記センシングデータは生体情報として加速度を含み、
前記集計部は、前記センシングデータに含まれる加速度から運動量相当値を算出して、前記時系列の集計データを生成し、
前記生活データ生成部は、前記期間内の集計データの運動量相当値の代表値を算出して、生活データの値を設定し、
前記色データ変換部は、前記生活データの値に応じて、予め設定された色データを選択することを特徴とするサーバ。 - 請求項15に記載のサーバであって、
前記色データ変換部によって変換される色データによって表される領域を表示装置に表示する描画データを生成する描画部をさらに備え、
前記集計部は、前記生体情報が測定された日時に基づいて前記集計データの日時を設定し、
前記生活データ生成部は、前記設定された集計データの日時に基づいて生活データの日時を設定し、
前記描画部は、前記色データ変換部から出力される色データによって表される領域を、前記設定された生活データの日時の順に並べて表示する描画データを生成することを特徴とするサーバ。 - プロセッサと記憶部及びインターフェースを有し、人体に装着されて生体情報を測定するセンサノードから前記生体情報と該生体情報が測定された日時とを含むセンシングデータを受信し、前記受診したセンシングデータを前記記憶部に格納し、前記格納されたセンシングデータから生活データを算出する計算機において、前記生活データを処理する方法であって、
前記計算機が、前記記憶部に格納されたセンシングデータを所定の時間間隔で集計して、前記センサノードを装着した人の行動に関する時系列の集計データを生成する第1のステップと、
前記計算機が、生活データが出力される期間と、前記出力される各生活データの時間幅を示す分解能とを受ける第2のステップと、
前記計算機が、前記受けた期間内の集計データについて、前記分解能が示す時間幅毎に前記集計データの代表値を算出することによって、生活データを生成する第3のステップと、
前記計算機が、前記生活データの値に応じて、前記生活データを色データに変換する第4のステップと、を含み、
前記分解能は、2分から16分までの間の予め設定された時間幅に設定され、
前記第1のステップでは、前記センシングデータを集計する前記所定の時間間隔を、前記分解能の最小値未満に設定することを特徴とする生活データの処理方法。 - 請求項18に記載の生活データの処理方法であって、
前記センシングデータは生体情報として加速度を含み、
前記第1のステップでは、前記センシングデータに含まれる加速度から運動量相当値を算出して、前記時系列の集計データを生成し、
前記第3のステップでは、前記期間内の集計データの運動量相当値の代表値を算出して、生活データの値を設定し、
前記第4のステップでは、前記生活データの値に応じて、予め設定された色データを選択することを特徴とする生活データの処理方法。 - 請求項18に記載の生活データの処理方法であって、
前記計算機が、前記変換された色データによって表される領域を表示装置に表示する描画データを生成する第5のステップをさらに含み、
前記第1のステップでは、前記生体情報が測定された日時に基づいて前記集計データの日時を設定し、
前記第3のステップでは、前記設定された集計データの日時に基づいて生活データの日時を設定し、
前記第5のステップでは、前記変換された色データによって表される領域を、前記設定された生活データの日時の順に並べて表示する描画データを生成することを特徴とする生活データの処理方法。
Priority Applications (1)
| Application Number | Priority Date | Filing Date | Title |
|---|---|---|---|
| JP2012524502A JP5361018B2 (ja) | 2010-07-16 | 2011-06-16 | 生活可視化システム、サーバ及び生活データの処理方法 |
Applications Claiming Priority (2)
| Application Number | Priority Date | Filing Date | Title |
|---|---|---|---|
| JP2010-161432 | 2010-07-16 | ||
| JP2010161432 | 2010-07-16 |
Publications (1)
| Publication Number | Publication Date |
|---|---|
| WO2012008264A1 true WO2012008264A1 (ja) | 2012-01-19 |
Family
ID=45469274
Family Applications (1)
| Application Number | Title | Priority Date | Filing Date |
|---|---|---|---|
| PCT/JP2011/063782 Ceased WO2012008264A1 (ja) | 2010-07-16 | 2011-06-16 | 生活可視化システム、サーバ及び生活データの処理方法 |
Country Status (2)
| Country | Link |
|---|---|
| JP (1) | JP5361018B2 (ja) |
| WO (1) | WO2012008264A1 (ja) |
Cited By (18)
| Publication number | Priority date | Publication date | Assignee | Title |
|---|---|---|---|---|
| JP2015016193A (ja) * | 2013-07-12 | 2015-01-29 | 株式会社タニタ | 監視システム、及び、活動量計 |
| JP2015073809A (ja) * | 2013-10-11 | 2015-04-20 | セイコーエプソン株式会社 | 計測情報管理システム、計測装置、情報機器、計測情報管理方法、および計測情報管理プログラム |
| JP2015084913A (ja) * | 2013-10-30 | 2015-05-07 | ソフトバンクモバイル株式会社 | プログラムおよび表示制御装置 |
| JP2015084853A (ja) * | 2013-10-29 | 2015-05-07 | パイオニア株式会社 | 信号処理装置及び方法、並びにコンピュータプログラム及び記録媒体 |
| JP2015093123A (ja) * | 2013-11-13 | 2015-05-18 | 株式会社Jvcケンウッド | 送信装置、受信装置、情報解析システム、情報解析方法 |
| WO2015072237A1 (ja) * | 2013-11-13 | 2015-05-21 | 株式会社Jvcケンウッド | 情報解析システム |
| JP2015531188A (ja) * | 2013-12-13 | 2015-10-29 | ▲華▼▲為▼終端有限公司Huawei Device Co., Ltd. | データ伝送デバイス及びデータ伝送システム |
| JP2016144627A (ja) * | 2015-01-29 | 2016-08-12 | パラマウントベッド株式会社 | 生体情報出力装置、生体情報出力方法及びプログラム |
| JP2017016704A (ja) * | 2016-10-07 | 2017-01-19 | ソニー株式会社 | 情報処理装置、情報処理方法およびコンピュータプログラム |
| JP2018015315A (ja) * | 2016-07-28 | 2018-02-01 | 富士通株式会社 | 活動量処理装置、活動量処理方法、及び、活動量処理プログラム |
| US9949649B2 (en) | 2013-10-11 | 2018-04-24 | Seiko Epson Corporation | Biological information measurement device |
| CN110892441A (zh) * | 2017-07-19 | 2020-03-17 | 三菱电机株式会社 | 行动可视化装置和行动可视化方法 |
| WO2020136592A1 (ja) * | 2018-12-28 | 2020-07-02 | 南紀之 | 情報処理装置、情報処理方法、情報処理プログラム、および情報処理システム |
| US10740057B2 (en) | 2011-06-13 | 2020-08-11 | Sony Corporation | Information processing device, information processing method, and computer program |
| JP2020140570A (ja) * | 2019-02-28 | 2020-09-03 | パナソニックIpマネジメント株式会社 | 睡眠教育システム、睡眠教育方法及びプログラム |
| CN112602120A (zh) * | 2018-09-14 | 2021-04-02 | 株式会社小松制作所 | 再现装置、分析支援系统及再现方法 |
| CN114126498A (zh) * | 2019-07-22 | 2022-03-01 | 麦克赛尔株式会社 | 检测装置和检测方法 |
| WO2025027708A1 (ja) | 2023-07-28 | 2025-02-06 | 株式会社Fuji | 生活行動表示装置 |
Families Citing this family (3)
| Publication number | Priority date | Publication date | Assignee | Title |
|---|---|---|---|---|
| JP5969266B2 (ja) * | 2012-05-23 | 2016-08-17 | Kddi株式会社 | データ処理プログラム、画像表示システムおよびデータ処理方法 |
| US10206618B2 (en) * | 2015-02-17 | 2019-02-19 | Microsoft Technology Licensing, Llc | Optimized visibility for sleep sessions over time |
| JP2016168067A (ja) * | 2015-03-11 | 2016-09-23 | 日本光電工業株式会社 | 管理装置、遠隔健康管理システム、及びプログラム |
Citations (3)
| Publication number | Priority date | Publication date | Assignee | Title |
|---|---|---|---|---|
| JP2001087247A (ja) * | 1999-09-27 | 2001-04-03 | Matsushita Electric Works Ltd | 身体活動判別方法及びその装置 |
| JP2007190306A (ja) * | 2006-01-23 | 2007-08-02 | Hitachi Ltd | 生活見守りシステム |
| JP2010148829A (ja) * | 2008-12-26 | 2010-07-08 | Hitachi Ltd | 計算機システム |
-
2011
- 2011-06-16 JP JP2012524502A patent/JP5361018B2/ja not_active Expired - Fee Related
- 2011-06-16 WO PCT/JP2011/063782 patent/WO2012008264A1/ja not_active Ceased
Patent Citations (3)
| Publication number | Priority date | Publication date | Assignee | Title |
|---|---|---|---|---|
| JP2001087247A (ja) * | 1999-09-27 | 2001-04-03 | Matsushita Electric Works Ltd | 身体活動判別方法及びその装置 |
| JP2007190306A (ja) * | 2006-01-23 | 2007-08-02 | Hitachi Ltd | 生活見守りシステム |
| JP2010148829A (ja) * | 2008-12-26 | 2010-07-08 | Hitachi Ltd | 計算機システム |
Cited By (24)
| Publication number | Priority date | Publication date | Assignee | Title |
|---|---|---|---|---|
| US10740057B2 (en) | 2011-06-13 | 2020-08-11 | Sony Corporation | Information processing device, information processing method, and computer program |
| JP2015016193A (ja) * | 2013-07-12 | 2015-01-29 | 株式会社タニタ | 監視システム、及び、活動量計 |
| US9949649B2 (en) | 2013-10-11 | 2018-04-24 | Seiko Epson Corporation | Biological information measurement device |
| JP2015073809A (ja) * | 2013-10-11 | 2015-04-20 | セイコーエプソン株式会社 | 計測情報管理システム、計測装置、情報機器、計測情報管理方法、および計測情報管理プログラム |
| US10085675B2 (en) | 2013-10-11 | 2018-10-02 | Seiko Epson Corporation | Measurement information management system, measurement apparatus, information device, measurement information management method, and measurement information management program |
| JP2015084853A (ja) * | 2013-10-29 | 2015-05-07 | パイオニア株式会社 | 信号処理装置及び方法、並びにコンピュータプログラム及び記録媒体 |
| JP2015084913A (ja) * | 2013-10-30 | 2015-05-07 | ソフトバンクモバイル株式会社 | プログラムおよび表示制御装置 |
| JP2015093123A (ja) * | 2013-11-13 | 2015-05-18 | 株式会社Jvcケンウッド | 送信装置、受信装置、情報解析システム、情報解析方法 |
| WO2015072237A1 (ja) * | 2013-11-13 | 2015-05-21 | 株式会社Jvcケンウッド | 情報解析システム |
| US10129846B2 (en) | 2013-11-13 | 2018-11-13 | JVC Kenwood Corporation | Information analysis system for transmitting information that requires timing synchronization |
| JP2015531188A (ja) * | 2013-12-13 | 2015-10-29 | ▲華▼▲為▼終端有限公司Huawei Device Co., Ltd. | データ伝送デバイス及びデータ伝送システム |
| JP2016144627A (ja) * | 2015-01-29 | 2016-08-12 | パラマウントベッド株式会社 | 生体情報出力装置、生体情報出力方法及びプログラム |
| JP2018015315A (ja) * | 2016-07-28 | 2018-02-01 | 富士通株式会社 | 活動量処理装置、活動量処理方法、及び、活動量処理プログラム |
| JP2017016704A (ja) * | 2016-10-07 | 2017-01-19 | ソニー株式会社 | 情報処理装置、情報処理方法およびコンピュータプログラム |
| CN110892441A (zh) * | 2017-07-19 | 2020-03-17 | 三菱电机株式会社 | 行动可视化装置和行动可视化方法 |
| CN112602120A (zh) * | 2018-09-14 | 2021-04-02 | 株式会社小松制作所 | 再现装置、分析支援系统及再现方法 |
| WO2020136592A1 (ja) * | 2018-12-28 | 2020-07-02 | 南紀之 | 情報処理装置、情報処理方法、情報処理プログラム、および情報処理システム |
| JPWO2020136592A1 (ja) * | 2018-12-28 | 2021-12-16 | 南 紀之 | 情報処理装置、情報処理方法、情報処理プログラム、および情報処理システム |
| JP7502195B2 (ja) | 2018-12-28 | 2024-06-18 | 南 紀之 | 情報処理装置、情報処理方法、情報処理プログラム、および情報処理システム |
| JP2020140570A (ja) * | 2019-02-28 | 2020-09-03 | パナソニックIpマネジメント株式会社 | 睡眠教育システム、睡眠教育方法及びプログラム |
| JP7289095B2 (ja) | 2019-02-28 | 2023-06-09 | パナソニックIpマネジメント株式会社 | 睡眠教育システム、睡眠教育方法及びプログラム |
| CN114126498A (zh) * | 2019-07-22 | 2022-03-01 | 麦克赛尔株式会社 | 检测装置和检测方法 |
| CN114126498B (zh) * | 2019-07-22 | 2024-05-17 | 麦克赛尔株式会社 | 检测装置和检测方法 |
| WO2025027708A1 (ja) | 2023-07-28 | 2025-02-06 | 株式会社Fuji | 生活行動表示装置 |
Also Published As
| Publication number | Publication date |
|---|---|
| JP5361018B2 (ja) | 2013-12-04 |
| JPWO2012008264A1 (ja) | 2013-09-09 |
Similar Documents
| Publication | Publication Date | Title |
|---|---|---|
| JP5361018B2 (ja) | 生活可視化システム、サーバ及び生活データの処理方法 | |
| US20220291820A1 (en) | Sedentary Notification Management System for Portable Biometric Devices | |
| US9369365B2 (en) | Tracking user physical activity with multiple devices | |
| US8849610B2 (en) | Tracking user physical activity with multiple devices | |
| CN111081345B (zh) | 身体活动和健身监视器 | |
| US20110137836A1 (en) | Method and system for generating history of behavior | |
| US20170243508A1 (en) | Generation of sedentary time information by activity tracking device | |
| US20150342511A1 (en) | Operating system with color-based health state themes | |
| US20020046062A1 (en) | System for aiding to make medical care schedule and/or record, program storage device and computer data signal embodied in carrier wave | |
| US20140276245A1 (en) | Sleep evaluation device and program for sleep evaluation | |
| JP5767833B2 (ja) | 臥位推定装置、臥位推定システム及び臥位推定方法 | |
| JP5199152B2 (ja) | 行動予測方法及び行動予測システム | |
| JP2010146221A (ja) | 行動記録入力支援システム、行動入力支援方法、及びサーバ | |
| KR20190062148A (ko) | 수면 분석 방법 및 이를 이용한 수면 분석 디바이스 | |
| JP6518105B2 (ja) | 情報管理装置、情報管理方法及び情報管理プログラム | |
| White et al. | A quantified-self framework for exploring and enhancing personal productivity | |
| JP2017074174A (ja) | 生体行動評価装置及び生体行動評価方法 | |
| JP2019058418A (ja) | 睡眠判別プログラム、睡眠判別方法及び睡眠判別システム | |
| JP6667956B2 (ja) | 環境分析システム及び環境分析用プログラム | |
| AU2020102010A4 (en) | PAM-Physical Fitness: PREDICTION OF FITNESS AND PHYSICAL ACTIVITY LEVEL USING MACHINE LEARNING PROGRAMMING | |
| JP6596531B2 (ja) | データ表示システムおよびプログラム | |
| WO2023234317A1 (ja) | 情報処理システム、情報処理方法、プログラム、記録媒体 |
Legal Events
| Date | Code | Title | Description |
|---|---|---|---|
| 121 | Ep: the epo has been informed by wipo that ep was designated in this application |
Ref document number: 11806595 Country of ref document: EP Kind code of ref document: A1 |
|
| WWE | Wipo information: entry into national phase |
Ref document number: 2012524502 Country of ref document: JP |
|
| NENP | Non-entry into the national phase |
Ref country code: DE |
|
| 122 | Ep: pct application non-entry in european phase |
Ref document number: 11806595 Country of ref document: EP Kind code of ref document: A1 |