US9830407B2 - Data centre simulator - Google Patents
Data centre simulator Download PDFInfo
- Publication number
- US9830407B2 US9830407B2 US12/505,464 US50546409A US9830407B2 US 9830407 B2 US9830407 B2 US 9830407B2 US 50546409 A US50546409 A US 50546409A US 9830407 B2 US9830407 B2 US 9830407B2
- Authority
- US
- United States
- Prior art keywords
- data centre
- data
- node
- cost
- simulator
- Prior art date
- Legal status (The legal status is an assumption and is not a legal conclusion. Google has not performed a legal analysis and makes no representation as to the accuracy of the status listed.)
- Active, expires
Links
Images




Classifications
-
- G06F17/5009—
-
- G06F17/5004—
-
- G—PHYSICS
- G06—COMPUTING OR CALCULATING; COUNTING
- G06F—ELECTRIC DIGITAL DATA PROCESSING
- G06F30/00—Computer-aided design [CAD]
- G06F30/10—Geometric CAD
- G06F30/13—Architectural design, e.g. computer-aided architectural design [CAAD] related to design of buildings, bridges, landscapes, production plants or roads
-
- G—PHYSICS
- G06—COMPUTING OR CALCULATING; COUNTING
- G06F—ELECTRIC DIGITAL DATA PROCESSING
- G06F30/00—Computer-aided design [CAD]
- G06F30/20—Design optimisation, verification or simulation
-
- G—PHYSICS
- G06—COMPUTING OR CALCULATING; COUNTING
- G06Q—INFORMATION AND COMMUNICATION TECHNOLOGY [ICT] SPECIALLY ADAPTED FOR ADMINISTRATIVE, COMMERCIAL, FINANCIAL, MANAGERIAL OR SUPERVISORY PURPOSES; SYSTEMS OR METHODS SPECIALLY ADAPTED FOR ADMINISTRATIVE, COMMERCIAL, FINANCIAL, MANAGERIAL OR SUPERVISORY PURPOSES, NOT OTHERWISE PROVIDED FOR
- G06Q10/00—Administration; Management
-
- G—PHYSICS
- G06—COMPUTING OR CALCULATING; COUNTING
- G06F—ELECTRIC DIGITAL DATA PROCESSING
- G06F2113/00—Details relating to the application field
- G06F2113/02—Data centres
-
- G—PHYSICS
- G06—COMPUTING OR CALCULATING; COUNTING
- G06F—ELECTRIC DIGITAL DATA PROCESSING
- G06F2119/00—Details relating to the type or aim of the analysis or the optimisation
- G06F2119/06—Power analysis or power optimisation
-
- G—PHYSICS
- G06—COMPUTING OR CALCULATING; COUNTING
- G06F—ELECTRIC DIGITAL DATA PROCESSING
- G06F2119/00—Details relating to the type or aim of the analysis or the optimisation
- G06F2119/08—Thermal analysis or thermal optimisation
-
- G06F2217/78—
-
- G06F2217/80—
Definitions
- the present invention is concerned with methods and systems for simulating data centres.
- Embodiments of the invention are more specifically concerned with simulations that can determine and/or predict operating parameters of component elements of data centres as well as global operating parameters for a data centre as a whole.
- Operating parameters can include, for example, energy consumption, efficiency (e.g. DCIE) and/or operating costs.
- DCSG BCS Data Centre Specialist Group
- a general proposal of embodiments of the present invention is to provide a data centre simulator that makes it possible to account for the interdependence of a range of internal and external variables that impact the overall system and the component parts of it; implementing a simulation framework and dependencies provides a structure to make this level of analysis reasonable and practical.
- Time dependent variables included in the simulation framework may include: Applied user workload; Number of devices; Device capacity and capacity allocation; Power cost; External environmental conditions; Level of capacity allocation (utilisation); and Facility electrical loads.
- Non-time dependent variables may include: Device efficiency characteristics.
- the approach adopted by some embodiments of the present invention is to create a simulation environment in which all of the major components of the data centre are simulated, from user workload on software through IT equipment, mechanical and electrical systems through to utility energy use.
- This environment allows for the range of external variables that influence efficiency to be applied coherently and in context of their correlation.
- the simulator once set up to represent a facility can cope with very sparse metering data while still providing usefully accurate reporting and billing.
- the primary output of the tool is an analysis of the in use energy of each scenario, this is supported by the secondary output, a post simulation analysis of the basic cost of each scenario to provide the basis for business case justification of a lower energy scenario.
- the cost analysis may be performed within the main simulation rather than as a post simulation analysis.
- the invention is concerned with a simulation of the entire data centre system comprising mechanical, electrical and IT equipment and their interactions with each other and external variables such as temperature.
- existing approaches are restricted to part of the system or effects of specific devices or phenomena and as such do not provide useful answers as they are unable to place their results in the full context of all the variables impacting their behaviour or which are impacted by their behaviour.
- Systems level simulation may include but is not limited to:
- IT device power draw varying with workload, configuration and state
- the simulation approach allows the determination of key data regarding a facility that it would be extremely disruptive or impossible to measure for a working physical data centre. For example the ‘fixed load’ or ‘chronic load’ power drawn by the data centre at any point within simulation time, under any combination of variables such as external climate condition, internal operational and modular provisioning can be determined. This could not be measured in an operational facility as it would require that all IT load be regularly turned off in order to track this value. This enables the simulator to form the basis for effective per device, service or application allocation of cost and energy within the data centre which is not possible using traditional measurement and reporting methods.
- the invention enables systems level simulation capable of representing, handling and returning output for systems with feedback loops.
- Feedback loops can occur in a data centre system, for example an air conditioning unit may draw power from power cabling and distribution equipment that resides within the area the air conditioning unit cools, creating a feedback loop.
- the invention proposes a logical representation of the data centre allowing for simplified data entry to allow the system to be usefully modelled at an acceptable level of data gathering and input.
- This approach may include but is not limited to:
- the invention proposes a method of allocation of data centre capital cost and energy to devices such as IT devices or applied loads such as electrical loads or application workloads that effectively recognises fixed and variable parts of the overall cost and energy use.
- embodiments of this method are able to effectively represent both allocated and utilised capacity at every device in the system, including overheads induced by the interaction of other components.
- Embodiments of this method are also able to effectively represent recurring and non recurring cost components of each device in the infrastructure including capital cost, lease purchase, maintenance costs etc. Costs of other parameters expressed by the user such as space within the data centre occupied by the equipment can also be accounted for if desired.
- the invention proposes a method of allocation of space, cost and energy that factors the level of utilisation of these variables to enable allocation accounting for utilisation. This may, for example, be by:
- each node may be a ‘black box’ within the simulation and need not represent a continuous, monotonic or parameterised function which can be solved by traditional analytical mathematical means. This allows for nodes, for example, which:
- the simulator effectively represents the entire data centre system, it is possible to determine the answers to an arbitrary range of questions and scenarios.
- the simulator can provide a framework for the further development of detailed and specialised component level simulation elements which may then be exercised in the full context of the dependent and driving elements and external factors of the data centre.
- a cooling economiser may be usefully evaluated considering the varying thermal load driven by varying IT workload, the varying cost of power and the varying external temperature through time in both daily and annual cycles.
- Some embodiments provide a framework upon which further analysis and reporting systems may be built or provide a framework upon which advanced control systems which utilise the systems level understanding provided by the simulator.
- a control system may use forecasting or goal seeking in place of crude feedback systems and ‘tuning parameters’ to optimise behaviour to the given target.
- the core simulation of interconnected nodes is wrapped in a series of outer layers of data provision, iteration and analysis. This allows the multiple internal and external variables to be changed together under simulation time for meaningful analysis. Specific subsets of variables can be swept in any combination for analysis such as applied electrical load and external temperature to report infrastructure efficiency over the range of both variables. It also enables, for instance, Monte-Carlo and goal seeking analysis of any variable or set of variables with or without correlation.
- a simulator in accordance with some embodiments is able to report, for example:
- the nodes within the simulation pass data using an extensible data format allowing for much richer data than simply Watts and Cost to be passed and evaluated.
- This data may include:
- the simulator is able to perform a range of energy and cost allocations for the data centre or components within it, including “Fair share allocation” and “True allocation”.
- the simulator In Fair share allocation the simulator is able to represent the ‘fair share’ of the overall energy and cost of the data centre to a specific load, device or group of devices. This takes into account the allocation and draw of energy and the level of utilisation of the data centre. This cost is likely to be used as the basis for an internal charge back metric.
- the simulator In True allocation the simulator is able to represent the specific load, device or group of devices cost and energy consumption taking into account allocation, draw and level of utilisation. This cost is specific to the device or load and represents the actual share of energy, power and cooling chain component loss and cost actually incurred by that specific load or device. This is likely to be used for internal delivery cost analysis.
- ‘true’ and ‘fair share’ costs would be two identical servers in a data centre under identical workload with identical provisioned power and cooling capacity, one of which is supplied with power through a more expensive set of equipment than the other whose power supply equipment is cheaper but has higher energy losses.
- ‘fair share’ analysis the cost of the power delivery equipment and energy losses is averaged across all of the IT load and the two servers would accrue the same energy and cost.
- ‘true’ analysis one server will accrue higher power delivery infrastructure costs but lower energy costs than the other, representing a more realistic analysis of the comparative costs.
- the simulator of some embodiments in a “Marginal allocation” mode, is able to report the marginal energy and cost of an additional load, device or device group in the data centre. This may include capital and operational costs and energy of additional devices where modular infrastructure capacity thresholds are triggered or triggered at a different time in the simulation.
- Some embodiments of methods and simulation systems in accordance with aspects of the present invention are capable of capacity analysis.
- the simulator can know the rated capacity of each device group at each node as well as the rated capacities of the devices within the nodes and their operating mechanism the simulator is capable of:
- Embodiments can also be used for decision support by utilising the varied modes of cost and energy analysis to provide substantial business information, if necessary in real time when connected to monitoring and asset database systems to support decisions on:
- Embodiments can also be used for billing applications.
- the detailed financial analysis available from the simulator can provide a fair and justifiable basis for billing of data centre services as well as performing analysis on the differences between the operators cost and their revenue under varying customer behaviours and varying external factors such as the cost of energy or carbon.
- the invention provides a simulator that is capable of representing multiple path connections with varied splitter logic. This may be used to represent, for example:
- FIG. 1 illustrates the IT power delivery path and losses in a typical data centre
- FIG. 2 shows the change with IT load of data centre input power required to deliver power to a 1 MW IT electrical load
- FIG. 3 shows the change in data centre efficiency as IT electrical load increases from zero to full load
- FIG. 4 shows data centre efficiency against IT load under a modular provisioning scenario
- FIG. 5 shows a plot of DCIE by IT electrical load and external temperature
- FIG. 6 illustrates the scope of the simulator coverage for an embodiment of the present invention and the variability in the operating parameters of a data centre that the simulator can account for;
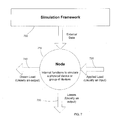
- FIG. 7 schematically illustrates an individual node of the simulation environment of an embodiment of the invention
- FIG. 8 illustrates the way in which multiple nodes of different types can be connected to one another in a simulation of a data centre
- FIG. 9 shows device nodes connected to simulate the power delivery chain of a data centre, the power transfer being illustrated with solid lines;
- FIG. 10 shows device nodes connected to simulate the thermal chain a data centre, the thermal flows being shown in chain link lines;
- FIG. 11 shows the device nodes, power delivery connections and thermal connections of FIGS. 9 and 10 merged
- FIG. 12 is a representation of a simple, single data hall data centre
- FIG. 13 is a model of an IT device used in the simulation of an embodiment of the invention.
- FIG. 14 shows the relationship between server workload, server power draw (solid block) and server efficiency (line);
- FIG. 15 illustrates the manner in which the simulation models IT electrical load other than the IT device(s) being analysed, in order that the IT device is analysed in an operational context
- FIG. 16 illustrates the integration of the IT device and IT electrical model of FIG. 15 into the model of the combined power and thermal chains of FIG. 11 ;
- FIG. 17 is a plot of IT device fixed and variable power drawn against IT workload
- FIG. 18 shows the simulation model of FIG. 16 with additional nodes and connections to enable IT device fixed and variable energy allocation
- FIG. 19 shows the simulation model of FIG. 18 with additional nodes and connections to enable full energy and cost allocation
- FIG. 20 shows the simulation model of FIG. 19 with additional nodes and connections to enable full energy cost allocation with utilisation compensation
- FIG. 21 is a schematic illustration of the software structure of an embodiment of the simulator.
- FIG. 22 is a schematic illustration of the software structure of another embodiment of the simulator.
- FIGS. 23 to 25 are plots of overall IT device cost and energy use for two comparative scenarios.
- FIG. 26 is a comparative plot of overall (data centre) cost and energy usage for the two scenarios.
- the exemplary data centre simulator described below is an analysis tool which operates in two basic modes, data centre infrastructure performance and IT device analysis.
- Tools and metrics for the data centre can be broadly categorised as either reporting or analysis.
- Reporting metrics include the Green Grid DCIE 1 metric of electrical power transfer efficiency. This metric expresses the efficiency with which the data centre mechanical and electrical plant transfers energy from the building supply to the IT equipment. 1 Data Center Infrastructure Efficiency
- the DCIE can be measured either at a single point in time or across a time period.
- a DCIE report for a data centre gives a view of the achieved efficiency under the specific combination of conditions during the measurement period.
- the data centre simulator is such an analysis tool, designed to help provide understanding and answers to these questions.
- the simulator provides insight into both the data centre (building) infrastructure and how this interacts with the IT hardware it supports.
- the first mode of the simulator tool allows the modelling and analysis of the efficiency of the data centre infrastructure, the output from this stage is provided as a DCIE report of the performance as simulated.
- power is supplied to the data centre from, typically, a utility feed 101 .
- This power then passes through a set of electrical power conversion, conditioning and distribution devices 102 on the way to the IT equipment 110 .
- Each of these devices exhibits some inefficiency and some of the power is lost.
- Also consuming power is the mechanical plant of the data centre, mostly the CRAC 2 units 103 and the chiller plant 104 .
- ancillary services 105 such as lighting, fire suppression and generator pre-heaters which also consume power. 2 Computer Room Air Conditioner
- FIG. 2 we show a simplified view of the impact of these losses on the data centre utility input power required to deliver power to a 1 MW IT electrical load.
- the total power demand at full load is around 205% of the IT electrical load.
- the fixed overhead 3 of the data centre mechanical and electrical infrastructure At zero IT electrical load this plant would still draw around 600 kW from the utility. 3 See the BCS paper “Data Centre Efficiency Metrics” for a more detailed exploration of this issue, http://www.bcs.org/datacentreenergy
- DCIE data centre efficiency
- the electrical load and therefore the achieved efficiency of the data centre will vary with time both as IT equipment is installed and changed in the data centre and, with more modem IT equipment, as the applied IT workload changes.
- Virtualisation, grid and MAID 4 technologies are all allowing for large variations in IT electrical load as they are installed into data centres through their ability to allow devices to idle, sleep or turn off when not required. 4 Massive Array of Idle Disks, a RAID system which turns off hard disks when not in use
- An example of complex DCIE variability is a more modern design, modular data centre.
- the data centre mechanical and electrical plant is rolled out in stages.
- the PDU 5 , UPS 6 , CRAC and chiller systems in 200 kW 7 steps of rated IT electrical load to the 1 MW full capacity.
- FIG. 4 we now have a family of DCIE curves.
- the modular deployment provides substantial efficiency improvements in the early stages of the facility operation where the facility is at low utilisation as well as reducing initial capital costs and improving flexibility.
- the fixed overhead of the data centre is reduced at lower rated capacities through the reduced quantities of mechanical and electrical equipment and their reduced losses. This, fixed modular approach is of less value in a facility where the IT equipment can exhibit large variations in electrical load.
- the other major influencing factor on data centre efficiency is the external temperature.
- the efficiency of the data centre cooling systems is influenced by the external temperature into which they are trying to reject energy as heat.
- the efficiency of the data centre varies substantially with external temperature.
- the cost and energy efficiency characteristics of a data centre or forecast the impact of changes to the mechanical and electrical or IT systems it is necessary to understand the variation of efficiency with both IT electrical load and external temperature.
- the data centre simulator has been designed as a framework tool to encompass the full range of factors affecting data centre cost and energy performance.
- the data centre is a complex environment which covers a broad range of technical disciplines, skill sets and frequently organisational roles. This has led to the development of a range of component calculators and discipline specific tools which seek to address the energy and cost issues of a modern data centre.
- the simulator covers the range from the IT workloads applied to the IT devices through the electrical and mechanical systems through to the energy supplies and external climate.
- the data centre plant efficiency is not a constant that can be measured and then used for analysis or comparison of data centres.
- the electrical load applied to the infrastructure by the IT equipment affects the infrastructure efficiency.
- the efficiency of the data centre is also affected by the external temperature which varies with the time of day and season. Whilst much legacy IT equipment drew close to its full power irrespective of load and could be viewed from a mechanical and electrical perspective as little more than expensive resistors once installed in the data centre, modern IT equipment is being designed to exhibit a far stronger connection between the applied IT workload and the electrical power draw. As both the IT workload, driving the IT electrical load and the external temperature vary with the time of day we cannot usefully evaluate the efficiency of the data centre by external temperature without considering the variation in IT electrical load due to IT workload at the same time. The development and implementation of mobile virtual machines leading to real grid computing technologies makes this issue more significant.
- the full system simulator described here captures the variability of each coverage area and provides an operating framework in which simulation models of each component can operate, as part of the full system whilst considering only their direct dependencies.
- the user can specify the external variables such as the cost of power or IT workload by time and the performance of devices such as a UPS by applied load and the simulator will work through the variables and dependencies.
- the basic approach of the simulator is to create a representation of the data centre using a set of nodes which represent the individual devices. This is then evaluated for a single set of input values and the resulting data retained for that step. The simulator then iterates through the steps required to produce the simulation output requested, applying the data provided for the external variables as required.
- each element of the data centre system is represented as an individual node.
- a node contains the logic to simulate that element.
- a node is provided with device performance data and external variables by the simulator. Nodes are connected together in the simulator using defined interfaces.
- the simulator treats each node as a ‘black box’ and is therefore not restricted to simplified continuous functions but is able to incorporate complex, disjoint device behaviours up to and including the simulation of complex control systems.
- the simulator is able to represent feedback loops within the infrastructure that make traditional analysis difficult.
- an air conditioning unit may be powered from a device which is in the area the unit is cooling, as the air conditioning unit handles the thermal load in the area it draws power, this induces further losses in the power supply device, increasing the thermal losses which the air conditioning unit must deal with, increasing the power consumption etc.
- FIG. 7 schematically illustrates an individual node 710 of the simulation environment.
- Each node 710 has three basic connections to other nodes within the modelled structure:
- Each node also has access to any external data it requires to perform its simulation.
- the external data is supplied by the simulation framework 750 . This allows for data which varies with one of the simulation variables such as time.
- a node representing an electrical infrastructure element would have an applied load representing the power drawn by the connected devices, the node would then suffer some level of losses dependent upon the load as defined by the node model and the supplied parameters. These losses would be provided at the losses interface and likely collected as thermal losses to be taken to an air conditioning node. In an electrical node the losses are typically summed with the applied load to provide the drawn load. External data might include the capacity of the devices at the electrical node, the required performance data and any variable dependent data such as the external climate conditions for a chiller plant node for example.
- the nodes used in the data center simulator can be considered to fall into five basic types:
- Electrodes 810 are used to represent elements of the electrical (power delivery) infrastructure of the data centre;
- ‘Thermal nodes’ 820 are used to represent elements of the mechanical (heat removal) infrastructure of the data centre;
- Load nodes 830 are used to apply loads to devices. This includes electrical & thermal loads applied to the infrastructure as well as workloads applied to IT Devices;
- Environment nodes act as a source or sink for thermal emissions of the data centre
- ‘Summing nodes’ 850 are responsible for collating a set of loads, applying a unifying function (possibly the arithmetic sum) and passing the joined loads on to another node. These may also function as splitter nodes and divert varying amounts or proportions of a load to other nodes.
- FIG. 8 illustrates how these various node types might be connected in a data centre simulator.
- the basic element of simulation is the device node.
- Each node represents one instance of a type of device, for example an Uninterruptible Power Supply.
- the node has inputs to provide the performance data for that device as well as the applied load and any other external factors that the device node requires to determine its behaviour such as external temperature for a chiller plant.
- the device node also has at least two outputs, load and loss, typically the electrical power drawn and the heat output. Nodes are not aware of time or any other factors which do not directly impact the node; the simulator is responsible for ensuring that all applied parameters are correct for that step in the simulation.
- the basic device types represented are:
- the nodes are connected within the simulator to represent the energy paths within the data centre.
- the first energy path is the electrical power delivery chain formed by the electrical plant of the data centre. An example of this is shown in FIG. 9 .
- the IT electrical load node 910 which is used by the simulator to apply a load to the data centre.
- This load source is electrically connected to a PDU node 920 .
- the PDU node has a set of data describing the losses it incurs delivering power, the PDU node adds these losses to the power drawn by the IT electrical load node 910 and passes this load on to the UPS 930 , which adds it's losses and so on until we reach the transformer 940 and the overall direct energy use 950 of the data centre electrical system.
- the second major energy path in the data centre infrastructure is the thermal chain formed by the mechanical plant. An example is shown in FIG. 10 .
- thermal loads within the data centre Each of the nodes from the electrical chain that exhibits thermal loss within the cooled area of the data centre is included.
- the IT electrical loads effectively ‘lose’ their entire input power as heat whilst the electrical infrastructure only rejects the node losses as heat.
- These thermal loads are summed and applied to the CRAC units which are responsible for removing the heat from the cooled area of the data centre.
- the CRAC node 1010 has a loss function which expresses the electrical power consumed to deal with a given applied thermal load, this is mostly fan motor power although in a DX or hybrid system this may also be compressor or pump power.
- CRAC unit may also represent the dehumidification losses due to the split between sensible and latent cooling at the working temperatures and humidities as well as the electrical load of re-humidification where necessary. This loss is then added to the thermal load and applied to the chiller plant 1020 .
- the chiller plant node uses both the external temperature 1030 and the applied thermal load to determine its energy consumption.
- the final step in preparing the node model for simulation is to connect the power and thermal chains as shown in FIG. 11 .
- the nodes support feedback loops.
- the CRAC units 1010 may be fed from the UPS power feed creating such a loop where the power drawn by the CRAC units 1010 increases the load on the UPS 930 , thus increasing its losses and the thermal load applied to the CRAC units 1010 , thus their power draw and the load on the UPS etc. Where these loops occur the simulator simply iterates until the loads stabilise and the working result of the system is achieved.
- the data centre efficiency simulation can be performed.
- the output of this is the surface plot of DCIE against both IT electrical load and external temperature.
- the simulator framework sets up at the core simulation of connected nodes, loads the performance data values into those nodes and then sets the first temperature and IT electrical load point as inputs. This produces the first output efficiency data point which is retained.
- the IT electrical load is then increased in steps (e.g. steps of 5%) from 0% up to 100% of the rated IT electrical load. This produces an efficiency against load curve for a single temperature similar to that shown in FIG. 3 calculated for 5% steps in electrical load.
- the simulator framework increments the temperature by a requested step size (e.g. 5° C.) and repeats the sweep of load from 0% to 100% storing the achieved efficiency for this temperature.
- the temperature is incremented until the upper temperature bound of the simulation is reached and the full grid of DCIE by both IT electrical load and external temperature is complete to produce the surface plot as shown in FIG. 5 calculated for 5% electrical load and 5° C. steps.
- the simulator uses layouts which are logical representations of the data centre mechanical and electrical infrastructure. These simplified layouts provide an effective approximation of the performance of the data centre with substantially reduced complexity.
- the simulator core is capable of simulating a very large number of nodes but this provides only limited additional accuracy and becomes very data centre specific.
- FIG. 12 A simple, single data hall data centre is represented in FIG. 12 . This is a simple data centre with UPS protected power for the IT devices and CRAC units only on the data floor. No other area of the data centre is cooled from the main chiller plant.
- the parameters of the individual device are provided, generally the rated capacity and the load loss data. These are then supplemented by information to allow the simulator to understand the operating mode including the resilience levels.
- the UPS node in FIG. 12 the following data might be provided:
- Table 2 shows three examples of how the UPS capacity at this node might be logically represented.
- the simulator is not a data centre reliability and maintainability assessment tool and does not need to understand the resilience approach used, instead the rated capacity of the device group at the node, the number of active devices and the device capacity are sufficient.
- the number, presence or capacity of devices in the data centre and capacity of the overall data centre may vary with time in the simulator to allow for simulation of modular deployment, removal, migration or replacement of IT, Electrical or Mechanical capacity through the operational lifetime of the building.
- the simulator is able to determine the fixed energy consumption overhead of a data centre at any point in time, taking into account external environmental conditions, the configuration and deployment state of the data centre infrastructure and operational management.
- a second mode of the data centre simulator is to perform an IT simulation. Once a data centre scenario has been created the simulator is able to put IT devices into that data centre and simulate the energy and cost impacts of operating those devices across a specified time period. The output of this simulation is a set of energy and cost data representing the IT device and data centre energy consumption, capital and operational costs.
- the key difference in approach is that the simulator is able to take all of the variables that impact the energy use and cost of IT devices in the data centre and provide a vertical view through the IT equipment and data centre stack to provide allocation of the energy use and cost of the IT devices under examination.
- the simulation of an IT device is conceptually simple; an application workload 1320 is applied by the simulator to a node 1310 which represents the IT device(s) being simulated.
- This node 1310 has the application load to power draw function for the IT device(s) under simulation and converts the applied workload into a power draw 1330 and heat output 1340 , as illustrated in FIG. 13 .
- This power draw and heat output are then applied to the simulated data centre infrastructure to determine the actual energy use and cost at the data centre supply of the applied workload on the IT device(s).
- IT devices rarely exhibit constant power efficiency with workload. Much like the data centre infrastructure, the achieved efficiency in terms of IT workload by power consumption falls as the IT workload falls as shown in FIG. 14 .
- the response of the data centre to IT electrical load is not linear, therefore before we can simulate the impact upon the data centre of a specific IT device or group of devices it is necessary to apply the full electrical and thermal load of the other IT equipment in the data centre.
- the simulator nodes for the IT device and the IT electrical load are connected to the power and thermal simulation chains already established for data centre simulation as shown in 16 .
- a key part of the operation of the simulator is the allocation mechanism developed to effectively represent the data centre.
- the simulator is able to determine the share of both load and allocated capacity at each node in the chain, allowing for much more effective cost allocation than the simplistic approaches currently in use. For example if a server is allocated 100 W and is fed by an Uninterruptible Power Supply with 10% losses, this allocation may become 110 W at the main Transformer feeding the server. The same loss factoring takes place for drawn power.
- a core concept of the simulator is that it understands and implements both fixed and variable costs (energy and financial) and how these are incurred by logical or physical devices within the data centre.
- Fixed energy consumption and financial costs such as amortised capital and fixed energy consumption are allocated to devices based upon their allocation of data centre resources.
- Variable energy consumption and financial costs such as energy consumption are allocated to devices based upon their consumption of resources.
- the data centre simulator has established and implemented a set of basic rules to allocate a fair and reasonable share of the data centre energy consumption to the simulated IT devices 8 .
- One basic tenet of these rules is to accrue fixed and variable loads and costs separately.
- These fixed and proportional energy and financial costs for the data centre are directly analogous to the normal finance concepts of fixed and variable cost and we will use them in a similar way to understand the real energy and cost behaviour of the data centre and how that impacts the cost and energy use of operating IT equipment within the data centre. 8 See the BCS whitepaper “Data centre energy efficiency metrics” for a more detailed exploration of fixed and variable energy and cost allocation, http://www.bcs.org/datacentreenergy, the content of which is incorporated herein by reference.
- variable costs might include the energy used by a desktop PC and the telephone bill incurred by the employee whilst working at the desk.
- the simulator is also able to determine the marginal energy use of the data centre due to the IT device energy use, this comprises both the energy used by the IT device itself and the additional energy used by both the power and thermal infrastructure to deliver that power to the device and remove the resulting heat. As before, this includes iteration of loops such as UPS fed CRAC units.
- a sum of the fixed and variable power draw provides a fair and reasonable representation of the total energy cost of the IT device in the data centre.
- FIG. 18 shows additional nodes in the simulator to analyse power provisioning and energy allocation to determine IT device energy usage, based on the chosen simulation options. These additional nodes are a power provisioning node 1810 and an energy allocation node 1820 that calculate an IT device energy use 1830 for given simulation options 1840 .
- the data centre simulator reports both energy consumption and cost for each scenario.
- the simulator includes the capital and maintenance cost of the IT device(s), the capital cost of the data centre facility and the cost of energy supplied to the data centre.
- FIG. 19 shows a further development of the simulator structure to include nodes to calculate an allocation of the energy and facility costs to give the IT device costs.
- an allocation mechanism node 1910 (which has an input of facility capital costs 1915 ) and facility costs node 1920 , in combination with a device energy costs node 1930 (which has an energy costs input 1940 ), are used to calculate IT device costs 1950 .
- the simulator is able to model the costs of the data centre in substantial detail using the same basic structure of nodes, connections and performance data as in the energy analysis. This includes repeated accrual of partial costs where feedback loops exist.
- the simulator is able to ensure that all injected cost is allocated and accounted for.
- Arbitrary expressions of capital and operational cost characteristics may be applied to any node in the data centre; these may be related to the configuration of the device or the applied loads.
- the simulator is able to accrue costs to each node or applied load through the simulated system thus providing detailed and accurate analysis of the cost of delivering all or part of the data centre service.
- the capital cost and annual maintenance cost of the IT device are entered as parameters of the scenario.
- the capital costs are amortised over the specified device lifetime or write-down period whilst the maintenance costs are accrued throughout the duration of the scenario at their frequency of occurrence.
- the capital cost of the data centre mechanical and electrical plant is represented as a cost per Watt of data centre infrastructure. This is amortised over the stated design lifetime or write-down period of the device to provide a time sensitive cost per Watt of infrastructure and then accrued through simulation time based on the power provisioned to the IT devices.
- the capital cost of the remainder of the data centre building may be represented as a cost per unit of usable IT space. This may then be amortised over the stated design lifetime or write-down period of the device to provide a time sensitive cost per unit space of building and then accrued through simulation time based on the space provisioned to the IT devices.
- Energy cost data is used hourly with the device and total energy data to provide energy cost output for the device and the overall facility.
- the simulator is able to vary the allocation and accrual of energy and cost to a device based upon the accounting preferences of the user and the level of utilisation of the data centre. For example, if the amortised capital cost of the data centre infrastructure is £0.10 per Watt month and a server is allocated 1 kW then it would accrue £100 per month in amortised infrastructure cost. If the data centre capacity is only 50% allocated, i.e. it is half empty, this may still be a valid allocation for the user accompanied by 50% of the amortised capital cost shown as unallocated. Alternatively the simulator can compensate for the utilisation of data centre capacity at that point in time, at 50% the server would accrue £200 for that month.
- the simulator is able to allocate the IT device energy and costs in the manner described above.
- Additional node(s), such as the energy allocation node 2010 illustrated in FIG. 20 , can be implemented in the simulator to manage this mode of cost allocation, based on inputs of IT provisioned power 2020 and data centre capacity 2030 .
- the data centre simulations step through a range of applied electrical loads and external temperatures the IT simulation steps through time. This allows the simulator to ensure that the correct value(s) for each of the external variables is applied to each time step. This allows the simulator to provide useful analysis of the impact of devices such as cooling economisers which are most likely to be working overnight when the IT workload and thus power draw may be low and the cost of power at its minimum, conversely, in the middle of the day where external temperature is highest, IT workload and power draw highest and the cost of power high the economiser may not be providing any benefit.
- devices such as cooling economisers which are most likely to be working overnight when the IT workload and thus power draw may be low and the cost of power at its minimum, conversely, in the middle of the day where external temperature is highest, IT workload and power draw highest and the cost of power high the economiser may not be providing any benefit.
- the basic units of time used within the simulator are the day and hour, the simulator by default steps through 24 hours for each day, using the appropriate values from the supplied data and evaluates the state of the data centre, energy consumption and cost for the hour.
- the costs and energy consumption of the hours are summed to provide a set of daily values.
- the default units of time for a simulation are months; the simulator will simulate one full day of each specified type for each month of the simulation and multiply the values to achieve a total cost for the month. Multiple types of day may be specified, for example to account for variability in user workload between weekdays and weekends.
- Embodiments of the simulator are implemented in software executable, for example, on a general purpose computer.
- the software is executed on a server computer accessible remotely over a network via a browser interface.
- the simulator may execute on a server accessible from a client device over the Internet from using an Internet browser application installed on the client device.
- the software can be broadly broken down into five major components, the core simulator, the data formats, the charting module, the Web user interface and an alternative user access interface.
- a web user interface may be used to enable use of the tool without the need to download and install software onto a user machine.
- This UI also provides a mechanism for users to report an implemented carbon saving by reporting the two scenarios describing the saving and the assistance provided by the tool.
- a charting module is used to provide the characteristic stacked bar charts and surface plot representations of the data (as seen in FIGS. 5 and 23 to 26 for example).
- the simulator uses a set of data formats for input and output. There is a relatively small set of data formats which describe the specific performance of each device to the simulator node representing each device, a format for simulation output and a format for description of the data centre layout. These are provided to the simulator as XML schemas as this is a broadly recognised platform independent and portable standard.
- the XML data formats are supported by input/output interfaces and interpreters.
- the Open Source Core Engine is the underlying environment which allows the simulation. This implements the functional environment within which the data centre component nodes operate.
- the Data Centre Components are a set of nodes which represent the individual data centre components in the simulation.
- the Simulation and Results API provides the ability to set up, execute and collect the results of a simulation.
- the Template Functions assist in establishing the simulation model, the Analysis Functions iterate through the parameters of the simulation, varying external variables such as workload and ambient temperature and collating the results.
- an XML interface may be provided to take the place of the calls made by the web UI.
- a full set of data input and output XML formats can be made available. This can take the place, for example, of form entered data in the Web UI.
- the input/output interface is expanded from the web UI version to handle all of these formats. It may be a superset of the web UI capability.
- the data centre logical layout within the simulation is represented by a constructor. This carries the information required to create and connect the Data Centre Components within the Core Engine for simulation. This is a complex process which is supported by a specific XML data format representing the layout. This data format is interpreted by the XML Meta Language Interpreter.
- the simulator can employ a simplified logical layout of the facility (i.e. not incorporating the full complexity of the complete M&E installation). Indeed, the simulation can be implemented with anything from a single node to every component of the data centre dependent on the requirements for the simulation.
- the simulator can be put to use in many and various applications, some examples of which will already be apparent from the discussion above. Some other possible applications are noted below.
- the simulator is capable, through system level simulation, of determining the energy or cost impact of logical devices in the data centre as well as physical.
- the simulator is able to perform a very broad range of ‘what if’ analysis.
- the simulator is able to effectively load test data centre designs before or after construction to validate the provisioned and actual device capacity of the data centre under a range of operational modes including degraded operating modes testing system redundancy.
- the simulator is well suited to operational decision support in situations such as:
- the level of analysis provided by the simulator allows for effective allocation and charge back of workload, device, device group, area or whole data centre costs.
- the simulator facilitates the analysis of data centre energy and cost performance with masking of detailed data where there are multiple parties involved. For example, a data centre operator providing service to an IT equipment operator. In this case the simulator could be used to determine the financial cost and revenue to the data centre operator whilst only showing the IT equipment operator the revenue and allocated utility energy for carbon accounting purposes.
- the simulator can been used to evaluate early stage technology at a pre prototype phase.
- a number of technology development scenarios can be tested against a number of operating data centre scenarios to assess the overall benefits available from the technology. This allows for substantial time and cost acceleration of the technology through the disposal of options which had been considered to be promising prior to systems level analysis.
- the simulator can be used to perform scenario comparison.
- the data centre simulator is able to take all of these variables into account and provide an effective forecast of the benefits of a virtualisation program.
- the first step in the comparison is to create a pre virtualisation scenario as a baseline for comparison.
- the company plans to deploy a further 100 commodity 1U servers under the existing one application per server policy.
- the comparison will be over a 4 year period.
- FIG. 23 shows exemplary results.
- the next step is to create the post virtualisation scenario for comparison of cost and energy.
- Our consolidation will be from the 100 commodity 1U servers down to 15 commodity 4U servers which are of higher specification and cost.
- FIG. 24 shows exemplary results.
- FIG. 25 shows a side by side comparison of the overall IT device(s) cost and energy use. This comparison shows more directly the difference in the scenario output graphs.
- the graphs in FIG. 26 shows the overall costs and energy use of the whole data centre over the simulation period.
- the Amortised Data Centre Capital Cost is the full amortised cost for the facility rather than the part allocated to the IT devices.
- the Other Energy segment on the bar chart represents all of the data centre energy use not allocated to the simulated IT devices.
Landscapes
- Engineering & Computer Science (AREA)
- Physics & Mathematics (AREA)
- Theoretical Computer Science (AREA)
- Geometry (AREA)
- General Physics & Mathematics (AREA)
- Computer Hardware Design (AREA)
- Evolutionary Computation (AREA)
- General Engineering & Computer Science (AREA)
- Pure & Applied Mathematics (AREA)
- Civil Engineering (AREA)
- Structural Engineering (AREA)
- Computational Mathematics (AREA)
- Mathematical Analysis (AREA)
- Mathematical Optimization (AREA)
- Architecture (AREA)
- Business, Economics & Management (AREA)
- Marketing (AREA)
- Tourism & Hospitality (AREA)
- Human Resources & Organizations (AREA)
- Economics (AREA)
- Operations Research (AREA)
- Quality & Reliability (AREA)
- Strategic Management (AREA)
- Entrepreneurship & Innovation (AREA)
- General Business, Economics & Management (AREA)
- Management, Administration, Business Operations System, And Electronic Commerce (AREA)
- Supply And Distribution Of Alternating Current (AREA)
- Test And Diagnosis Of Digital Computers (AREA)
- Electric Propulsion And Braking For Vehicles (AREA)
- Measurement And Recording Of Electrical Phenomena And Electrical Characteristics Of The Living Body (AREA)
Priority Applications (7)
| Application Number | Priority Date | Filing Date | Title |
|---|---|---|---|
| EP10725241A EP2433231A2 (de) | 2009-05-18 | 2010-05-17 | Datenzentralensimulator |
| JP2012511334A JP5649646B2 (ja) | 2009-05-18 | 2010-05-17 | データセンタシミュレータ |
| BRPI1011216A BRPI1011216B8 (pt) | 2009-05-18 | 2010-05-17 | Simulador de centro de dados |
| PCT/GB2010/000994 WO2010133832A2 (en) | 2009-05-18 | 2010-05-17 | Data centre simulator |
| GB1120460.9A GB2482824B (en) | 2009-05-18 | 2010-05-17 | Data centre simulator |
| CN201080032491.8A CN102460442B (zh) | 2009-05-18 | 2010-05-17 | 数据中心模拟器 |
| US15/478,718 US11087041B2 (en) | 2009-05-18 | 2017-04-04 | Data centre simulator |
Applications Claiming Priority (2)
| Application Number | Priority Date | Filing Date | Title |
|---|---|---|---|
| GBGB0908514.3A GB0908514D0 (en) | 2009-05-18 | 2009-05-18 | Data centre simulator |
| GB0908514.3 | 2009-05-18 |
Related Child Applications (1)
| Application Number | Title | Priority Date | Filing Date |
|---|---|---|---|
| US15/478,718 Continuation US11087041B2 (en) | 2009-05-18 | 2017-04-04 | Data centre simulator |
Publications (2)
| Publication Number | Publication Date |
|---|---|
| US20100292976A1 US20100292976A1 (en) | 2010-11-18 |
| US9830407B2 true US9830407B2 (en) | 2017-11-28 |
Family
ID=40834162
Family Applications (2)
| Application Number | Title | Priority Date | Filing Date |
|---|---|---|---|
| US12/505,464 Active 2032-11-17 US9830407B2 (en) | 2009-05-18 | 2009-07-17 | Data centre simulator |
| US15/478,718 Active 2031-07-30 US11087041B2 (en) | 2009-05-18 | 2017-04-04 | Data centre simulator |
Family Applications After (1)
| Application Number | Title | Priority Date | Filing Date |
|---|---|---|---|
| US15/478,718 Active 2031-07-30 US11087041B2 (en) | 2009-05-18 | 2017-04-04 | Data centre simulator |
Country Status (7)
| Country | Link |
|---|---|
| US (2) | US9830407B2 (de) |
| EP (1) | EP2433231A2 (de) |
| JP (1) | JP5649646B2 (de) |
| CN (1) | CN102460442B (de) |
| BR (1) | BRPI1011216B8 (de) |
| GB (2) | GB0908514D0 (de) |
| WO (1) | WO2010133832A2 (de) |
Cited By (1)
| Publication number | Priority date | Publication date | Assignee | Title |
|---|---|---|---|---|
| US10318409B2 (en) * | 2011-06-10 | 2019-06-11 | Microsoft Technology Licensing, Llc | Application development environment for portable electronic devices |
Families Citing this family (40)
| Publication number | Priority date | Publication date | Assignee | Title |
|---|---|---|---|---|
| US8131515B2 (en) * | 2007-11-20 | 2012-03-06 | Hewlett-Packard Development Company, L.P. | Data center synthesis |
| GB0908514D0 (en) | 2009-05-18 | 2009-06-24 | Romonet Ltd | Data centre simulator |
| JP5240132B2 (ja) * | 2009-09-04 | 2013-07-17 | 富士通株式会社 | 熱流体シミュレーション解析装置 |
| US8433547B2 (en) * | 2009-12-03 | 2013-04-30 | Schneider Electric It Corporation | System and method for analyzing nonstandard facility operations within a data center |
| US9360914B2 (en) | 2010-01-12 | 2016-06-07 | Oracle America, Inc. | System and method for controlling energy usage in a server |
| US9703665B1 (en) * | 2010-02-19 | 2017-07-11 | Acuity Holdings, Inc. | Data center design process and system |
| US20120109619A1 (en) * | 2010-10-29 | 2012-05-03 | Daniel Juergen Gmach | Generating a resource management plan for an infrastructure |
| EP2508954A1 (de) * | 2011-04-06 | 2012-10-10 | ABB Technology AG | System und Verfahren zur Konfiguration eines gebündelten Simulationsnetzwerks |
| US8762522B2 (en) * | 2011-04-19 | 2014-06-24 | Cisco Technology | Coordinating data center compute and thermal load based on environmental data forecasts |
| US9295183B2 (en) * | 2011-09-16 | 2016-03-22 | Tata Consultancy Services Limited | Method and system for real time monitoring, prediction, analysis and display of temperatures for effective thermal management in a data center |
| EP2608082A1 (de) * | 2011-12-19 | 2013-06-26 | Fujitsu Limited | Energieflusssimulator und Energieflusssimulationsverfahren |
| US20130204593A1 (en) * | 2012-01-31 | 2013-08-08 | Panduit Corp. | Computational Fluid Dynamics Systems and Methods of Use Thereof |
| CN103106297B (zh) * | 2013-01-14 | 2016-03-09 | 北京特泽热力工程设计有限责任公司 | 热力检查室结构的数据处理方法及其计算机辅助设计系统 |
| US9195400B1 (en) * | 2013-03-15 | 2015-11-24 | Emc Corporation | Snapshot data management for modeling and migration planning of data storage systems |
| US20140324535A1 (en) * | 2013-04-30 | 2014-10-30 | Hewlett-Packard Development Company, L.P. | Power infrastructure sizing and workload management |
| US9691112B2 (en) * | 2013-05-31 | 2017-06-27 | International Business Machines Corporation | Grid-friendly data center |
| US9476108B2 (en) * | 2013-07-26 | 2016-10-25 | Ecolab Usa Inc. | Utilization of temperature heat adsorption skin temperature as scale control reagent driver |
| US10346862B2 (en) | 2013-10-08 | 2019-07-09 | Accenture Global Solutions Limited | Migration system to migrate users to target services |
| WO2015054300A1 (en) * | 2013-10-08 | 2015-04-16 | Accenture Global Services Limited | Service provider network migration |
| US9424084B2 (en) | 2014-05-20 | 2016-08-23 | Sandeep Gupta | Systems, methods, and media for online server workload management |
| CN106483876A (zh) * | 2015-09-02 | 2017-03-08 | 李涛 | 一种新能源数据中心的能量调度架构 |
| US10560325B2 (en) * | 2015-12-16 | 2020-02-11 | At&T Intellectual Property I, L.P. | Method and apparatus for providing a bulk migration tool for a network |
| US9855816B2 (en) * | 2015-12-22 | 2018-01-02 | Uber Technologies, Inc. | Thermal reduction system for an automated vehicle |
| CN107844404A (zh) * | 2016-09-20 | 2018-03-27 | 中国石油化工股份有限公司 | 一种机房用电量展示装置及方法 |
| CN106524550A (zh) * | 2016-12-27 | 2017-03-22 | 广东国得科技发展有限公司 | 一种带自然冷却的集装箱充电装置及冷却方法 |
| US11076509B2 (en) | 2017-01-24 | 2021-07-27 | The Research Foundation for the State University | Control systems and prediction methods for it cooling performance in containment |
| US11430331B2 (en) * | 2017-09-08 | 2022-08-30 | Uatc, Llc | Power and thermal management systems and methods for autonomous vehicles |
| US10831941B2 (en) * | 2017-10-04 | 2020-11-10 | Aditazz, Inc. | Method and system for automating resource selection and building plan layout generation |
| US10996970B2 (en) * | 2017-12-14 | 2021-05-04 | Samsung Electronics Co., Ltd. | Method for data center storage evaluation framework simulation |
| CN108549732B (zh) * | 2017-12-19 | 2021-08-24 | 中南大学 | 基于局部二次加权核主成分回归的辊道窑温度建模方法 |
| US11388835B1 (en) * | 2018-06-27 | 2022-07-12 | Amazon Technologies, Inc. | Placement of custom servers |
| JP2020046840A (ja) * | 2018-09-18 | 2020-03-26 | キヤノン株式会社 | 画像処理装置、情報処理方法及びプログラム |
| DE112019004888T5 (de) * | 2018-09-27 | 2021-06-10 | Amazon Technologies, Inc. | Modulares leistungsverteilungsnetz für rechenzentren |
| SG11202109334PA (en) * | 2019-02-26 | 2021-09-29 | Nautilus True Llc | Data center management systems and methods for compute density efficiency measurements |
| CN110765518A (zh) * | 2019-09-30 | 2020-02-07 | 万翼科技有限公司 | 室内环境模拟方法及相关设备 |
| US11287806B2 (en) | 2020-02-11 | 2022-03-29 | Uatc, Llc | Vehicle computing system cooling systems |
| KR102601686B1 (ko) * | 2021-09-24 | 2023-11-13 | 주식회사 케이티 | 데이터 센터의 전력 품질을 관리하는 서버, 방법 및 컴퓨터 프로그램 |
| US20230117824A1 (en) * | 2021-10-15 | 2023-04-20 | T-Mobile Usa, Inc. | Simulating performance metrics for target systems based on sensor data, such as for use in 5g networks |
| CN113919596A (zh) * | 2021-11-24 | 2022-01-11 | 贵州电网有限责任公司 | 一种主变负载影响因素分类预测方法 |
| CN116594798B (zh) * | 2023-04-19 | 2024-02-20 | 浪潮智慧科技有限公司 | 一种基于巡检机器人的数据中心维护方法、设备及介质 |
Citations (2)
| Publication number | Priority date | Publication date | Assignee | Title |
|---|---|---|---|---|
| JP2002352123A (ja) | 2001-05-24 | 2002-12-06 | Fujitsu Ltd | 超eーマーケットプレースにおける部品選択装置 |
| US20090112522A1 (en) | 2007-10-29 | 2009-04-30 | American Power Conversion Corporation | Electrical efficiency measurement for data centers |
Family Cites Families (7)
| Publication number | Priority date | Publication date | Assignee | Title |
|---|---|---|---|---|
| KR100342514B1 (ko) * | 2000-09-08 | 2002-06-28 | 윤종용 | 사설 인터넷 프로토콜 주소 도메인에서 고유 인터넷프로토콜 주소 사용방법 |
| US20030193777A1 (en) * | 2002-04-16 | 2003-10-16 | Friedrich Richard J. | Data center energy management system |
| JP2005165676A (ja) * | 2003-12-02 | 2005-06-23 | Mitsubishi Heavy Ind Ltd | 施設管理システム及び施設管理方法 |
| US20050283348A1 (en) * | 2004-06-17 | 2005-12-22 | International Business Machines Corporation | Serviceability framework for an autonomic data centre |
| US7633181B2 (en) * | 2005-06-02 | 2009-12-15 | Hewlett-Packard Development Company, L.P. | DC-based data center power architecture |
| JP4724730B2 (ja) * | 2008-04-09 | 2011-07-13 | 株式会社日立製作所 | 情報処理システムの運用管理方法、運用管理プログラム、および運用管理装置、ならびに情報処理システム |
| GB0908514D0 (en) | 2009-05-18 | 2009-06-24 | Romonet Ltd | Data centre simulator |
-
2009
- 2009-05-18 GB GBGB0908514.3A patent/GB0908514D0/en not_active Ceased
- 2009-07-17 US US12/505,464 patent/US9830407B2/en active Active
-
2010
- 2010-05-17 CN CN201080032491.8A patent/CN102460442B/zh active Active
- 2010-05-17 WO PCT/GB2010/000994 patent/WO2010133832A2/en not_active Ceased
- 2010-05-17 EP EP10725241A patent/EP2433231A2/de not_active Withdrawn
- 2010-05-17 GB GB1120460.9A patent/GB2482824B/en active Active
- 2010-05-17 JP JP2012511334A patent/JP5649646B2/ja active Active
- 2010-05-17 BR BRPI1011216A patent/BRPI1011216B8/pt active IP Right Grant
-
2017
- 2017-04-04 US US15/478,718 patent/US11087041B2/en active Active
Patent Citations (3)
| Publication number | Priority date | Publication date | Assignee | Title |
|---|---|---|---|---|
| JP2002352123A (ja) | 2001-05-24 | 2002-12-06 | Fujitsu Ltd | 超eーマーケットプレースにおける部品選択装置 |
| US20090112522A1 (en) | 2007-10-29 | 2009-04-30 | American Power Conversion Corporation | Electrical efficiency measurement for data centers |
| WO2009058880A2 (en) | 2007-10-29 | 2009-05-07 | American Power Conversion Corporation | Electrical efficiency measurement for data centers |
Non-Patent Citations (2)
| Title |
|---|
| Rikki Kirzner "Real Cost of Ownership of Network Computer Devices" Dec. 1997. * |
| Tang et al. "Sensor-Based Fast Thermal Evaluation Model for Energy Efficient High-Performance Datacenters." 2006 IEEE. * |
Cited By (1)
| Publication number | Priority date | Publication date | Assignee | Title |
|---|---|---|---|---|
| US10318409B2 (en) * | 2011-06-10 | 2019-06-11 | Microsoft Technology Licensing, Llc | Application development environment for portable electronic devices |
Also Published As
| Publication number | Publication date |
|---|---|
| CN102460442B (zh) | 2015-11-25 |
| GB201120460D0 (en) | 2012-01-11 |
| WO2010133832A3 (en) | 2011-03-03 |
| BRPI1011216B1 (pt) | 2021-03-09 |
| BRPI1011216B8 (pt) | 2022-08-30 |
| EP2433231A2 (de) | 2012-03-28 |
| CN102460442A (zh) | 2012-05-16 |
| GB2482824A (en) | 2012-02-15 |
| US20100292976A1 (en) | 2010-11-18 |
| GB0908514D0 (en) | 2009-06-24 |
| WO2010133832A2 (en) | 2010-11-25 |
| JP2012527675A (ja) | 2012-11-08 |
| US11087041B2 (en) | 2021-08-10 |
| GB2482824B (en) | 2015-10-28 |
| US20170262560A1 (en) | 2017-09-14 |
| BRPI1011216A2 (pt) | 2017-01-17 |
| JP5649646B2 (ja) | 2015-01-07 |
Similar Documents
| Publication | Publication Date | Title |
|---|---|---|
| US11087041B2 (en) | Data centre simulator | |
| Kipp et al. | Layered green performance indicators | |
| US8395621B2 (en) | System for providing strategies for increasing efficiency of data centers | |
| He | A unified metric architecture for ai infrastructure: A cross-layer taxonomy integrating performance, efficiency, and cost | |
| Carpenter et al. | The impact of electricity pricing schemes on storage adoption in ontario | |
| Paulista et al. | Modeling and discrete event simulation in industrial systems considering consumption and electrical energy generation | |
| Malla et al. | The effect of server energy proportionality on data center power oversubscription | |
| Schneider et al. | Carbon accounting in the Cloud: a methodology for allocating emissions across data center users | |
| He | A Unified Metric Architecture for AI Infrastructure: A Cross-Layer Taxonomy Integrating Economics, Performance, and Efficiency | |
| Cappiello et al. | Monitoring and assessing energy consumption and CO2 emissions in cloud-based systems | |
| Sučić et al. | An innovative approach to implementing advanced energy projects in urban areas: From comprehensive simulation to actual implementation | |
| Liu et al. | Project genome: Wireless sensor network for data center cooling | |
| Horner | Powering the information age: metrics, social cost optimization strategies, and indirect effects related to data center energy use | |
| Agusti-Torra et al. | On the feasibility of collaborative green data center ecosystems | |
| Brocklehurst | International review of energy efficiency in data centres | |
| CODES | International review of energy efficiency in data Centres for IEA EBC building energy Codes working group | |
| Veselova | Data Center Sustainability Reporting: Advancement of Assessment Methodology for Energy Consumption by Virtualized Resources in Data Centers | |
| Omar | Data center simulator for sustainable data centers | |
| Levy | New family of data center metrics using a multidimensional approach for a holistic understanding | |
| Bashir et al. | Special Issue on the Workshop on Measurements, Modeling, and Metrics for Carbon-Aware Computing (CarbonMetrics 2025) | |
| He | How Can Datacenters Join the Smart Grid to Address the Climate Crisis? Using simulation to explore power and cost effects of direct participation in the energy market | |
| Uddin et al. | Criteria to select energy efficiency metrics to measure performance of data centre | |
| Corrigan et al. | Estimating Environmental Costs. | |
| Siso et al. | CoolEmAll D5. 6 final metrics and benchmarks | |
| Somani | Advanced thermal management strategies for energy-efficient data centers |
Legal Events
| Date | Code | Title | Description |
|---|---|---|---|
| AS | Assignment |
Owner name: ROMONET LIMITED, UNITED KINGDOM Free format text: ASSIGNMENT OF ASSIGNORS INTEREST;ASSIGNORS:NEWCOMBE, LIAM;LIMBUWALA, ZAHL;SIGNING DATES FROM 20090728 TO 20090729;REEL/FRAME:023103/0364 |
|
| STCF | Information on status: patent grant |
Free format text: PATENTED CASE |
|
| AS | Assignment |
Owner name: CBRE MANAGED SERVICES LIMITED, UNITED KINGDOM Free format text: ASSIGNMENT OF ASSIGNORS INTEREST;ASSIGNOR:ROMONET LTD;REEL/FRAME:052207/0628 Effective date: 20190201 |
|
| MAFP | Maintenance fee payment |
Free format text: PAYMENT OF MAINTENANCE FEE, 4TH YEAR, LARGE ENTITY (ORIGINAL EVENT CODE: M1551); ENTITY STATUS OF PATENT OWNER: LARGE ENTITY Year of fee payment: 4 |
|
| AS | Assignment |
Owner name: EKKOSENSE LTD, UNITED KINGDOM Free format text: ASSIGNMENT OF ASSIGNORS INTEREST;ASSIGNOR:CBRE MANAGED SERVICES LIMITED;REEL/FRAME:069998/0635 Effective date: 20231219 |
|
| MAFP | Maintenance fee payment |
Free format text: PAYMENT OF MAINTENANCE FEE, 8TH YEAR, LARGE ENTITY (ORIGINAL EVENT CODE: M1552); ENTITY STATUS OF PATENT OWNER: LARGE ENTITY Year of fee payment: 8 |