US8414500B2 - Arteriosclerosis diagnostic device - Google Patents
Arteriosclerosis diagnostic device Download PDFInfo
- Publication number
- US8414500B2 US8414500B2 US12/784,103 US78410310A US8414500B2 US 8414500 B2 US8414500 B2 US 8414500B2 US 78410310 A US78410310 A US 78410310A US 8414500 B2 US8414500 B2 US 8414500B2
- Authority
- US
- United States
- Prior art keywords
- frequency
- arteriosclerosis
- pulse wave
- peak
- degree
- Prior art date
- Legal status (The legal status is an assumption and is not a legal conclusion. Google has not performed a legal analysis and makes no representation as to the accuracy of the status listed.)
- Active, expires
Links
Images


Classifications
-
- A—HUMAN NECESSITIES
- A61—MEDICAL OR VETERINARY SCIENCE; HYGIENE
- A61B—DIAGNOSIS; SURGERY; IDENTIFICATION
- A61B7/00—Instruments for auscultation
- A61B7/02—Stethoscopes
- A61B7/04—Electric stethoscopes
-
- A—HUMAN NECESSITIES
- A61—MEDICAL OR VETERINARY SCIENCE; HYGIENE
- A61B—DIAGNOSIS; SURGERY; IDENTIFICATION
- A61B5/00—Measuring for diagnostic purposes; Identification of persons
- A61B5/02—Detecting, measuring or recording pulse, heart rate, blood pressure or blood flow; Combined pulse/heart-rate/blood pressure determination; Evaluating a cardiovascular condition not otherwise provided for, e.g. using combinations of techniques provided for in this group with electrocardiography or electroauscultation; Heart catheters for measuring blood pressure
- A61B5/02007—Evaluating blood vessel condition, e.g. elasticity, compliance
-
- A—HUMAN NECESSITIES
- A61—MEDICAL OR VETERINARY SCIENCE; HYGIENE
- A61B—DIAGNOSIS; SURGERY; IDENTIFICATION
- A61B5/00—Measuring for diagnostic purposes; Identification of persons
- A61B5/02—Detecting, measuring or recording pulse, heart rate, blood pressure or blood flow; Combined pulse/heart-rate/blood pressure determination; Evaluating a cardiovascular condition not otherwise provided for, e.g. using combinations of techniques provided for in this group with electrocardiography or electroauscultation; Heart catheters for measuring blood pressure
- A61B5/026—Measuring blood flow
- A61B5/0285—Measuring or recording phase velocity of blood waves
Definitions
- the various exemplary embodiments of the claimed invention relate to an arteriosclerosis diagnostic device, and in particular, a device for estimating the elasticity of arterial walls and determining the degree of arteriosclerosis.
- Japanese Unexamined Patent Application Publication No. 9-201361 proposes an arteriosclerosis diagnostic device that transmits and receives an ultrasonic beam to and from an object, obtains an echo signal, measures a time difference of arrival from a distance between two measurement locations, and calculates a pulse-wave propagation velocity.
- the device is intended to be used in diagnosis for arteriosclerosis by associating the above-mentioned calculated pulse-wave propagation velocity with the hardness of blood vessels.
- the device described in Japanese Unexamined Patent Application Publication No. 9-201361 can obtain only the propagation velocity of a pulse wave propagating along an arterial wall (i.e., only displacement information), so there is a problem in that it is susceptible to external factors, such as an error resulting from a skin surface. Also, a calculated value is affected by the distance between two measurement locations. Hence, measurement widely varies among parts used in measurement. Furthermore, there exists a problem of the complexity and expensiveness of the measurement device.
- the embodiments consistent with the claimed invention provide an arteriosclerosis diagnostic device having a simple structure, being resistant to external factors, such as an error resulting from a skin surface, and being capable of measuring the degree of hardness of an artery.
- an arteriosclerosis diagnostic device including first detection means for detecting a heart sound, second detection means for detecting a pulse wave in at least one location of a living body, the pulse wave propagating through an artery in relation to the heart sound, means for converting detection signals detected by the first and second detection means into their respective frequency signals, and means for determining the degree of arteriosclerosis by comparing the frequency signal of the heart sound and the frequency signal of the pulse wave.
- a second aspect consistent with the claimed invention provides an arteriosclerosis diagnostic device including first detection means and second detection means for detecting pulse waves in at least two locations of a living body, respectively, the pulse waves propagating through arteries in relation to a same heartbeat, means for converting detection signals detected by the first and second detection means into respective frequency signals, and means for determining the degree of arteriosclerosis by comparing the frequency signals.
- the present embodiment focuses on the relationship between viscoelasticity of an arterial wall and a transient response of a pulse wave occurring when a heartbeat propagates through a blood vessel inside the body to a distal organ.
- Heart sounds are vibrations of the heart accompanying diastole and systole.
- Pulse waves are oscillating waves in which oscillations in the aorta caused by heartbeats propagate along an arterial wall.
- the characteristic of the pipe for propagating the frequency of oscillating waves vary with the viscoelasticity of the pipe. For a blood vessel having high viscoelasticity, a decrease in frequency is large. In contrast, for a blood vessel with advanced arteriosclerosis, a decrease in frequency is small.
- a heart sound and a pulse wave are synchronously detected first by detection means. That is, a heart sound and a pulse wave related to the heart sound are detected.
- the heart sound can be detected at a position in the vicinity of the heart, such as the chest.
- the pulse wave may preferably be detected at a part remote from the heart, such as the neck, wrist, or ankle.
- the detected signals are time-domain signals, and the signals are converted into frequency-domain signals (frequency spectrum). Then, the frequency signal in the heart sound and the frequency signal in the pulse wave are compared.
- arteries have high viscoelasticity, so the difference between the frequency signal in the heart sound and that in the pulse wave is large.
- the difference between the frequency signal in the heart sound and that in the pulse wave is relatively small. Therefore, the degree of arteriosclerosis can be determined by comparison between the frequency signals.
- each of the frequency signals always has a peak frequency or a center frequency.
- a peak frequency is a frequency at which the spectral strength or amplitude is at the maximum value.
- a center frequency is a frequency at the center of the spectrum. If the spectral distribution is symmetrical, the peak frequency and the center frequency are the same. If plural kinds of peaked waves are present, it is preferable that the position of a peaked wave including the maximum value be the peak frequency.
- the degree of arteriosclerosis of an artery connecting the heart and the wrist can be determined by comparison between the peak frequency or the center frequency obtained at the chest and the peak frequency or the center frequency obtained at the wrist.
- frequency information is not influenced by skin at a measurement location, so a stable measurement result is obtainable.
- a heart sound and a pulse wave are compared.
- diagnosis for arteriosclerosis is carried out by comparison between pulse waves propagating through arteries in at least two locations of a human body.
- two detection means detect pulse waves that propagate through arteries in relation to the same heartbeat.
- the distance from the heart to one detection means may differ from that to the other detection means.
- one detection means may be near to the heart, and the other may be remote from the heart.
- a process for comparing frequencies may include finding the difference between the peak frequency at a first detection location and that at a second detection location. For example, when a heart sound and a pulse wave are detected, for a healthy person who does not have arteriosclerosis, arteries have high viscoelasticity, so the peak frequency difference is large. In contrast, for a person with arteriosclerosis, arteries are hard, so the peak frequency difference is small. Accordingly, the degree of arteriosclerosis can be determined on the basis of the magnitude of the peak frequency difference.
- the ratio of the peak frequency at one of the detection locations to the peak frequency at the other detection location may also be found. For example, when a heart sound and a pulse wave are detected, for a person with arteriosclerosis, the frequency ratio is closer to one, compared with a healthy person.
- pulse waves at two different locations on a human body may be used without the use of a heart sound. Additionally, the ratio between the difference between the peak frequency of a heart sound and the peak frequency of a pulse wave at a part (e.g., wrist) and the difference between the peak frequency of the heart sound and the peak frequency of a pulse wave at a different part (e.g., ankle) may be found, or, alternatively, the value obtained by dividing the difference between the peak frequency of a heart sound and that of a pulse wave at a part (e.g., wrist) by the peak frequency of the heart sound may be found. These characteristic values are unique to the individual.
- Finding one or more of the above-described characteristic values for a plurality of subjects referring to other checkup data of the subjects (e.g., blood sugar level, blood pressure, total cholesterol, neutral fat, HDL cholesterol, the presence/absence of obesity, X-ray inspection, funduscopy, electrocardiography), and generating statistical data of them enable the degree of arteriosclerosis to be determined with higher precision.
- the status of arteriosclerosis is deemed to vary with a lifestyle, so changes in peak frequency difference over time measured by monitoring everyday life can contribute to an evaluation of the lifestyle.
- arteriosclerosis is a symptom in which a distal thin artery gradually loses flexibility in response to a continuous contraction stimulus thereto due to, for example, smoking.
- Atherosclerosis is a symptom in which a protuberance (plaque) is formed due to deposition of, for example, cholesterol in blood on the inner walls of blood vessels.
- the diagnostic method of the present invention focuses on the propagation characteristics of a pulse wave propagating along the arterial walls, and this method is useful, especially in diagnosis for arteriolosclerosis and medial sclerosis.
- a heart sound contains a first sound component accompanying systole and a second sound component accompanying diastole, and a pulse wave also contains a constituent associated with the first sound component and a constituent associated with the second sound component.
- the constituent associated with the first sound component and the constituent associated with the second sound component of the pulse wave are also referred to as the first sound component and the second sound component, respectively.
- the first sound component and the second sound component are detectable by detection means, it is preferable that the first sound component be extracted because the first sound component is clearly detectable independently of the measurement part.
- a process for extracting only the first sound component from a heart sound and a pulse wave may include multiplying a detection signal output from detection means by a window function, for example.
- Frequency-converting the extracted first sound component by using conversion means such as a fast Fourier transform (FFT)
- FFT fast Fourier transform
- Extracting only the first sound component by use of the window function can shorten the processing time required for frequency conversion and avoid it from being mixed with other sounds; hence, sufficient stability of measurement can be maintained.
- the process for extracting only the first sound component may include some other processes, other than the one using the window function.
- the detection means included in the diagnostic device according to the present invention may be any means as long as it can detect a heart sound and a pulse wave.
- detection device or method for detecting a heart sound or a pulse wave as displacement information e.g., the amount of displacement or displacement velocity
- displacement information e.g., the amount of displacement or displacement velocity
- a heart sound and a pulse wave are detectable by simply making the piezoelectric transducer, for example, be in contact with the surface of the skin of a human body, such that the condition of arteriosclerosis can be diagnosed easily without causing injury or pain.
- directly measuring oscillations of a pulse wave (displacement information), not measuring a pulse pressure with a traditional sphygmograph, enables a heart sound and a pulse wave to be measured more easily and more accurately.
- the detection means for detecting a heart sound and the detection means for detecting a pulse wave (or that for a pulse wave and that for another pulse wave)
- variations in signal characteristics detected by the transducers can be reduced, and errors occurring in comparison of peak frequencies can also be reduced.
- detection signals in a heart sound and in a pulse wave are frequency-converted, and diagnosis for arteriosclerosis is carried out on the basis of information on the frequencies. Therefore, a stable measurement result that is not influenced by skin at a measurement location is obtainable.
- diagnosis for arteriosclerosis can be carried out with a simple device.
- pulse waves that are propagating through arteries and that are detected in at least two locations of a human body are used to carry out diagnosis for arteriosclerosis. Accordingly, even if no heart sound is detectable, diagnosis for arteriosclerosis can be carried out, in the same way as in the first embodiment.
- FIG. 1 is a system diagram of one example of an arteriosclerosis diagnostic device according to an embodiment.
- FIG. 2 is a schematic cross-sectional view of one example of a piezoelectric transducer.
- FIG. 3 is an internal circuit diagram of the diagnostic device according to an embodiment.
- FIG. 4 illustrates waveforms of an electrocardiogram, heart sounds, pulse waves at the neck and pulse waves at a wrist with respect to a subject 1 .
- FIG. 5( a ) shows a heart sound of the subject 1 in a raw waveform.
- FIG. 5( b ) shows a heart sound of the subject 1 in a waveform of the first sound component extracted by using a window function.
- FIG. 5( c ) shows a heart sound of the subject 1 in a waveform of a signal into which the extracted first sound component was frequency-converted.
- FIG. 6( a ) shows a pulse wave at the neck of the subject 1 in raw waveform.
- FIG. 6( b ) shows a pulse wave at the neck of the subject 1 in a waveform of the first sound component extracted by using a window function.
- FIG. 6( c ) shows a pulse wave at the neck of the subject 1 in a waveform of a signal into which the extracted first sound component was frequency-converted.
- FIG. 7( a ) shows a pulse wave at the wrist of the subject 1 in a raw waveform.
- FIG. 7( b ) shows a pulse wave at the wrist of the subject 1 in a waveform of the first sound component extracted by using a window function.
- FIG. 7( c ) shows a pulse wave at the wrist of the subject 1 in a waveform of a signal into which the extracted first sound component was frequency-converted.
- FIG. 8 illustrates frequency characteristics of the heart sound, the pulse wave at the neck, and the pulse wave at the wrist with respect to the subject 1 .
- FIG. 9 illustrates waveforms of an electrocardiogram, heart sounds, pulse waves at the neck and pulse waves at a wrist with respect to a subject 2 .
- FIG. 10( a ) shows a heart sound of the subject 2 in a raw waveform.
- FIG. 10( b ) shows a heart sound of the subject 2 in a waveform of the first sound component that was extracted by using a window function.
- FIG. 10( c ) shows a heart sound of the subject 2 in a waveform of a signal into which the extracted first sound component was frequency-converted.
- FIG. 11( a ) shows a pulse wave at the neck of the subject 2 in a raw waveform.
- FIG. 11( b ) shows a pulse wave at the neck of the subject 2 in a waveform of the first sound component that was extracted by using a window function.
- FIG. 11( c ) shows a pulse wave at the neck of the subject 2 in a waveform of a signal into which the extracted first sound component was frequency-converted.
- FIG. 12( a ) shows a pulse wave at the wrist of the subject 2 in a raw waveform.
- FIG. 12( b ) shows a pulse wave at the wrist of the subject 2 in a waveform of the first sound component that was extracted by using a window function.
- FIG. 12( c ) shows a pulse wave at the wrist of the subject 2 in a waveform of a signal into which the extracted first sound component was frequency-converted.
- FIG. 13 illustrates frequency characteristics of the heart sound, the pulse wave at the neck, and the pulse wave at the wrist with respect to the subject 2 .
- FIG. 14 illustrates waveforms of an electrocardiogram, heart sounds, pulse waves at the neck and pulse waves at a wrist with respect to a subject 3 .
- FIG. 15( a ) shows a heart sound of the subject 3 in a raw waveform.
- FIG. 15( b ) shows a heart sound of the subject 3 in (a waveform of the first sound component extracted by using a window function.
- FIG. 15( c ) shows a heart sound of the subject 3 in a waveform of a signal into which the extracted first sound component was frequency-converted.
- FIG. 16( a ) shows a pulse wave at the neck of the subject 3 in a raw waveform.
- FIG. 16( b ) shows a pulse wave at the neck of the subject 3 in a waveform of the first sound component extracted by using a window function.
- FIG. 16( c ) shows a pulse wave at the neck of the subject 3 in a waveform of a signal into which the extracted first sound component was frequency-converted.
- FIG. 17( a ) shows a pulse wave at the wrist of the subject 3 in a raw waveform.
- FIG. 17( b ) shows a pulse wave at the wrist of the subject 3 in a waveform of the first sound component that was extracted by using a window function.
- FIG. 17( c ) shows a pulse wave at the wrist of the subject 3 in a waveform of a signal into which the extracted first sound component was frequency-converted.
- FIG. 18 illustrates frequency characteristics of the heart sound, the pulse wave at the neck, and the pulse wave at the wrist with respect to the subject 3 .
- FIG. 1 illustrates an example of an arteriosclerosis diagnostic method according to the present invention.
- This example is one in which diagnosis for arteriosclerosis is carried out by measurement of a heart sound and pulse waves at two locations of a human body.
- three piezoelectric transducers 1 to 3 are attached so as to be in contact with the skin of a patient H.
- Each of the piezoelectric transducers 1 to 3 is a kind of an acoustic sensor that converts a heart sound and a pulse wave propagating through an artery into electrical signals indicating displacement velocities.
- the contact locations of the piezoelectric transducers 1 to 3 a part at which a heart sound is detectable, such as the chest, and parts at which pulse waves propagating through arteries of the neck and the wrist are detectable, are selected.
- the contact locations may be fixed.
- the measurement locations are not limited to those described above.
- the measurement may be made at other parts, such as an elbow, ankle, waist, femoral region, and shoulder, and the number of the measurement locations may be more than three.
- an electrocardiograph 4 is attached to the chest.
- the piezoelectric transducers 1 to 3 and the electrocardiograph 4 are connected to a diagnostic device 5 with wiring.
- the diagnostic device 5 is provided with a display unit 6 for displaying a result of the diagnosis.
- the display unit 6 displays the degree of arteriosclerosis using a numerical value, symbol, graph or other elements.
- FIG. 2 illustrates an example of the piezoelectric transducer 1 shown in a cross-sectional view.
- the other transducers 2 and 3 have the same structure as that of the piezoelectric transducer 1 .
- the transducer 1 has a piezoelectric unimorph structure.
- a cylindrical casing 10 has a flat bottom 11 , and the bottom 11 is configured as a vibrating surface.
- a piezoelectric element 12 is fixed on the inner surface of the bottom 11 .
- the outer surface of the bottom 11 is in contact with the skin of the patient H.
- the opening of the casing 10 is closed by a seal 13 , and leads 14 are drawn out through the seal 13 .
- the structure of the piezoelectric transducer is not limited to that illustrated in FIG. 2 .
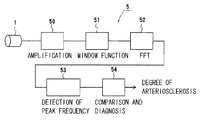
- FIG. 3 illustrates an internal circuit configuration of the diagnostic device 5 .
- a detection signal detected by the piezoelectric transducer 1 is amplified by an amplifier 50 and then input into a block 51 .
- the input detection signal is multiplied by a window function so that only a first sound component can be extracted from the detection signal.
- the extracted first sound component is converted into a frequency signal, for example, by a fast Fourier transform (FFT).
- FFT fast Fourier transform
- another converting process other than FFT can also be used.
- the frequency signal obtained by the conversion is sent to a block 53 .
- the peak frequency of a heart sound is detected.
- the peak frequency of a pulse wave related to the heart sound at the neck and that at a wrist are detected by the piezoelectric transducers 2 and 3 , which are not shown in FIG. 3 .
- a peak frequency is a frequency at which the spectral strength (or amplitude) is at the peak value.
- the peak frequency of the heart sound and the peak frequency of each of the pulse waves are compared, and the degree of arteriosclerosis of a subject is thus obtained.
- an output signal of the electrocardiograph 4 showing an electrical waveform of heartbeats may be connected to the diagnostic device 5 and it may be used in identifying the first sound component of a heart sound and the first sound component of a pulse wave.
- Subject 1 is a 23-year-old male who does virtually no physical activity.
- Subject 2 is a 23-year-old male who plays tennis on a regular basis.
- Subject 3 is a 60-year-old male who has an age-related degree of arteriosclerosis according to regular medical checkup records and has blood vessels slightly containing calcium.
- FIGS. 4 to 8 illustrate the result of a diagnosis on the subject 1 , whose age is 23, that was made by employing signal processing in the above diagnostic method.
- FIG. 4 illustrates detection signals (voltages) synchronously detected by the three piezoelectric transducers 1 to 3 and the electrocardiograph 4 . That is, FIG. 4 shows an electrocardiogram, heart sounds, pulse waves at the neck, and pulse waves at the wrist.
- Each of the heart sounds contains a first sound component accompanying systole and a second sound component accompanying diastole.
- each of the pulse waves at the wrist contains only the first sound component, and substantially does not contain the second sound component.
- FIG. 5 generally shows a heart sound. Specifically, FIGS. 5( a ) to 5 ( c ) illustrate a raw waveform, a waveform of the first sound component that was extracted by using a window function, and a signal into which the extracted first sound component was frequency-converted, respectively.
- the peak frequency f 1 of the first sound component in the heart sound was 25 Hz.
- FIG. 6 generally shows a pulse wave at the neck.
- FIGS. 6( a ) to 6 ( c ) illustrate a raw waveform, a waveform of the first sound component that was extracted by using a window function, and a signal into which the extracted first sound component was frequency-converted, respectively.
- the peak frequency f 2 of the first sound component in the pulse wave at the neck was 4.9 Hz.
- FIG. 7 generally shows a pulse wave at the wrist.
- FIGS. 7( a ) to ( c ) illustrate a raw waveform, a waveform of the first sound component that was extracted by using a window function, and a signal into which the extracted first sound component was frequency-converted, respectively.
- the peak frequency f 3 of the first sound component in the pulse wave at the wrist was 3.4 Hz.
- FIG. 8 illustrates, in a graph, frequency characteristics of the heart sound, the pulse wave at the neck, and the pulse wave at the wrist with respect to the subject 1 .
- the graph was obtained by normalizing the waveforms with respect to the maximum amplitudes.
- FIG. 8 is unique to the subject 1 and is related to the degree of the hardness of arteries. The difference between the peak frequency of the heart sound and that of the pulse wave at the neck of the subject 1 was 20.1 Hz, whereas the difference between the peak frequency of the heart sound and that of the pulse wave at the wrist was 21.6 Hz.
- FIGS. 9 to 13 illustrate the result of a diagnosis on the subject 2 , whose age is 23.
- FIG. 9 illustrates detection signals synchronously detected by the three piezoelectric transducers 1 to 3 and the electrocardiograph 4 . That is, FIG. 4 shows an electrocardiogram, heart sounds, pulse waves at the neck, and a pulse waves at the wrist.
- FIG. 10 generally shows a heart sound. Specifically, FIGS. 10( a ) to 10 ( c ) illustrate a raw waveform, a waveform of the first sound component that was extracted by using a window function, and a signal into which the extracted first sound component was frequency-converted, respectively.
- the peak frequency f 1 of the first sound component in the heart sound was 31.7 Hz.
- FIG. 11 generally shows a pulse wave at the neck.
- FIGS. 11( a ) to 11 ( c ) illustrate a raw waveform, a waveform of the first sound component that was extracted by using a window function, and a signal into which the extracted first sound component was frequency-converted, respectively.
- the peak frequency f 2 of the first sound component in the pulse wave at the neck was 4.3 Hz.
- FIG. 12 generally shows a pulse wave at the wrist.
- FIGS. 12( a ) to 12 ( c ) illustrate a raw waveform, a waveform of the first sound component that was extracted by using a window function, and a signal into which the extracted first sound component was frequency-converted, respectively.
- the peak frequency f 3 of the first sound component in the pulse wave at the wrist was 3.4 Hz.
- FIG. 13 illustrates, in a graph, frequency characteristics of the heart sound, the pulse wave at the neck, and the pulse wave at the wrist with respect to the subject 2 .
- the graph was obtained by normalizing the waveforms with respect to the maximum amplitudes.
- the difference between the peak frequency of the heart sound and that of the pulse wave at the neck was 27.4 Hz
- the difference between the peak frequency of the heart sound and that of the pulse wave at the wrist was 28.3 Hz.
- FIGS. 14 to 18 illustrate the result of a diagnosis on the subject 3 , whose age is 60.
- FIG. 14 illustrates detection signals (voltages) synchronously detected by the three piezoelectric transducers 1 to 3 and the electrocardiograph 4 . That is, FIG. 14 shows an electrocardiogram, heart sounds, pulse waves at the neck, and pulse waves at the wrist.
- FIG. 15 generally shows a heart sound. Specifically, FIGS. 15( a ) to 15 ( c ) illustrate a raw waveform, a waveform of the first sound component that was extracted by using a window function, and a signal into which the extracted first sound component was frequency-converted, respectively.
- the peak frequency f 1 of the first sound component in the heart sound was 21.1 Hz.
- FIG. 16 generally shows a pulse wave at the neck.
- FIGS. 16( a ) to 16 ( c ) illustrate a raw waveform, a waveform of the first sound component that was extracted by using a window function, and a signal into which the extracted first sound component was frequency-converted, respectively.
- the peak frequency f 2 of the first sound component in the pulse wave at the neck was 7.3 Hz.
- FIG. 17 generally shows a pulse wave at the wrist.
- FIGS. 17( a ) to 17 ( c ) illustrate a raw waveform, a waveform of the first sound component that was extracted by using a window function, and a signal into which the extracted first sound component was frequency-converted, respectively.
- the peak frequency f 3 of the first sound component in the pulse wave at the wrist was 2.4 Hz.
- FIG. 18 illustrates, in a graph, frequency characteristics of the heart sound, the pulse wave at the neck, and the pulse wave at the wrist with respect to the subject 3 .
- the graph was obtained by normalizing the waveforms with respect to the maximum amplitudes.
- the difference between the peak frequency of the heart sound and that of the pulse wave at the neck was 13.8 Hz
- the difference between the peak frequency of the heart sound and that of the pulse wave at the wrist was 18.7 Hz.
- both the frequency differences are small.
- the difference between the peak frequency of the heart sound and that of the pulse wave at the neck is markedly small.
- the following table shows comparisons of the peak frequencies and of the frequency differences among the subjects 1 , 2 , and 3 obtained from FIGS. 8 , 13 , and 18 .
- the unit is Hz.
- the peak frequency differences for the elderly subject 3 are smaller than those for the young subjects 1 and 2 . That is, in the case of the subjects 1 and 2 , who are deemed to have little arteriosclerosis, the viscoelasticity of the arterial walls is high, so the peak frequency differences are larger. In contrast, in the case of the subject 3 , who is deemed to have advanced arteriosclerosis, the peak frequency differences are relatively small. In this way, it is possible to estimate the degree of arteriosclerosis on the basis of the extent of a peak frequency difference.
- the difference between the peak frequency of the heart sound and that of the pulse wave at the neck is considerably smaller than the difference between the peak frequency of the heart sound and that of the pulse wave at the wrist.
- the difference between the peak frequency of the pulse wave at the neck and that at the wrist of the subject 3 is significantly larger than those of the subjects 1 and 2 .
- This may result from a cause lying in an artery connecting the heart and the carotid artery in the neck, such as hardening of the artery.
- the difference between the peak frequencies of pulse waves in at least two locations of a human body can be used in diagnosis of, for example, arteriosclerosis.
- the degree of arteriosclerosis is determined on the basis of the difference between the peak frequency of a heart sound and that of a pulse wave or the difference between the peak frequencies of pulse waves.
- the degree of arteriosclerosis can also be determined on the basis of the ratio between the peak frequency of a pulse wave and that of a heart sound.
- the peak frequency ratio R 1 has a value being smaller than one, and it is nearer to one for individuals having a higher degree of arteriosclerosis.
- the overall degree of arteriosclerosis of a subject may also be estimated by finding the ratio between the peak frequency of a heart sound and each of the peak frequencies of pulse waves at two different locations (e.g., a wrist and an ankle).
- This peak frequency ratio R 2 is related to the frequency difference in the section from the heart to the ankle and that in the section from the heart to the wrist. Accordingly, the evaluation of the peak frequency ratio R 2 enables the estimation of the degree of the progress of arteriosclerosis of the entire body.
- the detection means can be made to come into contact with a human body by any process, including incorporating it into clothes, watches, rings, or jewelry, which are worn by people in daily life, or other things that a subject can come into contact with for measurement, such as a chair, sofa, blanket, or shoe.
- the use of such a process makes it possible to obtain data on a regular basis without causing a subject to become aware of measurement. Accordingly, the device can be used as a home-use measuring instrument to continuously store measured data.
Landscapes
- Health & Medical Sciences (AREA)
- Life Sciences & Earth Sciences (AREA)
- Physics & Mathematics (AREA)
- Animal Behavior & Ethology (AREA)
- Public Health (AREA)
- Biomedical Technology (AREA)
- Heart & Thoracic Surgery (AREA)
- Medical Informatics (AREA)
- Molecular Biology (AREA)
- Surgery (AREA)
- Veterinary Medicine (AREA)
- General Health & Medical Sciences (AREA)
- Engineering & Computer Science (AREA)
- Acoustics & Sound (AREA)
- Cardiology (AREA)
- Physiology (AREA)
- Biophysics (AREA)
- Pathology (AREA)
- Hematology (AREA)
- Vascular Medicine (AREA)
- Measuring Pulse, Heart Rate, Blood Pressure Or Blood Flow (AREA)
- Ultra Sonic Daignosis Equipment (AREA)
Applications Claiming Priority (3)
| Application Number | Priority Date | Filing Date | Title |
|---|---|---|---|
| JP2007-300548 | 2007-11-20 | ||
| JP2007300548 | 2007-11-20 | ||
| PCT/JP2008/071011 WO2009066688A1 (ja) | 2007-11-20 | 2008-11-19 | 動脈硬化診断装置 |
Related Parent Applications (1)
| Application Number | Title | Priority Date | Filing Date |
|---|---|---|---|
| PCT/JP2008/071011 Continuation WO2009066688A1 (ja) | 2007-11-20 | 2008-11-19 | 動脈硬化診断装置 |
Publications (2)
| Publication Number | Publication Date |
|---|---|
| US20100292590A1 US20100292590A1 (en) | 2010-11-18 |
| US8414500B2 true US8414500B2 (en) | 2013-04-09 |
Family
ID=40667510
Family Applications (1)
| Application Number | Title | Priority Date | Filing Date |
|---|---|---|---|
| US12/784,103 Active 2029-04-30 US8414500B2 (en) | 2007-11-20 | 2010-05-20 | Arteriosclerosis diagnostic device |
Country Status (3)
| Country | Link |
|---|---|
| US (1) | US8414500B2 (ja) |
| JP (1) | JP5090465B2 (ja) |
| WO (1) | WO2009066688A1 (ja) |
Cited By (1)
| Publication number | Priority date | Publication date | Assignee | Title |
|---|---|---|---|---|
| CN107802257A (zh) * | 2017-12-04 | 2018-03-16 | 山东朱氏药业集团有限公司 | 一种新型动脉硬化分析仪 |
Families Citing this family (8)
| Publication number | Priority date | Publication date | Assignee | Title |
|---|---|---|---|---|
| US9375152B2 (en) * | 2012-03-07 | 2016-06-28 | Cardiac Pacemakers, Inc. | Heart sound detection systems and methods using updated heart sound expectation window functions |
| MX2017006318A (es) * | 2014-11-13 | 2018-02-13 | Univ Vanderbilt | Dispositivo y método para la detección de hemorragias y reanimación guiada y aplicaciones de los mismos. |
| US20180338732A1 (en) * | 2015-09-21 | 2018-11-29 | Board Of Regents, The University Of Texas System | Systems and methods for monitoring heart and lung activity |
| WO2018152675A1 (zh) * | 2017-02-21 | 2018-08-30 | 深圳市和来科技有限公司 | 一种周围动脉硬化的早期筛查系统及方法 |
| JP7519905B2 (ja) * | 2018-05-10 | 2024-07-22 | ヴァンダービルト ユニバーシティ | 被検体を評価するための非侵襲的静脈波形分析 |
| JP6547054B1 (ja) * | 2018-11-15 | 2019-07-17 | Ami株式会社 | 医療機器及びプログラム |
| CN113303774A (zh) * | 2020-02-26 | 2021-08-27 | Oppo广东移动通信有限公司 | 一种可穿戴设备 |
| CN112274120B (zh) * | 2020-10-28 | 2023-07-25 | 河北工业大学 | 一种基于单路脉搏波的无创动脉硬化检测方法、装置 |
Citations (9)
| Publication number | Priority date | Publication date | Assignee | Title |
|---|---|---|---|---|
| JPH0380830A (ja) | 1989-08-24 | 1991-04-05 | Shimada Phys & Chem Ind Co Ltd | 血管硬化度測定装置 |
| JPH07148127A (ja) | 1993-12-02 | 1995-06-13 | Seiko Instr Inc | 脈拍計 |
| JPH09201361A (ja) | 1995-11-21 | 1997-08-05 | Toshiba Corp | 超音波診断装置 |
| US5830131A (en) * | 1994-04-15 | 1998-11-03 | Vital Insite, Inc. | Apparatus and method for measuring an induced perturbation to determine a physical condition of the human arterial system |
| JP2000254104A (ja) | 1999-03-08 | 2000-09-19 | Nippon Colin Co Ltd | 動脈硬化度測定装置 |
| US20030004425A1 (en) * | 2001-06-20 | 2003-01-02 | Colin Corporation | Heart-sound detecting apparatus |
| JP2004135920A (ja) | 2002-10-18 | 2004-05-13 | Tcc Corporation Ltd | 人体の生理状態計測装置 |
| JP2006158426A (ja) | 2004-12-02 | 2006-06-22 | Crosswell:Kk | 血管機能判定方法及び装置 |
| JP2006280784A (ja) | 2005-04-04 | 2006-10-19 | Fukuda Denshi Co Ltd | 血管硬化度算出装置および血管硬化度算出プログラム |
-
2008
- 2008-11-19 WO PCT/JP2008/071011 patent/WO2009066688A1/ja active Application Filing
- 2008-11-19 JP JP2009542567A patent/JP5090465B2/ja not_active Expired - Fee Related
-
2010
- 2010-05-20 US US12/784,103 patent/US8414500B2/en active Active
Patent Citations (9)
| Publication number | Priority date | Publication date | Assignee | Title |
|---|---|---|---|---|
| JPH0380830A (ja) | 1989-08-24 | 1991-04-05 | Shimada Phys & Chem Ind Co Ltd | 血管硬化度測定装置 |
| JPH07148127A (ja) | 1993-12-02 | 1995-06-13 | Seiko Instr Inc | 脈拍計 |
| US5830131A (en) * | 1994-04-15 | 1998-11-03 | Vital Insite, Inc. | Apparatus and method for measuring an induced perturbation to determine a physical condition of the human arterial system |
| JPH09201361A (ja) | 1995-11-21 | 1997-08-05 | Toshiba Corp | 超音波診断装置 |
| JP2000254104A (ja) | 1999-03-08 | 2000-09-19 | Nippon Colin Co Ltd | 動脈硬化度測定装置 |
| US20030004425A1 (en) * | 2001-06-20 | 2003-01-02 | Colin Corporation | Heart-sound detecting apparatus |
| JP2004135920A (ja) | 2002-10-18 | 2004-05-13 | Tcc Corporation Ltd | 人体の生理状態計測装置 |
| JP2006158426A (ja) | 2004-12-02 | 2006-06-22 | Crosswell:Kk | 血管機能判定方法及び装置 |
| JP2006280784A (ja) | 2005-04-04 | 2006-10-19 | Fukuda Denshi Co Ltd | 血管硬化度算出装置および血管硬化度算出プログラム |
Non-Patent Citations (2)
| Title |
|---|
| International Search Report; PCT/JP2008/071011; Dec. 16, 2008. |
| Japanese Office Action "Notification of Reasons for Refusal" dated May 29, 2012; Japanese Patent Application No. 2009-542567; with translation. |
Cited By (1)
| Publication number | Priority date | Publication date | Assignee | Title |
|---|---|---|---|---|
| CN107802257A (zh) * | 2017-12-04 | 2018-03-16 | 山东朱氏药业集团有限公司 | 一种新型动脉硬化分析仪 |
Also Published As
| Publication number | Publication date |
|---|---|
| JP5090465B2 (ja) | 2012-12-05 |
| US20100292590A1 (en) | 2010-11-18 |
| JPWO2009066688A1 (ja) | 2011-04-07 |
| WO2009066688A1 (ja) | 2009-05-28 |
Similar Documents
| Publication | Publication Date | Title |
|---|---|---|
| US8414500B2 (en) | Arteriosclerosis diagnostic device | |
| US9833151B2 (en) | Systems and methods for monitoring the circulatory system | |
| US20210244302A1 (en) | Methods to estimate the blood pressure and the arterial stiffness based on photoplethysmographic (ppg) signals | |
| CN109069031B (zh) | 用于确定对象血压的设备和方法 | |
| WO2018099427A1 (zh) | 具有确定血压功能的动态量测装置 | |
| US10092268B2 (en) | Method and apparatus to monitor physiologic and biometric parameters using a non-invasive set of transducers | |
| US20210022624A1 (en) | Multifunctional measuring device capable of determining carotid blood pressure | |
| JP6195267B2 (ja) | 血圧推定装置、血圧推定システム、および制御プログラム | |
| JP6407757B2 (ja) | 指標算出装置、指標算出システム、指標算出方法、および制御プログラム | |
| Shukla et al. | Noninvasive cuffless blood pressure measurement by vascular transit time | |
| JP6547054B1 (ja) | 医療機器及びプログラム | |
| Tamura | Cuffless blood pressure monitors: Principles, standards and approval for medical use | |
| Lopez et al. | Continuous blood pressure monitoring in daily life | |
| RU2268639C2 (ru) | Способ пульсометрической оценки функционального состояния и характера вегетативной регуляции сердечно-сосудистой системы человека | |
| Franchi et al. | Blood pressure evaluation based on arterial pulse wave velocity | |
| Seo et al. | Non-invasive evaluation of a carotid arterial pressure waveform using motion-tolerant ultrasound measurements during the Valsalva maneuver | |
| JP3712418B2 (ja) | 誘発された摂動を測定してヒト動脈系の物理的状態を決定するための装置および方法 | |
| CN111345791B (zh) | 一种脉搏波测量装置 | |
| Anchan | Estimating pulse wave velocity using mobile phone sensors | |
| Amado-Rey et al. | Towards ultrasound wearable technology for cardiovascular monitoring: from device development to clinical validation | |
| JP2021023615A (ja) | 脈圧推定装置、脈圧推定システム、脈圧推定方法、及び制御プログラム | |
| Stergiopoulos et al. | NonInvasive Monitoring of Vital Signs and Traumatic Brain Injuries | |
| Koohi | Methods for Non-invasive trustworthy estimation of arterial blood pressure | |
| Gómez Clapers | Assessment of trends in the cardiovascular system from time interval measurements using physiological signals obtained at the limbs | |
| Lopez et al. | Continuous blood pressure measurement in daily activities |
Legal Events
| Date | Code | Title | Description |
|---|---|---|---|
| AS | Assignment |
Owner name: MURATA MANUFACTURING CO., LTD., JAPAN Free format text: ASSIGNMENT OF ASSIGNORS INTEREST;ASSIGNORS:MATSUKAWA, MAMI;WATANABE, YOSHIAKI;SAITO, MASASHI;AND OTHERS;SIGNING DATES FROM 20100517 TO 20100708;REEL/FRAME:024777/0061 Owner name: THE DOSHISHA, JAPAN Free format text: ASSIGNMENT OF ASSIGNORS INTEREST;ASSIGNORS:MATSUKAWA, MAMI;WATANABE, YOSHIAKI;SAITO, MASASHI;AND OTHERS;SIGNING DATES FROM 20100517 TO 20100708;REEL/FRAME:024777/0061 |
|
| FEPP | Fee payment procedure |
Free format text: PAYOR NUMBER ASSIGNED (ORIGINAL EVENT CODE: ASPN); ENTITY STATUS OF PATENT OWNER: LARGE ENTITY |
|
| STCF | Information on status: patent grant |
Free format text: PATENTED CASE |
|
| FEPP | Fee payment procedure |
Free format text: PAYOR NUMBER ASSIGNED (ORIGINAL EVENT CODE: ASPN); ENTITY STATUS OF PATENT OWNER: LARGE ENTITY |
|
| FPAY | Fee payment |
Year of fee payment: 4 |
|
| MAFP | Maintenance fee payment |
Free format text: PAYMENT OF MAINTENANCE FEE, 8TH YEAR, LARGE ENTITY (ORIGINAL EVENT CODE: M1552); ENTITY STATUS OF PATENT OWNER: LARGE ENTITY Year of fee payment: 8 |