US8046252B2 - Sales plan evaluation support system - Google Patents
Sales plan evaluation support system Download PDFInfo
- Publication number
- US8046252B2 US8046252B2 US11/769,827 US76982707A US8046252B2 US 8046252 B2 US8046252 B2 US 8046252B2 US 76982707 A US76982707 A US 76982707A US 8046252 B2 US8046252 B2 US 8046252B2
- Authority
- US
- United States
- Prior art keywords
- order
- plan
- placement
- product
- item
- Prior art date
- Legal status (The legal status is an assumption and is not a legal conclusion. Google has not performed a legal analysis and makes no representation as to the accuracy of the status listed.)
- Expired - Fee Related, expires
Links
- 238000011156 evaluation Methods 0.000 title claims abstract description 32
- 238000004364 calculation method Methods 0.000 claims abstract description 57
- 238000000034 method Methods 0.000 claims abstract description 26
- 239000000463 material Substances 0.000 claims abstract description 12
- 238000013439 planning Methods 0.000 claims abstract description 8
- 238000004519 manufacturing process Methods 0.000 claims description 38
- 230000006870 function Effects 0.000 claims description 5
- 230000008859 change Effects 0.000 abstract description 18
- 238000010586 diagram Methods 0.000 description 15
- 230000008569 process Effects 0.000 description 11
- 238000012545 processing Methods 0.000 description 6
- 238000013461 design Methods 0.000 description 2
- 230000006866 deterioration Effects 0.000 description 2
- 230000002542 deteriorative effect Effects 0.000 description 2
- 238000005516 engineering process Methods 0.000 description 2
- 230000004044 response Effects 0.000 description 2
- 238000004088 simulation Methods 0.000 description 2
- 238000013068 supply chain management Methods 0.000 description 2
- 238000012384 transportation and delivery Methods 0.000 description 2
- 230000007306 turnover Effects 0.000 description 2
- 238000004458 analytical method Methods 0.000 description 1
- 230000001174 ascending effect Effects 0.000 description 1
- 230000000712 assembly Effects 0.000 description 1
- 238000000429 assembly Methods 0.000 description 1
- 230000006399 behavior Effects 0.000 description 1
- 230000003111 delayed effect Effects 0.000 description 1
- 239000000284 extract Substances 0.000 description 1
- 239000004973 liquid crystal related substance Substances 0.000 description 1
- 238000012986 modification Methods 0.000 description 1
- 230000004048 modification Effects 0.000 description 1
- 239000002994 raw material Substances 0.000 description 1
Images


Classifications
-
- G—PHYSICS
- G06—COMPUTING; CALCULATING OR COUNTING
- G06Q—INFORMATION AND COMMUNICATION TECHNOLOGY [ICT] SPECIALLY ADAPTED FOR ADMINISTRATIVE, COMMERCIAL, FINANCIAL, MANAGERIAL OR SUPERVISORY PURPOSES; SYSTEMS OR METHODS SPECIALLY ADAPTED FOR ADMINISTRATIVE, COMMERCIAL, FINANCIAL, MANAGERIAL OR SUPERVISORY PURPOSES, NOT OTHERWISE PROVIDED FOR
- G06Q10/00—Administration; Management
- G06Q10/08—Logistics, e.g. warehousing, loading or distribution; Inventory or stock management
- G06Q10/087—Inventory or stock management, e.g. order filling, procurement or balancing against orders
-
- G—PHYSICS
- G06—COMPUTING; CALCULATING OR COUNTING
- G06Q—INFORMATION AND COMMUNICATION TECHNOLOGY [ICT] SPECIALLY ADAPTED FOR ADMINISTRATIVE, COMMERCIAL, FINANCIAL, MANAGERIAL OR SUPERVISORY PURPOSES; SYSTEMS OR METHODS SPECIALLY ADAPTED FOR ADMINISTRATIVE, COMMERCIAL, FINANCIAL, MANAGERIAL OR SUPERVISORY PURPOSES, NOT OTHERWISE PROVIDED FOR
- G06Q10/00—Administration; Management
- G06Q10/06—Resources, workflows, human or project management; Enterprise or organisation planning; Enterprise or organisation modelling
- G06Q10/063—Operations research, analysis or management
- G06Q10/0631—Resource planning, allocation, distributing or scheduling for enterprises or organisations
- G06Q10/06312—Adjustment or analysis of established resource schedule, e.g. resource or task levelling, or dynamic rescheduling
-
- G—PHYSICS
- G06—COMPUTING; CALCULATING OR COUNTING
- G06Q—INFORMATION AND COMMUNICATION TECHNOLOGY [ICT] SPECIALLY ADAPTED FOR ADMINISTRATIVE, COMMERCIAL, FINANCIAL, MANAGERIAL OR SUPERVISORY PURPOSES; SYSTEMS OR METHODS SPECIALLY ADAPTED FOR ADMINISTRATIVE, COMMERCIAL, FINANCIAL, MANAGERIAL OR SUPERVISORY PURPOSES, NOT OTHERWISE PROVIDED FOR
- G06Q10/00—Administration; Management
- G06Q10/06—Resources, workflows, human or project management; Enterprise or organisation planning; Enterprise or organisation modelling
- G06Q10/063—Operations research, analysis or management
- G06Q10/0631—Resource planning, allocation, distributing or scheduling for enterprises or organisations
- G06Q10/06314—Calendaring for a resource
-
- G—PHYSICS
- G06—COMPUTING; CALCULATING OR COUNTING
- G06Q—INFORMATION AND COMMUNICATION TECHNOLOGY [ICT] SPECIALLY ADAPTED FOR ADMINISTRATIVE, COMMERCIAL, FINANCIAL, MANAGERIAL OR SUPERVISORY PURPOSES; SYSTEMS OR METHODS SPECIALLY ADAPTED FOR ADMINISTRATIVE, COMMERCIAL, FINANCIAL, MANAGERIAL OR SUPERVISORY PURPOSES, NOT OTHERWISE PROVIDED FOR
- G06Q10/00—Administration; Management
- G06Q10/06—Resources, workflows, human or project management; Enterprise or organisation planning; Enterprise or organisation modelling
- G06Q10/063—Operations research, analysis or management
- G06Q10/0631—Resource planning, allocation, distributing or scheduling for enterprises or organisations
- G06Q10/06315—Needs-based resource requirements planning or analysis
-
- G—PHYSICS
- G06—COMPUTING; CALCULATING OR COUNTING
- G06Q—INFORMATION AND COMMUNICATION TECHNOLOGY [ICT] SPECIALLY ADAPTED FOR ADMINISTRATIVE, COMMERCIAL, FINANCIAL, MANAGERIAL OR SUPERVISORY PURPOSES; SYSTEMS OR METHODS SPECIALLY ADAPTED FOR ADMINISTRATIVE, COMMERCIAL, FINANCIAL, MANAGERIAL OR SUPERVISORY PURPOSES, NOT OTHERWISE PROVIDED FOR
- G06Q10/00—Administration; Management
- G06Q10/06—Resources, workflows, human or project management; Enterprise or organisation planning; Enterprise or organisation modelling
- G06Q10/063—Operations research, analysis or management
- G06Q10/0639—Performance analysis of employees; Performance analysis of enterprise or organisation operations
- G06Q10/06393—Score-carding, benchmarking or key performance indicator [KPI] analysis
-
- G—PHYSICS
- G06—COMPUTING; CALCULATING OR COUNTING
- G06Q—INFORMATION AND COMMUNICATION TECHNOLOGY [ICT] SPECIALLY ADAPTED FOR ADMINISTRATIVE, COMMERCIAL, FINANCIAL, MANAGERIAL OR SUPERVISORY PURPOSES; SYSTEMS OR METHODS SPECIALLY ADAPTED FOR ADMINISTRATIVE, COMMERCIAL, FINANCIAL, MANAGERIAL OR SUPERVISORY PURPOSES, NOT OTHERWISE PROVIDED FOR
- G06Q10/00—Administration; Management
- G06Q10/06—Resources, workflows, human or project management; Enterprise or organisation planning; Enterprise or organisation modelling
- G06Q10/063—Operations research, analysis or management
- G06Q10/0639—Performance analysis of employees; Performance analysis of enterprise or organisation operations
- G06Q10/06395—Quality analysis or management
Definitions
- the present invention relates to a technology of calculating and displaying a placed-order amount and an inventory amount which vary depending on timing of modifying a sales plan or lead time, to thereby support evaluations of the sales plan.
- Material Requirements Planning is a technique of material planning, which was proposed in the 1970s in the United States and has gained a broader range of application in recent years.
- the MRP method is intended to obtain, with respect to required items for a product, such as assemblies, components, and raw materials, a plan for purchasing or manufacturing necessary items in required quantities by a required deadline, based on a production plan or a sales plan prepared at product level, a bill of material, and information on inventory and placed-orders (remaining orders) or the like.
- a simulation system for calculating an inventory assets balance, in which a time point, based on which MRP calculation is performed, is moved forward, and MRP calculation is performed at each advanced time point to obtain an inventory quantity based on an incoming quantity/outgoing quantity and an inventory quantity at a previous time point, to thereby calculate how the inventory changes at each time point (refer to Japanese Patent Laid-open No. 2004-161437).
- the present invention has been made to solve the above-mentioned problems, and it is an object of the invention to provide a technique of giving support to making evaluations of impact on a business performance indicator, which varies depending on timing at which a change of plan is decided.
- the present invention provides a technique of obtaining impact on a business performance indicator, which varies depending on timing at which a sales plan is revised.
- a sales plan evaluation support system includes:
- MRP material requirements planning
- a first MRP calculating means which obtains a first order-placement plan through MRP calculation using the master information as input, the first order-placement plan including an ordered-item count and an order-placement date of a required item for the product;
- revision timing setting means which sets timing for revising the sales plan
- master modifying means which modifies the master information
- a second MRP calculating means which obtains a second order-placement plan through MRP calculation by using an order-placement plan having an order-placement date preceding the revision timing included in the first order-placement plan as an order-placement plan which has been implemented prior to the revision timing, and by using, as input, master information modified by the master modifying means, the second order-placement plan including an ordered-item count and an order-placement date of a required item for the product.
- FIG. 1 is a schematic structural diagram of a sales plan evaluation support system
- FIG. 2 is a flowchart of MRP calculation
- FIG. 3 is a diagram showing a configuration of an original master
- FIG. 4 is a diagram showing a configuration of a basic information file
- FIG. 5 is a diagram showing a configuration of an original order file
- FIG. 6 is a diagram showing a configuration of an original item list file
- FIG. 7 is another flowchart of the MRP calculation
- FIG. 8 is a diagram showing a configuration of a scenario file
- FIG. 9 is a diagram showing a scenario-basis master
- FIG. 10 is a diagram showing a method which creates a scenario-basis placed-order file
- FIG. 11 is a diagram showing a configuration of a result of scenario-basis MRP calculation
- FIG. 12 is a diagram showing a configuration of a summary table
- FIG. 13 is a display example of an impact degree on a business performance indicator evaluation graph
- FIG. 14 is another display example of the impact degree on a business performance indicator evaluation graph.
- FIG. 15 is a display example of an inventory causality graph.
- FIG. 1 is a schematic structural diagram of a sales plan evaluation support system 100 to which the embodiment of the present invention is applied.
- the sales plan evaluation support system 100 includes a device which gives support to a corporate manager, who manufactures and sells products, in making evaluations and revisions of sales plans.
- the system 100 gives support to the manager in deciding, in a case where the manager revises a procurement plan for components or revises various lead times, timing at which the revision should be made.
- the system 100 therefore includes a scenario for changing an original sales plan, and simulates impact on a business performance indicator obtained when the original sales plan is changed according to the scenario.
- the sales plan evaluation support system 100 receives, from the manager, settings and changes to be made to the scenario, and is capable of repeatedly performing the simulation.
- the sales plan evaluation support system 100 is configured by including, as a functional unit thereof, a material requirements planning (MRP) calculating part 110 , a scenario-basis master creating part 120 , a graphic chart creating part 130 , and a display processing part 140 .
- MRP material requirements planning
- the MRP calculating part 110 performs, based on an input of a predetermined file such as a sales plan file, a process of performing MRP calculation and outputting the calculation result. For example, the MRP calculating part 110 performs, based on an input from an original master 200 storing an original sales plan or the like, MRP calculation and outputs an original MRP calculation result 300 (original MRP calculating function 111 ). Also, the MRP calculating part 110 performs, based on an input from a scenario-basis master 500 storing a sales plan or the like obtained by changing the original sales plan according to the scenario, MRP calculation, and outputs a scenario-basis MRP calculation result 600 (scenario-basis MRP calculating function 112 ). The MRP calculating part 110 performs MRP calculation by a known method.
- the scenario-basis master creating part 120 performs a process of creating the scenario-basis master 500 which stores, for example, a sales plan corresponding to a scenario, by using a scenario file 400 which defines a change to be made to the sales plan, a part of the original MRP calculation result 300 (information relating to order-placement), and a part of the original master 200 (a sales plan, lead time, or the like).
- the graphic chart creating part 130 creates a table or a graph relating to business performance indicators (such as sales amount, inventory amount, in-progress amount, order amount, incoming quantity, etc.) by using the original MRP calculation result 300 and the scenario-basis MRP calculation result 600 .
- business performance indicators such as sales amount, inventory amount, in-progress amount, order amount, incoming quantity, etc.
- the display processing part 140 performs a process of displaying, on a display device, a table or a graph created by the graphic chart creating part 130 .
- the sales plan evaluation support system 100 is realized by a general-purpose computer system which is configured by including a central processing unit (CPU), a memory, an external storage device, an input device such as a keyboard, an output device such as a liquid crystal display device, and a bus for connecting those devices to one another.
- the CPU executes a predetermined program loaded into the memory, to thereby realize the above-mentioned functions and elements.
- the memory or the external storage device stores information and files.
- the output device or the input device may be directly connected to the CPU, or may be connected through a network.
- FIG. 2 is a flowchart of a process of performing MRP calculation based on an original sales plan or the like. The process flow is started in response to a request made by an operator through the input device to calculate a degree of impact on the business performance indicator obtained when the original sales plan is revised.
- the MRP calculating part 100 performs MRP calculation by a known method based on an input from the original master 200 , and outputs the calculation result (original MRP calculation result 300 ) (S 10 ).
- FIG. 3 is a diagram showing a configuration of the original master 200 which is used as a source of the input.
- the original master 200 includes an original sales plan file 210 , an original lead time file 220 , an original placed-order file 230 , and an initial inventory file 240 , and a basic information file 250 .
- information included in each of those files is described. However, all the information items may not actually exist, and may be omitted as deemed appropriate.
- the original sales plan file 210 stores original sales plans of products. Specifically, the sales plans are stored in such a manner that each of the sales plans is provided with a record, which is associated with a code (product CD) 211 for identifying the product, an item count 212 , a manufacture completion date 213 , and a model 214 .
- the item count 212 corresponds to the number of products to be completed.
- the manufacture completion date 213 corresponds to a date on which the manufacture of the product is completed.
- the product to be manufactured is affiliated with a model, and therefore, the model 214 stores a model with which the product is affiliated.
- the records are registered in chronological order by the manufacture completion date 213 .
- the original lead time file 220 stores information relating to a lead time necessary for procuring and assembling components which are required items for the product. Specifically, the information is stored in such a manner that each of the components is provided with a record, which is associated with a product CD 221 , a code (component CD) 222 for identifying the component, an item count 223 , a procurement lead time (procurement LT) 224 , and a manufacture lead time (manufacture LT) 225 .
- the product CD 221 corresponds to the product CD of a product for which the component is used.
- the item count 223 corresponds to the number of components to be used in the product.
- the procurement LT 224 corresponds to a time period which is necessary after an order is placed for the component until the component is put into storage.
- the product LT 225 corresponds to a time period which is necessary after the component in storage is delivered until the product using the component is assembled.
- the bill of material includes components arranged hierarchically in a plurality of different levels, in such a manner that the components are each categorized, for example, as an intermediate part for producing a product, or as a part for producing the intermediate part.
- the bill of material includes only one layer containing the components necessary for producing a product which are all associated with the product with the intermediate parts being omitted to reduce processing time.
- the lead time necessary for assembling the components is calculated in such a manner that the time necessary for assembling the components including the intermediate parts is summed so as to be calculated as a total manufacture lead time, to thereby obtain a manufacture lead time.
- the item count is also calculated in a similar manner with consideration given to the intermediate parts. For example, in a case where two of the intermediate parts are necessary for making one product, and another three parts are necessary for making each one of those intermediate parts, it is regarded that six components are necessary for creating one product, and therefore the item count is set to 6.
- the original placed-order file 230 stores information relating to a component for which an order has already been placed but is yet to be received to be put in storage. Specifically, the information is stored in such a manner that each order is provided with a record, which is associated with a component CD 231 , an incoming quantity 232 , an incoming date 233 , and an order-placement date 234 .
- the initial inventory file 240 stores information on inventory at a current time (a time when the operator has made a request to calculate a degree of impact on the business performance indicator based on the timing of the revision). Specifically, the information is stored in such a manner that each of the components is provided with a record, which is associated with a component CD 241 and an item count 242 in the inventory.
- the basic information file 250 stores basic information which is not subject to change even if the scenario is changed.
- the basic information file 250 includes, as shown in FIG. 4 , a model file 2510 , a year file 2520 , an amount file 2530 , and an item name file 2540 .
- the model file 2510 stores information relating to models to which products or components belong. Specifically, the information is stored in such a manner that each of the items is provided with a record, which is associated with a code (item CD) 2511 for identifying the item and a model 2512 .
- the products and the components are each referred to as “item”.
- the year file 2520 stores information relating to sectionalized periods obtained by dividing years by a predetermined time unit (for example, a week). Specifically, the information is stored in such a manner that each of the sectionalized periods is provided with a record, which is associated with a starting date 2521 of the sectionalized period, an ending date 2522 of the sectionalized period, and a date 2523 representing the sectionalized period (displayed as “date”) used when displaying the sectionalized period.
- a predetermined time unit for example, a week.
- the amount file 2530 stores information relating to amounts (unit prices) of items. Specifically, the information is stored in such a manner that each of the items is provided with a record, which is associated with an item CD 2531 and a unit price 2532 .
- the item name file 2540 stores information relating to names of the items. Specifically, each of the items is provided with a record, which is associated with an item CD 2541 and an item name 2542 .
- the original master 200 used for MRP calculation has been described.
- the original master 200 stores information items input by an operator through the input device. Those information items may be deleted and modified upon request of the operator.
- the MRP calculating part 110 performs MRP calculation, based on the information input from the original master 200 described above, and outputs the original MRP calculation result 300 which includes an original order file 310 and an original item list file 320 (refer to a flowchart of FIG. 2 ).
- FIG. 5 is a diagram showing a configuration of the original order file 310 .
- the original order file 310 stores information relating to orders placed for the components. Specifically, the information is stored in such a manner that each of the orders is provided with a record, which is associated with an Parent-Product-at-the-point-of-order CD 311 , a component CD 312 , an incoming quantity 313 , an incoming date 314 , an order-placement date 315 , and a flag 316 .
- the Parent-Product-at-the-point-of-order CD 311 corresponds to a product CD of a product for which an ordered component is used.
- the flag 316 stores a flag by which an order is distinguished as to whether the order has existed from the beginning or has been generated by the current MRP calculation. Specifically, the flag 316 stores “0” in a case where the order has already been included in the original placed-order file 230 , while the flag 316 stores “1” in a case where the order has been generated by the current MRP calculation.
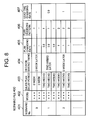
- FIG. 6 is a diagram showing a configuration of the original item list file 320 .
- the original item list file 320 stores, for each sectionalized period, a turnover result (with respect to, for example, an inventory quantity, an incoming quantity, an outgoing quantity, and an in-progress quantity) of each item (a product or a component).
- each item and sectionalized period is provided with a record, which is associated with a parent item CD 321 , an item CD 322 , an item name 323 , a model 324 , an ending date 325 , an inventory quantity 326 , an incoming quantity 327 , an outgoing quantity 328 , and an in-progress quantity 329 .
- the parent item CD 321 represents an item for which an item of the item CD 322 is used.
- the parent CD 321 corresponds to the code of the product.
- the parent CD 321 is used for identifying the component as to whether the component has been delivered or put in storage and also identifying a parent item for which the component is intended.
- items having different parent items are calculated as different items when compiling the item list file.
- the item name 323 includes item names of items in the item CD 322 .
- the item names are stored based on the item name file 2540 .
- the model 324 includes models with which items of the parent item 321 are affiliated. The models are stored based on the model file 2510 .
- the ending date 325 specifies the sectionalized period, and corresponds to the ending date 2522 of the year file 2520 .
- the inventory quantity 326 includes inventory quantities at dates related to the ending date 325 .
- the incoming quantity 327 includes quantities which have been put in storage up the ending date 325 of the sectionalized period.
- the outgoing quantity 328 includes quantities which have been delivered up to the ending date 325 of the sectionalized period.
- the in-progress quantity 329 stores quantities related to the ending date 325 .
- the in-progress quantity is generated in a case where, for example, the manufacture lead time is longer than one of the sectionalized periods in the year file 2520 .
- the product X is not completed in a week, despite the fact that the components A and B have already been delivered, and the product X is not put in storage until 8 days has elapsed (a second week).
- the in-progress quantity for the product X is generated in the first week.
- the MRP calculating part 110 performs MRP calculation based on the original sales plan or the like, and then performs a process of outputting another MRP calculation result obtained in a case where the sales plan or the like is changed in accordance with a scenario.
- FIG. 7 is a flowchart of the above-mentioned process.
- the MRP calculating part 110 acquires, from among the scenarios stored in the scenario file 400 , a scenario to be used for changing the original sales plan (S 11 ).
- FIG. 8 is a diagram showing a configuration of the scenario file 400 .
- the scenario file 400 stores information for changing the original sales plans which are stored in the original sales plan file 210 and the original lead times which are stored in the original lead time file 220 .
- the information is stored in such a manner that each of the scenarios for changing the original sales plans and the original lead times is provided with a record, which stores a scenario number 401 , a model 402 to which the scenario is to be applied, a sales plan delay period 403 , a decision making timing 404 , a plan changing rate 405 , a plan changing pattern 406 , and a lead time changing rate 407 .
- Each scenario may store a plurality of information items each relating to a plurality of models. However, each scenario has only one decision making timing 404 and one lead time changing rate 407 set thereto.
- the sales plan delay period 403 is a period by which the manufacture completion date 213 of the original sales plan is delayed.
- the decision making timing 404 defines timing at which the scenario is applied, by using the current time (that is, a time at which MRP calculation is performed with respect to the original sales plan or the like) as a reference.
- the decision making timing 404 is used in determining a quantity of placed-orders, among the orders obtained through the original MRP calculation.
- the plan changing rate 405 is a value to be used in changing the item count 212 of the original sales plan.
- the plan changing pattern 406 is a value to be used in changing the original sales plan.
- the lead time changing rate is a value to be used in changing the procurement/manufacture lead time.
- a scenario indicating the original sales plan or the like that is, a scenario that does not change the original sales plan or the like, is stored as “scenario 0”.
- the decision making timing for the “scenario 0” corresponds to the date on which the original sales plan file 210 and the initial inventory file 240 are created, that is, the reference date (first date) for the original MRP calculation.
- the information items stored in the scenario are input by the operator through the input device.
- the information items may be deleted or modified upon request of the operator.
- the scenario may not have all the information items stored, but merely have, for example, the decision making timing defined.
- the scenario-basis master creating part 120 selects a scenario from among the scenarios stored in the scenario file 400 . At this time, the scenario-basis master creating part 120 may select a scenario specified by the operator through the input device, or may select scenarios one at a time in sequence in ascending order of the scenario number (excepting “scenario 0”).
- scenario-basis master creating part 120 creates the scenario-basis master 500 (S 12 ).
- the scenario-basis master 500 basically has a configuration similar to that of the original master 200 , as shown in FIG. 9 .
- the scenario-basis master 500 includes a scenario-basis sales plan file 510 , a scenario-basis lead time file 520 , a scenario-basis placed-order file 530 , an initial inventory file 240 , and a basic information file 250 .
- Described in the following is a method by which the scenario-basis master creating part 120 creates each of the above-mentioned files. All the information items to be stored in the files need not be present, and may be omitted.
- the scenario-basis master creating part 120 creates a file to which the original sales plan file 210 is directly copied. Specifically, the scenario-basis master creating part 120 provisionally creates the scenario-basis sales plan file 510 which includes records, each storing a product CD 511 , an item count 512 , a manufacture completion date 513 , and a model 514 . After that, the item count 512 and the manufacture completion date 513 of each record are revised based on the model 402 , the sales plan delay period 403 , the plan changing rate 405 , and the plan changing pattern 406 of the scenario selected in advance, whereby the scenario-basis sales plan file 510 is completed.
- the scenario-basis master creating part 120 obtains, from the selected scenario, the plan changing rate 405 corresponding to the model 514 of the scenario-basis sales plan file 510 , and multiplies the item count 512 by the changing rate 405 thus obtained, to thereby revise the item count 512 .
- the scenario-basis master creating part 120 revises the manufacture completion date 513 based on the sales plan delay period 403 and the plan changing pattern 406 of the selected scenario.
- the plan changing pattern 406 includes, for example, any one of the three following patterns.
- Pattern 1 A sales plan is simply postponed by the sales plan delay period 403 . Specifically, the sales plan delay period 403 is added to the manufacture completion date 513 , to thereby revise the manufacture completion date 513 .
- Pattern 2 A sales plan in the sales plan delay period 403 is deleted, by considering that the orders for the sales plan delay period 403 have not been received. Specifically, first, the sales plan delay period 403 is added to an earliest manufacture completion date 513 of the manufacture completion dates 513 stored in the records in the scenario-basis sales plan file 510 , to thereby obtain an ending date of the sales plan delay period 403 . Then, the scenario-basis sales plan file 510 is searched in order to retrieve records having the manufacture completion dates 513 set so as to precede the ending date, and the retrieved records are deleted.
- Pattern 3 A sales plan for the sales plan delay period 403 is added after the lapse of the sales plan delay period 403 .
- the sales plan delay period 403 is added to an earliest manufacture completion date 513 of the manufacture completion dates 513 stored in the records in the scenario-basis sales plan file 510 , to thereby obtain an ending date of the sales plan delay period 403 .
- the records having the manufacture completion dates 513 set to precede the ending date are deleted.
- the item counts 512 of all the records thus deleted are added to the item count 512 of a first record (that is, a record having the manufacture completion date 513 immediately following the sales plan delay period 403 ) of the remaining records, to thereby revise the item count 512 of the first record.
- the scenario-basis master creating part 120 creates a file to which the original lead time file 220 is directly copied. Specifically, the scenario-basis master creating part 120 creates a file which includes records each storing a product CD 521 , a component CD 522 , an item count 523 , a procurement LT 524 , and a manufacture LT 525 . Further, the procurement LT 524 and the manufacture LT 525 included in the file thus created are each multiplied by the lead time changing rate 407 of the scenario selected in advance, whereby a process of revising the procurement LT 524 and the manufacture LT 525 is performed.
- the scenario-basis master creating part 120 extracts, from among the records stored in the original order file 310 , records each having an order-placement date 315 which is set to precede the decision making timing 404 of the selected scenario. Then, the records thus extracted are compiled, to thereby create the scenario-basis placed-order file 530 which includes records each storing an Parent-Product-at-the-point-of-order CD 531 , a component CD 532 , an incoming quantity 533 , an incoming date 534 , an order-placement date 535 , and a flag 536 .
- the initial inventory file 240 and the basic information file 250 are similar to those of the original master 200 , and not subject to change.
- the scenario-basis master creating part 120 may receive detailed settings for a scenario-basis MRP creation file 500 from the operator through the input device. For example, the scenario-basis master creating part 120 receives a request to make a change only to a certain item in terms of procurement LT and manufacture LT, or in terms of sales plan, and modifies the certain item accordingly. In this manner, it is possible to evaluate a degree of impact on the business performance indicator in various ways.
- the MRP calculating part 100 performs MRP calculation based on an input from the scenario-basis master 500 , and outputs the scenario-basis MRP calculation result 600 (S 13 of FIG. 7 ).
- the scenario-basis MRP calculation result 600 includes, as shown in FIG. 11 , a scenario-basis order file 610 and a scenario-basis item list file 620 .
- the scenario-basis order file 610 stores, similarly to the original order file 310 , information relating to the orders placed for the components. Specifically, the information is stored in such a manner that each order is provided with a record, which is associated with a Parent-Product-at-the-point-of-production CD 611 , an Parent-Product-at-the-point-of-order CD 612 , a component CD 613 , an incoming quantity 614 , an incoming date 615 , an order-placement date 616 , and a flag 617 .
- the applied-usage CD 611 corresponds to a code of a product for which the ordered component is to be used in a case where the product is manufactured according to the selected scenario.
- the Parent-Product-at-the-point-of-order CD 612 corresponds to a code for a product for which the component was supposed to be used in the original sales plan.
- the flag 617 indicates when the order is generated. Specifically, the flag 617 stores “0” in a case where the order has already existed before the original MRP calculation, stores “1” in a case where the order is additionally placed based on a result of the MRP calculation of the original sales plan, and stores “2” in a case where the order is additionally placed based on a result of the scenario-basis MRP calculation performed at this time.
- the scenario-basis item list file 620 has a configuration similar to that of the original item list file 320 . Specifically, the scenario-basis item list file 620 stores, for each sectionalized period, information relating to a turnover result (with respect to, for example, an inventory quantity, an incoming quantity, an outgoing quantity, and an in-progress quantity) of each item (a product or a component). In other words, each record is stored in association with a parent item CD 621 , an item CD 622 , an item name 623 , a model 624 , an ending date 625 , an inventory quantity 626 , an incoming quantity 627 , an outgoing quantity 628 , and an in-progress quantity 629 .
- the original MRP calculation result 300 and the scenario-basis MRP calculation result 600 are outputted as described above. Then, based on the information, the graphic chart creating part 130 creates a summary table, a graph for evaluating a degree of impact on business performance indicator (hereinafter, referred to as impact degree on business performance indicator evaluation graph), and an inventory causality graph, and outputs the table and the graphs to the display device or the like, through the display processing part 140 .
- impact degree on business performance indicator evaluation graph a graph for evaluating a degree of impact on business performance indicator
- inventory causality graph an inventory causality graph
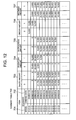
- FIG. 12 shows an example of the summary table 700 .
- the summary table 700 the business performance indicators for the respective sectionalized periods are summarized with respect to each model.
- the summary table 700 is configured by listing, for example, a model 701 , an ending date 702 of the sectionalized period, a sales amount 703 , an inventory amount 704 , an in-progress amount 705 , an order amount 706 , and an incoming amount 707 .
- the summary table 700 of FIG. 12 collectively shows data for those items obtained from both the original sales plan and the changed sales plan according to the selected scenario.
- the business performance indicator may be summarized for each model, or may be summarized, as shown in FIG. 12 , for a specific model, for other models, and for a total of all the models, respectively.
- the sales amount 703 is obtained by multiplying the outgoing quantity for each product stored in the original item list file 320 or in the scenario-basis item list file 620 , by a unit price of the product.
- the unit price of the product is obtained by acquiring a unit price 2532 corresponding to the item CD 2531 of the product, based on the amount file 2530 .
- the inventory amount 704 is obtained by multiplying the inventory quantity of each item in the original item list file 320 or in the scenario-basis item list file 620 by a unit price thereof and by summing up the inventory amounts thus obtained for each item.
- the in-progress amount 705 is obtained by multiplying the in-process quantity of each product stored in the original item list file 320 or in the scenario basis item list file 620 by a unit price of the product.
- the order amount 706 is obtained by multiplying the incoming quantity of each item stored in the order files 310 and 610 by a unit price of the item and by summing up the order amounts thus obtained for each item.
- the incoming amount 707 is obtained by multiplying each of the numbers of items stored in the item list files 320 and 620 by the corresponding unit price and by summing up the inventory amount thus obtained for each item.
- the business performance indicator is obtained for each model by adding up the sales amounts, the inventory amounts, the in-progress amounts, and the incoming amounts of products belonging to the same model.
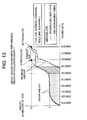
- the graphic chart creating part 130 creates the impact degree on business performance indicator evaluation graph in response to a request from the operator, and displays the graph on a display device or the like through the display processing part 140 .
- FIG. 13 is a graph created based on the information included in the summary table 700 of FIG. 12 .
- the graphic chart creating part 130 creates a graph which has the ending date (ending date of the sectionalized period) or the date on the abscissa axis and the amount on the vertical axis.
- the graph is created by including the sales amount, the order amount, and the incoming amount, which are the sum values of the respective periods, and the inventory amount and in-progress amount, which correspond to the amounts of the ending date.
- the decision making timing is also displayed.
- the items may selectively be displayed on the graph, as necessary.
- the thin line indicates the original sales plan (scenario 0), and the bold line indicates the scenario 1.
- the vertical solid line indicates a product delivery date (i.e., the manufacture completion date of the product) and the vertical dashed line indicates the decision making timing.
- the placed-order amount on 22 Jan. is about 3 million yen, which drastically increases to 8 million yen, which is more than double, on 29 Jan. It is understood from the graph that if the sales plan had been revised earlier and the decision to change the sales plan had been made on 22 Jan. there would have been no need to place additional orders until at least 5 February, and the placed-order amount would not have been increased from the original amount (of about 3 million yen).
- the item count in this sales plan is not changed and therefore the received items are eventually delivered.
- the inventory amount may increase due to the order placed for the extra number of components according to an older sales plan because of the delay in the decision making timing.
- a change in design is often made. Accordingly, if the inventory amount is made redundant as described above, some of the components may not be consumed due to the change in design, and therefore there remains no choice but to discard the redundant components.
- the order-placement amount (placed-order amount and planned-order amount) is displayed in the graph as shown in FIG. 13 , which makes it possible to identify the timing for making a decision to revise and to modify the plan.
- the vertical lines are additionally provided for the respective decision making timings so as to separately display each range defined by the vertical lines, to thereby make it possible to identify the decision making timing for revising the plan.
- FIG. 14 is another impact degree on business performance indicator evaluation graph, which is created by the graphic chart creating part 130 .
- the graphic chart creating part 130 displays the order amount, the sales amount, and the inventory amount in a graph, based on the summary table 700 .
- the graph has the abscissa axis showing period and the vertical axis showing amount, and displays the original sales plan and the revised sales plan according to the scenario as being compared with each other.
- FIG. 14 is an impact degree on business performance indicator evaluation graph, which shows how the sales amount, the order amount, and the inventory amount change in a case where a certain plan (scenario 0) is revised after the lapse of two weeks and the revised plan (scenario 1) is executed.
- the above-mentioned graph shows information relating to only two scenarios (the original scenario and scenario 1) for explanation.
- the graphic chart creating part 130 may create, however, a summary table including information items relating to three or more scenarios, which may also be displayed as a graph.
- the information displayed in the graph which includes all the business performance indicators (sales amount, inventory amount, in-progress amount, order amount, incoming amount), which may affect the decision making.
- the items may be selectively displayed on the graph in accordance with a designation of the operator.
- FIG. 15 is a graph created by the graphic chart creating part 130 , which shows inventory causality.
- the inventory causality graph shows information on a certain component “a”, the information including: a product for which the component “a” has been ordered; a product in which the component “a” is actually assembled; and a product for which the component “a” is in the inventory.
- the reason for which inventory is remaining for example, a product, for which components increased, has been subject to a change of plan, or the like
- the graphic chart creating part 130 creates the inventory causality graph with the abscissa axis of date and the vertical axis of amount (or inventory amount), by using information included in the scenario-basis placed-order file 610 and the scenario-basis item list file 620 .
- FIG. 15 shows an exemplary case where the same component is used for two different products.
- a case is assumed where a product X and a product Y both use the component “a”, and the procurement plans for both the product X and the product Y have been changed, leading to a great increase of the inventory amount of the component “a”.
- it has conventionally been difficult to analyze the cause of the increase of the inventory as to which of the changes made to the product X and the product Y is late, for which the component “a” has been excessively purchased as a result.
- the scenario information has a plan changing rate 405 set thereto, for changing the sales plan for the products X to decrease the number thereof while increasing the number of the products Y.
- the components “a” which have been ordered for the product Y based on the information included in the original order file 310 obtained by the original MRP calculation have run out in the middle of the calculation while the component “a” is still needed for the assembly of the product Y.
- a check is made as to whether the components “a” ordered for another product (product X in this case) are still remaining before placing a new order for the product Y, and in a case where the components “a” are still remaining, the components “a” for which the order has already been placed are used for the product Y.
- the applied-usage CD 611 corresponds to the product Y
- the Parent-Product-at-the-point-of-order CD 612 corresponds to the product X.
- “order for product X” on the graph can be obtained by multiplying the incoming amount 614 of components having the Parent-Product-at-the-point-of-order CD 612 corresponding to the product X in the scenario-basis order file 610 , by the unit price thereof.
- the incoming date 615 is referred to as the date.
- “Used for the assembly of product X” on the graph can be obtained by multiplying the incoming amount of components having the Parent-Product-at-the-point-of-production CD 611 corresponding to the product X by the unit price thereof.
- the incoming date 615 is referred to as the date.
- the inventory amount of the components “a” in the graph is created based on the information included in the scenario-basis item list file 620 . Specifically, the inventory amount of the components “a” is calculated by multiplying the inventory amount of the component shaving the item CD 622 corresponding to the component “a” and the parent item CD 621 corresponding to the product X or the product Y, by the unit price thereof.
- the ending date 625 is used as the date.
- the above-mentioned information items are accumulated, and changes in the inventory amount obtained based on the Parent-Product-at-the-point-of-order and the Parent-Product-at-the-point-of-production of each product and on the scenario-basis item list file 620 are lined up on a graph, thereby making it possible to easily identify which one of the changes made to the sales plans of which product is causing the increase in the inventory amount.
- the manager sets, as the scenario information, timing to change the sales plan or the lead time, thereby making it possible to readily evaluate with ease the degree of impact, in terms of the ordered amount and the inventory amount, on the business performance. Also, with reference to the curved line of the order amount of the impact degree on business performance indicator evaluation graph, it is possible to identify, in advance, the need to revise the plan in the period during which the order amount is high, and with reference to the inventory causality graph, it is possible to analyze, in advance, the reason why the components become redundant in inventory, which makes it possible to take measures to prevent deterioration in the business performance.
- the scenario-basis master creating part 120 may display, on the display device, a screen for receiving a request to change the scenario. Then, after the operator has specified the scenario number to modify, the changes to be made are received and the scenario is changed accordingly. After that, the scenario thus modified may be subject to the process of S 12 and the rest of the processes following S 12 of FIG. 7 .
Landscapes
- Business, Economics & Management (AREA)
- Human Resources & Organizations (AREA)
- Engineering & Computer Science (AREA)
- Economics (AREA)
- Strategic Management (AREA)
- Entrepreneurship & Innovation (AREA)
- Development Economics (AREA)
- Educational Administration (AREA)
- Operations Research (AREA)
- Marketing (AREA)
- Quality & Reliability (AREA)
- Tourism & Hospitality (AREA)
- Physics & Mathematics (AREA)
- General Business, Economics & Management (AREA)
- General Physics & Mathematics (AREA)
- Theoretical Computer Science (AREA)
- Game Theory and Decision Science (AREA)
- Accounting & Taxation (AREA)
- Finance (AREA)
- Management, Administration, Business Operations System, And Electronic Commerce (AREA)
Abstract
Description
Claims (7)
Applications Claiming Priority (2)
| Application Number | Priority Date | Filing Date | Title |
|---|---|---|---|
| JP2006226399A JP2008052413A (en) | 2006-08-23 | 2006-08-23 | Evaluation support system for sales plan |
| JP2006-226399 | 2006-08-23 |
Publications (2)
| Publication Number | Publication Date |
|---|---|
| US20080052143A1 US20080052143A1 (en) | 2008-02-28 |
| US8046252B2 true US8046252B2 (en) | 2011-10-25 |
Family
ID=39197805
Family Applications (1)
| Application Number | Title | Priority Date | Filing Date |
|---|---|---|---|
| US11/769,827 Expired - Fee Related US8046252B2 (en) | 2006-08-23 | 2007-06-28 | Sales plan evaluation support system |
Country Status (2)
| Country | Link |
|---|---|
| US (1) | US8046252B2 (en) |
| JP (1) | JP2008052413A (en) |
Cited By (2)
| Publication number | Priority date | Publication date | Assignee | Title |
|---|---|---|---|---|
| US8502869B1 (en) * | 2008-09-03 | 2013-08-06 | Target Brands Inc. | End cap analytic monitoring method and apparatus |
| US8744890B1 (en) | 2013-02-14 | 2014-06-03 | Aktana, Inc. | System and method for managing system-level workflow strategy and individual workflow activity |
Families Citing this family (3)
| Publication number | Priority date | Publication date | Assignee | Title |
|---|---|---|---|---|
| EP2443574A4 (en) * | 2009-06-19 | 2014-05-07 | Blekko Inc | Scalable cluster database |
| JP5738779B2 (en) * | 2012-01-30 | 2015-06-24 | 株式会社日立製作所 | Supply capability estimation system, method, and program |
| JP6844304B2 (en) * | 2017-02-23 | 2021-03-17 | 沖電気工業株式会社 | Demand forecast model evaluation device, demand forecast model evaluation method and demand forecast model evaluation program |
Citations (6)
| Publication number | Priority date | Publication date | Assignee | Title |
|---|---|---|---|---|
| JPH06143105A (en) | 1992-10-30 | 1994-05-24 | Nippon Steel Corp | Production control system |
| JPH1125181A (en) | 1997-07-04 | 1999-01-29 | Nec Corp | Material requirement development system |
| US5953707A (en) * | 1995-10-26 | 1999-09-14 | Philips Electronics North America Corporation | Decision support system for the management of an agile supply chain |
| US20020116282A1 (en) * | 2000-05-23 | 2002-08-22 | Martin Jeffrey W. | Methods and systems for correlating consumption information with distribution entities |
| JP2004161437A (en) | 2002-11-13 | 2004-06-10 | Hitachi Ltd | Simulation method, system, program, and recording medium for inventory assets and turnover rate of inventory assets |
| US20070016494A1 (en) * | 2005-06-27 | 2007-01-18 | 3M Innovative Properties Company | Methods of adjusting sales plans |
Family Cites Families (1)
| Publication number | Priority date | Publication date | Assignee | Title |
|---|---|---|---|---|
| JP4435603B2 (en) * | 2004-02-27 | 2010-03-24 | 三菱電機株式会社 | Material arrangement risk management system |
-
2006
- 2006-08-23 JP JP2006226399A patent/JP2008052413A/en active Pending
-
2007
- 2007-06-28 US US11/769,827 patent/US8046252B2/en not_active Expired - Fee Related
Patent Citations (6)
| Publication number | Priority date | Publication date | Assignee | Title |
|---|---|---|---|---|
| JPH06143105A (en) | 1992-10-30 | 1994-05-24 | Nippon Steel Corp | Production control system |
| US5953707A (en) * | 1995-10-26 | 1999-09-14 | Philips Electronics North America Corporation | Decision support system for the management of an agile supply chain |
| JPH1125181A (en) | 1997-07-04 | 1999-01-29 | Nec Corp | Material requirement development system |
| US20020116282A1 (en) * | 2000-05-23 | 2002-08-22 | Martin Jeffrey W. | Methods and systems for correlating consumption information with distribution entities |
| JP2004161437A (en) | 2002-11-13 | 2004-06-10 | Hitachi Ltd | Simulation method, system, program, and recording medium for inventory assets and turnover rate of inventory assets |
| US20070016494A1 (en) * | 2005-06-27 | 2007-01-18 | 3M Innovative Properties Company | Methods of adjusting sales plans |
Non-Patent Citations (2)
| Title |
|---|
| Grant et al (Examining sales force performance in organizations that use behavior-based sales management processes), Feb. 1999, Industrial Marketing Management, vol. 25, Issue 5, pp. 361-371. * |
| Thome et al (Innovative Sales Planning and Management: A Framework Proposition), Jan. 2007, Innovative Marketing, vol. 3, pp. 1-15. * |
Cited By (3)
| Publication number | Priority date | Publication date | Assignee | Title |
|---|---|---|---|---|
| US8502869B1 (en) * | 2008-09-03 | 2013-08-06 | Target Brands Inc. | End cap analytic monitoring method and apparatus |
| US9838649B2 (en) | 2008-09-03 | 2017-12-05 | Target Brands, Inc. | End cap analytic monitoring method and apparatus |
| US8744890B1 (en) | 2013-02-14 | 2014-06-03 | Aktana, Inc. | System and method for managing system-level workflow strategy and individual workflow activity |
Also Published As
| Publication number | Publication date |
|---|---|
| JP2008052413A (en) | 2008-03-06 |
| US20080052143A1 (en) | 2008-02-28 |
Similar Documents
| Publication | Publication Date | Title |
|---|---|---|
| US6119102A (en) | MRP system with viewable master production schedule | |
| US20050131779A1 (en) | Production scheduling system | |
| US20080172287A1 (en) | Automated Domain Determination in Business Logic Applications | |
| Karim et al. | An on-time delivery improvement model for manufacturing organisations | |
| US20120150576A1 (en) | Integrating simulation and forecasting modes in business intelligence analyses | |
| US20040148209A1 (en) | System and method for producing an infrastructure project estimate for information technology | |
| US20080172348A1 (en) | Statistical Determination of Multi-Dimensional Targets | |
| JP2004501447A (en) | How to model maintenance systems | |
| US20100125487A1 (en) | System and method for estimating settings for managing a supply chain | |
| US8046252B2 (en) | Sales plan evaluation support system | |
| JP2007323680A (en) | Management decision support system | |
| JP2004021364A (en) | Management intention decision support system | |
| EP1628251A1 (en) | Product availability check at a predetermined time. | |
| US8050957B2 (en) | Systems and methods for planning demand for configurable products | |
| US20090048889A1 (en) | Manufacturing portfolio flexibility planning | |
| US20140379417A1 (en) | System and Method for Data Quality Business Impact Analysis | |
| WO2001016838A2 (en) | Project management, scheduling system and method | |
| US20060047562A1 (en) | Method and apparatus for planning marketing scenarios | |
| JP7125491B2 (en) | mechanical analysis | |
| JPH113101A (en) | Logistics chain simulation system | |
| JP6067630B2 (en) | Profit / loss prediction apparatus and profit / loss prediction program | |
| JP2002297958A (en) | Daily delivery goods ordering optimization support system, its method and program | |
| US20100205225A1 (en) | Method and Apparatus for Transforming a Process | |
| EP1750225A1 (en) | Supply scheduling | |
| US8050958B2 (en) | Systems and methods for planning demand for configurable products |
Legal Events
| Date | Code | Title | Description |
|---|---|---|---|
| AS | Assignment |
Owner name: HITACHI, LTD., JAPAN Free format text: ASSIGNMENT OF ASSIGNORS INTEREST;ASSIGNORS:URANO, MAHO;TAGUCHI, KENTARO;SIGNING DATES FROM 20070614 TO 20070619;REEL/FRAME:019630/0887 Owner name: HITACHI, LTD., JAPAN Free format text: ASSIGNMENT OF ASSIGNORS INTEREST;ASSIGNORS:URANO, MAHO;TAGUCHI, KENTARO;REEL/FRAME:019630/0887;SIGNING DATES FROM 20070614 TO 20070619 |
|
| ZAAA | Notice of allowance and fees due |
Free format text: ORIGINAL CODE: NOA |
|
| ZAAB | Notice of allowance mailed |
Free format text: ORIGINAL CODE: MN/=. |
|
| STCF | Information on status: patent grant |
Free format text: PATENTED CASE |
|
| FEPP | Fee payment procedure |
Free format text: PAYOR NUMBER ASSIGNED (ORIGINAL EVENT CODE: ASPN); ENTITY STATUS OF PATENT OWNER: LARGE ENTITY |
|
| FPAY | Fee payment |
Year of fee payment: 4 |
|
| MAFP | Maintenance fee payment |
Free format text: PAYMENT OF MAINTENANCE FEE, 8TH YEAR, LARGE ENTITY (ORIGINAL EVENT CODE: M1552); ENTITY STATUS OF PATENT OWNER: LARGE ENTITY Year of fee payment: 8 |
|
| FEPP | Fee payment procedure |
Free format text: MAINTENANCE FEE REMINDER MAILED (ORIGINAL EVENT CODE: REM.); ENTITY STATUS OF PATENT OWNER: LARGE ENTITY |
|
| LAPS | Lapse for failure to pay maintenance fees |
Free format text: PATENT EXPIRED FOR FAILURE TO PAY MAINTENANCE FEES (ORIGINAL EVENT CODE: EXP.); ENTITY STATUS OF PATENT OWNER: LARGE ENTITY |
|
| STCH | Information on status: patent discontinuation |
Free format text: PATENT EXPIRED DUE TO NONPAYMENT OF MAINTENANCE FEES UNDER 37 CFR 1.362 |
|
| FP | Lapsed due to failure to pay maintenance fee |
Effective date: 20231025 |