US7280921B2 - Method for visualizing large-scale protein interaction data - Google Patents
Method for visualizing large-scale protein interaction data Download PDFInfo
- Publication number
- US7280921B2 US7280921B2 US10/290,432 US29043202A US7280921B2 US 7280921 B2 US7280921 B2 US 7280921B2 US 29043202 A US29043202 A US 29043202A US 7280921 B2 US7280921 B2 US 7280921B2
- Authority
- US
- United States
- Prior art keywords
- nodes
- node
- interaction data
- protein interaction
- graph
- Prior art date
- Legal status (The legal status is an assumption and is not a legal conclusion. Google has not performed a legal analysis and makes no representation as to the accuracy of the status listed.)
- Expired - Fee Related, expires
Links
Images


Classifications
-
- G—PHYSICS
- G06—COMPUTING OR CALCULATING; COUNTING
- G06T—IMAGE DATA PROCESSING OR GENERATION, IN GENERAL
- G06T17/00—Three dimensional [3D] modelling, e.g. data description of 3D objects
-
- C—CHEMISTRY; METALLURGY
- C40—COMBINATORIAL TECHNOLOGY
- C40B—COMBINATORIAL CHEMISTRY; LIBRARIES, e.g. CHEMICAL LIBRARIES
- C40B30/00—Methods of screening libraries
- C40B30/04—Methods of screening libraries by measuring the ability to specifically bind a target molecule, e.g. antibody-antigen binding, receptor-ligand binding
-
- G—PHYSICS
- G01—MEASURING; TESTING
- G01N—INVESTIGATING OR ANALYSING MATERIALS BY DETERMINING THEIR CHEMICAL OR PHYSICAL PROPERTIES
- G01N33/00—Investigating or analysing materials by specific methods not covered by groups G01N1/00 - G01N31/00
- G01N33/48—Biological material, e.g. blood, urine; Haemocytometers
- G01N33/50—Chemical analysis of biological material, e.g. blood, urine; Testing involving biospecific ligand binding methods; Immunological testing
- G01N33/68—Chemical analysis of biological material, e.g. blood, urine; Testing involving biospecific ligand binding methods; Immunological testing involving proteins, peptides or amino acids
- G01N33/6803—General methods of protein analysis not limited to specific proteins or families of proteins
- G01N33/6845—Methods of identifying protein-protein interactions in protein mixtures
-
- G—PHYSICS
- G16—INFORMATION AND COMMUNICATION TECHNOLOGY [ICT] SPECIALLY ADAPTED FOR SPECIFIC APPLICATION FIELDS
- G16B—BIOINFORMATICS, i.e. INFORMATION AND COMMUNICATION TECHNOLOGY [ICT] SPECIALLY ADAPTED FOR GENETIC OR PROTEIN-RELATED DATA PROCESSING IN COMPUTATIONAL MOLECULAR BIOLOGY
- G16B20/00—ICT specially adapted for functional genomics or proteomics, e.g. genotype-phenotype associations
-
- G—PHYSICS
- G16—INFORMATION AND COMMUNICATION TECHNOLOGY [ICT] SPECIALLY ADAPTED FOR SPECIFIC APPLICATION FIELDS
- G16B—BIOINFORMATICS, i.e. INFORMATION AND COMMUNICATION TECHNOLOGY [ICT] SPECIALLY ADAPTED FOR GENETIC OR PROTEIN-RELATED DATA PROCESSING IN COMPUTATIONAL MOLECULAR BIOLOGY
- G16B45/00—ICT specially adapted for bioinformatics-related data visualisation, e.g. displaying of maps or networks
Definitions
- the present invention relates to a method of visualizing protein interaction data into a three-dimensional graph.
- a java applet program was developed by Mrowka (2001) for visualization of protein interactions, and was tested on yeast two-hybrid (Y2H) data (Uetz et al., 2000).
- Y2H yeast two-hybrid
- This program has several disadvantages as follows.
- the program requires all protein interaction data to be provided as parameters of the applet program in html sources. There is no way to save a visualized graph except by capturing the window. Also, images captured from the window are static and typically of low quality, and cannot be refined or changed later to reflect an update in data. Further, a user can move a node, but cannot select or save a connected component containing a specific protein for further use.
- PSIMAP Park et al., 2001; and Lappe et al., 2001
- AGD www.mpi-sb.mpg.de/AGD/
- AGD is another general-purpose drawing tool. Because of being a general-purpose drawing tool, despite being powerful, AGD does not provide a function required for studying protein-protein interactions. For example, most protein interaction data including Y2H data yields a disconnected graph consisting of many connected components, which is also a non-planar graph with a large number of edge crossings not removable in a two-dimensional drawing. The graph can be analyzed by working on individual connected components or subgraphs containing a specific protein. Alternatively, the non-planar graph can be visualized into a three-dimensional graph with no edge crossings. However, because AGD doesn't provide these functionalities, it is difficult to analyze the graph.
- the graph-drawing programs are problematic in terms of not querying a database and directly visualizing query results from the database. Since they require input data in a specific format for visualization, a user has to convert data into the format. In addition, protein interaction data is generally updated with the passage of time, but the conventional programs cannot reflect the updated data on the visualization.
- the conventional graph-drawing tools have problems in visualizing protein interactions as follows. They draw a complex graph with a large number of edge crossings or a static graph difficult to revise. Also, they are too slow in performing interactive work with a large volume of data. Further, they can visualize protein interaction data only when the data is input in a specific format, because of not being capable of directly reading data from a protein interaction database.
- the objective of the present invention to provide a new method of visualizing large-scale protein interaction networks into a three-dimensional drawing.
- the present invention aims to provide a new force-directed algorithm capable of visualizing protein interactions at a faster speed than the conventional algorithms, being used in interactive analysis, directly visualizing query results from a protein interaction database in a three-dimensional space, and revising or navigating visualized networks at a later time.
- FIG. 1 describes algorithm Layout of a method for visualization according to the present invention
- FIGS. 2 a and 2 b show displacements of a node v due to local forces between adjacent nodes
- FIG. 3 illustrates an example of an initial layout for a graph with 473 nodes
- FIG. 4 describes an algorithm for initial layout
- FIG. 5 is a subgraph tree list
- FIG. 6 illustrates the result of drawing a subgraph O of FIG. 5 in a three-dimensional space
- FIG. 7 shows an example of analysis of protein-protein interaction
- FIG. 8 is a simplified graph of FIG. 6 ;
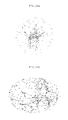
- FIGS. 9 a to 9 d illustrate results of visualizing Y2H data, by InterViewer ( FIG. 9 a ), Pajek (Fruchterman and Reingold's layout) ( FIG. 9 b ), Tulip (GEM layout) ( FIG. 9 c ), and Tulip (Speing-Electrical Force layout) ( FIG. 9 d );
- FIGS. 10 a to 10 d illustrate results of visualizing MIPS genetic interaction data, by InterViewer ( FIG. 10 a ), Pajek (Fruchterman and Reingold's layout) ( FIG. 10 b ), Tulip (GEM layout) ( FIG. 10 c ), and Tulip (Speing-Electrical Force layout) ( FIG. 10 d );
- FIGS. 11 a to 11 d illustrate results of visualizing MIPS physical interaction data, by InterViewer ( FIG. 11 a ), Pajek (Fruchterman and Reingold's layout) ( FIG. 11 b ), Tulip (GEM layout) ( FIG. 11 c ), and Tulip (Speing-Electrical Force layout) ( FIG. 11 d ); and
- FIG. 12 is a process of finding connected components.
- the present invention is directed to a method of visualizing effectively large-scale protein interaction data on a display by use of a computer, which yields a graph using proteins as nodes and interactions between proteins as edges, comprising the steps of (1) producing an initial layout by placing all proteins of protein interaction data as nodes on the surface of a sphere by increasing a horizontal angle (theta) and a vertical angle (phi) of each node in polar coordinates as described in the following algorithm:
- the method is characterized in that the number of the iteration of Step 2 can be changed by a user, and of communicating with database storing the protein interaction data.
- the method further comprises the step (Step 3 ) of simplifying the graph by limiting distance level of neighboring nodes to a predetermined distance, for nodes selected by a user.
- MIPS genetic interaction data contains over 100 connected components; (2) the data generates a non-planar graph with a large number of edge crossings that cannot be removed in a two-dimensional graph; (3) since different proteins have very different numbers of interacting proteins within a set of data, a graph visualizing the data contains nodes of very high degree as well as nodes of a low degree of interaction; (4) the data often contains protein interactions corresponding to self-loops; and (5) the data contains multiple interactions for an identical protein pair of proteins.
- the interactions corresponding to self-loops are stored in the edge table of the database, but ignored during visualization in order to simplify the drawing process and produce clear graphs. If the original protein interaction database contains multiple entries for an identical edge, the interactions are stored once in a local database.
- Protein interaction networks visualized by the program according to the present invention can be stored in an image file, the local database or a text file in GML format (Himsolt, 1997).
- GML Graph Modeling Language
- Saving a graph in GML format is advantageous in terms of reviewing a previously calculated graph by loading its GML file.
- the present invention provides a method of visualizing large-scale protein interaction data through a new force-directed algorithm capable of significantly improving the speed dealing with data and the visual clarity of graphs. Based on Walshaw's algorithm (2000), the method for visualization according to present invention is obtained by modifying Walshaw's algorithm.
- FIG. 1 describes a layout algorithm according to the present invention.
- Walshaw's algorithm is problematic in terms of not yielding a desired result when a graph contains a dense subgraph with nodes of very high degree.
- Walshaw's algorithm iteratively computes node positions until size of the graph falls below a certain threshold value, thus causing unnecessary iteration of the algorithm without improving the entire layout. Therefore, the algorithm according to the present invention employs a different termination condition from Walshaw's algorithm, which is 20 iterations by default. The value of 20 was selected empirically based on comparative experiments, and the number of the iterations can be increased through a user interface (line 16 ).
- the node positions are updated based on global spring forces between non-adjacent nodes (line 8 ) as well as local spring forces between adjacent nodes (line 10 ).
- FIGS. 2 a and 2 b show displacements of a node v due to local forces between adjacent nodes.
- node v is connected to 3 nodes, and the force on v from any one (u) of the 3 adjacent nodes moves v along the line passing through v and u.
- the aggregate force imposed by all adjacent nodes moves v to the equilibrium position, as shown in FIG. 2 b.
- the present invention employs an algorithm for initial layout.
- the conventional force-directed graph drawing algorithms begin by randomly placing all nodes of a graph in a two-dimensional plane or three-dimensional space, and then successively refines an initial layout by optimization methods to find a layout with the minimum energy.
- the initial layout contains overlapping nodes or nodes in the same plane, the computation to relocate them is often increased.
- nodes are placed on the surface of a sphere by increasing both the horizontal and vertical angles of polar coordinates. This method minimizes the number of times of placing nodes in a plane.
- FIG. 3 illustrates an example of an initial layout for a graph with 473 nodes, while an algorithm for initial layout is outlined in FIG. 4 .
- a drawing tool implemented using the method for visualization according to the present invention it is possible to find subgraphs and then work on individual subgraphs. Due to the size or nature of protein interaction networks, it should be possible to find subgraphs (such as connected components of a disconnected graph or subgraphs of proteins interacting with a certain protein) and to work on individual subgraphs.
- the procedure of finding a connected component can be applied to all nodes to obtain a complete list of connected components (see, FIG. 12 ). As shown in FIG. 5 for an example, the list shows the total number of connected components as well as the size, nodes and edges of each connected component.
- FIG. 5 lists the connected components of MIPS genetic interaction data, which contains 1093 interactions between 888 proteins, excluding multiple interactions between an identical pair of proteins.
- the left window shows all connected components of MIPS genetic interaction data.
- When a user clicks a connected component all edges of the connected components are displayed on the right window.
- subgraph O is the largest with 531 nodes and 807 edges, as well as 2 self-loops.
- FIG. 6 displays subgraph O visualized by InterViewer, which seems to have edge crossings, but actually has no edge crossing when being visualized into a three-dimensional drawing on a video monitor.
- FIG. 7 shows an example for analysis of protein-protein interactions, in which the first window shows the number of proteins common in every pair of function groups and the number of internal interactions in each group. If the user clicks a row in the first window, the relation of proteins and function groups is shown in a Venn diagram.
- the diagram in the second window indicates that 35 proteins have the function ‘aa’ (amino-acid metabolism), 46 proteins have the function of ‘cc’ (cell cycle control), and 3 proteins have both of the functions ‘aa’ and ‘cc’. If the user clicks a certain function group, all proteins of the function group are listed, as shown in the third and fourth windows.
- a graph visualized by InterViewer can be simplified by limiting distance level of neighbors. For example, when the distance level of neighbors of CIT 2 is set as 5, InterViewer finds a reduced graph with 76 nodes, as shown in FIG. 8 .
- SEP 2 , PAN 1 and FIR 1 which are nodes selected by the user, can be indicated in different colors, and CIT 2 can be indicated in a different color, thus offering convenience to the user.
- the user can choose to fix positions of one or more nodes during the force-directed layout. After the initial layout, the node positions of a star-shaped subgraph produced by fixing the center of the subgraph usually generates a satisfactory graph.
- the method of visualizing protein interaction data according to the present invention can implement a program which visualizes large-scale protein interaction networks into a clear and aesthetically pleasing drawing, and is over 10 times faster than the conventional force-directed algorithms.
- Pajek (Batagelj & Mrvar, 2001) and Tulip (David, 2001)
- Tulip (David, 2001)
- Pajek three algorithms including Kamada & Kawai's algorithm (1989), Eigen value method (Golub & van Loan, 1996), and Fruchterman & Reingold's algorithm (1991) were implemented for layout.
- the method for visualization according to the present invention can be used for finding and exploring individual connected components or subgraphs interactively, as well as visualizing protein interactions.
- the method for visualization can provide an integrated framework for dynamically querying protein interaction database and directly visualizing the query results, thus facilitating visualization and analysis of a large volume of updated data.
Landscapes
- Life Sciences & Earth Sciences (AREA)
- Health & Medical Sciences (AREA)
- Engineering & Computer Science (AREA)
- Physics & Mathematics (AREA)
- Molecular Biology (AREA)
- Chemical & Material Sciences (AREA)
- General Health & Medical Sciences (AREA)
- Bioinformatics & Cheminformatics (AREA)
- Biophysics (AREA)
- Immunology (AREA)
- Biotechnology (AREA)
- Bioinformatics & Computational Biology (AREA)
- Theoretical Computer Science (AREA)
- Hematology (AREA)
- Analytical Chemistry (AREA)
- Proteomics, Peptides & Aminoacids (AREA)
- Biomedical Technology (AREA)
- Organic Chemistry (AREA)
- Medical Informatics (AREA)
- Evolutionary Biology (AREA)
- Spectroscopy & Molecular Physics (AREA)
- Urology & Nephrology (AREA)
- Biochemistry (AREA)
- Medicinal Chemistry (AREA)
- General Physics & Mathematics (AREA)
- Microbiology (AREA)
- Food Science & Technology (AREA)
- Data Mining & Analysis (AREA)
- Pathology (AREA)
- Chemical Kinetics & Catalysis (AREA)
- General Chemical & Material Sciences (AREA)
- Cell Biology (AREA)
- Genetics & Genomics (AREA)
- Computer Graphics (AREA)
- Geometry (AREA)
- Software Systems (AREA)
- Information Retrieval, Db Structures And Fs Structures Therefor (AREA)
- Management, Administration, Business Operations System, And Electronic Commerce (AREA)
Applications Claiming Priority (2)
| Application Number | Priority Date | Filing Date | Title |
|---|---|---|---|
| KR2002-0057604 | 2002-09-23 | ||
| KR10-2002-0057604A KR100470977B1 (ko) | 2002-09-23 | 2002-09-23 | 대규모 단백질 상호작용 데이터의 효율적 시각화 기법 |
Publications (2)
| Publication Number | Publication Date |
|---|---|
| US20040059521A1 US20040059521A1 (en) | 2004-03-25 |
| US7280921B2 true US7280921B2 (en) | 2007-10-09 |
Family
ID=31987513
Family Applications (1)
| Application Number | Title | Priority Date | Filing Date |
|---|---|---|---|
| US10/290,432 Expired - Fee Related US7280921B2 (en) | 2002-09-23 | 2002-11-07 | Method for visualizing large-scale protein interaction data |
Country Status (3)
| Country | Link |
|---|---|
| US (1) | US7280921B2 (enExample) |
| JP (2) | JP2004118819A (enExample) |
| KR (1) | KR100470977B1 (enExample) |
Cited By (1)
| Publication number | Priority date | Publication date | Assignee | Title |
|---|---|---|---|---|
| CN103390087A (zh) * | 2013-07-31 | 2013-11-13 | 浙江大学 | 一种针对大规模几何场景的交互绘制方法 |
Families Citing this family (14)
| Publication number | Priority date | Publication date | Assignee | Title |
|---|---|---|---|---|
| JP2004069417A (ja) * | 2002-08-05 | 2004-03-04 | Hitachi Ltd | ノード座標の決定方法、ネットワーク表示方法及びスクリーニング方法 |
| KR100491666B1 (ko) * | 2002-09-23 | 2005-05-27 | 학교법인 인하학원 | 단백질 상호작용 네트웍의 분할 시각화 기법 |
| EP1510939A1 (en) * | 2003-08-29 | 2005-03-02 | Sap Ag | A method of providing a visualisation graph on a computer and a computer for providing a visualisation graph |
| EP1510940A1 (en) * | 2003-08-29 | 2005-03-02 | Sap Ag | A method of providing a visualisation graph on a computer and a computer for providing a visualisation graph |
| EP1510938B1 (en) * | 2003-08-29 | 2014-06-18 | Sap Ag | A method of providing a visualisation graph on a computer and a computer for providing a visualisation graph |
| EP1510941A1 (en) * | 2003-08-29 | 2005-03-02 | Sap Ag | A method of providing a visualisation graph on a computer and a computer for providing a visualisation graph |
| US7523117B2 (en) * | 2005-05-04 | 2009-04-21 | West Virginia University Research Corporation | Method for data clustering and classification by a graph theory model—network partition into high density subgraphs |
| KR100833988B1 (ko) * | 2006-10-12 | 2008-05-30 | 포항공과대학교 산학협력단 | 다극자 변형 표현을 이용한 단백질 분자 모양의 표현 방법 |
| KR100970968B1 (ko) * | 2008-10-21 | 2010-07-21 | 건국대학교 산학협력단 | 거대 분자의 렌더링 방법 및 장치 |
| US10289802B2 (en) | 2010-12-27 | 2019-05-14 | The Board Of Trustees Of The Leland Stanford Junior University | Spanning-tree progression analysis of density-normalized events (SPADE) |
| CN102750460B (zh) * | 2012-05-31 | 2014-12-10 | 常州工学院 | 分层简化大规模图数据的运算方法 |
| WO2015084461A2 (en) * | 2013-09-23 | 2015-06-11 | Northeastern University | System and methods for disease module detection |
| JP7404648B2 (ja) * | 2019-04-25 | 2023-12-26 | 富士通株式会社 | 治療薬提示方法、治療薬提示装置、及び治療薬提示プログラム |
| CN111061921B (zh) * | 2019-12-04 | 2020-10-30 | 智器云南京信息科技有限公司 | 一种图像布局实现方法、系统、终端设备和存储介质 |
Family Cites Families (4)
| Publication number | Priority date | Publication date | Assignee | Title |
|---|---|---|---|---|
| US5265030A (en) * | 1990-04-24 | 1993-11-23 | Scripps Clinic And Research Foundation | System and method for determining three-dimensional structures of proteins |
| WO1993020525A1 (fr) * | 1992-03-27 | 1993-10-14 | Akiko Itai | Procede d'analyse de la structure d'un composite stable de biopolymere et de molecules de coordination |
| JPH08263535A (ja) * | 1995-03-23 | 1996-10-11 | Fujitsu Ltd | 立体構造データ管理方法 |
| US20020107643A1 (en) * | 1999-01-22 | 2002-08-08 | Wayne A. Hendrickson | Process for pan-genomic determination of macromolecular atomic structures |
-
2002
- 2002-09-23 KR KR10-2002-0057604A patent/KR100470977B1/ko not_active Expired - Lifetime
- 2002-11-01 JP JP2002319839A patent/JP2004118819A/ja active Pending
- 2002-11-07 US US10/290,432 patent/US7280921B2/en not_active Expired - Fee Related
-
2005
- 2005-03-30 JP JP2005099514A patent/JP2005322216A/ja active Pending
Non-Patent Citations (11)
| Title |
|---|
| An article entitled "A Java Applet for Visualizing . . . ", By Ralf Mrowka, published in Bioinformatics Applications Note, vol. 17, No. 7, 2001, pp. 669-670. |
| An article entitled "A Multilevel Algorithm for Force-Directed Graph Drawing", By C. Walshaw, published in GD 2000, LNCS 1984, pp. 171-182, 2001. |
| An article entitled "A Network of Protein-Protein Interactions in Yeast", By Schwikowski et al., published in Nature Biotechnology, vol. 18, Dec. 2000, pp. 1257-1261. |
| An article entitled "An Algorithm for Drawing General Undirected Graphs", By Kamada et al., published in Information Processing Letters, Department of Information Science, Faculty of Science, University of Tokyo, Apr. 1989, pp. 7-15. |
| An article entitled "Generating Protein Interaction Maps . . . ", By Lappe et al., published in vol. 17 Suppl. 1 2001, pp. S149-S156. |
| An article entitled "Mapping Protein Family Interactions: Intramolecular . . . ", By Park et al., published in J. Mol. Biol. (2001), 307, pp. 929-938. |
| An article entitled "Pajek-Analysis and Visualization . . . ", By Batagelj et al., published in GD 2001, LNCS 2265, pp. 477-478, 2002. |
| An article entitled "SCOP: A Structural Classification of Proteins Database . . . ", By Murzin et al., published in J. Mol. Biol. (1995) 247, pp. 536-540. |
| An article entitled "Towards an Understanding of Complex Protein Networks", By Tucker et al., published in Trends in Cell Biology, vol. 11, No. 3, Mar. 2001, pp. 102-106. |
| An article entitled "Tulip", By Auber David, published in GD 2001, LNCS 2265, pp. 435-437, 2002. |
| An article entitled, "A Comprehensive Analysis of Protein-Protein . . . ", By Uetz et al., published in Nature, vol. 403, Feb. 10, 2000, pp. 623-629. This. |
Cited By (2)
| Publication number | Priority date | Publication date | Assignee | Title |
|---|---|---|---|---|
| CN103390087A (zh) * | 2013-07-31 | 2013-11-13 | 浙江大学 | 一种针对大规模几何场景的交互绘制方法 |
| CN103390087B (zh) * | 2013-07-31 | 2016-03-09 | 浙江大学 | 一种针对大规模几何场景的交互绘制方法 |
Also Published As
| Publication number | Publication date |
|---|---|
| US20040059521A1 (en) | 2004-03-25 |
| JP2005322216A (ja) | 2005-11-17 |
| KR100470977B1 (ko) | 2005-03-10 |
| JP2004118819A (ja) | 2004-04-15 |
| KR20040026227A (ko) | 2004-03-30 |
Similar Documents
| Publication | Publication Date | Title |
|---|---|---|
| US7280921B2 (en) | Method for visualizing large-scale protein interaction data | |
| Alexander et al. | bcl:: Cluster: A method for clustering biological molecules coupled with visualization in the Pymol Molecular Graphics System | |
| JP2002532788A (ja) | データを編成するシステム及び方法 | |
| JP2006520948A (ja) | 3次元オブジェクトについて検索を行なうための方法、システムおよびデータ構造 | |
| CA2942106A1 (en) | Aligning and clustering sequence patterns to reveal classificatory functionality of sequences | |
| von Landesberger et al. | Visual analysis of graphs with multiple connected components | |
| Furmanová et al. | COZOID: contact zone identifier for visual analysis of protein-protein interactions | |
| US20100174707A1 (en) | Image searching apparatus, image sorting apparatus and method and program | |
| Keim et al. | Visualization | |
| Bisson et al. | Improving visualization of large hierarchical clustering | |
| US20040059522A1 (en) | Method for partitioned layout of protein interaction networks | |
| Catalano et al. | A Dashboard for the Analysis of Tangible Heritage Artefacts: a Case Study in Archaeology. | |
| US10360215B1 (en) | Methods and apparatus for parallel evaluation of pattern queries over large N-dimensional datasets to identify features of interest | |
| Kolpak et al. | Enhanced SAR maps: expanding the data rendering capabilities of a popular medicinal chemistry tool | |
| Lichtenberg et al. | Analyzing residue surface proximity to interpret molecular dynamics | |
| Dos Santos | A framework for the visualization of multidimensional and multivariate data | |
| Koizumi et al. | BJR-tree: fast skyline computation algorithm using dominance relation-based tree structure | |
| Wu et al. | Towards integrated and efficient scientific sensor data processing: a database approach | |
| New et al. | Dynamic visualization of coexpression in systems genetics data | |
| Hägele et al. | Visual analytics for nonlinear programming in robot motion planning | |
| Donati et al. | Topological analysis reveals multiple pathways in molecular dynamics | |
| Wang et al. | A layout-based classification method for visualizing time-varying graphs | |
| Babaria | Using treemaps to visualize gene ontologies | |
| Patro et al. | MDMap: A system for data-driven layout and exploration of molecular dynamics simulations | |
| Nunes et al. | Exploration of Semi-Structured Data Sources. |
Legal Events
| Date | Code | Title | Description |
|---|---|---|---|
| AS | Assignment |
Owner name: INHA UNIVERSITY, KOREA, REPUBLIC OF Free format text: ASSIGNMENT OF ASSIGNORS INTEREST;ASSIGNORS:HAN, KYUNG SOOK;JU, BYONG-HYON;REEL/FRAME:013472/0605 Effective date: 20021024 |
|
| AS | Assignment |
Owner name: INHA UNIVERSITY FOUNDATION, KOREA, REPUBLIC OF Free format text: ASSIGNMENT OF ASSIGNORS INTEREST;ASSIGNORS:HAN, KYUNGSOOK;HYON, BYONG;REEL/FRAME:014618/0010 Effective date: 20030701 |
|
| AS | Assignment |
Owner name: INHA UNIVERSITY FOUNDATION, KOREA, REPUBLIC OF Free format text: CORRECTION TO TYPOGRAPHICAL ERROR IN THE ASSIGNEE ON THE NOTICE OF RECORDATION - REEL;ASSIGNORS:HAN, KYUNGSOOK;JU, BYONG-HYON;REEL/FRAME:016351/0963 Effective date: 20030701 |
|
| STCF | Information on status: patent grant |
Free format text: PATENTED CASE |
|
| FPAY | Fee payment |
Year of fee payment: 4 |
|
| AS | Assignment |
Owner name: JUNGSEOK-INHA SCHOOL'S FOUNDATION, KOREA, REPUBLIC Free format text: CHANGE OF NAME;ASSIGNOR:INHA UNIVERSITY FOUNDATION;REEL/FRAME:032137/0075 Effective date: 20140122 |
|
| FPAY | Fee payment |
Year of fee payment: 8 |
|
| AS | Assignment |
Owner name: HAN, KYUNGSOOK, KOREA, REPUBLIC OF Free format text: ASSIGNMENT OF ASSIGNORS INTEREST;ASSIGNOR:JUNGSEOK-INHA SCHOOL'S FOUNDATION;REEL/FRAME:046577/0587 Effective date: 20180806 |
|
| FEPP | Fee payment procedure |
Free format text: MAINTENANCE FEE REMINDER MAILED (ORIGINAL EVENT CODE: REM.); ENTITY STATUS OF PATENT OWNER: SMALL ENTITY |
|
| LAPS | Lapse for failure to pay maintenance fees |
Free format text: PATENT EXPIRED FOR FAILURE TO PAY MAINTENANCE FEES (ORIGINAL EVENT CODE: EXP.); ENTITY STATUS OF PATENT OWNER: SMALL ENTITY |
|
| STCH | Information on status: patent discontinuation |
Free format text: PATENT EXPIRED DUE TO NONPAYMENT OF MAINTENANCE FEES UNDER 37 CFR 1.362 |
|
| FP | Lapsed due to failure to pay maintenance fee |
Effective date: 20191009 |