US6507401B1 - Apparatus and method for analyzing fluids - Google Patents
Apparatus and method for analyzing fluids Download PDFInfo
- Publication number
- US6507401B1 US6507401B1 US09/453,003 US45300399A US6507401B1 US 6507401 B1 US6507401 B1 US 6507401B1 US 45300399 A US45300399 A US 45300399A US 6507401 B1 US6507401 B1 US 6507401B1
- Authority
- US
- United States
- Prior art keywords
- light
- wavelengths
- fluid
- intensities
- wavelength
- Prior art date
- Legal status (The legal status is an assumption and is not a legal conclusion. Google has not performed a legal analysis and makes no representation as to the accuracy of the status listed.)
- Expired - Lifetime
Links
- 239000012530 fluid Substances 0.000 title claims abstract description 213
- 238000000034 method Methods 0.000 title claims abstract description 132
- 239000000203 mixture Substances 0.000 claims abstract description 104
- 239000000470 constituent Substances 0.000 claims abstract description 97
- 238000010521 absorption reaction Methods 0.000 claims abstract description 29
- 230000005855 radiation Effects 0.000 claims abstract description 19
- 230000000694 effects Effects 0.000 claims abstract description 18
- 238000000611 regression analysis Methods 0.000 claims abstract description 7
- XLYOFNOQVPJJNP-UHFFFAOYSA-N water Substances O XLYOFNOQVPJJNP-UHFFFAOYSA-N 0.000 claims description 52
- 239000000835 fiber Substances 0.000 claims description 34
- VNWKTOKETHGBQD-UHFFFAOYSA-N methane Chemical group C VNWKTOKETHGBQD-UHFFFAOYSA-N 0.000 claims description 29
- 239000003345 natural gas Substances 0.000 claims description 13
- 238000002156 mixing Methods 0.000 claims description 8
- 238000005259 measurement Methods 0.000 claims description 7
- 230000031700 light absorption Effects 0.000 claims description 4
- 238000004422 calculation algorithm Methods 0.000 abstract description 77
- 230000002238 attenuated effect Effects 0.000 abstract description 5
- 239000003921 oil Substances 0.000 description 87
- 238000001228 spectrum Methods 0.000 description 61
- 238000004458 analytical method Methods 0.000 description 45
- 238000004519 manufacturing process Methods 0.000 description 25
- 239000007789 gas Substances 0.000 description 24
- 239000010779 crude oil Substances 0.000 description 20
- 238000010606 normalization Methods 0.000 description 18
- 230000003595 spectral effect Effects 0.000 description 16
- 239000000126 substance Substances 0.000 description 16
- 238000010238 partial least squares regression Methods 0.000 description 15
- 238000002795 fluorescence method Methods 0.000 description 14
- 238000002474 experimental method Methods 0.000 description 12
- NHTMVDHEPJAVLT-UHFFFAOYSA-N Isooctane Chemical compound CC(C)CC(C)(C)C NHTMVDHEPJAVLT-UHFFFAOYSA-N 0.000 description 11
- 238000004364 calculation method Methods 0.000 description 11
- JVSWJIKNEAIKJW-UHFFFAOYSA-N dimethyl-hexane Natural products CCCCCC(C)C JVSWJIKNEAIKJW-UHFFFAOYSA-N 0.000 description 11
- 238000012628 principal component regression Methods 0.000 description 11
- 238000001069 Raman spectroscopy Methods 0.000 description 10
- 239000011159 matrix material Substances 0.000 description 9
- 239000003129 oil well Substances 0.000 description 9
- 230000005284 excitation Effects 0.000 description 7
- 239000013307 optical fiber Substances 0.000 description 7
- 230000004044 response Effects 0.000 description 7
- 239000000523 sample Substances 0.000 description 7
- 238000010586 diagram Methods 0.000 description 6
- 238000011068 loading method Methods 0.000 description 6
- 125000002496 methyl group Chemical group [H]C([H])([H])* 0.000 description 6
- 230000001419 dependent effect Effects 0.000 description 5
- 238000012921 fluorescence analysis Methods 0.000 description 5
- 238000012544 monitoring process Methods 0.000 description 5
- 230000008901 benefit Effects 0.000 description 4
- 229910052736 halogen Inorganic materials 0.000 description 4
- 229930195733 hydrocarbon Natural products 0.000 description 4
- 150000002430 hydrocarbons Chemical class 0.000 description 4
- 230000007246 mechanism Effects 0.000 description 4
- 125000001570 methylene group Chemical group [H]C([H])([*:1])[*:2] 0.000 description 4
- 230000008569 process Effects 0.000 description 4
- -1 tungsten halogen Chemical class 0.000 description 4
- 238000002835 absorbance Methods 0.000 description 3
- 238000000862 absorption spectrum Methods 0.000 description 3
- 238000013459 approach Methods 0.000 description 3
- 230000008859 change Effects 0.000 description 3
- 238000013145 classification model Methods 0.000 description 3
- 238000001514 detection method Methods 0.000 description 3
- 230000005283 ground state Effects 0.000 description 3
- 239000010453 quartz Substances 0.000 description 3
- VYPSYNLAJGMNEJ-UHFFFAOYSA-N silicon dioxide Inorganic materials O=[Si]=O VYPSYNLAJGMNEJ-UHFFFAOYSA-N 0.000 description 3
- 238000004611 spectroscopical analysis Methods 0.000 description 3
- 238000003756 stirring Methods 0.000 description 3
- 229910052721 tungsten Inorganic materials 0.000 description 3
- 239000010937 tungsten Substances 0.000 description 3
- 229910000530 Gallium indium arsenide Inorganic materials 0.000 description 2
- ATUOYWHBWRKTHZ-UHFFFAOYSA-N Propane Chemical compound CCC ATUOYWHBWRKTHZ-UHFFFAOYSA-N 0.000 description 2
- 230000005540 biological transmission Effects 0.000 description 2
- 150000001875 compounds Chemical class 0.000 description 2
- 238000011161 development Methods 0.000 description 2
- 239000000839 emulsion Substances 0.000 description 2
- 230000005281 excited state Effects 0.000 description 2
- 238000001506 fluorescence spectroscopy Methods 0.000 description 2
- 238000007689 inspection Methods 0.000 description 2
- 230000003993 interaction Effects 0.000 description 2
- 230000003287 optical effect Effects 0.000 description 2
- 230000009467 reduction Effects 0.000 description 2
- 238000005070 sampling Methods 0.000 description 2
- 239000004576 sand Substances 0.000 description 2
- 239000007787 solid Substances 0.000 description 2
- 238000011144 upstream manufacturing Methods 0.000 description 2
- 238000010200 validation analysis Methods 0.000 description 2
- VCZXRQFWGHPRQB-UHFFFAOYSA-N CC(C)CC(C)(C)C.CC(C)CC(C)(C)C Chemical compound CC(C)CC(C)(C)C.CC(C)CC(C)(C)C VCZXRQFWGHPRQB-UHFFFAOYSA-N 0.000 description 1
- ILBZSNOGPTUKHC-UHFFFAOYSA-N CC1CN(C)C1 Chemical compound CC1CN(C)C1 ILBZSNOGPTUKHC-UHFFFAOYSA-N 0.000 description 1
- FMADWSNHCMZZCU-UHFFFAOYSA-N CCCCNC=C Chemical compound CCCCNC=C FMADWSNHCMZZCU-UHFFFAOYSA-N 0.000 description 1
- OTMSDBZUPAUEDD-UHFFFAOYSA-N Ethane Chemical compound CC OTMSDBZUPAUEDD-UHFFFAOYSA-N 0.000 description 1
- 238000005481 NMR spectroscopy Methods 0.000 description 1
- XUIMIQQOPSSXEZ-UHFFFAOYSA-N Silicon Chemical compound [Si] XUIMIQQOPSSXEZ-UHFFFAOYSA-N 0.000 description 1
- 238000011497 Univariate linear regression Methods 0.000 description 1
- 238000013528 artificial neural network Methods 0.000 description 1
- 125000003118 aryl group Chemical group 0.000 description 1
- 230000015572 biosynthetic process Effects 0.000 description 1
- 239000001273 butane Substances 0.000 description 1
- 238000002485 combustion reaction Methods 0.000 description 1
- 238000011109 contamination Methods 0.000 description 1
- 238000000354 decomposition reaction Methods 0.000 description 1
- 238000005553 drilling Methods 0.000 description 1
- 230000008030 elimination Effects 0.000 description 1
- 238000003379 elimination reaction Methods 0.000 description 1
- 238000011156 evaluation Methods 0.000 description 1
- 238000004817 gas chromatography Methods 0.000 description 1
- 239000011521 glass Substances 0.000 description 1
- 238000002329 infrared spectrum Methods 0.000 description 1
- 230000010354 integration Effects 0.000 description 1
- 239000007788 liquid Substances 0.000 description 1
- 238000005461 lubrication Methods 0.000 description 1
- 238000004949 mass spectrometry Methods 0.000 description 1
- 239000000463 material Substances 0.000 description 1
- WCYWZMWISLQXQU-UHFFFAOYSA-N methyl Chemical compound [CH3] WCYWZMWISLQXQU-UHFFFAOYSA-N 0.000 description 1
- 230000003278 mimic effect Effects 0.000 description 1
- 238000000491 multivariate analysis Methods 0.000 description 1
- IJDNQMDRQITEOD-UHFFFAOYSA-N n-butane Chemical compound CCCC IJDNQMDRQITEOD-UHFFFAOYSA-N 0.000 description 1
- OFBQJSOFQDEBGM-UHFFFAOYSA-N n-pentane Natural products CCCCC OFBQJSOFQDEBGM-UHFFFAOYSA-N 0.000 description 1
- 239000008239 natural water Substances 0.000 description 1
- 230000001537 neural effect Effects 0.000 description 1
- 239000013618 particulate matter Substances 0.000 description 1
- 238000000513 principal component analysis Methods 0.000 description 1
- 238000012847 principal component analysis method Methods 0.000 description 1
- 238000012545 processing Methods 0.000 description 1
- 239000001294 propane Substances 0.000 description 1
- 238000004445 quantitative analysis Methods 0.000 description 1
- 230000001105 regulatory effect Effects 0.000 description 1
- 230000035945 sensitivity Effects 0.000 description 1
- 229910052710 silicon Inorganic materials 0.000 description 1
- 239000010703 silicon Substances 0.000 description 1
- 238000004088 simulation Methods 0.000 description 1
- 238000009491 slugging Methods 0.000 description 1
- 150000003384 small molecules Chemical class 0.000 description 1
- 230000002277 temperature effect Effects 0.000 description 1
- 230000002123 temporal effect Effects 0.000 description 1
- 238000012795 verification Methods 0.000 description 1
- 238000005303 weighing Methods 0.000 description 1
Images


Classifications
-
- G—PHYSICS
- G01—MEASURING; TESTING
- G01N—INVESTIGATING OR ANALYSING MATERIALS BY DETERMINING THEIR CHEMICAL OR PHYSICAL PROPERTIES
- G01N21/00—Investigating or analysing materials by the use of optical means, i.e. using sub-millimetre waves, infrared, visible or ultraviolet light
- G01N21/17—Systems in which incident light is modified in accordance with the properties of the material investigated
- G01N21/25—Colour; Spectral properties, i.e. comparison of effect of material on the light at two or more different wavelengths or wavelength bands
- G01N21/27—Colour; Spectral properties, i.e. comparison of effect of material on the light at two or more different wavelengths or wavelength bands using photo-electric detection ; circuits for computing concentration
- G01N21/274—Calibration, base line adjustment, drift correction
-
- E—FIXED CONSTRUCTIONS
- E21—EARTH DRILLING; MINING
- E21B—EARTH DRILLING, e.g. DEEP DRILLING; OBTAINING OIL, GAS, WATER, SOLUBLE OR MELTABLE MATERIALS OR A SLURRY OF MINERALS FROM WELLS
- E21B47/00—Survey of boreholes or wells
- E21B47/10—Locating fluid leaks, intrusions or movements
- E21B47/113—Locating fluid leaks, intrusions or movements using electrical indications; using light radiations
- E21B47/114—Locating fluid leaks, intrusions or movements using electrical indications; using light radiations using light radiation
-
- G—PHYSICS
- G01—MEASURING; TESTING
- G01N—INVESTIGATING OR ANALYSING MATERIALS BY DETERMINING THEIR CHEMICAL OR PHYSICAL PROPERTIES
- G01N21/00—Investigating or analysing materials by the use of optical means, i.e. using sub-millimetre waves, infrared, visible or ultraviolet light
- G01N21/17—Systems in which incident light is modified in accordance with the properties of the material investigated
- G01N21/25—Colour; Spectral properties, i.e. comparison of effect of material on the light at two or more different wavelengths or wavelength bands
- G01N21/31—Investigating relative effect of material at wavelengths characteristic of specific elements or molecules, e.g. atomic absorption spectrometry
-
- G—PHYSICS
- G01—MEASURING; TESTING
- G01N—INVESTIGATING OR ANALYSING MATERIALS BY DETERMINING THEIR CHEMICAL OR PHYSICAL PROPERTIES
- G01N21/00—Investigating or analysing materials by the use of optical means, i.e. using sub-millimetre waves, infrared, visible or ultraviolet light
- G01N21/62—Systems in which the material investigated is excited whereby it emits light or causes a change in wavelength of the incident light
- G01N21/63—Systems in which the material investigated is excited whereby it emits light or causes a change in wavelength of the incident light optically excited
- G01N21/64—Fluorescence; Phosphorescence
-
- G—PHYSICS
- G01—MEASURING; TESTING
- G01N—INVESTIGATING OR ANALYSING MATERIALS BY DETERMINING THEIR CHEMICAL OR PHYSICAL PROPERTIES
- G01N21/00—Investigating or analysing materials by the use of optical means, i.e. using sub-millimetre waves, infrared, visible or ultraviolet light
- G01N21/84—Systems specially adapted for particular applications
- G01N21/85—Investigating moving fluids or granular solids
- G01N21/8507—Probe photometers, i.e. with optical measuring part dipped into fluid sample
-
- G—PHYSICS
- G01—MEASURING; TESTING
- G01N—INVESTIGATING OR ANALYSING MATERIALS BY DETERMINING THEIR CHEMICAL OR PHYSICAL PROPERTIES
- G01N33/00—Investigating or analysing materials by specific methods not covered by groups G01N1/00 - G01N31/00
- G01N33/26—Oils; viscous liquids; paints; inks
- G01N33/28—Oils, i.e. hydrocarbon liquids
- G01N33/2823—Oils, i.e. hydrocarbon liquids raw oil, drilling fluid or polyphasic mixtures
-
- G—PHYSICS
- G01—MEASURING; TESTING
- G01N—INVESTIGATING OR ANALYSING MATERIALS BY DETERMINING THEIR CHEMICAL OR PHYSICAL PROPERTIES
- G01N2201/00—Features of devices classified in G01N21/00
- G01N2201/08—Optical fibres; light guides
- G01N2201/084—Fibres for remote transmission
Definitions
- the current invention is directed to the analysis of fluids. More specifically, the current invention is directed to the compositional analysis of fluids, such as fluids produced by oil wells, that contain constituents that fluoresce and/or absorb radiation, such as near-infrared radiation.
- UV-Vis ultraviolet-visible
- IR infrared
- UV fluorescence spectroscopy UV fluorescence spectroscopy
- nuclear magnetic resonance spectroscopy mass spectrometry
- gas chromatography gas chromatography
- the ability to remotely sense the presence of certain fluids, such as oil, in a flowing stream, is also desirable in situations other than in oil wells. For example, it is sometimes desirable to determine when a fluid, such as discharge water, that should not contain oil has become contaminated with oil. Consequently, it would be desirable to provide a system and method for analyzing the presence of certain fluids in a flowing stream.
- Light may scatter as a result of several different mechanisms. If more than one phase is present in the fluid, light will be scattered by reflection and refraction at the interfaces between the phases. Scattering will also occur as a result of the Rayleigh mechanism. Light scattered by the Rayleigh mechanism has the same wavelength as that of the incident light. In some substances, such as oil, scattering also occurs by the Raman phenomenon. Raman scattering produces extremely low intensity light (relative to the intensity of the incident light) having wavelengths both above and below that of the incident light, so that even monochromatic light yields scattered light in a range of wavelengths. Thus, when analyzed by a spectrograph, Raman scattering produces lines on both sides of the Rayleigh line that are a characteristic of the substance and upon which the light is incident can be used its composition.
- the light emitted as a result of Raman scattering is too low in intensity to be transmitted to the surface for analysis, while the down hole environment is too harsh to permit the use of the sensitive equipment, such as a spectrograph and charged couple device, necessary to conduct a Raman analysis down hole.
- a portion of the light entering the fluid may be absorbed.
- the amount of light absorbed at a given wavelength is a characteristic of the substance. Therefore, the constituents of a substance can be determined by comparing the spectrum of the light directed into the fluid with that of the light that has been transmitted through it so as to determine the spectrum of the light absorbed by the fluid. This spectrum may be expressed, for example, as ⁇ log 10 of the ratio of the light directed to the fluid and the light transmitted through the fluid.
- absorption is primarily a function of the constituents of the fluid
- scattering also depends on the physical form of those constituents. For example, in an emulsion, such as a mixture of water and oil, the more finely dispersed the oil droplets the greater the scattering. The increase in scatting associated with the reduction in droplet size will reduce the intensity of the transmitted light, despite the fact that the composition of the fluid, in a quantitative sense, has remained unchanged. Scattering can, therefore, lead to significant errors in systems measuring the absorption spectra of the fluid.
- U.S. Pat. No. 4,994,671 discloses a method for analyzing the composition of fluid in a well by suspending within the well a tool that contains a spectrograph and an incandescent tungsten-halogen lamp.
- the lamp is characterized as being relatively bright in the 1000 to 2500 nm range and down to about 500 nm and having acceptable emissions from 350 to 500 nm.
- the lamp directs light onto a sample of fluid that is admitted into the tool. Different sections of a fiber optic bundle receive the light transmitted across the fluid sample, as well as the light back-scattered from the sample.
- the spectra of both the transmitted light and the back scattered light are measured by a spectrograph and the data are digitized and transmitted electronically to a computer at the surface.
- Two absorption spectra for the fluid are determined by dividing the transmitted light spectrum and the back scattered light spectrum by the spectrum of the source light. If the fluid is sufficiently transparent to transmit an adequate amount of light through it, Safinya recommends the use of the transmitted light; otherwise the back-scattered light may be used.
- the computer determines the constituents of the fluid sample by comparing the transmitted or back-scattered absorption spectra to a data base containing reference spectra for water, gas and various types of oils, and using a least squares or principal component analysis method.
- Safinya does not account for the effect of variations arising from scattering.
- the flow of a multicomponent fluid (e.g., oil, water and gas) through a production well has very complex multiphase properties. Variations will occur not only in terms of the relative proportion of the constituents but also in multiphase characteristics, such as droplet or bubble size and the composition of the continuous and dispersed phases (e.g., oil and gas bubbles dispersed in water, oil droplets dispersed in gases, etc.). Additionally, there may be particulate matter suspended in the fluid, which can add to the scattering.
- the intensity of the transmitted light will decrease at all wave lengths, including the intensity of the light in the wave lengths associated with water, which will be interpreted as a greater absorption in the water-associated wave lengths. This, in turn, will lead to the erroneous conclusion that the concentration of water in the fluid has increased.
- the signal intensity is of paramount concern due to the losses that can occur if the sampling portion of the sensor is many kilometers from the surface. Also, the potential for errors due to scatter will still occur and, perhaps, be even greater than those associated with Safinya's method because the strength of the original signal is reduced.
- a method of determining the concentration of at least one predetermined constituent in a fluid flowing through a downhole portion a well comprising the steps of (i) generating a beam of light, (ii) directing the beam of light into the fluid flowing through the downhole portion of the well so as to cause light to emerge from the fluid, the emerging light having been scattered by the fluid and comprised of components each of which has a different wavelength, (iii) transmitting at least a portion of the emerging light to a location proximate to the surface of the earth, (iv) measuring the intensity of each of at least a portion of the components of the transmitted light, each of the light components in the portion of light components having a wavelength falling within a predetermined range of wavelengths, the light component intensity measurements being conducted at the location proximate the surface,
- the method further comprises the step of determining the weighting factors by (i) directing a calibration beam of light into a plurality of fluid calibration mixtures so as to cause light to emerge from each of the calibration mixtures that is comprised of components each of which has a different wavelength, with each of the calibration mixtures containing predetermined varying concentrations of the constituent, (ii) measuring the intensity of each of the components of the light emerging from the calibration mixtures having a wavelength falling within the predetermined range of wavelengths, (iii) normalizing at least a selected portion of the measured intensities of the light components emerging from the calibration mixtures, and (iv) performing a regression analysis on the normalized intensities of the calibration mixtures so as to determine the weighting factors.
- the invention also encompasses an apparatus for determining the concentration of a predetermined constituent in a fluid flowing through a downhole portion a well, comprising (i) means for generating a beam of light, (ii) means for directing the beam of light into the fluid flowing through the downhole portion of the well so as to cause light to emerge from the fluid which light is comprised of components each of which having a different wavelength and that has been scattered by the fluid prior to emerging therefrom, (iii) means for transmitting at least a portion of the emerging light to a location remote from the downhole portion of the well, (iv) means for measuring the intensity of each of the components of the transmitted light having a wavelength falling within a predetermined range of wavelengths at the remote location, (v) means for exponentially raising and normalizing at least a selected portion of the measured component intensities so as to minimize the effect of the scattering to the light emerging from the fluid has been subjected on the component intensities, (vi) means for determining the concentration of the constituent based upon the normalized component intensities.
- the apparatus further comprises a computer, and the means for means for normalizing the selected portion of the measured component intensities and the means for determining the concentration of the constituents comprises software programmed into the computer.
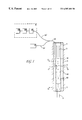
- FIG. 1 is schematic diagram of the fluid analysis system according to the current invention installed in a section of pipe.
- FIG. 2 is a transverse cross-section through the sensor shown in FIG. 1, taken along line II—II.
- FIG. 2 a is a detailed view of the sensor shown in FIG. 2 .
- FIG. 3 is a longitudinal cross-section taken along line III—III shown in FIG. 2 .
- FIG. 3 a is a transverse cross-section through the mixer shown in FIG. 3, taken along line IIIa—IIIa.
- FIG. 4 is schematic diagram of an alternate embodiment of the fluid analysis system according to the current invention installed in a section of pipe.
- FIG. 5 is schematic diagram of the equipment for performing a calibration according to the current invention.
- FIG. 6 is a plot of measured light intensity versus wavelength for oil/water mixtures ranging from 0 to 100% oil using the near-IR attenuation method.
- the X-axis is the light wavelength in nanometers.
- the Y-axis is the instrument's response in analog to digital converter counts.
- FIG. 7 is a plot of normalized light intensity versus wavelength based on the data shown in FIG. 6 .
- the X-axis is the light wavelength in nanometers.
- the Y-axis is the instrument's response in analog to digital converter counts.
- FIG. 8 is a plot of predicted concentration C p versus measured concentration C m for oil using an algorithm according to the current invention based on the data shown in FIG. 6 .
- FIG. 9 is a plot of measured light intensity versus wavelength for oil/water mixtures ranging from 0 to 100% oil using the near-IR fluorescence method.
- the X-axis is the wavelength in Pixel number.
- the Y-axis is the instrument's response in arbitrary units.
- FIG. 10 is a plot of normalized light intensity versus wavelength based on the data shown in FIG. 9 .
- the X-axis is the wavelength in Pixel number.
- the Y-axis is the response in arbitrary units.
- FIG. 11 is a plot of predicted concentration C p versus measured concentration C m for oil using an algorithm according to the current invention based on the data shown in FIG. 9 .
- FIG. 12 is a plot of measured light intensity versus wavelength for isooctane/oil/water mixtures ranging from 0-50% isooctane using the near-IR attenuation method.
- the X-axis is the wavelength in nanometers.
- the Y-axis is the response in arbitrary units.
- FIG. 13 is a plot of measured light intensity versus wavelength for isooctane/oil/water mixtures ranging from 0-25% isooctane using the near-IR attenuation method.
- the X-axis is the wavelength in nanometers.
- the Y-axis is the instrument's response in arbitrary units.
- FIG. 14 is a plot of normalized light intensity versus wavelength based on the data shown in FIG. 13 .
- the X-axis is the wavelength in nanometers.
- the Y-axis is the response in arbitrary units.
- FIG. 15 is a schematic diagram showing the software programed into the computer portion of the fluid analyzer shown in FIG. 1 .
- FIG. 16 is a schematic diagram of a multilateral well into which downhole fluid analyzers according to the current invention have been incorporated.
- the concentration of certain constituents in a fluid can be determined by directing light to the fluid, sensing the light emerging from the fluid, measuring the relative intensity of the components of the sensed light at selected wavelengths, and then treating these relative component intensities according to an algorithm, developed for the particular fluid being analyzed, that weights the component intensities using predetermined weighting factors based on the wavelength associated with each component.
- an algorithm developed for the particular fluid being analyzed, that weights the component intensities using predetermined weighting factors based on the wavelength associated with each component.
- the algorithm to be used in calculating the concentration of a particular constituent can be developed by measuring the intensity of the components of the light emerging from various known mixtures of the fluids to be analyzed over a range of wavelengths. These mixtures are formed by varying the concentration of the particular constituents in the fluid in a known way. After normalizing the component intensities, a regression analysis, such as a partial least squares regression, is used to determine the weighting factors that indicate the weight to be attached to the normalized component intensity at each wavelength. Based on these weighting factors, an algorithm is developed for calculating the concentration of the constituent.
- a regression analysis such as a partial least squares regression
- either the phenomenon associated with the attenuation of radiation (e.g., as a result of absorption) or the excitation of fluorescent radiation may be used to determine the concentration of a particular constituent of the fluid.
- a beam of light is directed to the fluid.
- the emerging light may be attenuated as a result of absorption and/or scattering.
- the light may induce fluorescence.
- the light emerging from the fluid will be attenuated and/or comprises fluorescent radiation. The analysis of the emerging light permits the determination of concentration.
- the concentration of oil for example, can be determined using either method.
- concentrations of water and natural gas, which do not fluoresce can only be directly determined using the attenuation method.
- the light directed to the fluid should encompass a broad range of wavelengths.
- the wavelength of the light directed to the fluid should lie within a narrow range, and preferably the light should be monochromatic.
- the light directed to the fluid is preferably in the near infrared (“near-IR”) range—that is, having a wavelength from approximately 800 nm to 3000 nm.
- near-IR near infrared
- each of the measured component intensities is preferably normalized by dividing it by an intensity characteristic associated with all, or at least most, of the components of the emerging light within a predetermined range of wavelength.
- normalization is preferably accomplished by dividing the measured component intensities by an intensity characteristic of the laser light used to induce the fluorescence.
- the light travels through the fluid, a variety of phenomena arise. Some of the components of the light at discrete wavelengths (or wavelength ranges) are absorbed depending to the chemical constitution of the fluid. In addition, some of the light is scattered in all directions due to the physical constitution of the fluid (emulsions, bubbles, binary mixtures, etc.), and some of the light is transmitted. Thus, the light entering the fluid is either absorbed, scattered, or transmitted through it.
- the amount of light absorbed at a given wavelength is a characteristic of the substance through which the light is travels. While the light that is absorbed cannot be directly measured, the light emerging from the fluid can be measured. As a result of absorption, the intensity of the emerging light will be reduced or “attenuated.” The amount of attenuation of the light for any given composition will varying as a function of its wavelength. Thus, for a given source light spectrum, evaluating the intensity of the components of the emerging light at selected wavelengths provides information about the composition of the fluid.
- Scattering also causes attenuation of the light intensity.
- attenuation as a result of absorption causes relative changes in the light intensity as a function of wavelength, i.e., there is a change in the shape of the broadband spectrum
- attenuation due to the scattering of light is much less dependent on its absolute wavelength; it has a slow, monotonic dependence on wavelength.
- the scattering of the light therefore, results in a drop in the light intensity at all wavelengths so that at any given wavelength, the intensity does not change appreciably relative to the intensity at other wavelengths.
- the net result is that even though the absolute magnitude of the collected light as a function of wavelength it is not uniquely related to chemical composition, the relative light intensity as a function of wavelength is related to the chemical composition.
- the effects of scattering can be effectively eliminated by normalizing the intensity of the collected light components at each wavelength utilized in the algorithm to the intensity over a broad band of wavelengths.
- an analysis of the relative attenuated components of the light emerging from the fluid can be used to accurately determine the concentration of its constituents, despite the simultaneous presence of scattering.
- the light directed to the fluid preferably encompasses a broad band of wavelengths that, most preferably, is sufficiently broad to encompass all, or at least most, of the major absorption peaks associated with the constituents whose concentration is to be determined.
- the major absorption peaks associated with the constituents whose concentration is to be determined For example, oil and natural gas have absorption peaks at 1200 nm and 1400 nm. Water has absorption peaks at 1150 nm and 1450 nm.
- the light should have wavelengths that at least encompass the 300 nm range as associated with these peaks (i.e., from 1150 nm to 1450 nm).
- the light directed to the fluid preferably has wavelengths in the near-IR range—that is, having a wavelength from approximately 800 nm to 3000 nm. More preferably, the light is in the range of about 900 nm to 2000 nm, more preferably still in the range of about 1100 nm to 1800 nm, and most preferably in the range of about 1100 nm to 1550 nm.
- Fluorescence is a type of luminescence—that is, light emitted by a process other than combustion or incandescence.
- a flourescent substance When a flourescent substance is illuminated with light of the appropriate wavelength it absorbs energy which, in turn, excites the absorbing species to a higher energy electronic state. When the absorbing species returns to its electronic ground state, a photon of light is emitted. If the excited state from which the absorbing species decays has the same multiplicity as the ground state, the time between absorption and emission is relatively short and the process is called fluorescence.
- the time interval is relatively long, and the process is referred to as phosphorescence.
- the light generated by fluorescence is always of longer wavelength than the incident light.
- fluorescence the absorption of light of one wavelength results in the emission of light of longer wavelengths.
- chromophores Certain molecular arrangements within fluorescent substances, called chromophores, are the centers of fluorescent activity. Not all chromophores respond to light in the same way.
- compounds with fused aromatic rings or compounds with a greater number of conjugated multiple bonds such as crude oil, can fluoresce when subjected to light at longer wavelengths, specifically, in the visible to near-IR range.
- Less complex, low molecular weight compounds, such as the simple hydrocarbons found in natural gas either do not fluoresce or fluoresce only at shorter wavelengths (in the ultra violet range) but not in the near-IR range. Water does not fluoresce.
- Other substances that do not fluoresce when excited by light in the near-IR range are sand and silt.
- the excitation light from the light source is generated at one location, preferably the surface, and transmitted through fiber optic cables over long distances to fluid at a remote location, such as downhole in an oil well.
- Light having short wavelengths, such as ultraviolet radiation is difficult to transmit over such long distances and can result in excessive Raman scattering.
- light in the near-IR range can be readily transmitted over long distances.
- shorter wavelength light may induce fluorescence in too many substances, making analysis of a particular constituent more difficult.
- near-IR excitation light causes oil, but not natural gas or water, to emit relatively intense fluorescent radiation. Consequently, according to the current invention, the concentration of oil is preferably determined using excitation light having a wavelength within or somewhat below the near-IR range.
- laser light having a relatively narrow wavelength band is directed to the fluid.
- the source should emit light having wavelengths from somewhat below the near-IR range to about the mid near-IR range—that is, from about 500 nm to 1700 nm range.
- the excitation light should be in the range of about the 600 nm to 1000 nm, more preferably still in the range of about the 780 nm to 900 nm, such as laser light having a wavelength of about 780 nm, 808 nm, or 852 nm.
- the laser light passes through the fluid, some of the light is absorbed by and re-emitted as fluorescent light at longer wavelengths than the absorbed light. Some of this fluorescent light is collected, along with some of the laser light that was transmitted through the fluid. For fluids that are highly scattering, the collected laser light intensity will be lower than for fluids that are not highly scattering since in the latter case a greater percentage of the laser light will be collected. Consequently, the laser light scattered by the fluid can be used as a means for monitoring its scattering characteristics.
- the collected fluorescence light will be dependent on both the concentration of fluorescent species present in the fluid and the scattering properties of the fluid. As the concentration of fluorescent species increases, the collected fluorescent light will increase. As the scattering characteristics of the fluid increase, the collected fluorescent light will decrease. Thus, the influence of the scattering properties of the fluid can be corrected for by normalizing the collected fluorescent intensity to the collected laser intensity. (In some circumstances, it may also be desirable to normalize the collected laser intensity itself by the laser intensity at the surface, in order to correct for optical power fluctuations in the laser.) In any event, in the fluorescence method of analysis, evaluation of the normalized intensity of the fluorescent light emitted by the fluid can be used to accurately determine the concentration of its constituents, despite the presence of scattering.
- FIG. 1 One embodiment of an apparatus according to the current invention is shown in FIG. 1 applied to an instrumented section of pipe 10 , which in some applications may be incorporated into production piping 7 disposed in a well bore 5 , through which the fluid 3 to be analyzed flows.
- the apparatus shown in FIG. 1 can be optimized for use with either the attenuation or fluorescence methods of analysis.
- the instrumented pipe section 10 comprises a sensor 12 that has been incorporated into the pipe.
- a sensor 12 may be desirable to incorporate a number of sensors into the instrumented section 10 , for example, by spacing two or more sensors circumferentially around the pipe at the same axial location and/or spacing two or more sensors axially along the pipe.
- the use of multiple sensors 12 will reduce errors associated with the fact that the fluid flowing through the instrumented section 10 may not be uniform across its cross-section or along the length of the section.
- FIGS. 2 and 2 a A diagram of one sensor 12 suitable for use in the current invention is shown in FIGS. 2 and 2 a and comprises a notch 19 formed in the inner wall of the pipe section 10 .
- Optically transparent windows 30 are formed on opposing walls of the notch 19 .
- a focusing lens 32 to which fiber optics 14 are coupled, is located behind each window 30 .
- the light 26 from the source 16 exits the first fiber optic 14 ′, passes through the first lens 32 , and then the first window 30 .
- the light subsequently passes into and interacts with the fluid stream 3 .
- the light emerging from the fluid stream passes through the second window 30 and is focused by the second lens 32 so that it is collected by the second fiber optic 14 ′′.
- the mixer 60 may comprise a section of piping 61 incorporated into the production piping 7 and into which helically extending mixing vanes 66 have been installed to swirl the fluid, thereby ensuring adequate mixing of the constituents before they reach the instrumented section 10 .
- the diverter 62 may comprise a section of piping 63 incorporated into the production piping 7 and into which a baffle 64 has been installed.
- the baffle 64 is preferably angled toward the notch 19 of the sensor 12 , most preferably at an angle with respect to the axis of the piping that is equal to or greater than the angle of the sloping side wall 19 of the notch, so as to deflect at least a portion, preferably a major portion, of the fluid 3 so that it is directed into the notch 19 .
- the sections of piping forming the mixer 60 , diverter 62 and instrumented section 10 could be jointed to each other, and to the production piping 7 , by threaded or welded connections. Alternatively, these components could be incorporated into a single section of piping that was joined to the production piping 7 or they could be inserted directly into inside diameter of the production piping 7 itself.
- a filter such as a dielectric filter (not shown), may be incorporated at the probe to filter out emission lines around the laser wavelength so as to eliminate the effect of glass Raman scattering.
- Each sensor 12 is optically connected to a light source 16 and a remote fluid analyzer 6 by a fiber optic cable 13 containing a pair of optical fibers 14 ′ and 14 ′′.
- the optical fibers which may comprise a bundle of optical fibers, are of the multimode type.
- the first optical fiber 14 ′ is coupled to a light source 16 , which is preferably located at a remote location, such as the surface.
- the second optical fiber 14 ′′ is coupled to a fluid analyzer 6 , which is also preferably located a remote location, such at the surface.
- the fiber optic cable 13 transmits light from the light source 16 to the sensor 12 and transmits light from the sensor to the fluid analyzer 6 .
- a broadband light source 16 When used in connection with the attenuation method, a broadband light source 16 should be used, such as a quartz tungsten halogen lamp.
- the light source 16 emits light having wavelengths sufficiently broad to encompass the major absorption peaks of the constituents whose concentration is to be determined, as previously discussed.
- the wavelength of the light In the case of mixtures of oil, water and/or natural gas, the wavelength of the light should encompass the ranges previously discussed in section I.
- the light source 16 When used in connection with the fluorescence method, the light source 16 should be an extremely narrow band source, and preferably be a monochromatic light source, such as a diode laser or a diode-pumped solid state (DPSS) laser. When used in circumstances requiring transmission of light over long distances, the light source 16 emits light having a wavelength in the ranges previously discussed in section II.
- a monochromatic light source such as a diode laser or a diode-pumped solid state (DPSS) laser.
- the fluid analyzer 6 comprises a spectrographic detector 18 , a computer 20 , and an indicator 22 .
- the spectrographic detector 18 includes a spectrograph for dispersing the light from the collection fiber into its component wavelengths and a detector for sensing the intensity at each of these wavelengths.
- the detector may comprise an InGaAs diode array to detect the intensity at each of the dispersed wavelengths.
- Such an array typically has a spectral sensitivity from 900 nm to 1700 nm.
- the primary advantage of using an array for detection is its ability to detect the light intensity simultaneously at every detected wavelength. For scanning systems, whether of interferometric or grating type, each wavelength's intensity is detected at a different discrete time. Since downhole scattering is a temporal phenomenon, this would make the measured effect of the scattering appear to be wavelength dependent. With the use of a diode array, the simultaneous detection of intensity at all detected wavelengths ensures that the effects of scattering are common to all wavelengths and facilitates the use of a normalization method to correct for scattering.
- a charge coupled device silicon array may be used for the detector.
- a filter or beam splitter can be used to direct the collected laser signal to one detector while the fluorescent signal is directed to a second detector.
- the detectors can be single element detectors that effectively integrate the signal intensities for all of the impinging wavelengths.
- the output of the detector for the laser signal is proportional to the integrated laser intensity and the output of the detector for the fluorescent signal is proportional to the integrated fluorescence signal. Normalization can be performed by taking the ratio of the two detector outputs in either analog or digital form.
- the computer 20 is programmed with software that allows it to read the array of intensities from the spectrographic detector 18 .
- the output of the light source 16 is directed into the proximal end of the first fiber optic 14 ′ located at the surface, as shown in FIG. 1 .
- the fiber optic 14 ′ permits the transmission of the light downhole to the remote sensor 12 .
- the sampling portion of the remote sensor 12 is in contact with the downhole fluid stream 3 that is to be analyzed.
- the source light interacts with the fluid 3 , as shown in FIG. 3, causing the fluid to absorb, scatter, transmit and/or fluoresce light.
- the second fiber optic 14 ′′ collects a portion of the light which is emerging from the fluid stream 3 (which may include scattered light from the source, transmitted light, and fluorescent radiation) and transmits this light to the surface, where its intensity is detected as a function of wavelength using the spectrographic detector 18 .
- the data from the spectrographic detector 18 is then input into the computer 20 .
- the computer 20 is programmed with software containing an algorithm that determines the composition of the fluid 3 —that is, the concentrations of predetermined constituents, for example, the percentages of oil and water—based on the intensity of the light emerging from the fluid at one or more selected discrete wavelength or range of wavelengths, as determined by the spectrographic detector 18 . These concentrations are indicated on the indicator 22 , which may be a digital readout device.
- FIG. 4 An apparatus for simultaneously employing both the fluorescence and attenuation methods of analysis is shown in FIG. 4 .
- two separate light sources 16 ′ and 16 ′′ and two separate spectrographic detectors 18 ′ and 18 ′′ are utilized.
- the first light source 16 ′ is used for the fluorescence portion of the analysis and, as discussed above, preferably generates monochromatic light.
- the second light source 16 ′′ is used for the attenuation portion of the analysis and, as discussed above, preferably generates broad band light.
- the first spectrographic detector 18 ′ is used for the fluorescence analysis and, as discussed above, preferably comprises a diode array.
- the second spectrographic detector 18 ′′ is used for fluorescence analysis and, as discussed above, preferably comprises a charged couple device.
- Light from the two sources 16 ′ and 16 ′′ may be directed by optic fibers 15 ′ and 15 ′′ into a common optic fiber 14 ′ by using a beam combining device 40 .
- the beam combining device 40 may consist of a dichromatic beam splitter, a fiber optic coupler, a fiber optic multiplexer, or a similar type of device.
- Light from both light sources 16 ′ and 16 ′′ is carried downhole by the common fiber optic 14 ′ to a common sensor 12 , such as that previously discussed. After interaction of light from both sources 16 ′ and 16 ′′ with the fluid stream 3 , light from the fluid stream is collected and returned to the surface by a common carrier fiber optic 14 ′′ .
- a splitter device 42 which may be a filter, a filter set, a beam splitter, a fiber optic splitter, a fiber optic demultiplexer, a grating, or a similar device.
- One signal comprises light in the wavelength range that incorporates the wavelengths of the first, monochromatic light source 16 ′ and the wavelengths of the fluorescence that was generated downhole by the interaction of light from the monochromatic source and the fluid stream 3 .
- This signal is directed to the first spectrographic detector 18 ′ by means of fiber optic 17 ′.
- the second signal comprises the wavelength range that incorporates the wavelengths of the second, broadband source light source 16 ′′ .
- This signal is directed to the second spectrographic detector 18 ′′ by means of fiber optic 17 ′′.
- a first algorithm developed from an attenuation-based calibration would be used to determine concentration based on the attenuation analysis and a second algorithm developed from a fluorescence-based calibration would be used to determine concentration based on the fluorescence analysis. The concentration resulting from the two methods of analysis could then be compared for verification.
- the computer 20 is programed with software, shown schematically in FIG. 15, for determining the concentration based on the light components measured by the spectrographic detector 18 .
- the computer 20 in operation, in the first step 100 , the computer 20 first directs the light source 16 to transmit a beam of light to the sensor 12 , which directs the light emerging from the fluid to the spectrographic detector 18 .
- the computer in the second step 110 , the computer directs the spectrographic detector 18 to determine the intensity of the components of the emerging light at wavelengths within a predetermined range.
- the normalization factor f n is calculated from the measured intensities, for example using the equation indicated.
- step 130 the measured intensities at selected wavelengths, preprogramed into the computer, are normalized using the normalization factor determined in step 120 .
- step 140 the normalized intensities are applied to one or more algorithms preprogramed into the computer so as to calculate the concentration of the constituents of interest.
- step 150 the calculated concentration, for example 90% oil, is displayed on the indicator 22 .
- the normalization techniques applied in steps 120 and 130 and the algorithm applied in step 140 are discussed in detail below.
- the measured intensities of the light emerging from the fluid are normalized to eliminate the effect of scattering on the analysis.
- normalization is preferably performed using a characteristic of the intensity of the light emerging from the fluid over a range of wavelengths.
- n a number representing the particular mixture being analyzed
- i represents discrete wavelengths or wavelength ranges
- I in the measured intensity of the component of the emerging light for mixture n existing at wavelength i
- m the total number of component intensities used in the normalization (e.g., the total number of component intensities measured over a predetermined wavelength range).
- the measured intensity I in at any given wavelength is determined by integrating the intensity over at least a small wavelength band about the given wavelength in order to minimize errors due to slight deviations in wavelength detection.
- the measured intensity at a wavelength of 1100 nm, I 1100 is determined by integrating the intensity over a wavelength band from 1095 nm to 1105 nm.
- the integrated intensity over a relatively large band of wavelengths e.g., 950 to 1000 nm ) could be used if such a band contained valuable information on the concentration of a particular constituent.
- Normalization is performed by dividing the measured intensity I in in at each wavelength in the n th spectrum by the vector length f n so that
- normalization is performed by reference to the intensity of the portion of the collected light that represents the scattered laser light, determined by detecting the intensity of the collected light in a small band of wavelengths around the wavelength of the laser.
- the measured intensities can be normalized by dividing the intensity of the fluorescent radiation at each wavelength I i by the intensity of the transmitted laser light IL (e.g., determined by measuring the intensity of the transmitted light component at the wavelength of the laser light) so that:
- laser light intensity related values could also be used for the normalization, such as the area under the transmitted laser light spectrum.
- C kn The concentration of constituent k for mixture n (for example, C 12 is the percentage of oil for mixture 2 ).
- m The total number of light components whose intensities are used in the algorithm, which may, but need not be, the same as the number of light component intensities used in calculating the vector length or other normalization factor.
- ⁇ ki The weighting factor for constituent k at each of the selected wavelengths or wavelength ranges i, discussed further below.
- IN in The normalized intensity of the component of the light at wavelength i for fluid mixture n determined as discussed above.
- ⁇ ki Exponents for constituent k at each of the selected wavelengths or wavelength ranges i.
- ⁇ is 1 so that the algorithm will be linear.
- linearity may not yield sufficient accuracy, in which cases ⁇ may have values other than 1.
- the weighting factor ⁇ ki for each constituent shows the relative weight to be given the intensity at each of the selected wavelengths in determining the concentration of that constituent—that is, the extent to which the intensity of the light component at a given wavelength is a predictor of the concentration of the constituent of interest.
- the weighting factors may be positive or negative. If all of the wavelengths are used, rather than only the most significant, then. some of the weighting factors may be zero.
- the normalized intensity of the light component at each wavelength to be used in the algorithm is multiplied by a weighting factor the value of which is dependent upon the wavelength.
- the normalized and weighted intensities are then summed to arrive at the concentration of the constituent for which the algorithm was developed.
- Weighting Factors ( ⁇ ) Wavelength (i) Oil Water Gas 1100 100 400 200 1200 250 400 0 1300 130 100 80 1400 0 225 30 1500 150 0 20
- Equation 5 would then result in the following algorithms for concentrations of oil, water, and gas:
- the wavelengths used for the three equations above were drawn from the same five wavelength set.
- the selected wavelengths for each constituent might come from completely different sets of wavelengths.
- all of the wavelengths used in each of the algorithms would fall within the same range of wavelengths.
- the wavelengths used in the algorithm would all fall somewhere within the near-IR range (e.g., in the range from 800 nm to 1600 nm).
- the intensity of the light components at the prescribed wavelengths of the light emerging from the fluid flowing in the well is measured using either an attenuation or fluorescence technique.
- These measured component intensities are then normalized, as discussed above. For example, if vector length normalization were used, the vector length of the spectrum over a range of wavelengths (for example, all of the wavelengths in the 1100 to 1500 nm range) would be calculated from the measured intensities and the measured intensity at each of the wavelengths used in the algorithm would then be divided by the vector length so as to arrive at normalized intensities for those wavelengths.
- a set of normalized intensities might be:
- the algorithm might involve two or more equations for each constituent, each covering a different concentration range—for example, one equation for oil concentrations between 0% and 50% and another equation, with different weighting factors and/or selected wavelengths, for oil concentrations between 50% and 100%, etc.
- a Soft Independent Modeling by Class Analogy could be used. In this method, a classification model is generated based on the light intensities of mixtures that fall into the different concentration ranges selected. The model is then used to predict into which concentration range an unknown mixture falls.
- a calibration algorithm optimized for that range can be used to more accurately determine the concentration of the constituents of interest.
- classification models other than SIMCA can be used to achieve the same goal, such as K-nearest neighbors, discriminate analysis, principal component analysis, and neural nets.
- the computer 20 may also be programmed with software for performing the calculations associated with the development of the specific algorithm from the calibration data—that is, the identification of the weighting factors used to weight the importance of the intensities at various wavelengths in determining concentration, as discussed further below.
- Calibration is performed by obtaining quantities of each constituent and preparing various mixtures of differing concentrations that preferably span the range of concentrations to be encountered in operation. For example, if a mixture of crude oil and water from a producing well is to be analyzed, a quantity of pure crude oil extracted from the fluid produced by the well is obtained.
- the sensor 12 is then installed onto a container 50 , as shown in FIG. 5.
- a stirring device such as a stir plate 52 , is used to mix the oil and water in the container 50 .
- the sensor 12 ′ which may be similar to the sensor 12 shown in FIGS. 2 and 3, is coupled to the fluid analyzer 6 and light source 16 using a fiber optic cable 13 .
- the light source 16 and fluid analyzer 6 are as discussed above in connection with FIG. 1 .
- the same type and length of fiber optic cable 13 that will be used in actual service is employed so as to remove the effects of attenuation of the light as it travels through the long fiber optic cable on the calibration results.
- the equipment set up used is shown in FIG. 5 .
- the container 50 was filled with pure crude oil. In actual practice, the crude oil would be extracted from the fluid produced by the well.
- light Pennsylvania crude oil was used.
- the light source 16 used for this experiment was a quartz tungsten halogen lamp, which generated light having wavelengths that encompass the 1100 nm to 1550 nm range.
- the intensity of the source was set just below saturation of the detector at 0.1 sec integration ( ⁇ 50,000 counts/sec). This light was directed by the fiber optic 14′ to the sensor 12 , which then directed it to the oil in the container 50 .
- the light emerging from the oil was collected by the sensor 12 and transmitted by fiber optic 14 ′′ to the fluid analyzer 6 .
- the fiber optics 14 ′ and 14 ′′ were each approximately nine feet long.
- the fluid analyzer 6 employed a diode array to measure the intensity of the emerging light versus its wavelength so as to essentially develop the spectrum of light emerging from pure oil of the type produced by the well. This data was then stored in the computer 20 . Since crude oil has absorption peaks at about 1200 nm and 1400 nm, it was determined that the range of wavelengths to be used in the calibration was 1100 nm to 1520 nm. The spectrum of light emerging from pure crude oil in this wavelength range is shown in FIG. 6 . Since the intensity of the light emerging from the fluid is reduced at those wavelengths at which appreciable absorption occurs, the areas of greatest absorption appear as troughs in the spectrum of the emerging light.
- the spectra shown in FIG. 6 and utilized according to the current invention are not the spectra of the absorbed light but rather the spectra of the emerging light from the fluid, which contains those portions of the light that are scattered by or transmitted through the fluid (i.e., not absorbed).
- the stir plate 52 was used to maintain good mixing of the oil and water.
- the degree of mixing during data acquisition should approximate that of the fluid to be encountered in actual service—for example, the degree of mixing associated with the fluid flowing down hole in the well.
- a spectrum for the 1100 nm to 1550 nm range was obtained by measuring the intensity of the light component at each wavelength within the range so that intensity was measured at a total of 450 wavelengths.
- the intensity of the light from the fluid was measured simultaneously at all wavelength over a 0.1 second period. This measurement was repeated one hundred times and the readings averaged to arrive at a final intensity value for each wavelength. Data acquisition was repeated ten times so that ten sets of data was obtained for each mixture.
- the absolute intensity of the spectra vary quite dramatically with concentration. Specifically, higher concentrations of oil yield low absolute spectral intensities at the wavelengths for which absorption is high. As previously discussed, this results from two phenomena associated with the presence of oil—increased scattering and increased near-IR absorption. However, as also previously discussed, whereas the amount of absorption is a function of only the concentration of oil, the amount of scattering depends upon both the concentration and various multiphase characteristics, such as droplet size. Therefore, according to an important aspect of the current invention, the effect of scattering is minimized by normalizing the spectra. Thus, using the method previously discussed, the vector length of each of the spectra in FIG. 6 was calculated. Each spectrum was then divided by its own vector length so as to generate the normalized spectra shown in FIG. 7 . As can be seen, the peak intensity trends follow concentration, indicating that the normalized spectra are independent of the scattering properties of the various mixtures.
- a leave one out validation technique was employed to check the accuracy of the algorithm. Specifically, the partial least squares regression was run for each mixture used in the calibration except one and the resulting algorithm was then used to calculate the concentration of oil in the mixture left out and this computed value was compared to the actual value. This procedure was repeated for each mixture used in the calibration and the predicted versus actual values are shown plotted in FIG. 8 . These data revealed a standard error for the algorithm of only 2.9% in the percentage concentration value.
- the calibration procedure described above, as well as the procedure for determining weighting factors at each wavelength, as discussed below, are essentially the same whether the absorption or fluorescence methods are used to generate the emerging light from the fluid.
- a second experiment was conducted using the near-IR fluorescence method.
- the equipment used in this experiment was the same as that shown in FIG. 5 and discussed above in connection with the near-IR attenuation experiment, except in this case, the light source 16 was DBR laser, which emitted monochromatic light at a wavelength of about 852 nm, and a CCD was used for the spectrograph detector 18 .
- the same ratios of oil/water concentrations were used to generate the spectra based on near-IR attenuation shown in FIG.
- the attenuation method of the current invention can also be used to determine the concentration of natural gas in a fluid flow.
- Natural gas consists mainly of methane (CH 4 ), ethane (C 2 H 6 ) and other small chain hydrocarbons (e.g., propane and butane), which are characterized by the presence of methyl groups (—CH 3 ).
- Isooctane has a high percentage of methyl groups and its addition to crude oil flow would closely mimic the near-IR absorption behavior of an addition of liquefied or dissolved natural gas.
- Crude oil consists several different lengths of chain hydrocarbons, which consist of some methyl groups (CH 3 ) but predominantly methylene groups (CH 2 ). Both groups have distinct absorption bands in the near-IR region. Evans et. al, Analytical Chemistry, vol. 23, no. 11 (1951) used the ratio of these two absorption bands to determine the number of methyl and methylene groups per molecule in paraffins and lubrication oils.
- FIG. 11 shows near-IR spectra of crude oil with varying amounts of isooctane (0-50%). As the isooctane concentration increases, the methyl spectral band grows in intensity relative to the methylene band, which allows the method described above to distinguish between the two organic fluids.
- a mixture composed of 67% oil and 33% water was prepared as a starting point.
- the mixture was analyzed using the near-IR attenuation method.
- Light from a quartz tungsten halogen lamp 16 having strong emissions in the near-IR range was the directed to the mixture and analyzed by the InGaAs diode array. Additional measurements were taken as isooctane was subsequently added until a concentration of 25% isooctane was achieved.
- the intensity was measured at each wavelength in the 1100 nm to 1300 nm range (a total of 200 wavelengths).
- FIG. 13 shows the raw spectra taken from the mixtures of crude oil, water, and isooctane. The measured intensities were normalized using the spectrum vector lengths. The resulting normalized spectra are shown in FIG. 14 .
- any one of a number of well know regression techniques can be used to determine the weighting factors ⁇ to be used in weighing the values of the normalized component intensities measured in actual service in order to calculate concentration.
- the preferred regression technique is partial least squares regression.
- two or more techniques may be employed—for example, an initial regression model may be determined based on a partial least squares regression technique and then refined using a multiple least squares regression technique.
- Univariate regression is by far the most familiar technique for correlating spectral data to concentration. In chemical analysis this amounts to correlating the value of the peak spectral intensity IN n of spectrum n with the concentration C n of the constituent k of interest associated with that spectrum.
- the sequence of observations of IN n and C n from mixtures at each of the concentrations to be used in the calibration are used to derive a linear equation:
- This equation is optimized by minimizing the sum of the squares of the differences (residuals) between the predicted and true values; minimizing the residuals being one of the common threads that ties the various forms of regression together.
- ⁇ and b thus developed are used in equation 5 to determine the concentration of constituent k—for example, oil—in actual service. These calculations would be repeated for other constituents for which concentration was to be calculated—for example, gas—so that a equation in the form shown in equation 5 would be derived for each constituent, with each constituent having different values for the weighting factor ⁇ and b.
- MLS regression is another well known regression technique. Although the goal of MLS regression is identical to univariate least squares, i.e., to minimize the sum of the squares of the residuals, it allows more than one variable (i.e., normalized intensities at more than one wavelength) to be used in the regression analysis:
- ⁇ are essentially weighting factors that relate how much information each measured intensity, at each individual wavelength, contains concerning the concentration C.
- the largest values of the weighting factors ⁇ are associated with the wavelengths that have the most influence on the determination of concentration.
- MLS regression is an adequate procedure in some situations. However, it requires independence of the elements in the matrix subject to inversion—an unlikely situation for collinear spectroscopic data. Also, significant amounts of irrelevant information are likely to be incorporated into the model since every variable is included in the model.
- PCR principal component regression
- the magnitude of a particular loading for a given principle component indicates how much information that wavelength contributes to the principle component. Inspection of the loading matrix may reveal which wavelengths contain the most information about the concentration of the constituent of interest.
- the scores matrix simply relates the principal components back to the original spectra, i.e., the scores define how much a particular principal component contributes to a spectrum. Thus the first row vector of the scores matrix tells how much PC 1 , PC 2 , etc., contribute to the particular spectrum.
- the principal components are ranked in order of variance, i.e. PC 1 accounts for the greatest amount of variance in the set of input spectra. For this reason, the vast majority of the spectral information is included in the first few principal components, while the higher principal components are comprised mostly of noise.
- PCR suffers from a disadvantage in that the correlation between the property of interest and the spectral intensities is not included in the generation of the principle components.
- Partial least squares (PLS) regression also known as Projection to Latent Structures, is described, for example, in Wold, “Partial Least Squares,” in Encyclopedia of Statistic Sciences, Vol. 6, Katz and Johnson, Ed. (Wiley 1985), pp. 581-591 and Manne, “Analysis of Two Partial-Least-Squares Algorithms for Multivariant Calibration,” Chemom. Intell. Lab. Syst. (1987) 2:187-197, each of which is hereby incorporated by reference.
- PLS regression is a procedure that simultaneously estimates the eigenvectors in both the spectral data and the sample property data.
- PLS regression is fundamentally similar to PCR, it has the additional advantage of ordering its factors by considering both the variance of the spectral data and its correlation to the property of interest. Generally, this results in an equivalent or slightly more reliable model than PCR generates.
- An additional advantage of PLS regression involves a much faster computation time (when using a bidiagonalization procedure) compared to PCR.
- PLS regression shares many PCR characteristics—for example, PLS regression finds factors analogous to PCR's principal components. However, because these factors contain information about the correlations, they often yield more parsimonious and, in some situations, more reliable models than PCR.
- regression is preferred, other regression techniques could also be utilized, such as classical least squares, or inverse least squares in addition to any of the other techniques discussed above.
- neural net regression techniques could also be used, especially if the regression model were nonlinear.
- a number of regression techniques suitable for use in practicing the current invention are described more fully in R. Kramer, “Chemometric Techniques For Quantitative Analysis,” ISB 0-824-0198-4, Marcel Dekker (1998), incorporated by reference herein.
- a separate regression is performed for each constituent so that a weighting factors ⁇ i is obtained for each of the selected wavelengths to be used in the algorithm for each constituent.
- component intensities are preferably measured at each wavelength within a preselected range of wavelengths—for example, in the experiments discussed above, algorithms were constructed using the normalized intensity for each wavelength within the 1100 to 1520 nm range for oil using the near-IR absorption method, within the 18 to 770 pixels range for oil using the fluorescence method, and within the 1100 to 1300 nm range for gas using the near-IR absorption method.
- the weighting factor associated with many of these wavelengths i.e., those whose intensities can not be readily relied upon to determine concentration of the constituent of interest
- the algorithm can be constructed by selecting only key wavelengths within the range—specifically, those wavelengths whose intensities contain the maximum amount of information concerning the concentration of the constituents of interest.
- a variety of methods may be used to select the key wavelengths to be included in the algorithm, such as by inspection of the weighting factors in the algorithm.
- a large weighting factor means that the value of the intensity of the light at that wavelength will carry significant information about the concentration of interest.
- the wavelengths to be used in the algorithm are determined using a “leave one out” validation technique. This is accomplished by performing the calibration calculations discussed above using all but one of the mixtures for which data is available but so as to develop an algorithm containing only one wavelength—the wavelength having the highest weighting factor ⁇ . This algorithm is then used to predict the concentration for the mixture excluded from the calibration and the resulting error determined. The calibration calculations are then re-run but this time including the mixture previously excluded but leaving out a different mixture so as to develop another single-wavelength algorithm. Again the error associated with the predicted concentration for the new excluded mixture is determined. This process is repeated until each of the mixtures in the calibration have been left out. The predicted residual error sum of the squares (PRESS) associated with this one wavelength algorithm is then calculated.
- PRESS predicted residual error sum of the squares
- the calculations above are then repeated using an algorithm containing the wavelengths having the two highest weighting factors, and the PRESS associated with these algorithms is calculated.
- the calculations are then repeated adding one additional wavelength to the algorithm each time until an algorithm containing all of the wavelengths has been constructed.
- the algorithm that results in the lowest value for PRESS contains the optimum number of wavelengths.
- Calibration results can be improved if the algorithms are limited to certain concentration ranges. This can be accomplished by performing separate regression analyses for mixtures in concentrations within predetermined ranges—for example,. mixtures ranging between 0% to 50% oil are used in one regression to arrive at one algorithm and mixtures ranging between 50% to 100% oil are used in another regression to arrive at another algorithm—rather than using all of the mixtures from 0% to 100% in a single regression.
- the near-IR calibration data shown in FIGS. 6 and 7 were re-analyzed using the same partial least squares regression technique but, this time, the analysis was performed separately for the 0% to 50% oil concentration range and the 50% to 100% oil concentration range so as to develop two different algorithms, one for each range.
- both the near-IR attenuation data and the near-IR fluorescence data may be significantly dependent on the pressure and temperature of the fluid stream being analyzed, which may be at pressures and temperatures as high as 400° F. and 20,000 psig.
- it may be desirable to compensate for pressure and temperature effects by performing the calibration on mixtures at the pressures and temperatures expected to be encountered in actual service, or on mixtures of varying pressures and temperatures so as to arrive at a set of algorithms, each of which is applicable to a different ranges of pressures and/or temperatures.
- classification models can be constructed using mixtures compositions of varying pressure and temperature so that the light component data from the flowing fluid can be assigned to a concentration algorithm that has been optimized for the pressures and temperatures having ranges that encompass those of the flowing fluid.
- the invention will be described in connection with the analysis of the fluid flowing from a multilateral well into which production strings have been incorporated. It will be understood by those skilled in the art that the invention is equally applicable to other environments in which it is desirable to remotely sense the presence of a substance that fluoresces or absorbs radiation, such as oil, in a flowing fluid.
- a multilateral well 4 has three zones extending into the formation 2 .
- a section of a production string 8 is located in each zone so that all three zones produce fluids simultaneously.
- Each section of the production string 8 includes a valve 70 for regulating the flow of fluid from its zone.
- the fluid 25 flowing from the well 4 typically may comprise one or more of oil, water, natural gas, and solids, such as sand.
- the fluid 25 ′, 25 ′′ and 25 ′′′ from all three zones are combined into a common flow line 25 before reaching the surface.
- an analysis of the fluid at the surface will not enable the operator to assess the production of the individual zones of the well.
- a system for analyzing fluid according to the current invention is shown incorporated into each zone of the well 4 .
- an instrumented section 10 of the type shown in FIG. 1 have been incorporated into the branches of the production piping that extend into each zone of the well, along with a mixer 60 and diverter 62 .
- fiber optic cables 14 which may be several kilometers long, connect each of the instrumented sections 10 to the light source 16 and fluid analyzer 6 at the surface.
- the computer 20 of the fluid analyzer 6 is programed with an appropriate algorithm for calculating the concentrations of oil and water, each of which is preferably in the form of equation [5] so that it employs weighting factors for selected wavelengths, which are preferably determined based on a calibration of the oil from the well.
- the light source 16 periodically or continuously transmits light to each of the sensors 12 in the instrumented sections 10 via the optical fibers 14 ′.
- the intensity of the components of the collected light returned from each of the sensors 12 by the optical fibers 14 ′′ over a predetermined range of wavelengths is measured using the spectrographic detector 18 .
- the computer 20 periodically or continuously calculates the concentrations of oil and water flowing through each of the zones of the well, using software that allows it to calculate the normalized intensity of the measured light components, preferably using one of the normalization techniques previously discussed, and then apply those normalized intensities to the aforementioned algorithms.
- the calculated concentrations of oil and water are then displayed by the indicator 24 .
- Incorporating instrumented sections 10 in each zone of the well 4 allows the operator to determine the percentage of oil and/or water in the fluid flowing downhole through each zone on a nearly real-time basis. This information can, in turn, be used to regulate the flow from each zone so as to optimize production, for example, by operating the valve 70 to reduce the flow from a zone producing a low percentage of crude oil, or excessive water.
- the present invention has been discussed in connection with the determination of the concentration of crude oil or gas in an oil well producing an oil/water/gas mixture, the invention can be used to determine the concentration, or merely detect the presence, of oil or gas in other applications, such as when contamination of water by oil is suspected. Alternatively, the invention can be used to determine the concentration or detect the presence of other substances that fluoresce or absorb radiation in flowing streams that have scattering characteristics.
- mixer and diverter have been discussed in connection with the sensor of a fluid analyzer, these components could also be used in connection with other types of sensors used in the well piping.
Priority Applications (5)
| Application Number | Priority Date | Filing Date | Title |
|---|---|---|---|
| US09/453,003 US6507401B1 (en) | 1999-12-02 | 1999-12-02 | Apparatus and method for analyzing fluids |
| PCT/US2000/032483 WO2001040771A2 (en) | 1999-12-02 | 2000-11-29 | Apparatus and method for analyzing fluids |
| CA002392924A CA2392924A1 (en) | 1999-12-02 | 2000-11-29 | Apparatus and method for analyzing fluids |
| AU19326/01A AU1932601A (en) | 1999-12-02 | 2000-11-29 | Apparatus and method for analyzing fluids |
| US10/247,192 US6707556B2 (en) | 1999-12-02 | 2002-09-19 | Apparatus and method for analyzing fluids |
Applications Claiming Priority (1)
| Application Number | Priority Date | Filing Date | Title |
|---|---|---|---|
| US09/453,003 US6507401B1 (en) | 1999-12-02 | 1999-12-02 | Apparatus and method for analyzing fluids |
Related Child Applications (1)
| Application Number | Title | Priority Date | Filing Date |
|---|---|---|---|
| US10/247,192 Division US6707556B2 (en) | 1999-12-02 | 2002-09-19 | Apparatus and method for analyzing fluids |
Publications (1)
| Publication Number | Publication Date |
|---|---|
| US6507401B1 true US6507401B1 (en) | 2003-01-14 |
Family
ID=23798843
Family Applications (2)
| Application Number | Title | Priority Date | Filing Date |
|---|---|---|---|
| US09/453,003 Expired - Lifetime US6507401B1 (en) | 1999-12-02 | 1999-12-02 | Apparatus and method for analyzing fluids |
| US10/247,192 Expired - Lifetime US6707556B2 (en) | 1999-12-02 | 2002-09-19 | Apparatus and method for analyzing fluids |
Family Applications After (1)
| Application Number | Title | Priority Date | Filing Date |
|---|---|---|---|
| US10/247,192 Expired - Lifetime US6707556B2 (en) | 1999-12-02 | 2002-09-19 | Apparatus and method for analyzing fluids |
Country Status (4)
Cited By (48)
| Publication number | Priority date | Publication date | Assignee | Title |
|---|---|---|---|---|
| US20030056581A1 (en) * | 1999-12-02 | 2003-03-27 | Turner William Edward | Apparatus and method for analyzing fluids |
| US6678050B2 (en) * | 2000-04-11 | 2004-01-13 | Welldog, Inc. | In-situ detection and analysis of methane in coal bed methane formations with spectrometers |
| US20040017569A1 (en) * | 2002-07-23 | 2004-01-29 | Payne Fred A. | System and method for sensing a characteristic of a fluid and related apparatus |
| US20040021469A1 (en) * | 2002-07-31 | 2004-02-05 | Diametrics Medical, Inc. | Apparatus and method for analytical determinations |
| US20040084623A1 (en) * | 2002-11-06 | 2004-05-06 | Yicheng Long | NIR spectroscopy method for analyzing chemical process components |
| US6768105B2 (en) * | 2000-10-10 | 2004-07-27 | Schlumberger Technology Corporation | Methods and apparatus for downhole fluids analysis |
| FR2853416A1 (fr) * | 2003-04-04 | 2004-10-08 | Inst Francais Du Petrole | Methode pour determiner la composition d'un fluide homogene ou heterogene |
| US20040216521A1 (en) * | 2003-05-02 | 2004-11-04 | Baker Hughes Incorporated | Method and apparatus for a continuous data recorder for a downhole sample tank |
| US6820013B1 (en) * | 1999-12-23 | 2004-11-16 | Merck Patent Gmbh | Method and device for the online analysis of solvent mixtures |
| US20040229376A1 (en) * | 2003-04-04 | 2004-11-18 | Claude Beauducel | Method for determining the composition of a liquid |
| US20050029457A1 (en) * | 2002-01-01 | 2005-02-10 | Long Robert L. | Method and apparatus for on-line measurement of polymer properties |
| US6970248B1 (en) * | 2002-05-17 | 2005-11-29 | Reflectronics, Incorporated | Method for the detection of product transitions in liquid piping systems |
| US20060009875A1 (en) * | 2004-07-09 | 2006-01-12 | Simpson Michael B | Chemical mixing apparatus, system and method |
| US20060080041A1 (en) * | 2004-07-08 | 2006-04-13 | Anderson Gary R | Chemical mixing apparatus, system and method |
| US7249968B1 (en) | 2004-08-16 | 2007-07-31 | Aps Technology, Inc. | Electrical connections for harsh conditions |
| US20080172141A1 (en) * | 2004-07-08 | 2008-07-17 | Simpson Michael B | Chemical Mixing Apparatus, System And Method |
| US20090087911A1 (en) * | 2007-09-28 | 2009-04-02 | Schlumberger Technology Corporation | Coded optical emission particles for subsurface use |
| US20090087912A1 (en) * | 2007-09-28 | 2009-04-02 | Shlumberger Technology Corporation | Tagged particles for downhole application |
| US20090153845A1 (en) * | 2007-12-14 | 2009-06-18 | Baker Hughes Incorporated | Fiber optic refractometer |
| US20100177310A1 (en) * | 2009-01-15 | 2010-07-15 | Baker Hughes Incorporated | Evanescent wave downhole fiber optic spectrometer |
| US20100228688A1 (en) * | 2005-10-06 | 2010-09-09 | Paul Little | Optical determination and reporting of gas properties |
| US20100245096A1 (en) * | 2004-12-09 | 2010-09-30 | Halliburton Energy Services, Inc. | Optical data transformation |
| US20100299068A1 (en) * | 2007-06-08 | 2010-11-25 | Guy Harvey Mason | Apparatus for determining the concentration of a conductive fluid present in a fluid filled borehole |
| US20110083994A1 (en) * | 2009-10-13 | 2011-04-14 | Sirota Eric B | Onset haze measurement apparatus and procedure |
| US20130066605A1 (en) * | 2011-04-26 | 2013-03-14 | Baker Hughes Incorporated | Apparatus and method for estimating formation lithology using x-ray flourescence |
| US8445841B2 (en) | 2011-01-04 | 2013-05-21 | Exxonmobil Research And Engineering Company | Method and apparatus for a mid-infrared (MIR) system for real time detection of petroleum in colloidal suspensions of sediments and drilling muds during drilling operations, logging and production operations |
| US8481930B2 (en) | 2010-06-15 | 2013-07-09 | Saudi Arabian Oil Company | Apparatus and method for replicating liquid blends and identifying the ratios of their liquid ingredients |
| US8615364B1 (en) * | 2011-02-17 | 2013-12-24 | Selman and Associates, Ltd. | Computer readable medium for acquiring and displaying in near real time gas analysis, well data collection, and other well logging data |
| US8618226B2 (en) | 2011-05-19 | 2013-12-31 | Bridgestone Corporation | Method for quantitative analysis of styrene microblock content |
| US20140246574A1 (en) * | 2005-03-14 | 2014-09-04 | Gas Sensing Technology Corp | In-situ Detection and Analysis of Methane in Coal Bed Methane Formations with Spectrometers |
| US20140339412A1 (en) * | 2011-12-14 | 2014-11-20 | Schlumberger Technology Corporation | Solid State Lasers |
| US20150000383A1 (en) * | 2012-02-03 | 2015-01-01 | Pietro Fiorentini Spa | Measuring unit for determining the composition of the liquid phase in a multi-phase mixture |
| US9091151B2 (en) | 2009-11-19 | 2015-07-28 | Halliburton Energy Services, Inc. | Downhole optical radiometry tool |
| US9182360B2 (en) | 2013-07-22 | 2015-11-10 | Honeywell Asca Inc. | Multi-frequency microwave sensor for temperature independent measurement of moisture |
| US20160123872A1 (en) * | 2014-10-29 | 2016-05-05 | Chevron U.S.A. Inc. | Method and system for nir spectroscopy of mixtures to evaluate composition of components of the mixtures |
| US20160195508A1 (en) * | 2015-01-05 | 2016-07-07 | Saudi Arabian Oil Company | Characterization of crude oil and its fractions by fluorescence spectroscopy analysis |
| US9423393B2 (en) | 2002-06-28 | 2016-08-23 | International Technidyne Corporation | Analytical test cartridge; and, methods |
| US9581493B2 (en) * | 2014-02-12 | 2017-02-28 | Bruker Optics, Inc. | Acquiring a Raman spectrum with multiple lasers |
| US20170307584A1 (en) * | 2016-04-26 | 2017-10-26 | Saudi Arabian Oil Company | Characterizing lubricant oil degradation using fluorescence signals |
| US9863191B1 (en) | 2014-05-02 | 2018-01-09 | Russell D. Ide | Flexible coupling |
| US10025000B2 (en) | 2016-01-21 | 2018-07-17 | Baker Hughes Incorporated | Optical sensors for downhole tools and related systems and methods |
| US10088422B2 (en) | 2015-12-28 | 2018-10-02 | Schlumberger Technology Corporation | Raman spectroscopy for determination of composition of natural gas |
| US10120097B2 (en) | 2016-04-05 | 2018-11-06 | Baker Hughes Incorporated | Methods and apparatus for measuring hydrogen sulfide in downhole fluids |
| US10151687B2 (en) | 2015-04-27 | 2018-12-11 | Virtual Fluid Monitoring Services, Llc | Systems, apparatuses, and methods for fluid analysis and monitoring |
| WO2019088953A3 (en) * | 2017-08-03 | 2019-06-20 | Bahcesehir Universitesi | An underwater analysis device for analyzing absorption capacity of water |
| US10557776B2 (en) | 2015-04-27 | 2020-02-11 | Virtual Fluid Monitoring Services, Llc | Fluid analysis and monitoring using optical spectrometry |
| US20220026360A1 (en) * | 2020-07-22 | 2022-01-27 | Agar Corporation, Inc. | Fluorescence and scatter and absorption spectroscopic apparatus with a sapphire tube and method for analyzing inline low level hydrocarbon in a flow medium |
| US11442019B2 (en) | 2018-06-19 | 2022-09-13 | Virtual Fluid Monitoring Services, Llc | Fluid analysis and monitoring using optical spectroscopy |
Families Citing this family (94)
| Publication number | Priority date | Publication date | Assignee | Title |
|---|---|---|---|---|
| US7241621B2 (en) * | 2001-11-30 | 2007-07-10 | Exxonmobil Research And Engineering Company | Method for determining residual fuel and insolubles contamination in used marine engine lubricants using UV-visible spectroscopy and chemometrics |
| EP1327875A1 (de) * | 2002-01-11 | 2003-07-16 | Abb Research Ltd. | Verfahren und Vorrichtung zur Bestimmung von Ölkonzentrationen in Wasser |
| US7087901B2 (en) * | 2002-03-20 | 2006-08-08 | Ag Leader Technology, Inc. | High speed analyzer using near infrared radiation transmitted through thick samples of optically dense materials |
| US8899323B2 (en) | 2002-06-28 | 2014-12-02 | Schlumberger Technology Corporation | Modular pumpouts and flowline architecture |
| US7178591B2 (en) * | 2004-08-31 | 2007-02-20 | Schlumberger Technology Corporation | Apparatus and method for formation evaluation |
| US8210260B2 (en) | 2002-06-28 | 2012-07-03 | Schlumberger Technology Corporation | Single pump focused sampling |
| US8555968B2 (en) | 2002-06-28 | 2013-10-15 | Schlumberger Technology Corporation | Formation evaluation system and method |
| US7336358B2 (en) * | 2003-02-24 | 2008-02-26 | August Ninth Analyses, Inc. | Method and apparatus for determining particle size and composition of mixtures |
| US6956204B2 (en) * | 2003-03-27 | 2005-10-18 | Schlumberger Technology Corporation | Determining fluid properties from fluid analyzer |
| US20050092941A1 (en) * | 2003-06-06 | 2005-05-05 | Aventis Pharma Deutschland Gmbh | Method and device for the quantitative analysis of solutions and dispersions by means of near infrared spectroscopy |
| US20060097173A1 (en) * | 2003-10-15 | 2006-05-11 | Sanofi-Aventis Deutschland | Method and device for the quantitative analysis of solutions and dispersions by means of near infrared spectroscopy |
| US20040252748A1 (en) * | 2003-06-13 | 2004-12-16 | Gleitman Daniel D. | Fiber optic sensing systems and methods |
| US7132644B2 (en) * | 2003-10-02 | 2006-11-07 | Mazet Gmbh | Photo sensor for standardized color measurement |
| EP1699422A4 (en) * | 2003-12-31 | 2009-04-29 | Univ South Carolina | THIN-FILED POROUS OPTICAL SENSORS FOR GASES AND OTHER LIQUIDS |
| US20060155178A1 (en) * | 2004-03-26 | 2006-07-13 | Vadim Backman | Multi-dimensional elastic light scattering |
| US20070201136A1 (en) * | 2004-09-13 | 2007-08-30 | University Of South Carolina | Thin Film Interference Filter and Bootstrap Method for Interference Filter Thin Film Deposition Process Control |
| US7233001B2 (en) * | 2005-02-24 | 2007-06-19 | Weatherford/Lamb, Inc. | Multi-channel infrared optical phase fraction meter |
| US7834312B2 (en) * | 2005-02-24 | 2010-11-16 | Weatherford/Lamb, Inc. | Water detection and 3-phase fraction measurement systems |
| GB2426579B (en) * | 2005-05-28 | 2008-01-16 | Schlumberger Holdings | Devices and methods for quantification of liquids in gas-condensate wells |
| DE102005027896B4 (de) * | 2005-06-16 | 2012-03-15 | MAX-PLANCK-Gesellschaft zur Förderung der Wissenschaften e.V. | Verfahren zum optischen Messen einer Probe |
| US7933018B2 (en) * | 2005-08-15 | 2011-04-26 | Schlumberger Technology Corporation | Spectral imaging for downhole fluid characterization |
| US20090203977A1 (en) * | 2005-10-27 | 2009-08-13 | Vadim Backman | Method of screening for cancer using parameters obtained by the detection of early increase in microvascular blood content |
| US20070129615A1 (en) * | 2005-10-27 | 2007-06-07 | Northwestern University | Apparatus for recognizing abnormal tissue using the detection of early increase in microvascular blood content |
| US20070179368A1 (en) * | 2005-10-27 | 2007-08-02 | Northwestern University | Method of recognizing abnormal tissue using the detection of early increase in microvascular blood content |
| US9314164B2 (en) | 2005-10-27 | 2016-04-19 | Northwestern University | Method of using the detection of early increase in microvascular blood content to distinguish between adenomatous and hyperplastic polyps |
| EP1974201A1 (en) | 2005-11-28 | 2008-10-01 | University of South Carolina | Optical analysis system for dynamic, real-time detection and measurement |
| US8345234B2 (en) * | 2005-11-28 | 2013-01-01 | Halliburton Energy Services, Inc. | Self calibration methods for optical analysis system |
| US20070166245A1 (en) | 2005-11-28 | 2007-07-19 | Leonard Mackles | Propellant free foamable toothpaste composition |
| EP1969326B1 (en) | 2005-11-28 | 2020-06-10 | Ometric Corporation | Optical analysis system and method for real time multivariate optical computing |
| US9170154B2 (en) | 2006-06-26 | 2015-10-27 | Halliburton Energy Services, Inc. | Data validation and classification in optical analysis systems |
| WO2008057912A2 (en) * | 2006-11-02 | 2008-05-15 | University Of South Carolina | Multi-analyte optical computing system |
| US8063384B2 (en) * | 2006-11-28 | 2011-11-22 | Nippon Sheet Glass Company, Limited | Detection system and probe therefor |
| WO2008105435A1 (ja) * | 2007-02-28 | 2008-09-04 | Nippon Sheet Glass Company, Limited | 蛍光検出システム |
| US8184295B2 (en) * | 2007-03-30 | 2012-05-22 | Halliburton Energy Services, Inc. | Tablet analysis and measurement system |
| US8213006B2 (en) * | 2007-03-30 | 2012-07-03 | Halliburton Energy Services, Inc. | Multi-analyte optical computing system |
| EP2140238B1 (en) * | 2007-03-30 | 2020-11-11 | Ometric Corporation | In-line process measurement systems and methods |
| US20080245960A1 (en) * | 2007-04-09 | 2008-10-09 | Baker Hughes Incorporated | Method and Apparatus to Determine Characteristics of an Oil-Based Mud Downhole |
| US20100181472A1 (en) * | 2007-04-09 | 2010-07-22 | Baker Hughes Incorporated | Method and Apparatus to Determine Characteristics of an Oil-Based Mud Downhole |
| US7601950B2 (en) * | 2007-09-25 | 2009-10-13 | Baker Hughes Incorporated | System and method for downhole optical analysis |
| US8487238B2 (en) * | 2007-11-01 | 2013-07-16 | Baker Hughes Incorporated | Method of identification of petroleum compounds using frequency mixing on surfaces |
| US20110044876A1 (en) * | 2007-11-26 | 2011-02-24 | Rutgers University | Low temperature metal oxide synthesis |
| US8283633B2 (en) * | 2007-11-30 | 2012-10-09 | Halliburton Energy Services, Inc. | Tuning D* with modified thermal detectors |
| US20090151939A1 (en) * | 2007-12-13 | 2009-06-18 | Schlumberger Technology Corporation | Surface tagging system with wired tubulars |
| US8172007B2 (en) | 2007-12-13 | 2012-05-08 | Intelliserv, LLC. | System and method of monitoring flow in a wellbore |
| WO2009080049A1 (en) * | 2007-12-21 | 2009-07-02 | Dma Sorption Aps | Monitoring oil condition and/or quality, on-line or at-line, based on chemometric data analysis of flourescence and/or near infrared spectra |
| US8212213B2 (en) * | 2008-04-07 | 2012-07-03 | Halliburton Energy Services, Inc. | Chemically-selective detector and methods relating thereto |
| JP5207462B2 (ja) * | 2008-10-06 | 2013-06-12 | 国立大学法人大阪大学 | 液体の検査方法および液体検査装置 |
| CN102428377B (zh) * | 2009-05-12 | 2015-08-12 | 赛默飞世尔科技有限公司 | 颗粒检测与传感器的校准 |
| GB0911766D0 (en) * | 2009-07-03 | 2009-08-19 | Aquanet Internat Ltd | Monitoring and control of liquid additive |
| FI123359B (fi) * | 2009-07-17 | 2013-03-15 | Ima Engineering Ltd Oy | Menetelmä märän porasoijan analysoimiseksi |
| WO2011019755A1 (en) * | 2009-08-10 | 2011-02-17 | Zolo Technologies, Inc. | Mitigation of optical signal noise using a multimode transmit fiber |
| CN102575984B (zh) * | 2009-08-17 | 2016-01-06 | 马尔文仪器有限公司 | 以经改良单光散射模式检测复杂流体的基于动态光散射的微流变性 |
| DE102011106070A1 (de) * | 2011-06-30 | 2013-01-03 | Udo Hartmann | Vorrichtung, System und Verfahren zum Bestimmen des Zustands eines Brunnens |
| US9182355B2 (en) | 2011-08-05 | 2015-11-10 | Halliburton Energy Services, Inc. | Systems and methods for monitoring a flow path |
| US9206386B2 (en) | 2011-08-05 | 2015-12-08 | Halliburton Energy Services, Inc. | Systems and methods for analyzing microbiological substances |
| US9261461B2 (en) | 2011-08-05 | 2016-02-16 | Halliburton Energy Services, Inc. | Systems and methods for monitoring oil/gas separation processes |
| US9222892B2 (en) | 2011-08-05 | 2015-12-29 | Halliburton Energy Services, Inc. | Systems and methods for monitoring the quality of a fluid |
| US9222348B2 (en) * | 2011-08-05 | 2015-12-29 | Halliburton Energy Services, Inc. | Methods for monitoring the formation and transport of an acidizing fluid using opticoanalytical devices |
| US9464512B2 (en) | 2011-08-05 | 2016-10-11 | Halliburton Energy Services, Inc. | Methods for fluid monitoring in a subterranean formation using one or more integrated computational elements |
| US9395306B2 (en) * | 2011-08-05 | 2016-07-19 | Halliburton Energy Services, Inc. | Methods for monitoring fluids within or produced from a subterranean formation during acidizing operations using opticoanalytical devices |
| US8997860B2 (en) | 2011-08-05 | 2015-04-07 | Halliburton Energy Services, Inc. | Methods for monitoring the formation and transport of a fracturing fluid using opticoanalytical devices |
| US8960294B2 (en) | 2011-08-05 | 2015-02-24 | Halliburton Energy Services, Inc. | Methods for monitoring fluids within or produced from a subterranean formation during fracturing operations using opticoanalytical devices |
| US9441149B2 (en) | 2011-08-05 | 2016-09-13 | Halliburton Energy Services, Inc. | Methods for monitoring the formation and transport of a treatment fluid using opticoanalytical devices |
| US9297254B2 (en) | 2011-08-05 | 2016-03-29 | Halliburton Energy Services, Inc. | Methods for monitoring fluids within or produced from a subterranean formation using opticoanalytical devices |
| US8534115B2 (en) * | 2011-10-17 | 2013-09-17 | Schlumberger Technology Corporation | Systems and methods of determining parameter values in a downhole environment |
| US8881577B1 (en) | 2012-04-02 | 2014-11-11 | Agar Corporation, Ltd. | Method and system for analysis of rheological properties and composition of multi-component fluids |
| US9013702B2 (en) | 2012-04-26 | 2015-04-21 | Halliburton Energy Services, Inc. | Imaging systems for optical computing devices |
| US9013698B2 (en) | 2012-04-26 | 2015-04-21 | Halliburton Energy Services, Inc. | Imaging systems for optical computing devices |
| US9080943B2 (en) | 2012-04-26 | 2015-07-14 | Halliburton Energy Services, Inc. | Methods and devices for optically determining a characteristic of a substance |
| US8912477B2 (en) | 2012-04-26 | 2014-12-16 | Halliburton Energy Services, Inc. | Methods and devices for optically determining a characteristic of a substance |
| US9383307B2 (en) | 2012-04-26 | 2016-07-05 | Halliburton Energy Services, Inc. | Methods and devices for optically determining a characteristic of a substance |
| US9658149B2 (en) | 2012-04-26 | 2017-05-23 | Halliburton Energy Services, Inc. | Devices having one or more integrated computational elements and methods for determining a characteristic of a sample by computationally combining signals produced therewith |
| US9019501B2 (en) | 2012-04-26 | 2015-04-28 | Halliburton Energy Services, Inc. | Methods and devices for optically determining a characteristic of a substance |
| US9702811B2 (en) | 2012-04-26 | 2017-07-11 | Halliburton Energy Services, Inc. | Methods and devices for optically determining a characteristic of a substance using integrated computational elements |
| US8941046B2 (en) | 2012-04-26 | 2015-01-27 | Halliburton Energy Services, Inc. | Methods and devices for optically determining a characteristic of a substance |
| SG11201503539QA (en) * | 2012-12-27 | 2015-06-29 | Halliburton Energy Services Inc | Optical device and method for predicting and mitigating hydrate formation using an integrated computation element |
| US8970837B2 (en) * | 2013-03-14 | 2015-03-03 | Laxco Inc. | Apparatus for taking an accurate photometric measurement of a liquid |
| US9074461B2 (en) * | 2013-06-06 | 2015-07-07 | Schlumberger Technology Corporation | Fluid analyzer with plasma emission unit and method of using same |
| US20140361172A1 (en) * | 2013-06-11 | 2014-12-11 | Jp3 Measurement, Llc | Detection of h2s in natural gas and hydrocarbon streams using a dual-path near-ir spectroscopy system |
| GB2529770B (en) * | 2013-06-20 | 2018-08-15 | Halliburton Energy Services Inc | Implementation concepts and related methods for optical computing devices |
| US9869664B2 (en) | 2013-12-18 | 2018-01-16 | Saudi Arabian Oil Company | Method for non-intrusive measurement of low water content in oil |
| WO2016010540A1 (en) * | 2014-07-17 | 2016-01-21 | Halliburton Energy Services, Inc. | Molecular factor computing sensor for intelligent well completion |
| GB2530486B (en) | 2014-09-15 | 2017-08-02 | Schlumberger Holdings | Active surface cleaning for a sensor |
| GB2530095B (en) | 2014-09-15 | 2017-07-12 | Schlumberger Holdings | Mid-infrared sensor |
| GB2530485B (en) | 2014-09-15 | 2017-02-22 | Schlumberger Holdings | Mid-infrared carbon dioxide sensor |
| GB2530099B (en) | 2014-09-15 | 2019-01-02 | Schlumberger Holdings | Temperature invariant infrared filter |
| GB2530098B (en) | 2014-09-15 | 2017-02-22 | Schlumberger Holdings | Mid-infrared acid sensor |
| MX2018000899A (es) | 2015-07-20 | 2018-05-22 | Pietro Fiorentini Spa | Sistemas y metodos para monitorizar cambios en una formacion mientras fluidos fluyen dinamicamente. |
| CN105223143B (zh) * | 2015-09-02 | 2018-04-17 | 中国石油天然气集团公司 | 一种测定油田污水中压裂液含量的方法 |
| WO2017209685A1 (en) * | 2016-06-03 | 2017-12-07 | Brännström Gruppen Ab | Method and apparatus for determining a concentration of a substance in a liquid medium |
| SE540009C2 (en) | 2016-06-03 | 2018-02-20 | Braennstroem Gruppen Ab | Method and apparatus for determining a concentration of a substance in a liquid medium |
| RU2688886C1 (ru) * | 2018-06-05 | 2019-05-22 | Федеральное государственное бюджетное учреждение науки Институт мониторинга климатических и экологических систем Сибирского отделения Российской академии наук | Способ газоанализа природного газа |
| DE102019109787A1 (de) | 2019-04-12 | 2020-10-15 | Endress+Hauser SE+Co. KG | Hygienegerechter Rohradapter |
| JP2022168725A (ja) * | 2021-04-26 | 2022-11-08 | 日亜化学工業株式会社 | 発光装置、灯具及び街路灯 |
Citations (113)
| Publication number | Priority date | Publication date | Assignee | Title |
|---|---|---|---|---|
| US2334475A (en) | 1938-12-03 | 1943-11-16 | Schlumberger Well Surv Corp | Method and apparatus for investigating earth formations traversed by boreholes |
| US2423774A (en) | 1942-04-02 | 1947-07-08 | Standard Oil Dev Co | Oil determination |
| US2425531A (en) | 1944-09-30 | 1947-08-12 | Sun Oil Co | Method of detecting leakage in oil wells |
| US3371574A (en) | 1963-07-31 | 1968-03-05 | Robert J. Dwyer | Oil detection device utilizing raman radiation |
| US3806727A (en) | 1973-05-11 | 1974-04-23 | Avco Everett Res Lab Inc | Optical detector system |
| US3842270A (en) | 1973-10-29 | 1974-10-15 | Continental Oil Co | Pressurized oil-in-water monitor |
| US3859851A (en) | 1973-12-12 | 1975-01-14 | Schlumberger Technology Corp | Methods and apparatus for testing earth formations |
| US3896312A (en) | 1974-06-07 | 1975-07-22 | Christopher W Brown | Petroleum identification |
| US3917945A (en) | 1973-06-21 | 1975-11-04 | Hayashi Katsuhiki | Method and apparatus for detecting the degree of contamination of waste water |
| US3972648A (en) | 1973-12-26 | 1976-08-03 | Sangster Paul B | Well controller and monitor |
| US4012712A (en) | 1975-03-31 | 1977-03-15 | Schlumberger Technology Corporation | System for telemetering well logging data |
| US4023201A (en) | 1976-04-26 | 1977-05-10 | Infrared Surveys, Incorporated | Infrared thermography for determining equipment temperatures in oil well fires |
| US4057721A (en) | 1975-05-08 | 1977-11-08 | Bailey Meter & Controls Limited | Oil pollution monitoring and monitoring unit |
| US4059356A (en) | 1975-02-24 | 1977-11-22 | Environmental Research & Technology, Inc. | Gas detector |
| US4227083A (en) | 1979-02-02 | 1980-10-07 | General Electric Company | Apparatus for infrared laser spectroscopy of room temperature vulcanizable silicone compositions |
| US4323777A (en) | 1980-05-19 | 1982-04-06 | Infrared Industries, Inc. | Hydrocarbon gas analyzer |
| US4371785A (en) | 1980-08-14 | 1983-02-01 | Panametrics, Inc. | Method and apparatus for detection and analysis of fluids |
| US4370886A (en) | 1981-03-20 | 1983-02-01 | Halliburton Company | In situ measurement of gas content in formation fluid |
| US4375164A (en) | 1981-04-22 | 1983-03-01 | Halliburton Company | Formation tester |
| US4394573A (en) | 1980-12-15 | 1983-07-19 | Conoco Inc. | Method and apparatus for underwater detection of hydrocarbons |
| US4396259A (en) | 1981-10-20 | 1983-08-02 | Miller Thomas H | Spectrum glasses |
| US4399359A (en) | 1980-12-08 | 1983-08-16 | Dresser Industries, Inc. | Method for monitoring flood front movement during water flooding of subsurface formations |
| US4427944A (en) | 1980-07-07 | 1984-01-24 | Schlumberger Technology Corporation | System for permeability logging by measuring streaming potentials |
| US4446370A (en) | 1981-12-28 | 1984-05-01 | Conoco Inc. | Apparatus for detecting oil in water |
| US4492862A (en) | 1981-08-07 | 1985-01-08 | Mathematical Sciences Northwest, Inc. | Method and apparatus for analyzing components of hydrocarbon gases recovered from oil, natural gas and coal drilling operations |
| US4540283A (en) | 1983-06-20 | 1985-09-10 | Bachalo William D | Apparatus and method for determining the size and velocity of particles, droplets, bubbles or the like using laser light scattering |
| US4547774A (en) * | 1981-07-20 | 1985-10-15 | Optelcom, Inc. | Optical communication system for drill hole logging |
| US4587640A (en) | 1982-11-12 | 1986-05-06 | Tokyo Shibaura Denki Kabushiki Kaisha | Cassette type semiconductor memory device |
| US4598290A (en) | 1983-06-29 | 1986-07-01 | Mobil Oil Corporation | Fiber optic penetrator for offshore oil well exploration and production |
| US4602160A (en) | 1983-09-28 | 1986-07-22 | Sentrol Systems Ltd. | Infrared constituent analyzer and control system |
| US4608859A (en) | 1983-12-28 | 1986-09-02 | Microlytics, Inc. | Process and apparatus for analyzing cutting from oil and gas wells |
| US4609821A (en) | 1983-07-06 | 1986-09-02 | Nl Industries, Inc. | Testing for the presence of native hydrocarbons down a borehole |
| US4620284A (en) | 1983-12-29 | 1986-10-28 | Uop Inc. | Qualitative and quantitative analysis using Raman scattering |
| US4659218A (en) | 1985-05-23 | 1987-04-21 | Canadian Patents & Development Corporation | Multi-probe system for measuring bubble characteristics gas hold-up, liquid hold-up and solid hold-up in a three-phase fluidized bed |
| US4663961A (en) | 1985-09-17 | 1987-05-12 | Westinghouse Electric Corp. | System for remote chemical analysis |
| US4766543A (en) | 1985-04-22 | 1988-08-23 | Western Atlas International, Inc. | Well logging direct memory access system and method |
| US4770243A (en) | 1986-09-02 | 1988-09-13 | Societe Nationale Elf Aquitaine (Production) | Device for regulating the rate of flow of water which is separated from its mixture with hydrocarbons and reinjected into the bottom of the well |
| US4800279A (en) | 1985-09-13 | 1989-01-24 | Indiana University Foundation | Methods and devices for near-infrared evaluation of physical properties of samples |
| US4814614A (en) | 1987-05-11 | 1989-03-21 | Mobil Oil Corporation | Method for characterizing oil-bearing inclusions via fluorescence microspectrophotometry |
| US4825073A (en) | 1987-12-14 | 1989-04-25 | Halliburton Logging Services Inc. | Method for determining depth of penetration of radioactive tracers in formation fractures |
| US4874243A (en) | 1986-09-01 | 1989-10-17 | Benno Perren | Apparatus for continuously measuring the turbidity of a fluid |
| US4891640A (en) | 1988-11-03 | 1990-01-02 | Halliburton Logging Services, Inc. | High temperature and pressure fiber optic feedthrough for borehole usage |
| US4893253A (en) * | 1988-03-10 | 1990-01-09 | Indiana University Foundation | Method for analyzing intact capsules and tablets by near-infrared reflectance spectrometry |
| US4939648A (en) | 1987-12-02 | 1990-07-03 | Schlumberger Technology Corporation | Apparatus and method for monitoring well logging information |
| US4977319A (en) | 1988-06-03 | 1990-12-11 | Texaco Inc. | Method for determining oil content of an underground formation |
| US4990773A (en) | 1988-12-01 | 1991-02-05 | Texaco Inc. | Method for determining the producibility of a hydrocarbon formation |
| US4994747A (en) | 1988-01-14 | 1991-02-19 | Stolar, Inc. | Method and apparatus for detecting underground electrically conductive objects |
| US4994671A (en) * | 1987-12-23 | 1991-02-19 | Schlumberger Technology Corporation | Apparatus and method for analyzing the composition of formation fluids |
| US5035581A (en) | 1989-11-17 | 1991-07-30 | Mcguire Danny G | Fluid level monitoring and control system |
| US5049738A (en) | 1988-11-21 | 1991-09-17 | Conoco Inc. | Laser-enhanced oil correlation system |
| US5065019A (en) | 1990-05-07 | 1991-11-12 | Southwest Research Institute | Method for determining petroleum saturation in a subsurface |
| US5084617A (en) | 1990-05-17 | 1992-01-28 | Conoco Inc. | Fluorescence sensing apparatus for determining presence of native hydrocarbons from drilling mud |
| US5095758A (en) | 1990-11-29 | 1992-03-17 | Texaco Inc. | Water cut monitoring means and method |
| US5104545A (en) | 1989-12-15 | 1992-04-14 | Nalco Chemical Company | Process for removing water soluble organic compounds from produced water |
| US5105085A (en) | 1989-11-17 | 1992-04-14 | Mcguire Danny G | Fluid analysis system |
| US5112127A (en) | 1989-11-28 | 1992-05-12 | Eic Laboratories, Inc. | Apparatus for measuring Raman spectra over optical fibers |
| US5128882A (en) | 1990-08-22 | 1992-07-07 | The United States Of America As Represented By The Secretary Of The Army | Device for measuring reflectance and fluorescence of in-situ soil |
| US5135656A (en) | 1989-12-15 | 1992-08-04 | Nalco Chemical Company | Process for removing water soluble organic compounds from produced water |
| US5145785A (en) | 1990-12-11 | 1992-09-08 | Ashland Oil, Inc. | Determination of aromatics in hydrocarbons by near infrared spectroscopy and calibration therefor |
| US5166747A (en) | 1990-06-01 | 1992-11-24 | Schlumberger Technology Corporation | Apparatus and method for analyzing the composition of formation fluids |
| US5167149A (en) | 1990-08-28 | 1992-12-01 | Schlumberger Technology Corporation | Apparatus and method for detecting the presence of gas in a borehole flow stream |
| US5198871A (en) | 1991-06-18 | 1993-03-30 | Southwest Research Institute | Laser-induced-fluorescence inspection of jet fuels |
| US5201220A (en) | 1990-08-28 | 1993-04-13 | Schlumberger Technology Corp. | Apparatus and method for detecting the presence of gas in a borehole flow stream |
| US5237539A (en) | 1991-12-11 | 1993-08-17 | Selman Thomas H | System and method for processing and displaying well logging data during drilling |
| US5237857A (en) | 1989-07-11 | 1993-08-24 | Solinst Canada Limited | Down-hole liquid detecting apparatus |
| US5253271A (en) | 1991-02-15 | 1993-10-12 | Schlumberger Technology Corporation | Method and apparatus for quadrature amplitude modulation of digital data using a finite state machine |
| US5266800A (en) * | 1992-10-01 | 1993-11-30 | Schlumberger Technology Corporation | Method of distinguishing between crude oils |
| US5272350A (en) | 1992-10-29 | 1993-12-21 | Baker Hughes Incorporated | Rotary coupler effecting power and information exchange |
| US5275038A (en) | 1991-05-20 | 1994-01-04 | Otis Engineering Corporation | Downhole reeled tubing inspection system with fiberoptic cable |
| US5285204A (en) | 1992-07-23 | 1994-02-08 | Conoco Inc. | Coil tubing string and downhole generator |
| US5322126A (en) | 1993-04-16 | 1994-06-21 | The Energex Company | System and method for monitoring fracture growth during hydraulic fracture treatment |
| US5327211A (en) | 1991-11-07 | 1994-07-05 | Carron Keith T | Process for molecular-specific optical fiber probes for raman detection |
| US5331156A (en) | 1992-10-01 | 1994-07-19 | Schlumberger Technology Corporation | Method of analyzing oil and water fractions in a flow stream |
| US5349189A (en) | 1990-04-09 | 1994-09-20 | Ashland Oil, Inc. | Process and apparatus for analysis of hydrocarbons by near-infrared spectroscopy |
| US5351532A (en) | 1992-10-08 | 1994-10-04 | Paradigm Technologies | Methods and apparatus for making chemical concentration measurements in a sub-surface exploration probe |
| US5360975A (en) | 1993-04-23 | 1994-11-01 | Schlumberger Technology Corporation | Method of gain regulation for downhole spectroscopy tools without using a calibration source |
| DE4243418C2 (de) | 1992-12-16 | 1994-12-01 | Preussag Ag | Vorrichtung zum Anregen und Empfangen der Photolumineszenz von Stoffen in Rohrleitungen, insbesondere zur Qualitätskontrolle industrieller Prozesse sowie zur Gewässer- und Abwässerkontrolle |
| US5381002A (en) | 1992-11-27 | 1995-01-10 | Texaco Inc. | Fluorescence method of quantifying hydrocarbons, including crude oil, dispersed in water |
| US5406078A (en) | 1992-05-28 | 1995-04-11 | Halliburton Logging Services, Inc. | Induced gamma ray spectorscopy well logging system |
| US5410152A (en) | 1994-02-09 | 1995-04-25 | Halliburton Energy Services | Low-noise method for performing downhole well logging using gamma ray spectroscopy to measure radioactive tracer penetration |
| US5412581A (en) | 1992-11-05 | 1995-05-02 | Marathon Oil Company | Method for measuring physical properties of hydrocarbons |
| US5413179A (en) | 1993-04-16 | 1995-05-09 | The Energex Company | System and method for monitoring fracture growth during hydraulic fracture treatment |
| US5418614A (en) | 1991-09-19 | 1995-05-23 | Texaco Inc. | Optical photometry system for on-line analysis of fluid systems |
| US5419188A (en) | 1991-05-20 | 1995-05-30 | Otis Engineering Corporation | Reeled tubing support for downhole equipment module |
| US5424959A (en) | 1993-07-19 | 1995-06-13 | Texaco Inc. | Interpretation of fluorescence fingerprints of crude oils and other hydrocarbon mixtures using neural networks |
| US5461236A (en) | 1992-06-09 | 1995-10-24 | Herbert R. Gram | Oil spill detection system |
| US5467823A (en) | 1993-11-17 | 1995-11-21 | Schlumberger Technology Corporation | Methods and apparatus for long term monitoring of reservoirs |
| US5485745A (en) | 1991-05-20 | 1996-01-23 | Halliburton Company | Modular downhole inspection system for coiled tubing |
| US5485743A (en) | 1994-09-23 | 1996-01-23 | Schlumberger Technology Corporation | Microwave device and method for measuring multiphase flows |
| US5495547A (en) | 1995-04-12 | 1996-02-27 | Western Atlas International, Inc. | Combination fiber-optic/electrical conductor well logging cable |
| US5517024A (en) | 1994-05-26 | 1996-05-14 | Schlumberger Technology Corporation | Logging-while-drilling optical apparatus |
| US5519214A (en) | 1992-02-29 | 1996-05-21 | Schlumberger Technology Corporation | Method for analysis of drilling fluids |
| US5543616A (en) | 1995-07-25 | 1996-08-06 | Commonwealth Scientific Industrial Research Organisation | Identifying oil well sites |
| US5591922A (en) | 1994-05-27 | 1997-01-07 | Schlumberger Technology Corporation | Method and apparatus for measuring multiphase flows |
| US5608170A (en) | 1992-02-21 | 1997-03-04 | Schlumberger Technology Corporation | Flow measurement system |
| US5656810A (en) | 1993-11-22 | 1997-08-12 | The Research Foundation Of City College Of New York | Method and apparatus for evaluating the composition of an oil sample |
| US5686724A (en) | 1996-03-05 | 1997-11-11 | Texaco Inc. | Method for determining oil content of an underground formation using wet cuttings |
| US5693152A (en) | 1995-08-14 | 1997-12-02 | University Of Wyoming | Molecular specific detector for separation science using surface enhanced raman spectroscopy |
| US5712481A (en) | 1990-04-09 | 1998-01-27 | Ashland Inc | Process and apparatus for analysis of hydrocarbon species by near infrared spectroscopy |
| US5717209A (en) | 1996-04-29 | 1998-02-10 | Petrometrix Ltd. | System for remote transmission of spectral information through communication optical fibers for real-time on-line hydrocarbons process analysis by near infra red spectroscopy |
| US5729013A (en) | 1996-11-04 | 1998-03-17 | Atlantic Richfield Company | Wellbore infrared detection device and method |
| US5736637A (en) | 1996-05-15 | 1998-04-07 | Western Atlas International, Inc. | Downhole multiphase flow sensor |
| US5742064A (en) | 1996-04-24 | 1998-04-21 | Infante; David A. | System for detecting impurities contained in a flowing petroleum product |
| US5763883A (en) | 1994-10-07 | 1998-06-09 | Bp Chemicals Limited | Chemicals property determination |
| US5780850A (en) | 1996-03-05 | 1998-07-14 | Texaco Inc. | API estimate using multiple fluorescence measurements |
| US5831743A (en) | 1994-08-06 | 1998-11-03 | Schlumberger Technology Corporation | Optical probes |
| US5856869A (en) | 1995-05-01 | 1999-01-05 | Ashland Inc | Distributed bragg reflector diode laser for Raman excitation and method for use |
| US5859430A (en) | 1997-04-10 | 1999-01-12 | Schlumberger Technology Corporation | Method and apparatus for the downhole compositional analysis of formation gases |
| US5939717A (en) | 1998-01-29 | 1999-08-17 | Schlumberger Technology Corporation | Methods and apparatus for determining gas-oil ratio in a geological formation through the use of spectroscopy |
| US6016191A (en) * | 1998-05-07 | 2000-01-18 | Schlumberger Technology Corporation | Apparatus and tool using tracers and singles point optical probes for measuring characteristics of fluid flow in a hydrocarbon well and methods of processing resulting signals |
| US6023340A (en) | 1998-05-07 | 2000-02-08 | Schlumberger Technology Corporation | Single point optical probe for measuring three-phase characteristics of fluid flow in a hydrocarbon well |
| US6085153A (en) * | 1996-11-06 | 2000-07-04 | Henry M. Jackson Foundation | Differential spectral topographic analysis (DISTA) |
| GB2337107B (en) | 1998-05-07 | 2001-02-14 | Schlumberger Ltd | Methods and apparatus utilizing a derivative of a fluorescence signal for measuring the characteristics of a multiphase fluid flow in a hydrocarbon well |
Family Cites Families (4)
| Publication number | Priority date | Publication date | Assignee | Title |
|---|---|---|---|---|
| US4587641A (en) | 1984-02-07 | 1986-05-06 | Shell Oil Company | Downhole fracture analysis |
| JPH09304281A (ja) * | 1996-05-09 | 1997-11-28 | Tokyo Electric Power Co Inc:The | 油検知装置 |
| US6507401B1 (en) * | 1999-12-02 | 2003-01-14 | Aps Technology, Inc. | Apparatus and method for analyzing fluids |
| US6525325B1 (en) * | 2001-03-21 | 2003-02-25 | The United States Of America As Represented By The Secretary Of The Navy | System for quantifying the hydrocarbon content of aqueous media |
-
1999
- 1999-12-02 US US09/453,003 patent/US6507401B1/en not_active Expired - Lifetime
-
2000
- 2000-11-29 CA CA002392924A patent/CA2392924A1/en not_active Abandoned
- 2000-11-29 WO PCT/US2000/032483 patent/WO2001040771A2/en active Application Filing
- 2000-11-29 AU AU19326/01A patent/AU1932601A/en not_active Abandoned
-
2002
- 2002-09-19 US US10/247,192 patent/US6707556B2/en not_active Expired - Lifetime
Patent Citations (117)
| Publication number | Priority date | Publication date | Assignee | Title |
|---|---|---|---|---|
| US2334475A (en) | 1938-12-03 | 1943-11-16 | Schlumberger Well Surv Corp | Method and apparatus for investigating earth formations traversed by boreholes |
| US2423774A (en) | 1942-04-02 | 1947-07-08 | Standard Oil Dev Co | Oil determination |
| US2425531A (en) | 1944-09-30 | 1947-08-12 | Sun Oil Co | Method of detecting leakage in oil wells |
| US3371574A (en) | 1963-07-31 | 1968-03-05 | Robert J. Dwyer | Oil detection device utilizing raman radiation |
| US3806727A (en) | 1973-05-11 | 1974-04-23 | Avco Everett Res Lab Inc | Optical detector system |
| US3917945A (en) | 1973-06-21 | 1975-11-04 | Hayashi Katsuhiki | Method and apparatus for detecting the degree of contamination of waste water |
| US3842270A (en) | 1973-10-29 | 1974-10-15 | Continental Oil Co | Pressurized oil-in-water monitor |
| US3859851A (en) | 1973-12-12 | 1975-01-14 | Schlumberger Technology Corp | Methods and apparatus for testing earth formations |
| US3972648A (en) | 1973-12-26 | 1976-08-03 | Sangster Paul B | Well controller and monitor |
| US3896312A (en) | 1974-06-07 | 1975-07-22 | Christopher W Brown | Petroleum identification |
| US4059356A (en) | 1975-02-24 | 1977-11-22 | Environmental Research & Technology, Inc. | Gas detector |
| US4012712A (en) | 1975-03-31 | 1977-03-15 | Schlumberger Technology Corporation | System for telemetering well logging data |
| US4057721A (en) | 1975-05-08 | 1977-11-08 | Bailey Meter & Controls Limited | Oil pollution monitoring and monitoring unit |
| US4023201A (en) | 1976-04-26 | 1977-05-10 | Infrared Surveys, Incorporated | Infrared thermography for determining equipment temperatures in oil well fires |
| US4227083A (en) | 1979-02-02 | 1980-10-07 | General Electric Company | Apparatus for infrared laser spectroscopy of room temperature vulcanizable silicone compositions |
| US4323777A (en) | 1980-05-19 | 1982-04-06 | Infrared Industries, Inc. | Hydrocarbon gas analyzer |
| US4427944A (en) | 1980-07-07 | 1984-01-24 | Schlumberger Technology Corporation | System for permeability logging by measuring streaming potentials |
| US4371785A (en) | 1980-08-14 | 1983-02-01 | Panametrics, Inc. | Method and apparatus for detection and analysis of fluids |
| US4399359A (en) | 1980-12-08 | 1983-08-16 | Dresser Industries, Inc. | Method for monitoring flood front movement during water flooding of subsurface formations |
| US4394573A (en) | 1980-12-15 | 1983-07-19 | Conoco Inc. | Method and apparatus for underwater detection of hydrocarbons |
| US4434364A (en) | 1980-12-15 | 1984-02-28 | Conoco Inc. | Method and apparatus for underwater detection of hydrocarbons |
| US4370886A (en) | 1981-03-20 | 1983-02-01 | Halliburton Company | In situ measurement of gas content in formation fluid |
| US4375164A (en) | 1981-04-22 | 1983-03-01 | Halliburton Company | Formation tester |
| US4547774A (en) * | 1981-07-20 | 1985-10-15 | Optelcom, Inc. | Optical communication system for drill hole logging |
| US4492862A (en) | 1981-08-07 | 1985-01-08 | Mathematical Sciences Northwest, Inc. | Method and apparatus for analyzing components of hydrocarbon gases recovered from oil, natural gas and coal drilling operations |
| US4396259A (en) | 1981-10-20 | 1983-08-02 | Miller Thomas H | Spectrum glasses |
| US4446370A (en) | 1981-12-28 | 1984-05-01 | Conoco Inc. | Apparatus for detecting oil in water |
| US4587640A (en) | 1982-11-12 | 1986-05-06 | Tokyo Shibaura Denki Kabushiki Kaisha | Cassette type semiconductor memory device |
| US4540283A (en) | 1983-06-20 | 1985-09-10 | Bachalo William D | Apparatus and method for determining the size and velocity of particles, droplets, bubbles or the like using laser light scattering |
| US4598290A (en) | 1983-06-29 | 1986-07-01 | Mobil Oil Corporation | Fiber optic penetrator for offshore oil well exploration and production |
| US4609821A (en) | 1983-07-06 | 1986-09-02 | Nl Industries, Inc. | Testing for the presence of native hydrocarbons down a borehole |
| US4602160A (en) | 1983-09-28 | 1986-07-22 | Sentrol Systems Ltd. | Infrared constituent analyzer and control system |
| US4608859A (en) | 1983-12-28 | 1986-09-02 | Microlytics, Inc. | Process and apparatus for analyzing cutting from oil and gas wells |
| US4620284A (en) | 1983-12-29 | 1986-10-28 | Uop Inc. | Qualitative and quantitative analysis using Raman scattering |
| US4766543A (en) | 1985-04-22 | 1988-08-23 | Western Atlas International, Inc. | Well logging direct memory access system and method |
| US4659218A (en) | 1985-05-23 | 1987-04-21 | Canadian Patents & Development Corporation | Multi-probe system for measuring bubble characteristics gas hold-up, liquid hold-up and solid hold-up in a three-phase fluidized bed |
| US4800279A (en) | 1985-09-13 | 1989-01-24 | Indiana University Foundation | Methods and devices for near-infrared evaluation of physical properties of samples |
| US4800279B1 (US06507401-20030114-M00005.png) | 1985-09-13 | 1991-11-19 | Indiana University Foundation | |
| US4663961A (en) | 1985-09-17 | 1987-05-12 | Westinghouse Electric Corp. | System for remote chemical analysis |
| EP0215648B1 (en) | 1985-09-17 | 1993-04-28 | Rosemount Analytical Inc. | An improved system for remote chemical analysis |
| US4874243A (en) | 1986-09-01 | 1989-10-17 | Benno Perren | Apparatus for continuously measuring the turbidity of a fluid |
| US4770243A (en) | 1986-09-02 | 1988-09-13 | Societe Nationale Elf Aquitaine (Production) | Device for regulating the rate of flow of water which is separated from its mixture with hydrocarbons and reinjected into the bottom of the well |
| US4814614A (en) | 1987-05-11 | 1989-03-21 | Mobil Oil Corporation | Method for characterizing oil-bearing inclusions via fluorescence microspectrophotometry |
| US4939648A (en) | 1987-12-02 | 1990-07-03 | Schlumberger Technology Corporation | Apparatus and method for monitoring well logging information |
| US4825073A (en) | 1987-12-14 | 1989-04-25 | Halliburton Logging Services Inc. | Method for determining depth of penetration of radioactive tracers in formation fractures |
| US4994671A (en) * | 1987-12-23 | 1991-02-19 | Schlumberger Technology Corporation | Apparatus and method for analyzing the composition of formation fluids |
| US4994747A (en) | 1988-01-14 | 1991-02-19 | Stolar, Inc. | Method and apparatus for detecting underground electrically conductive objects |
| US4893253A (en) * | 1988-03-10 | 1990-01-09 | Indiana University Foundation | Method for analyzing intact capsules and tablets by near-infrared reflectance spectrometry |
| US4977319A (en) | 1988-06-03 | 1990-12-11 | Texaco Inc. | Method for determining oil content of an underground formation |
| US4891640A (en) | 1988-11-03 | 1990-01-02 | Halliburton Logging Services, Inc. | High temperature and pressure fiber optic feedthrough for borehole usage |
| US5049738A (en) | 1988-11-21 | 1991-09-17 | Conoco Inc. | Laser-enhanced oil correlation system |
| US4990773A (en) | 1988-12-01 | 1991-02-05 | Texaco Inc. | Method for determining the producibility of a hydrocarbon formation |
| US5237857A (en) | 1989-07-11 | 1993-08-24 | Solinst Canada Limited | Down-hole liquid detecting apparatus |
| US5035581A (en) | 1989-11-17 | 1991-07-30 | Mcguire Danny G | Fluid level monitoring and control system |
| US5105085A (en) | 1989-11-17 | 1992-04-14 | Mcguire Danny G | Fluid analysis system |
| US5112127A (en) | 1989-11-28 | 1992-05-12 | Eic Laboratories, Inc. | Apparatus for measuring Raman spectra over optical fibers |
| US5135656A (en) | 1989-12-15 | 1992-08-04 | Nalco Chemical Company | Process for removing water soluble organic compounds from produced water |
| US5104545A (en) | 1989-12-15 | 1992-04-14 | Nalco Chemical Company | Process for removing water soluble organic compounds from produced water |
| US5349189A (en) | 1990-04-09 | 1994-09-20 | Ashland Oil, Inc. | Process and apparatus for analysis of hydrocarbons by near-infrared spectroscopy |
| US5712481A (en) | 1990-04-09 | 1998-01-27 | Ashland Inc | Process and apparatus for analysis of hydrocarbon species by near infrared spectroscopy |
| US5065019A (en) | 1990-05-07 | 1991-11-12 | Southwest Research Institute | Method for determining petroleum saturation in a subsurface |
| US5084617A (en) | 1990-05-17 | 1992-01-28 | Conoco Inc. | Fluorescence sensing apparatus for determining presence of native hydrocarbons from drilling mud |
| US5166747A (en) | 1990-06-01 | 1992-11-24 | Schlumberger Technology Corporation | Apparatus and method for analyzing the composition of formation fluids |
| US5128882A (en) | 1990-08-22 | 1992-07-07 | The United States Of America As Represented By The Secretary Of The Army | Device for measuring reflectance and fluorescence of in-situ soil |
| US5167149A (en) | 1990-08-28 | 1992-12-01 | Schlumberger Technology Corporation | Apparatus and method for detecting the presence of gas in a borehole flow stream |
| US5201220A (en) | 1990-08-28 | 1993-04-13 | Schlumberger Technology Corp. | Apparatus and method for detecting the presence of gas in a borehole flow stream |
| US5095758A (en) | 1990-11-29 | 1992-03-17 | Texaco Inc. | Water cut monitoring means and method |
| US5145785A (en) | 1990-12-11 | 1992-09-08 | Ashland Oil, Inc. | Determination of aromatics in hydrocarbons by near infrared spectroscopy and calibration therefor |
| US5253271A (en) | 1991-02-15 | 1993-10-12 | Schlumberger Technology Corporation | Method and apparatus for quadrature amplitude modulation of digital data using a finite state machine |
| US5275038A (en) | 1991-05-20 | 1994-01-04 | Otis Engineering Corporation | Downhole reeled tubing inspection system with fiberoptic cable |
| US5419188A (en) | 1991-05-20 | 1995-05-30 | Otis Engineering Corporation | Reeled tubing support for downhole equipment module |
| US5485745A (en) | 1991-05-20 | 1996-01-23 | Halliburton Company | Modular downhole inspection system for coiled tubing |
| US5198871A (en) | 1991-06-18 | 1993-03-30 | Southwest Research Institute | Laser-induced-fluorescence inspection of jet fuels |
| US5418614A (en) | 1991-09-19 | 1995-05-23 | Texaco Inc. | Optical photometry system for on-line analysis of fluid systems |
| US5327211A (en) | 1991-11-07 | 1994-07-05 | Carron Keith T | Process for molecular-specific optical fiber probes for raman detection |
| US5237539A (en) | 1991-12-11 | 1993-08-17 | Selman Thomas H | System and method for processing and displaying well logging data during drilling |
| US5608170A (en) | 1992-02-21 | 1997-03-04 | Schlumberger Technology Corporation | Flow measurement system |
| US5519214A (en) | 1992-02-29 | 1996-05-21 | Schlumberger Technology Corporation | Method for analysis of drilling fluids |
| US5406078A (en) | 1992-05-28 | 1995-04-11 | Halliburton Logging Services, Inc. | Induced gamma ray spectorscopy well logging system |
| US5461236A (en) | 1992-06-09 | 1995-10-24 | Herbert R. Gram | Oil spill detection system |
| US5285204A (en) | 1992-07-23 | 1994-02-08 | Conoco Inc. | Coil tubing string and downhole generator |
| US5331156A (en) | 1992-10-01 | 1994-07-19 | Schlumberger Technology Corporation | Method of analyzing oil and water fractions in a flow stream |
| US5266800A (en) * | 1992-10-01 | 1993-11-30 | Schlumberger Technology Corporation | Method of distinguishing between crude oils |
| US5351532A (en) | 1992-10-08 | 1994-10-04 | Paradigm Technologies | Methods and apparatus for making chemical concentration measurements in a sub-surface exploration probe |
| US5272350A (en) | 1992-10-29 | 1993-12-21 | Baker Hughes Incorporated | Rotary coupler effecting power and information exchange |
| US5412581A (en) | 1992-11-05 | 1995-05-02 | Marathon Oil Company | Method for measuring physical properties of hydrocarbons |
| US5381002A (en) | 1992-11-27 | 1995-01-10 | Texaco Inc. | Fluorescence method of quantifying hydrocarbons, including crude oil, dispersed in water |
| DE4243418C2 (de) | 1992-12-16 | 1994-12-01 | Preussag Ag | Vorrichtung zum Anregen und Empfangen der Photolumineszenz von Stoffen in Rohrleitungen, insbesondere zur Qualitätskontrolle industrieller Prozesse sowie zur Gewässer- und Abwässerkontrolle |
| US5441110A (en) | 1993-04-16 | 1995-08-15 | The Energex Company | System and method for monitoring fracture growth during hydraulic fracture treatment |
| US5413179A (en) | 1993-04-16 | 1995-05-09 | The Energex Company | System and method for monitoring fracture growth during hydraulic fracture treatment |
| US5322126A (en) | 1993-04-16 | 1994-06-21 | The Energex Company | System and method for monitoring fracture growth during hydraulic fracture treatment |
| US5360975A (en) | 1993-04-23 | 1994-11-01 | Schlumberger Technology Corporation | Method of gain regulation for downhole spectroscopy tools without using a calibration source |
| US5424959A (en) | 1993-07-19 | 1995-06-13 | Texaco Inc. | Interpretation of fluorescence fingerprints of crude oils and other hydrocarbon mixtures using neural networks |
| US5467823A (en) | 1993-11-17 | 1995-11-21 | Schlumberger Technology Corporation | Methods and apparatus for long term monitoring of reservoirs |
| US5656810A (en) | 1993-11-22 | 1997-08-12 | The Research Foundation Of City College Of New York | Method and apparatus for evaluating the composition of an oil sample |
| US5410152A (en) | 1994-02-09 | 1995-04-25 | Halliburton Energy Services | Low-noise method for performing downhole well logging using gamma ray spectroscopy to measure radioactive tracer penetration |
| US5517024A (en) | 1994-05-26 | 1996-05-14 | Schlumberger Technology Corporation | Logging-while-drilling optical apparatus |
| US5591922A (en) | 1994-05-27 | 1997-01-07 | Schlumberger Technology Corporation | Method and apparatus for measuring multiphase flows |
| US5831743A (en) | 1994-08-06 | 1998-11-03 | Schlumberger Technology Corporation | Optical probes |
| US5485743A (en) | 1994-09-23 | 1996-01-23 | Schlumberger Technology Corporation | Microwave device and method for measuring multiphase flows |
| US5763883A (en) | 1994-10-07 | 1998-06-09 | Bp Chemicals Limited | Chemicals property determination |
| US5495547A (en) | 1995-04-12 | 1996-02-27 | Western Atlas International, Inc. | Combination fiber-optic/electrical conductor well logging cable |
| US5856869A (en) | 1995-05-01 | 1999-01-05 | Ashland Inc | Distributed bragg reflector diode laser for Raman excitation and method for use |
| US5543616A (en) | 1995-07-25 | 1996-08-06 | Commonwealth Scientific Industrial Research Organisation | Identifying oil well sites |
| US5693152A (en) | 1995-08-14 | 1997-12-02 | University Of Wyoming | Molecular specific detector for separation science using surface enhanced raman spectroscopy |
| US5780850A (en) | 1996-03-05 | 1998-07-14 | Texaco Inc. | API estimate using multiple fluorescence measurements |
| US5686724A (en) | 1996-03-05 | 1997-11-11 | Texaco Inc. | Method for determining oil content of an underground formation using wet cuttings |
| US5742064A (en) | 1996-04-24 | 1998-04-21 | Infante; David A. | System for detecting impurities contained in a flowing petroleum product |
| US5717209A (en) | 1996-04-29 | 1998-02-10 | Petrometrix Ltd. | System for remote transmission of spectral information through communication optical fibers for real-time on-line hydrocarbons process analysis by near infra red spectroscopy |
| US5736637A (en) | 1996-05-15 | 1998-04-07 | Western Atlas International, Inc. | Downhole multiphase flow sensor |
| US5729013A (en) | 1996-11-04 | 1998-03-17 | Atlantic Richfield Company | Wellbore infrared detection device and method |
| US6085153A (en) * | 1996-11-06 | 2000-07-04 | Henry M. Jackson Foundation | Differential spectral topographic analysis (DISTA) |
| US5859430A (en) | 1997-04-10 | 1999-01-12 | Schlumberger Technology Corporation | Method and apparatus for the downhole compositional analysis of formation gases |
| US5939717A (en) | 1998-01-29 | 1999-08-17 | Schlumberger Technology Corporation | Methods and apparatus for determining gas-oil ratio in a geological formation through the use of spectroscopy |
| US6016191A (en) * | 1998-05-07 | 2000-01-18 | Schlumberger Technology Corporation | Apparatus and tool using tracers and singles point optical probes for measuring characteristics of fluid flow in a hydrocarbon well and methods of processing resulting signals |
| US6023340A (en) | 1998-05-07 | 2000-02-08 | Schlumberger Technology Corporation | Single point optical probe for measuring three-phase characteristics of fluid flow in a hydrocarbon well |
| GB2337107B (en) | 1998-05-07 | 2001-02-14 | Schlumberger Ltd | Methods and apparatus utilizing a derivative of a fluorescence signal for measuring the characteristics of a multiphase fluid flow in a hydrocarbon well |
Non-Patent Citations (12)
| Title |
|---|
| Continuous on-line analyzer, Flow Vision, 1991, A1-A11. |
| Downare, T.D., "Visible and near-infrared fluorescence of crude oils," Applied Spectroscopy, 1995, 49, 754-764. |
| Flow vision analyzer, On line and research particle analysis, Flow Vision, 1991, 2 pages. |
| Flow vision on-line infrared analyzers, Flow Vision, 1991, B1-B7. |
| Kilham, L.B., "On-line particulate analysis of polymers and compounds: in-the-melt vs. finished product studies," Polymers, Lamination and Coatings Conference Book 2, 1986, 355-361 (abstract). |
| Mullins, O.C. "Asphaltenes in crude oil: absorbers and/or scatterers in the near-infrared region?," Am. Chem. Soc., 1990, 62, 508-514. |
| Mullins, O.C., "Linearity of near-infrared spectra of alkanes," Applied Spectroscopy, 1999, 6, No. 2000, 624-629. |
| Plastics compounding for resin producers, formulators and compounders, HBJ Plastics Publication, 1987, 10(5), 4 pages. |
| Raman Solution 633, Detection Limit Raman, 1 page. |
| The dawn of a new age in on-line quality control, Flow Vision, 1991, 6 pages. |
| The flow vision analyzer, On-line real time display with counting and size distribution analysis of particles in a moving stream or surface, Flow Vision, 1991, 4 pages. |
| The Raman Solution 852, Detection Limit Raman, 2 pages. |
Cited By (93)
| Publication number | Priority date | Publication date | Assignee | Title |
|---|---|---|---|---|
| US6707556B2 (en) * | 1999-12-02 | 2004-03-16 | Aps Technology, Inc. | Apparatus and method for analyzing fluids |
| US20030056581A1 (en) * | 1999-12-02 | 2003-03-27 | Turner William Edward | Apparatus and method for analyzing fluids |
| US6820013B1 (en) * | 1999-12-23 | 2004-11-16 | Merck Patent Gmbh | Method and device for the online analysis of solvent mixtures |
| USRE44728E1 (en) * | 2000-04-11 | 2014-01-28 | Gas Sensing Technology Corp. | In-situ detection and analysis of methane in coal bed methane formations with spectrometers |
| US20040061858A1 (en) * | 2000-04-11 | 2004-04-01 | John Pope | In-situ detection and analysis of methane in coal bed methane formations with spectrometers |
| US20140138528A1 (en) * | 2000-04-11 | 2014-05-22 | Gas Sensing Technology Corp | In-situ Detection and Analysis of Methane in Coal Bed Methane Formations with Spectrometers |
| US20110036146A1 (en) * | 2000-04-11 | 2011-02-17 | John Pope | In-Situ Detection and Analysis of Methane in Coal Bed Methane Formations with Spectrometers |
| US7821635B2 (en) | 2000-04-11 | 2010-10-26 | John Pope | In-situ detection and analysis of methane in coal bed methane formations with spectrometers |
| US6678050B2 (en) * | 2000-04-11 | 2004-01-13 | Welldog, Inc. | In-situ detection and analysis of methane in coal bed methane formations with spectrometers |
| US6768105B2 (en) * | 2000-10-10 | 2004-07-27 | Schlumberger Technology Corporation | Methods and apparatus for downhole fluids analysis |
| US20050029457A1 (en) * | 2002-01-01 | 2005-02-10 | Long Robert L. | Method and apparatus for on-line measurement of polymer properties |
| US20080042064A1 (en) * | 2002-01-01 | 2008-02-21 | Long Robert L | Method and apparatus on-line measurement of polymer properties |
| US7307257B2 (en) * | 2002-01-01 | 2007-12-11 | Exxonmobil Chemical Patents Inc. | Method and apparatus for on-line measurement of polymer properties |
| US6970248B1 (en) * | 2002-05-17 | 2005-11-29 | Reflectronics, Incorporated | Method for the detection of product transitions in liquid piping systems |
| US9423393B2 (en) | 2002-06-28 | 2016-08-23 | International Technidyne Corporation | Analytical test cartridge; and, methods |
| US20040017569A1 (en) * | 2002-07-23 | 2004-01-29 | Payne Fred A. | System and method for sensing a characteristic of a fluid and related apparatus |
| US7092084B2 (en) * | 2002-07-23 | 2006-08-15 | University Of Kentucky Research Foundation | System and method for sensing a characteristic of a fluid and related apparatus |
| WO2004015064A3 (en) * | 2002-07-31 | 2004-04-29 | Diametrics Medical Inc | Apparatus and method for analytical determinations |
| US6794877B2 (en) * | 2002-07-31 | 2004-09-21 | International Technidyne Corporation | Apparatus and method for analytical determinations |
| US20040021469A1 (en) * | 2002-07-31 | 2004-02-05 | Diametrics Medical, Inc. | Apparatus and method for analytical determinations |
| US20040084623A1 (en) * | 2002-11-06 | 2004-05-06 | Yicheng Long | NIR spectroscopy method for analyzing chemical process components |
| US7067811B2 (en) * | 2002-11-06 | 2006-06-27 | Her Majesty The Queen In Right Of Canada, As Represented By The Minister Of Natural Resources Canada | NIR spectroscopy method for analyzing chemical process components |
| FR2853416A1 (fr) * | 2003-04-04 | 2004-10-08 | Inst Francais Du Petrole | Methode pour determiner la composition d'un fluide homogene ou heterogene |
| US20040229376A1 (en) * | 2003-04-04 | 2004-11-18 | Claude Beauducel | Method for determining the composition of a liquid |
| US7140238B2 (en) | 2003-04-04 | 2006-11-28 | Institut Francais Du Petrole | Method for determining the composition of a fluid |
| US7669469B2 (en) * | 2003-05-02 | 2010-03-02 | Baker Hughes Incorporated | Method and apparatus for a continuous data recorder for a downhole sample tank |
| US20040216521A1 (en) * | 2003-05-02 | 2004-11-04 | Baker Hughes Incorporated | Method and apparatus for a continuous data recorder for a downhole sample tank |
| US20080172141A1 (en) * | 2004-07-08 | 2008-07-17 | Simpson Michael B | Chemical Mixing Apparatus, System And Method |
| US20060080041A1 (en) * | 2004-07-08 | 2006-04-13 | Anderson Gary R | Chemical mixing apparatus, system and method |
| US7281840B2 (en) | 2004-07-09 | 2007-10-16 | Tres-Ark, Inc. | Chemical mixing apparatus |
| US20060009875A1 (en) * | 2004-07-09 | 2006-01-12 | Simpson Michael B | Chemical mixing apparatus, system and method |
| US7249968B1 (en) | 2004-08-16 | 2007-07-31 | Aps Technology, Inc. | Electrical connections for harsh conditions |
| US8947666B2 (en) | 2004-12-09 | 2015-02-03 | Halliburton Energy Services, Inc. | Optical data transformation |
| US20100245096A1 (en) * | 2004-12-09 | 2010-09-30 | Halliburton Energy Services, Inc. | Optical data transformation |
| US8525995B2 (en) * | 2004-12-09 | 2013-09-03 | Halliburton Energy Services, Inc. | Optical data transformation |
| US20140246574A1 (en) * | 2005-03-14 | 2014-09-04 | Gas Sensing Technology Corp | In-situ Detection and Analysis of Methane in Coal Bed Methane Formations with Spectrometers |
| US20070043472A1 (en) * | 2005-07-08 | 2007-02-22 | Anderson Gary R | Batch mixing method with first derivative homogeneity monitoring |
| US7363115B2 (en) | 2005-07-08 | 2008-04-22 | Tres-Ark, Inc. | Batch mixing method with first derivative homogeneity monitoring |
| US7363114B2 (en) | 2005-07-08 | 2008-04-22 | Tres-Ark, Inc. | Batch mixing method with standard deviation homogeneity monitoring |
| US20070106425A1 (en) * | 2005-07-08 | 2007-05-10 | Anderson Gary R | Point-of-use mixing method with first derivative homogeneity monitoring |
| US20070043471A1 (en) * | 2005-07-08 | 2007-02-22 | Anderson Gary R | Batch mixing method with standard deviation homogeneity monitoring |
| US20070043473A1 (en) * | 2005-07-08 | 2007-02-22 | Anderson Gary R | Point-of-use mixing method with standard deviation homogeneity monitoring |
| US20100228688A1 (en) * | 2005-10-06 | 2010-09-09 | Paul Little | Optical determination and reporting of gas properties |
| US9212989B2 (en) * | 2005-10-06 | 2015-12-15 | Jp3 Measurement, Llc | Optical determination and reporting of gas properties |
| US8849572B2 (en) * | 2007-06-08 | 2014-09-30 | Sondex Wireline Limited | Apparatus for determining the concentration of a conductive fluid present in a fluid filled borehole |
| US20100299068A1 (en) * | 2007-06-08 | 2010-11-25 | Guy Harvey Mason | Apparatus for determining the concentration of a conductive fluid present in a fluid filled borehole |
| US20090087912A1 (en) * | 2007-09-28 | 2009-04-02 | Shlumberger Technology Corporation | Tagged particles for downhole application |
| US20090087911A1 (en) * | 2007-09-28 | 2009-04-02 | Schlumberger Technology Corporation | Coded optical emission particles for subsurface use |
| US20090153845A1 (en) * | 2007-12-14 | 2009-06-18 | Baker Hughes Incorporated | Fiber optic refractometer |
| US7852468B2 (en) * | 2007-12-14 | 2010-12-14 | Baker Hughes Incorporated | Fiber optic refractometer |
| US7969571B2 (en) | 2009-01-15 | 2011-06-28 | Baker Hughes Incorporated | Evanescent wave downhole fiber optic spectrometer |
| US20100177310A1 (en) * | 2009-01-15 | 2010-07-15 | Baker Hughes Incorporated | Evanescent wave downhole fiber optic spectrometer |
| US8236168B2 (en) | 2009-10-13 | 2012-08-07 | Exxonmobil Research And Engineering Company | Onset haze measurement apparatus and procedure |
| US20110083994A1 (en) * | 2009-10-13 | 2011-04-14 | Sirota Eric B | Onset haze measurement apparatus and procedure |
| US9091151B2 (en) | 2009-11-19 | 2015-07-28 | Halliburton Energy Services, Inc. | Downhole optical radiometry tool |
| US8481930B2 (en) | 2010-06-15 | 2013-07-09 | Saudi Arabian Oil Company | Apparatus and method for replicating liquid blends and identifying the ratios of their liquid ingredients |
| US8445841B2 (en) | 2011-01-04 | 2013-05-21 | Exxonmobil Research And Engineering Company | Method and apparatus for a mid-infrared (MIR) system for real time detection of petroleum in colloidal suspensions of sediments and drilling muds during drilling operations, logging and production operations |
| US8615364B1 (en) * | 2011-02-17 | 2013-12-24 | Selman and Associates, Ltd. | Computer readable medium for acquiring and displaying in near real time gas analysis, well data collection, and other well logging data |
| US20130066605A1 (en) * | 2011-04-26 | 2013-03-14 | Baker Hughes Incorporated | Apparatus and method for estimating formation lithology using x-ray flourescence |
| US9708907B2 (en) * | 2011-04-26 | 2017-07-18 | Baker Hughes Incorporated | Apparatus and method for estimating formation lithology using X-ray flourescence |
| US8618226B2 (en) | 2011-05-19 | 2013-12-31 | Bridgestone Corporation | Method for quantitative analysis of styrene microblock content |
| US20140339412A1 (en) * | 2011-12-14 | 2014-11-20 | Schlumberger Technology Corporation | Solid State Lasers |
| US10012758B2 (en) * | 2011-12-14 | 2018-07-03 | Schlumberger Technology Corporation | Solid state lasers |
| US9588096B2 (en) * | 2012-02-03 | 2017-03-07 | Pietro Fiorentini Spa | Measuring unit for determining the composition of the liquid phase in a multi-phase mixture |
| US20150000383A1 (en) * | 2012-02-03 | 2015-01-01 | Pietro Fiorentini Spa | Measuring unit for determining the composition of the liquid phase in a multi-phase mixture |
| US9182360B2 (en) | 2013-07-22 | 2015-11-10 | Honeywell Asca Inc. | Multi-frequency microwave sensor for temperature independent measurement of moisture |
| US9581493B2 (en) * | 2014-02-12 | 2017-02-28 | Bruker Optics, Inc. | Acquiring a Raman spectrum with multiple lasers |
| US10435954B1 (en) | 2014-05-02 | 2019-10-08 | Russell D. Ide | Flexible coupling |
| US9863191B1 (en) | 2014-05-02 | 2018-01-09 | Russell D. Ide | Flexible coupling |
| US10753159B1 (en) | 2014-05-02 | 2020-08-25 | Russell D. Ide | Flexible coupling |
| US9678002B2 (en) * | 2014-10-29 | 2017-06-13 | Chevron U.S.A. Inc. | Method and system for NIR spectroscopy of mixtures to evaluate composition of components of the mixtures |
| US20160123872A1 (en) * | 2014-10-29 | 2016-05-05 | Chevron U.S.A. Inc. | Method and system for nir spectroscopy of mixtures to evaluate composition of components of the mixtures |
| US10928375B2 (en) * | 2015-01-05 | 2021-02-23 | Saudi Arabian Oil Company | Characterization of crude oil and its fractions by fluorescence spectroscopy analysis |
| US20160195508A1 (en) * | 2015-01-05 | 2016-07-07 | Saudi Arabian Oil Company | Characterization of crude oil and its fractions by fluorescence spectroscopy analysis |
| US20200072812A1 (en) * | 2015-01-05 | 2020-03-05 | Saudi Arabian Oil Company | Characterization of crude oil and its fractions by fluorescence spectroscopy analysis |
| US10605702B2 (en) | 2015-04-27 | 2020-03-31 | Virtual Fluid Monitoring Services LLC | Fluid analysis and monitoring using optical spectroscopy |
| US10809164B2 (en) | 2015-04-27 | 2020-10-20 | Virtual Fluid Monitoring Services, Llc | Fluid analysis and monitoring using optical spectroscopy |
| US10557776B2 (en) | 2015-04-27 | 2020-02-11 | Virtual Fluid Monitoring Services, Llc | Fluid analysis and monitoring using optical spectrometry |
| US10578548B2 (en) | 2015-04-27 | 2020-03-03 | Virtual Fluid Monitoring Services LLC | Systems, apparatuses, and methods for fluid analysis and monitoring |
| US10591388B2 (en) | 2015-04-27 | 2020-03-17 | Virtual Fluid Monitoring Services LLC | Fluid analysis and monitoring using optical spectroscopy |
| US10151687B2 (en) | 2015-04-27 | 2018-12-11 | Virtual Fluid Monitoring Services, Llc | Systems, apparatuses, and methods for fluid analysis and monitoring |
| US10088422B2 (en) | 2015-12-28 | 2018-10-02 | Schlumberger Technology Corporation | Raman spectroscopy for determination of composition of natural gas |
| US10025000B2 (en) | 2016-01-21 | 2018-07-17 | Baker Hughes Incorporated | Optical sensors for downhole tools and related systems and methods |
| US10882741B2 (en) | 2016-04-05 | 2021-01-05 | Baker Hughes, A Ge Company, Llc | Apparatus and downhole tools for measuring hydrogen sulfide in downhole fluids |
| US10120097B2 (en) | 2016-04-05 | 2018-11-06 | Baker Hughes Incorporated | Methods and apparatus for measuring hydrogen sulfide in downhole fluids |
| US10060899B2 (en) * | 2016-04-26 | 2018-08-28 | Saudi Arabian Oil Company | Characterizing lubricant oil degradation using fluorescence signals |
| US10317388B2 (en) * | 2016-04-26 | 2019-06-11 | Saudi Arabian Oil Company | Characterizing lubricant oil degradation using fluorescence signals |
| US20170307584A1 (en) * | 2016-04-26 | 2017-10-26 | Saudi Arabian Oil Company | Characterizing lubricant oil degradation using fluorescence signals |
| WO2019088953A3 (en) * | 2017-08-03 | 2019-06-20 | Bahcesehir Universitesi | An underwater analysis device for analyzing absorption capacity of water |
| US11181473B2 (en) * | 2017-08-03 | 2021-11-23 | Bahcesehir Universitesi | Underwater analysis device for analyzing absorption capacity of water |
| US11442019B2 (en) | 2018-06-19 | 2022-09-13 | Virtual Fluid Monitoring Services, Llc | Fluid analysis and monitoring using optical spectroscopy |
| US20220026360A1 (en) * | 2020-07-22 | 2022-01-27 | Agar Corporation, Inc. | Fluorescence and scatter and absorption spectroscopic apparatus with a sapphire tube and method for analyzing inline low level hydrocarbon in a flow medium |
| US11885743B2 (en) * | 2020-07-22 | 2024-01-30 | Agar Corporation, Inc. | Fluorescence and scatter and absorption spectroscopic apparatus with a sapphire tube and method for analyzing inline low level hydrocarbon in a flow medium |
Also Published As
| Publication number | Publication date |
|---|---|
| WO2001040771A3 (en) | 2002-02-14 |
| US20030056581A1 (en) | 2003-03-27 |
| CA2392924A1 (en) | 2001-06-07 |
| AU1932601A (en) | 2001-06-12 |
| WO2001040771A2 (en) | 2001-06-07 |
| US6707556B2 (en) | 2004-03-16 |
| WO2001040771A9 (en) | 2002-05-23 |
Similar Documents
| Publication | Publication Date | Title |
|---|---|---|
| US6507401B1 (en) | Apparatus and method for analyzing fluids | |
| US6476384B1 (en) | Methods and apparatus for downhole fluids analysis | |
| US8285491B2 (en) | Devices and methods for quantification of liquids in gas-condensate wells | |
| US8817264B2 (en) | Method and apparatus for analyzing multiphase fluid flow using a multivariate optical element calculation device | |
| US10422754B2 (en) | Online measurement of black powder in gas and oil pipelines | |
| EP2232236B1 (en) | Monitoring lubricant oil condition and/or quality, on-line or at-line, based on chemometric data analysis of flourescence and/or near infrared spectra | |
| US9074990B2 (en) | Methods and devices for optically determining a characteristic of a substance | |
| CN102822447B (zh) | 探测井下环境中二氧化碳和硫化氢的方法和井下工具装置 | |
| US20080111064A1 (en) | Downhole measurement of substances in earth formations | |
| RU2361192C2 (ru) | Способ и устройство для определения показателя преломления флюида в скважине | |
| US7248357B2 (en) | Method and apparatus for optically measuring the heating value of a multi-component fuel gas using nir absorption spectroscopy | |
| AU2001284361A1 (en) | Methods and apparatus for downhole fluids analysis | |
| RU2356030C2 (ru) | Обработка сигнала, полученного в результате оптического анализа текучей среды | |
| US20160258877A1 (en) | Online Measurement Of Black Powder In Gas And Oil Pipelines | |
| US9624769B2 (en) | Determination of fluid compositions | |
| US20100059669A1 (en) | Method and apparatus for detecting naphthenic acids | |
| Bobe et al. | Design of multichannel NIR spectrophotometers for in-line process analysis of oil products | |
| Turner | Downhole Fluid Analyzer Development |
Legal Events
| Date | Code | Title | Description |
|---|---|---|---|
| AS | Assignment |
Owner name: OLD DOMINION UNIVERSITY RESEARCH FOUNDATION, VIRGI Free format text: ASSIGNMENT OF ASSIGNORS INTEREST;ASSIGNOR:OLD DOMINION UNIVERSITY;REEL/FRAME:010689/0556 Effective date: 19991201 |
|
| AS | Assignment |
Owner name: APS TECHNOLOGY, INC., CONNECTICUT Free format text: ASSIGNMENT OF ASSIGNORS INTEREST;ASSIGNORS:TURNER, WILLIAM EDWARD;BIGLIN, DENIS P., JR.;REEL/FRAME:010687/0070 Effective date: 20000210 Owner name: OLD DOMINION UNIVERSITY, VIRGINIA Free format text: ASSIGNMENT OF ASSIGNORS INTEREST;ASSIGNORS:COOPER, JOHN B.;AUST, JEFFREY FRANCIS;REEL/FRAME:010689/0541 Effective date: 19991201 |
|
| AS | Assignment |
Owner name: OLD DOMINION UNIVERSITY RESEARCH FOUNDATION, VIRGI Free format text: CORRECTIVE ASSIGNMENT TO INSERT THE APPLICATION NUMBER AND FILING DATE OF APPLICATION ON PAGE 2 OF ASSIGNMENT. PREVIOUSLY RECORDED AT REEL 010689 FRAME 0556;ASSIGNOR:OLD DOMINION UNIVERSITY;REEL/FRAME:011318/0235 Effective date: 19991201 Owner name: OLD DOMINION UNIVERSITY, VIRGINIA Free format text: ASSIGNMENT OF ASSIGNORS INTEREST;ASSIGNORS:COOPER, JOHN B.;AUST, JEFFREY FRANCIS;REEL/FRAME:011319/0477 Effective date: 19991201 |
|
| STCF | Information on status: patent grant |
Free format text: PATENTED CASE |
|
| CC | Certificate of correction | ||
| FPAY | Fee payment |
Year of fee payment: 4 |
|
| AS | Assignment |
Owner name: TD BANKNORTH, N.A., MASSACHUSETTS Free format text: SECURITY AGREEMENT;ASSIGNOR:APS TECHNOLOGY, INC.;REEL/FRAME:018160/0825 Effective date: 20060824 |
|
| FEPP | Fee payment procedure |
Free format text: PAYOR NUMBER ASSIGNED (ORIGINAL EVENT CODE: ASPN); ENTITY STATUS OF PATENT OWNER: SMALL ENTITY |
|
| CC | Certificate of correction | ||
| FPAY | Fee payment |
Year of fee payment: 8 |
|
| AS | Assignment |
Owner name: ENHANCED CAPITAL CONNECTICUT FUND I, LLC, CONNECTI Free format text: SECURITY AGREEMENT;ASSIGNOR:APS TECHNOLOGY, INC.;REEL/FRAME:028080/0080 Effective date: 20120419 Owner name: ENHANCED CAPITAL CONNECTICUT FUND II, LLC, CONNECT Free format text: SECURITY AGREEMENT;ASSIGNOR:APS TECHNOLOGY, INC.;REEL/FRAME:028080/0080 Effective date: 20120419 Owner name: ENHANCED CAPITAL CONNECTICUT FUND III, LLC, CONNEC Free format text: SECURITY AGREEMENT;ASSIGNOR:APS TECHNOLOGY, INC.;REEL/FRAME:028080/0080 Effective date: 20120419 |
|
| AS | Assignment |
Owner name: RBS CITIZENS, NATIONAL ASSOCIATION, CONNECTICUT Free format text: SECURITY INTEREST;ASSIGNOR:APS TECHNOLOGY, INC.;REEL/FRAME:033101/0795 Effective date: 20140602 |
|
| FPAY | Fee payment |
Year of fee payment: 12 |
|
| AS | Assignment |
Owner name: ENHANCED CAPITAL CONNECTICUT FUND I, LLC, ENHANCED Free format text: RELEASE BY SECURED PARTY;ASSIGNOR:APS TECHNOLOGY, INC.;REEL/FRAME:038077/0218 Effective date: 20160222 |
|
| AS | Assignment |
Owner name: TD BANKNORTH NA, MASSACHUSETTS Free format text: RELEASE BY SECURED PARTY;ASSIGNOR:TD BANKNORTH NA;REEL/FRAME:038088/0615 Effective date: 20160315 |
|
| AS | Assignment |
Owner name: APS TECHNOLOGY, INC., CONNECTICUT Free format text: RELEASE BY SECURED PARTY;ASSIGNOR:CITIZENS BANK, N.A., AS AGENT, FORMERLY KNOWN AS RBS CITIZENS, NATIONAL ASSOCIATION;REEL/FRAME:043782/0731 Effective date: 20171002 |
|
| AS | Assignment |
Owner name: BALANCE POINT CAPITAL PARTNERS III, LP, CONNECTICUT Free format text: SECURITY INTEREST;ASSIGNORS:APS TECHNOLOGY, INC.;APS INDUSTRIES, INC.;APST INTERNATIONAL, INC.;REEL/FRAME:044169/0053 Effective date: 20171002 Owner name: BALANCE POINT CAPITAL PARTNERS III, LP, CONNECTICU Free format text: SECURITY INTEREST;ASSIGNORS:APS TECHNOLOGY, INC.;APS INDUSTRIES, INC.;APST INTERNATIONAL, INC.;REEL/FRAME:044169/0053 Effective date: 20171002 |
|
| AS | Assignment |
Owner name: APS TECHNOLOGY, CONNECTICUT Free format text: CORRECTIVE ASSIGNMENT TO CORRECT THE CONVEYING PARTY NAME PREVIOUSLY RECORDED ON REEL 038077 FRAME 0218. ASSIGNOR(S) HEREBY CONFIRMS THE TERMINATES SECURITY AGREEMENT;ASSIGNOR:ENHANCED CAPITAL CONNECTICUT FUND I, LLC, ENHANCED CAPITAL CONNECTICUT FUND II, ENHANCED CAPITAL CONNECTICUT FUND III, LLC;REEL/FRAME:044935/0603 Effective date: 20160222 Owner name: APS TECHNOLOGY, CONNECTICUT Free format text: CORRECTIVE ASSIGNMENT TO CORRECT THE RECEIVING PARTY NAME PREVIOUSLY RECORDED ON REEL 038088 FRAME 0615. ASSIGNOR(S) HEREBY CONFIRMS THE TRADEMARK SECURITY AGREEMENT;ASSIGNOR:TD BANKNORTH NA;REEL/FRAME:044935/0125 Effective date: 20160315 |
|
| AS | Assignment |
Owner name: KEYBANK NATIONAL ASSOCIATION, CONNECTICUT Free format text: SECURITY INTEREST;ASSIGNORS:APS TECHNOLOGY, INC.;APS INDUSTRIES, INC.;APST INTERNATIONAL, INC.;REEL/FRAME:048375/0848 Effective date: 20190206 Owner name: BALANCE POINT CAPITAL PARTNERS III, LP, CONNECTICU Free format text: AMENDED AND RESTATED INTELLECTUAL PROPERTY SECURITY AGREEMENT;ASSIGNORS:APS TECHNOLOGY, INC.;APS INDUSTRIES, INC.;APST INTERNATIONAL, INC.;REEL/FRAME:049856/0434 Effective date: 20190206 Owner name: BALANCE POINT CAPITAL PARTNERS III, LP, CONNECTICUT Free format text: AMENDED AND RESTATED INTELLECTUAL PROPERTY SECURITY AGREEMENT;ASSIGNORS:APS TECHNOLOGY, INC.;APS INDUSTRIES, INC.;APST INTERNATIONAL, INC.;REEL/FRAME:049856/0434 Effective date: 20190206 |
|
| AS | Assignment |
Owner name: BALANCE POINT CAPITAL PARTNERS III, LP, AS AGENT, CONNECTICUT Free format text: SECURITY INTEREST;ASSIGNOR:APS TECHNOLOGY LLC;REEL/FRAME:066341/0846 Effective date: 20231231 |
|
| AS | Assignment |
Owner name: APST INTERNATIONAL INC, CONNECTICUT Free format text: RELEASE BY SECURED PARTY;ASSIGNOR:KEYBANK NATIONAL ASSOCIATION;REEL/FRAME:066405/0762 Effective date: 20240201 Owner name: APS INDUSTRIES INC, TEXAS Free format text: RELEASE BY SECURED PARTY;ASSIGNOR:KEYBANK NATIONAL ASSOCIATION;REEL/FRAME:066405/0762 Effective date: 20240201 Owner name: APS TECHNOLOGY INC, CONNECTICUT Free format text: RELEASE BY SECURED PARTY;ASSIGNOR:KEYBANK NATIONAL ASSOCIATION;REEL/FRAME:066405/0762 Effective date: 20240201 |