RU2524473C2 - Graphic representation support based on user settings - Google Patents
Graphic representation support based on user settings Download PDFInfo
- Publication number
- RU2524473C2 RU2524473C2 RU2010100807/08A RU2010100807A RU2524473C2 RU 2524473 C2 RU2524473 C2 RU 2524473C2 RU 2010100807/08 A RU2010100807/08 A RU 2010100807/08A RU 2010100807 A RU2010100807 A RU 2010100807A RU 2524473 C2 RU2524473 C2 RU 2524473C2
- Authority
- RU
- Russia
- Prior art keywords
- graphical
- graphic
- content
- definition
- graphics
- Prior art date
Links
Images


Classifications
-
- G—PHYSICS
- G06—COMPUTING; CALCULATING OR COUNTING
- G06F—ELECTRIC DIGITAL DATA PROCESSING
- G06F3/00—Input arrangements for transferring data to be processed into a form capable of being handled by the computer; Output arrangements for transferring data from processing unit to output unit, e.g. interface arrangements
- G06F3/14—Digital output to display device ; Cooperation and interconnection of the display device with other functional units
-
- G—PHYSICS
- G06—COMPUTING; CALCULATING OR COUNTING
- G06T—IMAGE DATA PROCESSING OR GENERATION, IN GENERAL
- G06T11/00—2D [Two Dimensional] image generation
- G06T11/60—Editing figures and text; Combining figures or text
-
- G—PHYSICS
- G06—COMPUTING; CALCULATING OR COUNTING
- G06F—ELECTRIC DIGITAL DATA PROCESSING
- G06F3/00—Input arrangements for transferring data to be processed into a form capable of being handled by the computer; Output arrangements for transferring data from processing unit to output unit, e.g. interface arrangements
- G06F3/01—Input arrangements or combined input and output arrangements for interaction between user and computer
- G06F3/048—Interaction techniques based on graphical user interfaces [GUI]
- G06F3/0481—Interaction techniques based on graphical user interfaces [GUI] based on specific properties of the displayed interaction object or a metaphor-based environment, e.g. interaction with desktop elements like windows or icons, or assisted by a cursor's changing behaviour or appearance
- G06F3/0482—Interaction with lists of selectable items, e.g. menus
-
- G—PHYSICS
- G06—COMPUTING; CALCULATING OR COUNTING
- G06F—ELECTRIC DIGITAL DATA PROCESSING
- G06F3/00—Input arrangements for transferring data to be processed into a form capable of being handled by the computer; Output arrangements for transferring data from processing unit to output unit, e.g. interface arrangements
- G06F3/01—Input arrangements or combined input and output arrangements for interaction between user and computer
- G06F3/048—Interaction techniques based on graphical user interfaces [GUI]
- G06F3/0484—Interaction techniques based on graphical user interfaces [GUI] for the control of specific functions or operations, e.g. selecting or manipulating an object, an image or a displayed text element, setting a parameter value or selecting a range
- G06F3/04845—Interaction techniques based on graphical user interfaces [GUI] for the control of specific functions or operations, e.g. selecting or manipulating an object, an image or a displayed text element, setting a parameter value or selecting a range for image manipulation, e.g. dragging, rotation, expansion or change of colour
-
- G—PHYSICS
- G06—COMPUTING; CALCULATING OR COUNTING
- G06F—ELECTRIC DIGITAL DATA PROCESSING
- G06F40/00—Handling natural language data
- G06F40/30—Semantic analysis
-
- G—PHYSICS
- G06—COMPUTING; CALCULATING OR COUNTING
- G06T—IMAGE DATA PROCESSING OR GENERATION, IN GENERAL
- G06T11/00—2D [Two Dimensional] image generation
- G06T11/20—Drawing from basic elements, e.g. lines or circles
- G06T11/206—Drawing of charts or graphs
-
- G—PHYSICS
- G06—COMPUTING; CALCULATING OR COUNTING
- G06T—IMAGE DATA PROCESSING OR GENERATION, IN GENERAL
- G06T2200/00—Indexing scheme for image data processing or generation, in general
- G06T2200/24—Indexing scheme for image data processing or generation, in general involving graphical user interfaces [GUIs]
-
- G—PHYSICS
- G06—COMPUTING; CALCULATING OR COUNTING
- G06T—IMAGE DATA PROCESSING OR GENERATION, IN GENERAL
- G06T3/00—Geometric image transformation in the plane of the image
- G06T3/20—Linear translation of a whole image or part thereof, e.g. panning
-
- G—PHYSICS
- G06—COMPUTING; CALCULATING OR COUNTING
- G06T—IMAGE DATA PROCESSING OR GENERATION, IN GENERAL
- G06T3/00—Geometric image transformation in the plane of the image
- G06T3/40—Scaling the whole image or part thereof
Abstract
Description
Родственные заявкиRelated Applications
Это приложение является заявкой в продолжение заявки "Editing The Text Of An Arbitrary Graphic Via A Hierarchical List", поданной 30 сентября 2004 и которой присвоен Serial № 10/957,103, полное раскрытие которого полностью включено сюда по ссылке.This application is a continuation of the application "Editing The Text Of An Arbitrary Graphic Via A Hierarchical List", filed September 30, 2004 and assigned Serial No. 10 / 957.103, the full disclosure of which is fully incorporated here by reference.
Область техники, к которой относится изобретениеFIELD OF THE INVENTION
Данное изобретение относится, в общем случае, к созданию и редактированию визуальных представлений, и, более подробно, к отображению графики, основываясь на пользовательских настройках.This invention relates, in General, to the creation and editing of visual representations, and, in more detail, to display graphics based on user settings.
Уровень техникиState of the art
Визуальные средства помогают людям понимать информацию. Передача информации к или между группами людей почти обязательно требует создания визуальных представлений, воплощающих информацию. Прикладные программы для работы с графикой, такие как приложение для представления Microsoft® PowerPoint®, помогли автоматизировать задачу создания таких визуальных представлений. Такие прикладные программы для работы с графикой позволяют пользователям передавать информацию более рационально и эффективно, помещая эту информацию в легко понятном формате, упомянутом здесь, как графика.Visual aids help people understand the information. Transferring information to or between groups of people almost certainly requires the creation of visual representations that embody the information. Graphics applications such as the Microsoft ® PowerPoint ® presentation application have helped automate the task of creating such visual presentations. Such graphics applications allow users to transfer information more efficiently and effectively, placing this information in the easily understood format referred to here as graphics.
Графика является визуальным представлением, таким как диаграмма или другой рисунок, идеи. Графика обычно составляется из нескольких графических элементов, которые представляют собой содержание, воплощающее идею, например, маркированный список. Каждый графический элемент является частью отображаемой графики. Графический элемент может иметь и текстовые, и графические характеристики. Примем во внимание, что графические характеристики в общем случае относятся к изобразительным или другим визуальным особенностям графического элемента, а текстовые характеристики в общем случае относятся к письменной сущности в графическом элементе. В зависимости от информации и аудитории, пользователь прикладной программы для работы с графикой определяет, в общем случае, определенную графику, которая лучше всего преподаст или передаст основную информацию. Вообще, обычные прикладные программы для работы с графикой обеспечивают один из двух подходов к созданию графики.A graphic is a visual representation, such as a diagram or other drawing, of an idea. Graphics are usually composed of several graphic elements, which are content embodying the idea, for example, a bulleted list. Each graphic element is part of the displayed graphic. A graphic element can have both textual and graphic characteristics. Let us take into account that graphic characteristics in the general case relate to graphic or other visual features of the graphic element, and textual characteristics in the general case relate to the written essence in the graphic element. Depending on the information and the audience, the user of the graphics application determines, in the general case, a specific graphic that will best teach or transmit the basic information. In general, conventional graphics applications provide one of two approaches to creating graphics.
С одной стороны, некоторые обычные прикладные программы для работы с графикой используют подход ручного рисования, в котором пользователи имеют полную гибкость в создании и редактировании графики. Также пользователь может установить и настроить просмотр графических элементов в графике, поскольку он или она считают именно так. Обеспечивая такое "свободное господство" для редактирования графики этот ручной подход, однако приводит к пользователю, у которого возникает необходимость снова позиционировать и перестраивать те графические элементы в графике, которые затрагиваются настройкой и/или изменением положения других графических элементов в графике. Как можно предположить, этот подход требует, в общем случае, большого количества времени для управления графикой для визуализации конечного продукта. Время пользователя тратится неэффективно при манипулировании визуальными аспектами графики вместо того, чтобы сосредоточиться на информации, которая должна отобразиться в графике. Кроме того, этот подход требует, по крайней мере, до некоторой степени, способностей к графическому дизайну. Те пользователи, которые не имеют сильных навыков в дизайне, являются даже более ограниченными ручным подходом.On the one hand, some common graphics applications use the hand-drawing approach, in which users have full flexibility in creating and editing graphics. Also, the user can set and customize the viewing of graphic elements in the graph, since he or she thinks so. Providing such a "free domination" for editing graphics, this manual approach, however, leads to a user who needs to again position and rebuild those graphic elements in the graphic that are affected by setting and / or changing the position of other graphic elements in the graphic. As you can assume, this approach requires, in the General case, a lot of time to manage the graphics to visualize the final product. User time is wasted ineffectively when manipulating the visual aspects of a graphic, rather than focusing on the information that should be displayed on the graphic. In addition, this approach requires, at least to some extent, graphic design abilities. Those users who do not have strong design skills are even more limited by the manual approach.
С другой стороны, некоторые обычные прикладные программы для работы с графикой используют подход к автоматическому рисованию, при котором размещение и вид каждого графического символа автоматически определяется, основываясь на типе графики, желательной для пользователя и графическими элементами, предопределенными для графики. При этом подходе бремя выравнивания и позиционирования графических элементов в графике убрано от пользователя и помещено во внутрь этой прикладной программы. Однако этот подход проблематичен в том смысле, что пользователь обычно обеспечивается только ограниченным установленным набором графических определений для выбора. Дополнительно, пользователь не уполномочен настраивать графику, основываясь на его или ее желании, без первого отказа автоматических, в целом, функциональных возможностей рисования, отклоняя, таким образом, цель для использования этого подхода в первом случае.On the other hand, some common graphics applications use an automatic drawing approach, in which the placement and appearance of each graphic symbol is automatically determined based on the type of graphic desired by the user and graphic elements predefined for the graphic. With this approach, the burden of alignment and positioning of graphic elements in the graphic is removed from the user and placed inside this application program. However, this approach is problematic in the sense that the user is usually provided with only a limited set of graphical definitions to choose from. Additionally, the user is not authorized to customize the graphics based on his or her desire, without first rejecting the automatic, in general, drawing functionality, thus rejecting the goal of using this approach in the first case.
Именно по отношению к этим и другим соображениям было сделано данное изобретение.It is in relation to these and other considerations that the present invention has been made.
Раскрытие изобретенияDisclosure of invention
В соответствии с данным изобретением, осуществляемый на компьютере способ предназначен для визуализации графики на экране дисплея. Графика является визуальным представлением содержания, в котором элементы могут или не могут быть размещены в предопределенной структуре. Различные формы содержания могут быть представлены, используя графику, но для целей иллюстрации содержание описывается здесь как текстовое содержание. При получении содержания способ вовлекает получение выбора графического определения, которое должно визуально представлять содержание. Выбранное графическое определение определяет заданные по умолчанию свойства для вида и размещения графических элементов для графики, созданной согласно графическому определению. Затем способ создает графику, включающую графические элементы, соответствующие элементам в содержании и в соответствии с настройкой по меньшей мере одного из заданных по умолчанию свойств, предварительно примененных к графике, визуализируемой для содержания, основываясь на различном графическом определении. Созданная графика тогда выводится на модуль дисплея для отображения пользователю.In accordance with this invention, a computer-based method is provided for rendering graphics on a display screen. Graphics is a visual representation of content in which elements may or may not be placed in a predefined structure. Various forms of content can be represented using graphics, but for purposes of illustration, the content is described here as text content. Upon receipt of the content, the method involves obtaining a selection of a graphic definition that should visually represent the content. The selected graphic definition defines the default properties for the appearance and placement of graphic elements for graphics created according to the graphic definition. The method then creates a graphic including graphic elements corresponding to elements in the content and in accordance with the setting of at least one of the default properties previously applied to the graphic rendered for the content based on a different graphic definition. The generated graphics are then displayed on the display module for display to the user.
В соответствии с вариантами воплощения изобретения, настройка идентифицируется с помощью анализа набора свойств, постоянных для всех возможных графических определений, где этот набор свойств определен в "семантической" модели. Таким образом, семантическая модель определяет те свойства, которые являются соответствующими графике, соответствующей всем возможным графическим определениям. В соответствии с еще одним вариантом воплощения, создание графики может также принимать во внимание настройки, которые являются определенными для специфического графического определения для графики, визуализируемой в настоящий момент. Эти настройки поддерживаются в модели "представления", которая извлекается наряду с семантической моделью, в ответ на выбор соответствующего графического определения.In accordance with embodiments of the invention, a setting is identified by analyzing a set of properties that are constant for all possible graphical definitions, where this set of properties is defined in a “semantic” model. Thus, the semantic model defines those properties that are relevant to the graphics, corresponding to all possible graphic definitions. According to yet another embodiment, the creation of graphics may also take into account settings that are specific to a specific graphic definition for the graphics currently being visualized. These settings are supported in the “presentation” model, which is retrieved along with the semantic model, in response to the choice of an appropriate graphical definition.
В еще одних вариантах воплощений данное изобретение предоставляет систему для визуального представления содержания. Система включает множество возможных графических определений, каждое из которых определяет значения свойств по умолчанию для соответствующей графики, действующей для представления содержания. Система также включает семантическую модель, которая определяет "семантические" свойства для всех возможных графических определений так, чтобы каждый связанный графический элемент представлял подобный элемент в содержании, используя подобное семантическое свойство. Дополнительно, система, согласно этому варианту воплощения, включает механизм настройки, действующий для определения графики согласно различным графическим определениям и семантической модели.In still other embodiments, the invention provides a system for visually presenting content. The system includes many possible graphical definitions, each of which defines the default property values for the corresponding graphics that are valid for presenting content. The system also includes a semantic model that defines “semantic” properties for all possible graphic definitions so that each related graphic element represents a similar element in the content using a similar semantic property. Additionally, the system according to this embodiment includes a tuning mechanism operable to determine graphics according to various graphic definitions and a semantic model.
В соответствии с еще одним вариантом воплощения, система включает множество моделей представления. Одна или более моделей представления связаны с одним или более множеством возможных графических определений. Каждая из моделей представления определяет свойства представления, определенные к графическому определению, с которым связана каждая из одной или более моделей представления. В ответ на выбор определенного графического определения для отображения, механизм настройки выполняет визуализацию графики согласно выбранному определению, семантической модели, которая является постоянной для всех графических определений, и одной или более моделей представления, связанных с выбранным определением. Таким образом, графика отображается, основываясь на выбранном определении, но имеет свойства вида и размещения, настроенные так, как это продиктовано в связанной модели(ях) представления и семантической модели.In accordance with another embodiment, the system includes many presentation models. One or more presentation models are associated with one or more of the many possible graphic definitions. Each of the presentation models defines presentation properties defined to the graphical definition with which each of one or more presentation models is associated. In response to the selection of a specific graphic definition for display, the tuning engine visualizes the graphics according to the selected definition, a semantic model that is constant for all graphic definitions, and one or more presentation models associated with the selected definition. Thus, the graphic is displayed based on the selected definition, but has the appearance and layout properties configured as dictated by the associated presentation model (s) and semantic model.
В соответствии с еще одним вариантом воплощения, данное изобретение направлено на способ для настройки графики, имеющей графические элементы, отображаемые на экране дисплея. В ответ на получение запроса на изменения графики, способ вовлекает изменение графики, основываясь на запросе, при поддержке настройки, предварительно примененной к графике. Более определенно настройка касается свойства первого графического элемента в графическом элементе относительно второго графического элемента в графике. Например, настройка может коснуться позиционирования или размера первого графического элемента относительно второго графического элемента. В варианте воплощения запрос на модификацию воплощает команду для добавления графического элемента к графике.According to yet another embodiment, the present invention is directed to a method for adjusting graphics having graphic elements displayed on a display screen. In response to receiving a request for graphics changes, the method involves changing the graphics based on the request, with support for settings previously applied to the schedule. More specifically, the setting relates to the property of the first graphic in the graphic relative to the second graphic in the graphic. For example, the setting may relate to the positioning or size of the first graphic element relative to the second graphic element. In an embodiment, a modification request embodies a command to add a graphic to a graphic.
Различные варианты воплощения данного изобретения могут быть осуществлены как компьютерный процесс, компьютерная система или как произведенное изделие типа компьютерного программного продукта или читаемых компьютером носителей. Компьютерным программным продуктом могут быть компьютерные носители данных, читаемые компьютерной системой и кодирующие компьютерные программные команды для выполнения компьютерного процесса. Компьютерным программным продуктом может также быть распространяемый на несущей сигнал, читаемый компьютерной системой, и кодирующий компьютерные программные команды для выполнения компьютерного процесса.Various embodiments of the present invention may be implemented as a computer process, a computer system, or as a manufactured product, such as a computer program product or computer readable media. The computer program product may be computer storage media readable by a computer system and encoding computer program instructions for performing a computer process. The computer program product may also be a signal distributed on a carrier read by a computer system and encoding computer program instructions for performing a computer process.
Эти и другие различные особенности, так же как преимущества, которые характеризуют данное изобретение, будут очевидны из чтения следующего подробного описания и обзора соответствующих чертежей.These and other various features, as well as the advantages that characterize the invention, will be apparent from reading the following detailed description and overview of the relevant drawings.
Краткое описание чертежейBrief Description of the Drawings
Фиг.1 иллюстрирует интерфейс пользователя прикладной компьютерной программы для работы с графикой для создания и редактирования графики в соответствии с вариантом воплощения данного изобретения.Figure 1 illustrates the user interface of a computer graphics application for creating and editing graphics in accordance with an embodiment of the present invention.
Фиг.2 показывает пример компьютерной системы, на которой варианты воплощения данного изобретения могут быть осуществлены.Figure 2 shows an example of a computer system on which embodiments of the present invention can be implemented.
Фиг.3 является функциональной диаграммой, показывающей различные компоненты прикладной компьютерной программы для работы с графикой, включая систему настройки, в соответствии с вариантом воплощения данного изобретения.FIG. 3 is a functional diagram showing various components of a graphics computer application program, including a configuration system, in accordance with an embodiment of the present invention.
Фиг.4 является функциональной диаграммой, иллюстрирующей, более подробно, систему настройки из фиг.3 в соответствии с вариантом воплощения данного изобретения.FIG. 4 is a functional diagram illustrating, in more detail, the tuning system of FIG. 3 in accordance with an embodiment of the present invention.
Фиг.5A-5C иллюстрируют последовательные операции системы настройки из фиг.4 для управления настройкой графики, редактируемой в прикладной компьютерной программе для работы с графикой.FIGS. 5A-5C illustrate sequential operations of the tuning system of FIG. 4 to control the tuning of graphics edited in a graphics application computer program.
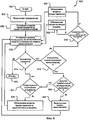
Фиг.6 является блок-схемой, иллюстрирующей операционные характеристики процесса для отображения ("процесс отображения") графики, основываясь на пользовательских настройках, показываемой в соответствии с вариантом воплощения данного изобретения.6 is a flowchart illustrating operational characteristics of a process for displaying (“display process”) graphics based on user settings shown in accordance with an embodiment of the present invention.
Осуществление изобретенияThe implementation of the invention
Теперь данное изобретение будет описано более подробно со ссылкой на сопроводительные чертежи, в которых показаны варианты воплощения изобретения. Это изобретение может, однако, быть воплощено во многих различных формах, и не должно рассматриваться как ограниченное вариантами воплощения, сформулированными здесь; скорее, эти варианты воплощения даны так, чтобы это раскрытие было полным и завершенным, и полностью передавало объем изобретения специалистам в данной области техники. Подобные номера повсюду относятся к подобным элементам.The invention will now be described in more detail with reference to the accompanying drawings, in which embodiments of the invention are shown. This invention may, however, be embodied in many different forms, and should not be construed as limited by the embodiments set forth herein; rather, these embodiments are given so that this disclosure will be thorough and complete, and will fully convey the scope of the invention to those skilled in the art. Similar numbers refer to like elements throughout.
Вообще, данное изобретение касается настройки визуального представления содержания, отображенного в одном или более графическом представлении. Содержание может быть информацией любой формы, но здесь описано как текстовые данные в соответствии с примерным вариантом воплощения данного изобретения. Содержание может быть предоставлено пользователем (например, с помощью клавиатуры, мыши, и т.д.), прикладной программой или их комбинацией. Каждое графическое представление включает, по меньшей мере, один графический элемент, который может иметь текстовые характеристики, графические характеристики или и те и другие.In general, the present invention relates to customizing a visual representation of content displayed in one or more graphical representations. The content may be information of any form, but is described here as text data in accordance with an exemplary embodiment of the present invention. The content may be provided by a user (for example, using a keyboard, mouse, etc.), an application program, or a combination thereof. Each graphic representation includes at least one graphic element, which may have textual characteristics, graphic characteristics, or both.
В соответствии с вариантом воплощения, данное изобретение предоставляет осуществляемый на компьютере способ для отображения (упомянутый здесь как, "процесс отображения") графики, основываясь на пользовательских настройках для свойств вида и размещения одного или более графических элементов в графике. Такие свойства включают цвет, позицию, размер, форму, форматирование и другие визуальные атрибуты, связанные с графическими элементами.According to an embodiment, the invention provides a computer-implemented method for displaying (referred to herein as the “display process") graphics based on user settings for the appearance and placement of one or more graphic elements in the graphic. Such properties include color, position, size, shape, formatting, and other visual attributes associated with graphic elements.
Процесс отображения воплощен в прикладной компьютерной программе для работы с графикой, имеющей интерфейс пользователя (UI) для создания и редактирования графики. Прикладная компьютерная программа для работы с графикой может быть или отдельным компьютерным приложением или подкомпонентом другого компьютерного приложения, таким как, без ограничения, приложение для представления, приложение для обработки текстов, приложение для рисования или приложение электронной таблицы. Специалисты в данной области техники оценят применимость прикладной компьютерной программы для работы с графикой к этим другим формам компьютерных приложений, которые обычно собираются в офисном наборе приложений, типа Microsoft Office® и OpenOffice.The display process is embodied in a computer graphics application having a user interface (UI) for creating and editing graphics. An application computer program for working with graphics can be either a separate computer application or a subcomponent of another computer application, such as, without limitation, a presentation application, a word processing application, a drawing application, or a spreadsheet application. Specialists in the art will appreciate the applicability of a computer graphics application to these other forms of computer applications that are typically assembled in an office suite of applications such as Microsoft Office ® and OpenOffice.
Данное изобретение описано в общем контексте компьютерных выполнимых команд (например, программных модулей), выполняемых одним или более компьютером или другими устройствами. Функциональные возможности программных модулей могут быть объединены или распределены, как желательно, в различных вариантах воплощения. Программные модули включают одну или более подпрограмм, программ, объектов, компонентов, структур данных и т.д., которые выполняют специфические задачи или осуществляют специфические абстрактные типы данных.The invention is described in the general context of computer-executable instructions (eg, program modules) executed by one or more computers or other devices. The functionality of the software modules may be combined or distributed, as desired, in various embodiments. Software modules include one or more subprograms, programs, objects, components, data structures, etc. that perform specific tasks or implement specific abstract data types.
Обратимся теперь к фиг.1, где показан образцовый UI 102 для использования в создании и редактировании графики в прикладной компьютерной программе для работы с графикой в соответствии с вариантом воплощения данного изобретения. UI 102 разделен на множество областей, или "панелей", каждая из которых ответственна за различные аспекты функциональных возможностей прикладной компьютерной программы для работы с графикой. В варианте воплощения множество панелей включает панель 104 содержания, графическую панель 106 и панель 105 галереи.Turning now to FIG. 1, an
Графическая панель 106 отображает графическое содержание 108, созданное прикладной компьютерной программой для работы с графикой, используя содержание из панели 104 содержания. Графическое содержание 108 может быть любой формой визуального представления, типа рисунка, диаграммы, и т.д., и упомянуто здесь как "графика" для целей спецификации. Панель 105 галереи предоставляет пользователю множество выбираемых графических определений (например, 109a, 109b), которые могут быть применены к содержанию в панели 104 содержания и визуализированы в графической панели 106 в виде графики 108. Каждая из этих трех панелей (104, 105 и 106) далее будет описана в свою очередь более подробно при описании операций прикладной компьютерной программы для работы с графикой в соответствии с различными вариантами воплощения данного изобретения.The
Графическая панель 106, которая также упомянута на фиг.1 как "панель канвы рисунка", является окном, оконной панелью, графическим классом представления, или другой областью дисплея, которая позволяет пользователю визуально отображать и редактировать графическое содержание, визуализируемое через UI 102 прикладной компьютерной программой для работы с графикой. Также графическая панель 106 содержит графику 108, визуализируемую прикладной компьютерной программой для работы с графикой, и обеспечивает пользователя приложения функциональными возможностями для редактирования или настройки графики 108 к его или ее симпатиям. Графика 108 включает один или более графических элементов, типа графических элементов 122-131, которые представляют содержание, введенное в панель 104 содержания. Настройка графики 108 относится к редактированию свойства любого типа, связанного с графикой, включая, без ограничения, визуальные атрибуты и позиции графических элементов 122-131, так же как и любого текста в пределах этих элементов.The
Графика 108 показана на фиг.1 как круговая графическая диаграмма для иллюстративных целей. Необходимо отметить, что любой тип графики, имеющий любое число графических элементов, например 122-131, рассматривается в объеме данного изобретения. С этой целью графические элементы 122-131 могут включать, но не ограничиваясь этим, узлы, переходы, выноски (метки-идентификаторы элемента иллюстрации) или графический элемент. Узлом может быть одна из форм в графическом содержании. Примеры узлов могут включать круги, квадраты, треугольники, или части форм, подобно сегментам. Любой специалист в данной области техники распознает различные типы узлов. Переход является графическим представлением взаимосвязи между узлами. Переход обычно является строкой, стрелкой или другой формой, означающей отношения между двумя узлами.
Панель 104 содержания является окном, оконной панелью, классом представления контура или другой областью дисплея, которая позволяет пользователю вводить тело 115 содержания (в дальнейшем называемое как "содержание") в UI 102 из прикладной компьютерной программы для работы с графикой. Также панель 104 содержания используется для принятия содержания 115 для использования прикладной компьютерной программой для работы с графикой при создании графики 108. В основном, содержание 115 является идеей, которую пользователь предназначает для визуализации с помощью графики 108. В варианте воплощения содержание 115 включает текстовые данные, которые могут или не могут быть размещены, основываясь на определенных свойствах форматирования, или "предопределенной структуре". Фиг.1 иллюстрирует содержание 115, являющееся текстовыми данными, расположенными, основываясь на определенных свойствах форматирования в соответствии с этим вариантом воплощения, где эти текстовые данные 115 представляют собой иерархический список идей, имеющих взаимосвязи. В других вариантах воплощения содержание 115 может включать информацию, которая не является текстовой, типа любой другой формы данных, включая, но не ограничиваясь этим, иллюстрации, изображений, видео, звуки или другие аудиовизуальные материалы.The
В варианте воплощения панель 104 содержания используется для получения ввода от пользователя и отображения того, что вводят как содержание 115 для редактирования пользователем. В этом отношении содержание 115 может быть или введено вручную пользователем (например, с помощью клавиатуры) в панель 104 содержания, или вставлено из другой области в прикладной компьютерной программе для работы с графикой или другой прикладной программе в целом. В соответствии с другим вариантом воплощения содержание 115 в панели 104 содержания может быть связано с другим приложением или программой, так что, как только данные содержания в другой программе создадутся или изменятся, содержание 115 в панели 104 содержания автоматически появится или изменится. В других вариантах воплощения пользователь может вручную обновить связанные данные так, чтобы пользователь вынудил данные содержания обновиться в панели 104 содержания вместо использования прикладной программы для работы с графикой или другой программы для автоматического обновления. В еще одних вариантах воплощения пользователь может запросить и получить данные содержания из другой программы, такой как база данных. Альтернативно, содержание 115 может быть введено в панель 104 содержания автоматически (то есть, без взаимодействия с пользователем) прикладной компьютерной программой для работы с графикой или другим приложением.In an embodiment, the
Панель галереи 105 является окном или другим компонентом графического интерфейса пользователя, действующий для представления различных типов графических определений, таких, как графические определения 109a и 109b, показанные для иллюстративных целей. Графические определения 109a и 109b могут быть выбраны пользователем для приложения к содержанию 115 в панели 104 содержания для визуализации графики 108. В варианте воплощения панель 105 галереи позволяет пользователю переключаться между различными графическими определениями 109a и 109b и применять то же самое содержание к выбранному графическому определению, например, 109a и 109b, без необходимости создавать каждую графику 108 на пустом месте.Gallery panel 105 is a window or other component of a graphical user interface operable to represent various types of graphical definitions, such as
Каждое графическое определение, например 109a и 109b, связано с заданным по умолчанию набором свойств для графики 108. В варианте воплощения эти свойства касаются любой визуальной или невизуальной характеристики, воплощающей размещение и вид графических элементов, например, 122-131, в графике 108. В ответ на выбор пользователя определенного графического определения 109a или 109b, прикладная компьютерная программа для работы с графикой использует выбранное графическое определение 109a или 109b как структуру для размещения и вида графики 108. В соответствии с вариантом воплощения данного изобретения, прикладная компьютерная программа для работы с графикой выполняе динамическую визуализацию графики 108, основываясь на свойствах, определенных для выбранного определения 109a или 109b, как определено, в настоящее время, согласно любым настройкам, которые были применены к одному любому (1) из этих свойств, которые являются постоянными для всех графических определений (например, 109a и 109b) или (2) любому из этих свойств, которые являются строго соответствующими выбранному графическому определению 109a или 109b. Динамическая генерация графики 108 тогда обращается к различным свойствам, которые могут быть определены для графики 108 в различное время, когда определенное графическое определение, например, 109a и 109b, выбиралось пользователем.Each graphic definition, for example 109a and 109b, is associated with a default set of properties for
Панель 105 галереи, показанная на фиг.1, является упрощенной галереей графических определений, например 109a и 109b. Действительно, только два выбора графических определений, то есть, 109a и 109b, показаны на фиг.1. Однако данное изобретение не ограничено таким ограниченным выбором, а скорее панель 105 галереи может предоставлять пользователю для выбора любое число графических определений, например, 109a и 109b. Первое графическое определение 109a представляет собой круговую диаграмму. Второе графическое определение 109b представляет собой пирамидальную диаграмму. В соответствии с вариантом воплощения, первое (109a) и второе (109b) графические определения представлены на фиг.1 как эскизы. В других вариантах воплощения графические определения 109a и 109b могут быть представлены на меню или в списке подробных имен, которые позволяют пользователю выбирать имя из списка. Любой специалист в данной области техники распознает, что другие способы представления графических определений 109a и 109b в панели 105 галереи включены в данное изобретение.The gallery panel 105 shown in FIG. 1 is a simplified gallery of graphic definitions, such as 109a and 109b. Indeed, only two choices of graphic definitions, that is, 109a and 109b, are shown in FIG. However, the present invention is not limited to such a limited selection, but rather, the gallery panel 105 may provide the user with a choice of any number of graphic definitions, for example 109a and 109b. The first
Помня о вышеупомянутых структурах UI 102, действие прикладной компьютерной программы для работы с графикой теперь описывается со ссылкой на фиг.1 в соответствии с вариантом воплощения данного изобретения. Графическая панель 106 показывает визуализируемую графику 108, созданную из содержания 115 в панели 104 содержания и выбранного графического определения 109a или 109b, определение свойств которых может быть настроено так, как кратко описано выше. Графика 108 включает графические элементы 122-131, представляющие различные элементы (например, 116a, 116b, 118a и 118b), или "входы", содержащиеся в теле содержания 115. В варианте воплощения, проиллюстрированном на фиг.1, каждый графический элемент 122-131 соответствует единственному элементу содержания 115. Однако другие варианты воплощения вовлекают единственный графический элемент, например, 122-131, в представление множества элементов содержания 115 и еще одни варианты воплощения вовлекают единственный элемент содержания 115 в представление множеством графических элементов, например, 122-131.Bearing in mind the aforementioned structures of
Содержание 115 может быть вводом в панель 104 содержания, и графическое определение 109a или 109b может быть выбрано в любой последовательности, не отступая от объема данного изобретения. Если графическое определение 109a или 109b выбрано пользователем до введения любого содержания 115 в панель 104 содержания, графика 108 отображается без любого содержания или, альтернативно, с набором типового содержания. Напротив, пользователь может ввести данные в панель 104 содержания для ввода как содержание 115 до выбора графического определения 109a или 109b. В варианте воплощения в этом случае прикладная компьютерная программа для работы с графикой может предоставить пользователю заданный по умолчанию выбор для графического определения 109a или 109b; таким образом, когда содержание 115 введено, графическая панель 106 сможет отобразить графику 108 заданного по умолчанию графического определения 109a или 109b, которое растет в графических элементах (например, 122-131), поскольку пользователь продолжает добавлять содержание 115. Альтернативно, графическая панель 106 может остаться пустой (то есть, без графики 108), пока пользователь не выберет графическое определение 109a или 109b из панели 105 галереи.The content 115 may be input to the
Фиг.1 иллюстрирует примерный вариант воплощения данного изобретения, в котором пользователь ввел содержание 115 в форме текстового содержания, и, более точно, в форме иерархического списка. Кроме того, пользователь выбрал графическое определение 109a круговой диаграммы. Графическая панель 106 отображает графику 108, которая имеет тип круговой диаграммы 109a из-за выбора пользователя. Графика 108 круговой диаграммы представляет собой иерархический список 115. Каждый из графических элементов 122-131 в графике 108 соответствует элементу (то есть, строке текста) в иерархическом списке 115. Как отмечено выше, однако, другие варианты воплощений вовлекают каждый из графических элементов 122-131, соответствующие множеству элементов в иерархическом списке 115, и еще одни варианты воплощения вовлекают больше чем один из графических элементов 122-131, соответствующих единственному элементу в иерархическом списке 115.Figure 1 illustrates an exemplary embodiment of the present invention in which a user entered content 115 in the form of textual content, and more specifically, in the form of a hierarchical list. In addition, the user selected a graphical definition of a
В варианте воплощения структура текстового содержания 115 в панели 104 содержания определяет структуру и вид графических элементов 122-131, показанных в графической панели 106. Например, первый слой графики 108 круговой диаграммы является родительским элементом 131, соответствующим первой исходной строке 116a текстового содержания 115 в панели 104 содержания. Второй слой графики 108 круговой диаграммы включает элементы 126, 127, 128, 129 и 130, которые являются зависимыми от родительского элемента 131, и упомянуты, таким образом, как "дочерние элементы". Дочерние элементы 126, 127, 128, 129 и 130 соответствуют строкам 118a текстового содержания 115, выровненным под первой строкой 116a. Третий слой графики 108 круговой диаграммы также является родительским элементом 125 и соответствует второй исходной строке 116b текстового содержания 115. Наконец, четвертый слой графики 108 круговой диаграммы включает дочерние элементы 122, 123 и 124, которые являются зависимыми от родительского элемента 125. Дочерние элементы 122, 123 и 124 соответствуют строкам 118b текстового содержания 115, выровненным под второй исходной строкой 116b. Необходимо отметить, что, в отличие от предшествующего примера, текстовое содержание 115 в панели 104 содержания представлено различными графическими элементами 122-131 в графике 108, и структура текстового содержания 115 представлена структурой графических элементов 122-131 в графике 108.In an embodiment, the structure of the text content 115 in the
С вышеупомянутым примером в памяти, вариант воплощения данного изобретения вовлекает изменение графики 108 в ответ на изменения в текстовом содержании 115. Например, если отступ самой верхней строки этих строк 118a, показанных на фиг.1, как зависимых от первой исходной строки 116a, удален, то новый уровень был бы создан в графике 108 круговой диаграммы между первым слоем и вторым слоем. Этот новый слой включил бы графический элемент 129. Изменение подразумевало бы, что дочерние записи, графические элементы 126, 127, 128 и 130, станут дочерними записями графического элемента 129, потому что верхняя строка строк 118a является теперь "исходной строкой", имеющей подчиненные ей дочерние записи.With the above example in mind, an embodiment of the present invention involves changing the
Пример подходящей среды, в которой изобретение может быть осуществлено, проиллюстрирован на фиг.2. Среда является только одним примером подходящей среды и не предназначена для предложения любого ограничения относительно объема использования или функциональных возможностей изобретения. Другие известные компьютерные системы, среды и/или конфигурации, которые могут быть подходящими для использования с изобретением, включают, но не ограничены этим, персональные компьютеры, серверные компьютеры, ручные или портативные устройства, многопроцессорные системы, системы на основе микропроцессора, программируемую бытовую электронику, сетевые PC, миникомпьютеры, универсальные компьютеры, распределенные компьютерные среды, которые включают любую из вышеупомянутых систем или устройств и т.п.An example of a suitable environment in which the invention may be practiced is illustrated in FIG. The environment is just one example of a suitable environment and is not intended to suggest any limitation as to the scope of use or functionality of the invention. Other known computer systems, environments and / or configurations that may be suitable for use with the invention include, but are not limited to, personal computers, server computers, handheld or portable devices, multiprocessor systems, microprocessor based systems, programmable consumer electronics, network PCs, minicomputers, general purpose computers, distributed computing environments that include any of the aforementioned systems or devices, and the like.
Со ссылкой на фиг.2, примерная система для осуществления изобретения включает компьютерное устройство, типа компьютерного устройства 200. В своей наиболее базовой конфигурации компьютерное устройство 200 обычно включает по меньшей мере один процессорный модуль 202 и память 204. В зависимости от точной конфигурации и типа компьютерного устройства, память 204 может быть энергозависима (типа оперативной памяти), энергонезависима (типа постоянной памяти, флэш-памяти, и т.д.) или некоторой комбинации этих двух видов. Наиболее базовая конфигурация компьютерного устройства 200 проиллюстрирована на фиг.2 пунктирной линией 206. Дополнительно, устройство 200 может также иметь дополнительные особенности/функциональные возможности. Например, устройство 200 может также включать дополнительную память (сменную и/или несменную), включая, но не ограничиваясь этим, магнитные или оптические диски или ленту. Такая дополнительная память проиллюстрирована на фиг.2 сменной памятью 208 и несменной памятью 210. Компьютерные носители данных включают энергозависимые и энергонезависимые, сменные и несменные носители, осуществленные любым способом или технологией для хранения информации, такой как читаемые компьютерные команды, структур данных, программные модули или другие данные. Память 204, сменная память 208 и несменная память 210 являются всеми примерами компьютерных носителей данных. Компьютерные носители данных включают, но не ограничены этим, оперативную память (RAM), постоянную память (ROM), электронно-перепрограммируемую постоянную память (EEPROM), флэш-память или другую технологию памяти, CD-ROM, цифровые универсальные диски (DVD) или другую оптическую память, магнитные кассеты, магнитную ленту, магнитную память на диске или другие магнитные запоминающие устройства, или любые другие носители информации, которые могут использоваться для хранения желательной информации, и к которой можно обратиться устройством 200. Любые такие компьютерные носители данных могут быть частью устройства 200.With reference to FIG. 2, an example system for practicing the invention includes a computer device, such as a
Устройство 200 может также содержать коммуникационное подключение(я) 212, которые позволяют устройству связываться с другими устройствами. Коммуникационное подключение(я) 212 является примером коммуникационных носителей. Коммуникационные носители обычно воплощают компьютерные читаемые команды, структуры данных, программные модули или другие данные в модулируемом сигнале данных типа несущей или другом транспортном механизме, и включают любые информационные носители доставки. Термин "модулированный сигнал данных" означает сигнал, который имеет одну или более из его набора характеристик измененной таким способом, чтобы кодировать информацию в сигнале. В качестве примера, но не ограничения, коммуникационные носители включают проводные носители типа проводной сети или прямого проводного подключения, и беспроводных носителей типа акустических, радиочастотных, инфракрасных и других беспроводных носителей.The
Устройство 200 может также иметь устройство(а) 214 ввода данных типа клавиатуры, мыши, пера, голосового устройства ввода данных, сенсорного устройства ввода данных, и т.д. Устройство(а) 216 вывода типа дисплея, динамиков, принтера, и т.д. также могут быть включены. Устройства могут помочь формировать интерфейс пользователя 102 обсужденный выше. Все эти устройства являются хорошо известными в данной области техники, и не требуется обсуждать их подробно здесь.
Компьютерное устройство 200 обычно включает, по меньшей мере, несколько форм читаемых компьютерных носителей. Читаемые компьютерные носители могут быть любыми доступными носителями, к которым можно обратиться процессорным модулем 202. В качестве примера, но не ограничения, читаемые компьютерные носители могут включать компьютерные носители данных и коммуникационные носители. Комбинации любых из вышеупомянутых устройств должны быть также включены в читаемые компьютерные носители.
Компьютерное устройство 200 может работать в сетевой среде, используя логические подключения к одному или более удаленным компьютерам (не показанным здесь). Удаленный компьютер может быть персональным компьютером, серверной компьютерной системой, маршрутизатором, сетевым PC, одноранговым устройством или другим обычным сетевым узлом, и обычно включает многие или все элементы, описанные выше относительно компьютерного устройства 200. Логические подключения между компьютерным устройством 200 и удаленным компьютером могут включать локальную сеть (LAN) или глобальную сеть (WAN), но могут также включать другие сети. Такие сетевые среды являются обычными в офисах, компьютерных сетях масштабах предприятия, сетях интранет и Интернет.
При использовании в сетевой среде LAN, компьютерное устройство 200 связано с LAN через сетевой интерфейс или адаптер. При использовании в сетевой среде WAN, компьютерное устройство 200 обычно включает модем или другие средства для установления связи по глобальной сети, такой как Интернет. Модем, который может быть внутренним или внешним, может быть связан с компьютерным процессорным модулем 202 через коммуникационные подключения 212, или другой соответствующий механизм. В сетевой среде программные модули или части этого могут быть сохранены в удаленном запоминающем устройстве хранения. В качестве примера, но не ограничения, удаленные прикладные программы могут постоянно находиться в устройстве памяти, связанном с удаленной компьютерной системой. Необходимо отметить, что объясненные сетевые подключения являются образцовыми, и могут использоваться другие средства установления связи между компьютерами.When used in a LAN network environment, the
В случае компьютерной среды по фиг.2, фиг.3 иллюстрирует функциональную диаграмму, воплощающую компоненты прикладной компьютерной программы 100 для работы с графикой в соответствии с вариантом воплощения данного изобретения. Прикладная компьютерная программа 100 для работы с графикой включает интерфейс пользователя (UI) 102, который, как отмечено в связи с фиг.1, имеет панель 104 содержания, графическую панель 106 и панель 105 галереи. Функциональные (блочные) стрелки 308, 310 и 312 представляют пользовательское взаимодействие с панелью 104 содержания, графической панелью 106 и панелью 105 галереи соответственно, для того чтобы использовать прикладную компьютерную программу 100 для работы с графикой.In the case of the computer environment of FIG. 2, FIG. 3 illustrates a functional diagram embodying the components of a
Более подробно, пользовательское взаимодействие 308 с панелью 104 содержания приводит к вводу содержания 115 в прикладную компьютерную программу 100 для работы с графикой. В ответ на такой ввод, прикладная компьютерная программа 100 для работы с графикой отображает это содержание 115 в панели 104 содержания для отображения и разрешения редактирования пользователю. Так же, как описано выше, прикладная компьютерная программа 100 для работы с графикой создает графику 108, представляющую это содержание 115, и отображает эту графику 108 через графическую панель 106. Пользовательское взаимодействие 310 с графической областью окна 106 приводит к редактированию графики 108, отображенного там. Также пользовательское взаимодействие 310 предоставляет настройки для графики 108, отображенной в графической панели 106. Пользовательское взаимодействие 312 с панелью 105 галереи приводит к выбору определенного графического определения из множества графических определений, например, 109a и 109b, графические представления которых отображены через панель 105 галереи пиктограммой, меню, инструментальной панелью, эскизом или другим известным выбираемым UI компонентом. Таким образом, выбор определенного графического определения 109a или 109b через панель 105 галереи приводит к визуализации графики 108 в графической панели 106, основываясь на выбранном определении 109a или 109b.In more detail,
В дополнение к компонентам интерфейса пользователя, описанным выше, прикладная компьютерная программа 100 для работы с графикой также включает систему 300 настройки и механизм 303 размещения. Система 300 настройки и механизм 303 размещения работают вместе для обеспечения интерфейса 102 пользователя с соответствующей графикой 108 для визуализации на графической панели 106. Для достижения этого система 300 настройки передает данные 301, воплощающие свойства вида и размещения, указанные для выбранного графического определения 109a или 109b, и любым связанным с ними настройкам, механизму 303 размещения. Для целей спецификации, это данные 301 упоминаются в дальнейшем как "данные настройки". Данные 301 настройки вместе определяют свойства, основываясь на которых графика 108 должна быть визуализирована, как определено в выбранном графическом определении 109a или 109b и в соответствии с любыми настройками, которые были применены к одному (1) любому из этих свойств, которые являются постоянными для всех графических определений (упомянутые ниже как "семантические" свойства) или (2) любому из этих свойств, которые являются строго соответствующими выбранному графическому определению 109a или 109b (упомянутые ниже как свойства "представления"). Более подробная иллюстрация системы настройки 300 представлена ниже при описании фиг.4.In addition to the user interface components described above, the
Механизм 303 размещения интерпретирует данные 301 настройки для генерации дерева 302 размещения для визуализируемой графики 108. Дерево 302 размещения после этого пересекается для идентификации свойства вида и размещения для использования в визуализации графики 108. В варианте воплощения обход дерева 302 размещения выполняется компонентом механизма 303 размещения, называемого "механизм 304 вывода". В этом варианте воплощения механизм 304 вывода визуализирует графику 108, которая должна быть передана графической панели 106 для отображения и редактирования. При получении графики 108 графическая панель 106 отображает графику 108 пользователю для просмотра и редактирования. Функциональные возможности и структура механизма 303 размещения описаны более детально в соответствии с вариантом воплощения данного изобретения в совместно рассматриваемой патентной заявке США "Method, System and Computer-Readable Medium for Creating and Laying Out a Graphic Within an Application Program", поданной 30 сентября 2004 и имеющей Serial № 10/955,271, полное раскрытие которой тем самым полностью включено по ссылке. Необходимо отметить, что графика 108 может быть создана, используя данные 301 настройки другими средствами кроме механизма 303 размещения, который описан выше только для иллюстративных целей, чтобы передать примерный вариант воплощения данного изобретения.The
Обратимся теперь к фиг.4, показывающей систему настройки 300 в формате функциональной диаграммы в соответствии с вариантом воплощения данного изобретения. Система 300 настройки включает механизм 412 настройки и библиотеку 402 графических моделей. Библиотека 402 графических моделей является структурой данных, которая поддерживает множество моделей представления (например, 408 и 410) и семантическую модель 404. Механизм 412 настройки использует модели представления (например, 408 и 410) и семантическую модель 404 для создания данных 301 настройки для представления в механизме 303 размещения для создания графики 108.Turning now to FIG. 4, a
В варианте воплощения библиотека 402 графических моделей является определенной для каждого экземпляра и/или сеанса прикладной компьютерной программы 100 для работы с графикой. Также библиотеку 402 графических моделей и ее компоненты показывают в пунктирных линиях для иллюстрации экземпляра библиотеки 402 и моделей 408, 410 и 404 в памяти для каждого экземпляра прикладной компьютерной программы для работы с графикой 100. Например, если пользователь создает и/или редактирует две различные графики 108 в одно и то же время, используя прикладную компьютерную программу 100 для работы с графикой, библиотека 402 графических моделей и связанные модели 408, 410 и 404 создаются для каждой из двух различных график 108. Альтернативно, библиотека 402 графических моделей и ее компоненты могут быть сохранены для более чем одного экземпляра и/или сеанса прикладной компьютерной программы 100 для работы с графикой. Реализация является вопросом выбора, причем оба варианта находятся в пределах объема данного изобретения.In an embodiment, the
Модели представления (например, 408 и 410) являются структурами данных, которые поддерживают текущие свойства, определенные для каждого графического определения 109a и 109b, которые могут быть выбраны через панель 105 галереи. Варианты воплощения данного изобретения описаны иллюстративно с 1:1 корреляцией моделей представления к графическим определениям 109a и 109b. Также фиг.1 показывает пригодность двух графических определений 109a и 109b, которые могут быть выбраны через панель 105 галереи, и таким образом только две модели 408 и 410 представления поддерживаются в библиотеке 402 графических моделей, показанной в фиг.4. Необходимо отметить, что панель 105 галереи может функционировать для выбора любого числа графических определений 109a и 109b, и библиотека 402 графических моделей может включать любое число моделей представления (например, 408 и 410).Presentation models (e.g., 408 and 410) are data structures that support the current properties defined for each
Семантическая модель 404 является структурой данных, которая поддерживает текущие свойства, сохраняемые для всех графических определений 109a и 109b, которые могут быть выбраны пользователем через панель 105 галереи. Как следствие, существует только одна семантическая модель 404 для библиотеки 402 графических моделей. Вновь, вариант воплощения данного изобретения, отмеченный выше, вовлекает поддержку семантической модели 404 с каждым экземпляром и/или сеансом прикладной компьютерной программы 100 для работы с графикой, и поэтому можно иметь больше чем одну семантическую модель 404.The
В ответ на получение выбора графического определения 109a или 109b через панель 105 галереи, механизм настройки 412 отыскивает соответствующую модель 408 или 410 представления (то есть, модель 408 представления, связанную с выбранным графическим определением 306) и семантическую модель 404. Механизм 412 настройки после этого создает данные 301 настройки, основываясь на текущих свойствах, определенных для выбранного графического определения 109a или 109b, как определено в соответствующей модели 408 представления, и семантической модели 404.In response to obtaining a selection of the
Свойства, указанные в модели 408 и 410 представления и семантической модели 404, динамически модифицируются, основываясь на вводе из панели 104 содержания и графической панели 106. Относительно панели 104 содержания, поскольку пользователь добавляет содержание 115 через пользовательское взаимодействие 308, модель 408 и 410 представления и семантическая модель 404 модифицируются для отражения добавления такого содержания 115. Например, если иерархический список имеет текстовые строки содержания "A", "B" и "C", то каждая модель 408 и 410 представления и семантическая модель 404 в библиотеке 402 графических моделей имеет представление в памяти для графического элемента, соответствующего каждой текстовой строке содержания "A", "B" и "C". В ответ на добавление пользователем четвертой текстовой строки содержания "D" механизм 412 настройки модифицирует каждую модель 408 и 410 представления и семантическую модель 404 для включения в представление в памяти для графического элемента, соответствующего этой новой текстовой строке содержания. Поэтому данные 301 настройки, созданные механизмом 412 настройки, будут включать добавление этого нового графического элемента на основании соответствующей модели 408 или 410 представления и семантической модели 404, определяющей то же самое.The properties specified in the
Относительно графической панели 106, по мере того, как пользователь редактирует визуализируемую графику 108 через пользовательское взаимодействие 310, механизм 412 настройки модифицирует модель представления (например, 408 или 410), соответствующую графическому определению 306, связанному с отредактированной графикой 108 или, альтернативно, семантическую модель 404, для отражения настройки пользователя. В этом отношении, механизм 412 настройки модифицирует соответствующую модель представления (например, 408 или 410), если настройка является изменением к свойству представления, то есть, "изменению представления". Напротив, механизм 412 настройки модифицирует семантическую модель 404, если настройка является изменением к семантическому свойству, то есть "семантическому изменению".Regarding the
Вообще, классификация изменений к любому свойству графики 108 как являющихся изменением "представления" или "семантическим" изменением является вопросом выбора, и любые такие классификации находятся в объеме данного изобретения. Только для целей иллюстрации, примерное семантическое изменение описано здесь как являющееся изменением цвета графического элемента, и примерное изменение представления описано здесь как являющееся изменением размера графического элемента. С этими иллюстрациями в памяти, фиг.5A-5C иллюстрируют особенности функционирования данного изобретения относительно обновления модели 408 представления и семантической модели 404 в ответ на пользовательское взаимодействие, введенное в графическую панель 106.In general, the classification of changes to any property of
Фиг.5A иллюстрирует графику 500, имеющую графические элементы 502, 504, 506, 508 и 510, отображаемые через графическую панель 106. Графические элементы 502, 506 и 510 соответствуют текстовым строкам содержания, или объектам, "A", "B" и "C" соответственно, включенным в содержание 115 из панели 104 содержания. Графика 500 еще не была отредактирована пользователем, и поэтому не имеет никаких настроек. Также, графику 500 показывают в графической панели 106, используя значения свойств по умолчанию, определенных графическим определением 109a или 109b, которому принадлежит графика 500. Модель представления 408 и семантическая модель 404 для графики 500 показывают с этими заданными по умолчанию свойствами, которые в действительности были использованы механизмом 412 настройки для генерации данных 301 настройки для этой специфической графики 500. Таким образом, визуализируемая графика 500 воплощает свойства, определенные выбранным графическим определением 109a или 109b, без настроек.5A illustrates
Как отмечено выше, модель 408 представления и семантическая модель 404 являются представлениями в памяти, и таким образом показаны с использованием пунктирных линий. Каждая из этих моделей 404 и 408 включает представления, соответствующие каждому из графических элементов 502, 504, 506, 508 и 510, включенных в графику 500. В частности, модель 408 представления включает представления 502', 504', 506', 508' и 510', которые соответствуют графическим элементам 502, 504, 506, 508 и 510, соответственно, и поддерживают свойства, связанные с каждым соответствующим графическим элементом. Эти свойства являются свойствами "представления", которые являются определенными только для графического определения 109a или 109b, которому принадлежит графика 500. В примерном варианте воплощения для иллюстрации на фиг.5A-5C, размер этих графических элементов 502, 504, 506, 508 и 510 составляет свойство представления.As noted above, the
Аналогично, семантическая модель 404 включает представления 502", 504", 506", 508" и 510", которые соответствуют графическим элементам 502, 504, 506, 508 и 510, соответственно, и поддерживают свойства, связанные с каждым соответствующим графическим элементом. Эти свойства являются "семантическими" свойствами, которые являются постоянными для всех графических определений 109a и 109b, которые могут быть выбраны через панель 105 галереи. В примерном воплощении для иллюстрации на фиг.5A-5C цвет этих графических элементов 502, 504, 506, 508 и 510 составляет семантическое свойство.Similarly, the
Фиг.5B иллюстрирует результаты пользовательского взаимодействия 310 для редактирования цвета графического элемента 502 и размера графического элемента 506. Поскольку цвет графических элементов составляет семантическое свойство в соответствии с примерным вариантом воплощения, описанным здесь, механизм 412 настройки модифицирует представление 502" в семантической модели 404, соответствующей графическому элементу 502, для согласования изменения цвета. Поскольку размер графических элементов составляет свойство представления в соответствии с примерным вариантом воплощения, описанным здесь, механизм настройки 412 модифицирует представление 506' в модели 408 представления, соответствующей графическому элементу 506, для согласования изменения размера.FIG. 5B illustrates the results of
Фиг.5C иллюстрирует визуализацию на графической панели 106 графики 511, соответствующей отличному графическому определению 109a или 109b, чем графика 500, показанная на фиг.5A-5B. Графика 511 включает графические элементы 512, 514, 516, 518 и 520. Эта графика 511 визуализируется на графической панели 106 в ответ на запрос пользователя через панель 105 галереи переключить графические определения 109a и 109b чтобы рассмотреть содержание 115 (например, "A", "B" и "C"). При получении такого запроса механизм настройки 412 извлекает модель 410 представления, связанную с новым графическим определением 109a или 109b и семантической моделью 408.FIG. 5C illustrates a visualization on the
Поскольку графика (например, 511), соответствующая требуемому графическому определению 109a или 109b, еще не была визуализирована на графической панели 106, пользователь еще не имел шансов настроить какое-либо из свойств представления. Также найденная модель 410 представления определяет заданные по умолчанию свойства для графических элементов, согласно соответствующему графическому определению 109a или 109b, и механизм 412 настройки создает данные 301 настройки, которые не определяют никаких изменений представления. Таким образом, поскольку изменение размера для графического элемента 506 рассматривается для целей иллюстрации этого изменения "представления", эта специфическая настройка не сохранена на графике 511. Действительно, все свойства представления, указанные в извлеченной модели 410 представления, являются заданными по умолчанию свойствами для выбранного графического определения 305. Однако, поскольку семантическая модель 404 была модифицирована для семантического изменения (то есть, цвета) в графике 500, проиллюстрированном на фиг.5B, эта специфическая настройка сохраняется для графика 511.Since a graphic (e.g., 511) corresponding to the desired
Примеры, показанные на фиг.5A-5C и описанные выше, иллюстрируют вариант воплощения данного изобретения на высшем уровне. Действительно, цвет и размер графических элементов воплощают только два свойства, которые могут быть определены для графики, используя модели представления и семантическую модель в соответствии с данным изобретением. Как отмечено выше, любое другое свойство, связанное с видом или размещением графических элементов в графике, может составить свойство представления или семантическое свойство. Такие свойства включают, например, позицию графического элемента по отношению к другим графическим элементам в графике, масштабирование графического элемента по отношению к другим графическим элементам в графике, размер шрифта текстовых данных в графическом элементе, градус вращения графического элемента, z-порядок графического элемента по отношению к другим графическим элементам в графике и любое другое возможное форматирование и свойства размещения, которое может относиться к графическим элементам в графике или графике в целом.The examples shown in FIGS. 5A-5C and described above illustrate a top-level embodiment of the present invention. Indeed, the color and size of graphic elements embody only two properties that can be defined for graphics using presentation models and a semantic model in accordance with this invention. As noted above, any other property associated with the appearance or placement of graphic elements in a graphic can constitute a presentation property or a semantic property. Such properties include, for example, the position of the graphic element with respect to other graphic elements in the graphic, the scaling of the graphic element with respect to other graphic elements in the graphic, the font size of the text data in the graphic element, the degree of rotation of the graphic element, the z-order of the graphic element with respect to to other graphical elements in the graph and any other possible formatting and placement properties, which may relate to graphical elements in the graph or the graph as a whole.
Например, позиция графического элемента относительно других графических элементов может составлять представление или семантическое свойство, которое определено, соответственно, моделью представления или семантической моделью. В любом случае, прикладная компьютерная программа 100 для работы с графикой применяет настройки с помощью масштабирования x и y смещений, примененных к вновь позиционированному графическому элементу в ответ на добавление нового графического элемента к графике. Альтернативно, x и y смещения воплощают радиальное смещение, основанное на полярных координатах. В варианте воплощения движения позиции по отношению к графике, которая является прямоугольной по природе (например, квадрат, прямоугольник, и т.д.), применяются, основываясь на x и y смещениях, тогда как движения позиции по отношению к графике, которая является круговой по природе (например, овал, круг, и т.д.), применяются, основываясь на радиальном смещении.For example, the position of a graphic element relative to other graphic elements may constitute a representation or a semantic property, which is defined, respectively, by a representation model or a semantic model. In any case, the
И для радиальных и для линейных позиционных настроек, расстояние от точки, куда графический элемент был перемещен относительно его заданной по умолчанию позиции, сохраняется или в представлении или в семантической модели, в зависимости от того, являются ли позиционные изменения "представлением" или "семантическим" изменением. Также эти настройки поддерживаются с графикой и, если сохраняются как семантическое изменение, также для всей графики, соответствующей другим графическим определениям, даже после модификации графики(ов). В ответ на изменение размещения графики (например, добавляя или удаляя графический элемент), в которой графический элемент был перепозиционирован, прикладная компьютерная программа 100 для работы с графикой определяет новую позицию для предварительно перепозиционированного графического элемента, основываясь на сохраненном относительном изменении. Для линейных настроек этот процесс вовлекает использование смещения предварительно перепозиционированного графического элемента от другого графического элемента в графике. Для радиальных настроек этот процесс вовлекает использование радиуса, угла позиции формы и угла между графическими элементами.For both radial and linear positional settings, the distance from the point where the graphic was moved relative to its default position is stored in either the view or the semantic model, depending on whether the positional changes are “presentation” or “semantic” change. Also, these settings are supported with graphics and, if saved as a semantic change, also for all graphics corresponding to other graphic definitions, even after modification of the graphic (s). In response to a change in the placement of the graphics (for example, adding or removing a graphic) in which the graphic has been repositioned, the
Обратимся теперь к фиг.6, показывающей, в соответствии с вариантом воплощения данного изобретения, блок-схему, иллюстрирующую функциональные характеристики варианта воплощения процесса 600 для отображения графики, основываясь на пользовательских настройках. Для иллюстративных целей этот процесс 600 упомянут здесь как "процесс отображения" и описан со ссылкой к прикладной компьютерной программе для работы с графикой 100, проиллюстрированный на фиг.1-4. Также, процесс 600 отображения описан здесь согласно примерному варианту воплощения, как выполняемый в соответствии с компьютерной программой 100 для работы с графикой, и различные компоненты, описанные в связи с ним, также описаны со ссылкой на фиг.6, используя подобные номера ссылок и терминологию.Referring now to FIG. 6, showing, in accordance with an embodiment of the present invention, a flowchart illustrating the functional characteristics of an embodiment of a
Процесс 600 отображения выполняется, используя последовательность операций, начинающуюся с начальной операции 602 и заканчивающуюся конечной операцией 630. Начальная операция 602 инициализируется в ответ на действие пользователя, или другую прикладную программу, запускающую прикладную компьютерную программу 100 для работы с графикой для создания или редактирования графики 108, представляющей содержание 115, введенное в приложение 100. От начальной операции 602 последовательность операций переходит к операции 604 получения содержания.The
Операция 604 получения содержания получает содержание 115, которое пользователь или прикладная программа запрашивают для визуального представления в графике 108. В варианте воплощения это содержание 115 является текстовым содержанием, которое может или не может быть размещено по формату. Примерное текстовое содержание в соответствии с этим вариантом воплощения является структурированным списком. Также, в варианте воплощения, содержание 115, полученное первой операцией 604 получения, отображается пользователю через панель 104 содержания из интерфейса пользователя 102 для прикладной компьютерной программы 100 для работы с графикой. От операции 604 получения содержания последовательность операций переходит к операции 606 создания.The
Операция 606 создания создает модель 408 или 410 представления и семантическую модель 404 для использования с экземпляром прикладной компьютерной программы 100 для работы с графикой, запущенной при операции 602 начала. Созданная семантическая модель 410 определяет заданные по умолчанию семантические свойства, которые являются постоянными для всех возможных графических определений 109a и 109b. Созданная модель 408 или 410 представления определяет заданные по умолчанию свойства представления, определенные для выбранного графического определения 109a или 109b.Create
В соответствии с вариантом воплощения, выбранное графическое определение 109a или 109b, на котором создана модель 408 или 410 представления, основывается на заданном по умолчанию графическом определении, например, 109a или 109b, предопределенным для всех экземпляров прикладной компьютерной программы 100 для работы с графикой. В этом варианте воплощения прикладная компьютерная программа 100 для работы с графикой предварительно запрограммирована так, чтобы инициирование приложения 100 визуализировало выбор заданного по умолчанию графического определения 109a или 109b для использования пользователем до тех пор, пока пользователь не запрашивает переключатель графики на переключение к другому графическому определению 109a или 109b. В соответствии с альтернативным вариантом воплощения, прикладная компьютерная программа 100 для работы с графикой может показывать пользователю экран выбора (например, UI диалог), который позволяет пользователю выбирать определенное графическое определение 109a или 109b для визуализации начальной графики 108 в графической панели 106. Также, операция 606 создания создает модель 408 или 410 представления, основываясь на выбранном графическом определении 109a или 109b.According to an embodiment, the selected
После того как модель 408 или 410 представления, и семантическая модель 404 были созданы, последовательность операций переходит последовательно к операции 612 визуализации. Операция 612 визуализации визуализирует графику 108 на экране дисплея для просмотра и редактирования ее пользователем. Визуальные характеристики (то есть, размещение и вид графических элементов) графики 108 определяются операцией 612 визуализации, основываясь на спецификациях свойств в семантической модели 404 и модель 408 или 410 представления, созданных операцией 606 создания. Как описано выше, семантическая модель 404 используется не только для определения некоторых визуальных свойств, то есть, "семантических свойств", для графики 108, отображенной операцией 612 отображения, но всех графиков 108, принадлежащих всем графическим определениям 109a и 109b, которые могут быть визуализированы в прикладной компьютерной программе 100 для работы с графикой. Напротив, однако, модель 408 или 410 представления используется только для определения некоторых визуальных свойств, то есть "свойства представления", только для визуализируемой графики 108, и ни для какой другой. Действительно, графика 108, соответствующая другому графическому определению 109a или 109b, берет только те свойства представления, специфицированные в модели 408 или 410 представления, соответствующей этому графическому определению 109a или 109b. После того как графика 108 визуализирована на экране дисплея, последовательность операций переходит к первой операции 614 запроса.After the
Первая операция 614 запроса определяет, был ли вызов экземпляра прикладной компьютерной программы 100 для работы с графикой для запуска операции 602 начала закончен, показывая, таким образом, что никакой дальнейший ввод относительно содержания, настроек или выбора графических определений 109a и 109b не будет получен, если прикладная компьютерная программа 100 для работы с графикой впоследствии не будет вызвана для создания нового экземпляра.The
Если экземпляр был закончен, последовательность операций заканчивается на операции 630 окончания. Иначе, операция переходит по ветви "Нет" ко второй операции 616 запроса. Вторая операция 616 запроса определяет, была ли графика 108, визуалируемая в настоящее время в графической панели 106, отредактирована (то есть, настроена) любым способом. Если так, то вторая операция 616 запроса выполняет переход операционного потока "Да" к третьей операции 618 запроса. Иначе, вторая операция 616 запроса выполняет переход последовательности операций "Нет" к четвертой операции 624 запроса.If the instance was completed, the flow ends at
Третья операция 618 запроса исследует настройку, обнаруженную второй операцией 616 запроса, для определения того, касается ли настройка изменения представления или семантического изменения. Как неоднократно отмечалось выше, изменение представления является изменением, которое предназначено только для того, чтобы затронуть определенное графическое определение 109a или 109b, которому соответствует графика 108, визуализируемая в настоящее время. Напротив, семантическое изменение является изменением, которое предназначено для того, чтобы затронуть все графические определения 109a и 109b, которые могут быть выбраны прикладной компьютерной программой 100 для работы с графикой. Любое свойство, которое может относится к графике (например, 108), или ее графическим элементам, может быть помечено или как свойство представления, и таким образом быть подвергнуто изменениям представления, или семантическим свойством, и таким образом быть подвергнуто семантическим изменениям. Реализация является вопросом выбора, и только для иллюстративных целей размер графического элемента описывается здесь как примерное свойство представления, а цвет графического элемента описывается здесь как примерное семантическое свойство.The
Если третья операция 618 запроса решает, что настройка является изменением представления, последовательность операций переходит по "P" к первой операции 620 модификации. Первая операция 620 модификации обновляет найденную модель 408 или 410 представления настройкой. С другой стороны, если третья операция 618 запроса решает, что настройка является семантическим изменением, последовательность операций ветвится по "S" ко второй операции 622 модификации. Вторая операция 622 модификации обновляет семантическую модель 404, созданную операцией 606 создания, настройкой. И от первой операции 620 модификации и от второй операции 622 модификации, последовательность операций переходит назад к операции 612 визуализации, которая визуализирует графику 108, основываясь на обновленной модели (то есть, или модели представления или семантической модели). Последовательность операций тогда продолжается так, как было предварительно описано.If the
В обстоятельствах, когда вторые операции 616 запроса переводят последовательность операций по ветке "Нет", вызывается четвертая операция 624 запроса. Четвертая операция 624 запроса определяет, выбрал ли пользователь или другая прикладная программа новое графическое определение 109a или 109b для отображения на графической панели 106. Такой выбор интерпретируется, поскольку пользователь или другая прикладная программа желает просмотреть содержание 115, полученное в операцию 604 получения, основываясь на различных графических определениях 109a или 109b. Если четвертая операция 624 запроса решает, что такой выбор был сделан, последовательность операций переходит к операции 626 переключения.In circumstances where the
Операция 626 переключения создает модель 408 или 410 представления (или извлекает, если эта модель представления была уже создана), связанную с новым выбранным графическим определением 109a или 109b, а затем передает последовательность операций назад к операции 612 визуализации. Операция 612 визуализации тогда визуализирует графику 108, основываясь на текущей семантической модели 404 (то есть, либо семантической модели, созданной операцией 606 создания, либо ее модифицированной версии) и модели 408 или 410 представления, созданной или извлеченной при операции 626 переключения.
Однако если четвертая операция 624 запроса решает, что выбор нового графического определения 109a или 109b не произошел, поток операции переходит по "Нет" к пятой операции 627 запроса. Пятая операция 627 запроса определяет, имеют ли пользователь или другая прикладная программа входную информацию, приводящую к изменению в структуре содержания 115. Такое изменение в структуре может следовать из добавления или удаления содержания, которое было сделано (если удалено), или будет сделано (если добавлено), соответствующего графическому элементу в графике 108. Такое перемещение или удаление могут включать изменения форматирования, которые приводят к добавлению или удалению графических элементов. Если пятая операция 627 запроса обнаруживает изменение в содержании 115, которое приведет к структурному изменению в графике 108, последовательность операций переходит по "Да" к третьей операции 628 модификации. Иначе, последовательность операций выполняет переход по "Нет" к первой операции 614 запроса и продолжается, как описано ранее.However, if the
Третья операция 628 модификации обновляет и модель 408 или 410 представления, используемую в настоящее время (то есть, или модель представления, созданную операцией 606 создания, или модель представления, созданную или извлеченную операцией 626 переключения), и семантическую модель 404 для отражения изменения в содержании 115. От третьей операции 628 модификации последовательность операций переходит к операции 612 визуализации, которая визуализирует графику 108, основываясь на обновленной модели 408 или 410 представления и обновленной семантической модели 404. От операции 612 визуализации последовательность операций продолжается так, как было описано ранее.The
Хотя данное изобретение было описано на языке, определенном для структурных особенностей, методологических действий, и читаемых компьютерных носителей, содержащих такие действия, должно быть понятно, что данное изобретение, определенное в приложенной формуле изобретения не обязательно ограничено определенной структурой, действиями, или описанными носителями. Любой специалист в данной области техники распознает другие варианты воплощения или усовершенствования, которые находятся в пределах объема и духа данного изобретения. Например, последовательность выполнения операций в процессе 600 отображения показаны в соответствии с примерным вариантом воплощения. В соответствии с другими вариантами воплощения последовательность выполнения этих операций может быть изменена. Например, операция 606 создания может быть выполнена в промежуток времени до операции 604 извлечения содержания, не отступая от объема данного изобретения.Although the invention has been described in a language specific to structural features, methodological actions, and readable computer media containing such actions, it should be understood that the invention, as defined in the appended claims, is not necessarily limited to a specific structure, actions, or media described. Any person skilled in the art will recognize other embodiments or improvements that are within the scope and spirit of the present invention. For example, a flowchart in a
Дополнительно, в то время как описана корреляция 1:1 между моделями представления (например, 408 и 410) и графическими определениями (например, 109a и 109b), более чем одна модель представления (например, 408 и 410) может быть связана с единственным графическим определением 109a или 109b в соответствии с вариантом воплощения данного изобретения. Кроме того, должно быть понятно, что UI 102 может быть создан для того, чтобы иметь менее чем или более чем три панели (например, 104, 105 и 106). Действительно, функциональные возможности на любой из этих панелей (например, 104, 105 и 106) могут быть альтернативно или дополнительно обеспечены в других типах компонентов графического интерфейса пользователя, таких как, например, инструментальные панели, эскизы, строки меню, командные строки, диалоговые окна, и т.д.Additionally, while a 1: 1 correlation between presentation models (e.g., 408 and 410) and graphic definitions (e.g., 109a and 109b) is described, more than one presentation model (e.g., 408 and 410) may be associated with a single graphic by
Помимо этого, хотя модели представления (например, 408, 410) описаны здесь как являющиеся определенным для каждого графического определения, например, 109a и 109b, другие варианты воплощения, рассмотренные в пределах данного изобретения, касаются моделей представления (например, 408, 410), сохраненных для множества графических определений 306. В этих вариантах воплощения графические определения, например, 109a и 109b, имеющие подобные характеристики, группируются в графических классификациях, и модели представления являются определенными для этих классификаций, а не индивидуально к типам, составляющим классификации. Например, классификация может группировать все графические определения, например, 109a и 109b, имеющие графические элементы, предназначенные для позиционного движения радиальным способом, чтобы сохранить эти движения для всех графических определений из этой классификации. Аналогично, другая классификация может группировать все графические определения, например, 109a и 109b, предназначенные для позиционного движения относительно системы координат x-y.In addition, although presentation models (e.g., 408, 410) are described herein as being specific to each graphic definition, e.g., 109a and 109b, other embodiments contemplated within the scope of the present invention relate to presentation models (e.g., 408, 410), stored for the plurality of graphic definitions 306. In these embodiments, graphic definitions, for example 109a and 109b, having similar characteristics, are grouped in graphic classifications, and presentation models are specific to these classifications. fication rather than individually to the types making up the classification. For example, a classification can group all graphic definitions, for example, 109a and 109b, having graphic elements intended for radial positional movement in order to preserve these movements for all graphic definitions from this classification. Similarly, another classification may group all graphical definitions, for example, 109a and 109b, intended for positional movement relative to the x-y coordinate system.
Claims (15)
получают текст содержания на панели содержания, причем текст содержания предназначен для визуального представления в графической иерархической диаграмме;
получают выбор первого графического определения для визуализации графической иерархической диаграммы из панели галереи, причем первое графическое определение описывает первый графический элемент;
выполняют визуализацию графической иерархической диаграммы на графической панели на дисплейном устройстве, основываясь на тексте содержания и первом графическом определении, причем графическая иерархическая диаграмма содержит первый графический элемент, описанный первым графическим определением, при этом первый графический элемент включает в себя текст содержания, полученный на панели содержания; и
получают первую настройку для текста содержания на панели содержания и, в ответ на первую настройку для текста содержания:
обновляют текст в первом графическом элементе графической иерархической диаграммы таким образом, что первый графический элемент включает в себя обновленный текст содержания.1. A computer-implemented method for visualizing a graphical hierarchical chart for display by a display device, the method comprising the steps of:
receive the text of the content on the content panel, and the text of the content is intended for visual presentation in a graphical hierarchical diagram;
obtaining a selection of a first graphic definition for visualizing a graphical hierarchical diagram from a gallery panel, wherein the first graphical definition describes a first graphical element;
visualizing the graphical hierarchical diagram on the graphical panel on the display device based on the text of the content and the first graphical definition, wherein the graphical hierarchical diagram contains a first graphical element described by the first graphical definition, the first graphical element including the text of the content obtained on the contents panel ; and
get the first setting for the content text in the content panel and, in response to the first setting for the content text:
update the text in the first graphic element of the graph hierarchical chart so that the first graphic element includes updated text content.
определяют, с помощью семантической модели, семантические свойства для всех возможных графических определений, причем упомянутая первая настройка относится к первому семантическому свойству; и
идентифицируют первую настройку, ссылаясь на семантическую модель.2. The method according to claim 1, in which the text of the content has elements and in which the aforementioned selected first graphic definition is one of many possible graphic definitions, the method further comprises the steps of
determine, with the help of a semantic model, semantic properties for all possible graphic definitions, wherein said first setting refers to the first semantic property; and
identify the first setting, referring to the semantic model.
получают через интерфейс пользователя новую настройку для графической иерархической диаграммы, причем новая настройка относится ко второму семантическому свойству; и
обновляют второе семантическое свойство в семантической модели с тем, чтобы отразить новую настройку.3. The method according to claim 2, in which the display device comprises a display screen on which the user is presented with a user interface, the graphical hierarchical diagram being displayed on said user interface, the method further comprising the steps of:
receive through the user interface a new setting for the graphical hierarchical diagram, and the new setting relates to the second semantic property; and
update the second semantic property in the semantic model in order to reflect the new setting.
получают запрос на визуальное представление текста содержания, используя новое графическое определение; и
создают новую графическую иерархическую диаграмму, основываясь на новом графическом определении и на обновленной семантической модели таким образом, что новая графическая иерархическая диаграмма отображается как с первой настройкой, так и с новой настройкой.4. The method according to claim 3, further comprising stages in which:
receive a request for a visual representation of the text of the content using a new graphic definition; and
create a new graphical hierarchical diagram based on the new graphical definition and on the updated semantic model so that the new graphical hierarchical diagram is displayed with both the first setting and the new setting.
процессор для исполнения компьютерно-исполняемых инструкций; и
компьютерные запоминающие носители, хранящие компьютерно-исполняемые инструкции, которые, при их исполнении процессором, обеспечивают предоставление упомянутым процессором:
множества возможных графических определений, причем каждое из упомянутых возможных графических определений описывает свойства по умолчанию для связанной графики, выполненной с возможностью представления содержания;
механизм настройки, выполненный с возможностью создания первой графической иерархической диаграммы, соответствующей первому графическому определению, и второй графической иерархической диаграммы, соответствующей второму графическому определению, таким образом, что первая графическая иерархическая диаграмма и вторая графическая иерархическая диаграмма имеют подобные свойства; и
интерфейс пользователя, представляющий графическое представление для каждого из множества возможных графических определений для выбора пользователем, при этом интерфейс пользователя включает в себя:
панель содержания для получения ввода от пользователя и отображения содержания для редактирования пользователем;
графическую панель, обеспечивающую возможность визуального отображения и редактирования графического содержания;
панель галереи, представляющую множество возможных графических определений;
при этом интерфейс пользователя выполнен с возможностью:
выполнения, в ответ на выбор либо графического представления, связанного с первым графическим определением или вторым графическим определением, отображения первой графической иерархической диаграммы либо второй графической иерархической диаграммы, соответственно, на экране дисплея, как это определено механизмом настройки; и
выполнения, в ответ на получение первой настройки для содержания на панели содержания, обновления текста в упомянутой графической иерархической диаграмме.7. A system for visualizing graphics for display on a display screen, the system comprising:
a processor for executing computer-executable instructions; and
computer storage media storing computer-executable instructions, which, when executed by the processor, provide the said processor with:
a plurality of possible graphic definitions, each of which mentioned possible graphic definitions describes default properties for linked graphics configured to present content;
a tuning mechanism configured to create a first graphical hierarchical diagram corresponding to the first graphical definition and a second graphical hierarchical diagram corresponding to the second graphical definition, such that the first graphical hierarchical diagram and the second graphical hierarchical diagram have similar properties; and
a user interface representing a graphical representation for each of the many possible graphical definitions for selection by the user, the user interface includes:
a content panel for receiving input from a user and displaying content for editing by a user;
a graphic panel that provides the ability to visually display and edit graphic content;
a gallery panel representing the many possible graphic definitions;
wherein the user interface is configured to:
performing, in response to the choice of either a graphical representation associated with the first graphical definition or the second graphical definition, displaying the first graphical hierarchical diagram or the second graphical hierarchical diagram, respectively, on the display screen, as determined by the setting mechanism; and
performing, in response to receiving the first setting for the content in the content pane, updating the text in said graphical hierarchical diagram.
модель представления отвечает на выбор первого графического определения на интерфейсе пользователя путем разрешения механизму настройки выполнить настройку первой графической иерархической диаграммы, причем механизм настройки использует семантическую модель и модель представления, определенные для первого графического определения, для определения первой графической иерархической диаграммы как имеющей семантические свойства, подобные всем возможным графическим определениям и свойствам представления, определенным для первого графического определения.8. The system according to claim 7, in which the computer-executable instructions, when executed by the processor, further provide for the presentation processor to be presented by the processor, and
the presentation model responds to the selection of the first graphical definition on the user interface by allowing the configuration mechanism to configure the first graphical hierarchical diagram, wherein the configuration mechanism uses the semantic model and the presentation model defined for the first graphical definition to define the first graphical hierarchical diagram as having semantic properties like all possible graphical definitions and presentation properties defined for the first r aficheskogo definition.
панель галереи, отображающую для выбора пользователем графические представления для каждого из множества возможных графических определений; и
графическую панель, отображающую для редактирования пользователем первую графическую иерархическую диаграмму в ответ на выбор первого графического определения из панели галереи.9. The system according to claim 7, in which the user interface contains:
a gallery panel displaying graphical representations for a user to select for each of a plurality of possible graphical definitions; and
a graphic panel that displays the first graphical hierarchical diagram for editing by the user in response to selecting the first graphical definition from the gallery panel.
получают текст содержания, предназначенный для визуального представления в графической диаграмме на панели содержания;
получают выбор первого графического определения для визуализации графической диаграммы из панели галереи, причем первое графическое определение описывает первый графический элемент;
выполняют визуализацию графической диаграммы на графической панели на дисплейном устройстве, основываясь на тексте содержания и первом графическом определении, причем графическая диаграмма содержит текст содержания в первом графическом элементе; и
в ответ на получение изменения текста содержания, обновляют текст в первом графическом элементе графической диаграммы.12. A computer-implemented method for visualizing a graphical chart for display by a display device, the method comprising the steps of:
receive a text of the content intended for visual presentation in a graphical diagram on the content panel;
obtaining a selection of a first graphical definition for visualizing a graphical chart from a gallery panel, wherein the first graphical definition describes a first graphical element;
visualizing a graphical chart on a graphical panel on a display device based on the text of the content and the first graphical definition, wherein the graphical chart contains the text of the content in the first graphical element; and
in response to receiving a change in the text of the content, the text in the first graphic element of the graphic diagram is updated.
Applications Claiming Priority (4)
| Application Number | Priority Date | Filing Date | Title |
|---|---|---|---|
| US10/957,103 US8510657B2 (en) | 2004-09-30 | 2004-09-30 | Editing the text of an arbitrary graphic via a hierarchical list |
| US10/957,103 | 2004-09-30 | ||
| US11/013,655 | 2004-12-15 | ||
| US11/013,655 US8134575B2 (en) | 2004-09-30 | 2004-12-15 | Maintaining graphical presentations based on user customizations |
Related Parent Applications (1)
| Application Number | Title | Priority Date | Filing Date |
|---|---|---|---|
| RU2005130349/09A Division RU2389069C2 (en) | 2004-09-30 | 2005-09-29 | Graphical presentation support based on user settings |
Publications (2)
| Publication Number | Publication Date |
|---|---|
| RU2010100807A RU2010100807A (en) | 2011-07-20 |
| RU2524473C2 true RU2524473C2 (en) | 2014-07-27 |
Family
ID=35447284
Family Applications (2)
| Application Number | Title | Priority Date | Filing Date |
|---|---|---|---|
| RU2010100807/08A RU2524473C2 (en) | 2004-09-30 | 2005-09-29 | Graphic representation support based on user settings |
| RU2005130349/09A RU2389069C2 (en) | 2004-09-30 | 2005-09-29 | Graphical presentation support based on user settings |
Family Applications After (1)
| Application Number | Title | Priority Date | Filing Date |
|---|---|---|---|
| RU2005130349/09A RU2389069C2 (en) | 2004-09-30 | 2005-09-29 | Graphical presentation support based on user settings |
Country Status (12)
| Country | Link |
|---|---|
| US (4) | US8134575B2 (en) |
| EP (1) | EP1643451A1 (en) |
| JP (1) | JP4860218B2 (en) |
| KR (1) | KR101183351B1 (en) |
| CN (1) | CN102044083B (en) |
| AU (1) | AU2005203711B2 (en) |
| BR (1) | BRPI0503878B1 (en) |
| CA (1) | CA2517399C (en) |
| MX (1) | MXPA05009277A (en) |
| MY (1) | MY150137A (en) |
| RU (2) | RU2524473C2 (en) |
| TW (1) | TWI410887B (en) |
Cited By (2)
| Publication number | Priority date | Publication date | Assignee | Title |
|---|---|---|---|---|
| RU2749794C1 (en) * | 2017-10-30 | 2021-06-17 | Хуавэй Текнолоджиз Ко., Лтд. | Apparatus and method for facilitation of repeat performance of previous task based on context of mobile apparatus |
| RU2774320C2 (en) * | 2017-10-30 | 2022-06-17 | Хуавэй Текнолоджиз Ко., Лтд. | Device and method for simplifying the re-execution of a previously performed task based on the context of a mobile device |
Families Citing this family (70)
| Publication number | Priority date | Publication date | Assignee | Title |
|---|---|---|---|---|
| US20080143725A1 (en) * | 2004-02-09 | 2008-06-19 | Smart Technologies Inc. | Connected and overlapped shapes enhancements |
| US8510657B2 (en) | 2004-09-30 | 2013-08-13 | Microsoft Corporation | Editing the text of an arbitrary graphic via a hierarchical list |
| US7348982B2 (en) * | 2004-09-30 | 2008-03-25 | Microsoft Corporation | Method, system, and computer-readable medium for creating and laying out a graphic within an application program |
| US8134575B2 (en) | 2004-09-30 | 2012-03-13 | Microsoft Corporation | Maintaining graphical presentations based on user customizations |
| US7567565B2 (en) | 2005-02-01 | 2009-07-28 | Time Warner Cable Inc. | Method and apparatus for network bandwidth conservation |
| US20070157117A1 (en) * | 2005-12-20 | 2007-07-05 | Nokia Corporation | Apparatus, method and computer program product providing user interface configurable command placement logic |
| US9170987B2 (en) * | 2006-01-18 | 2015-10-27 | Microsoft Technology Licensing, Llc | Style extensibility applied to a group of shapes by editing text files |
| US8438486B2 (en) * | 2006-02-09 | 2013-05-07 | Microsoft Corporation | Automatically converting text to business graphics |
| US8170065B2 (en) | 2006-02-27 | 2012-05-01 | Time Warner Cable Inc. | Methods and apparatus for selecting digital access technology for programming and data delivery |
| US8458753B2 (en) | 2006-02-27 | 2013-06-04 | Time Warner Cable Enterprises Llc | Methods and apparatus for device capabilities discovery and utilization within a content-based network |
| US7589750B1 (en) * | 2006-03-15 | 2009-09-15 | Adobe Systems, Inc. | Methods and apparatus for arranging graphical objects |
| US7743079B1 (en) * | 2006-07-31 | 2010-06-22 | Microsoft Corporation | Managing data across a semantic data view and a presentation data view |
| US8006179B2 (en) * | 2006-07-31 | 2011-08-23 | Microsoft Corporation | Wrapping nodes in a drawing canvas |
| US20080235746A1 (en) | 2007-03-20 | 2008-09-25 | Michael James Peters | Methods and apparatus for content delivery and replacement in a network |
| US7770200B2 (en) * | 2007-07-24 | 2010-08-03 | Time Warner Cable Inc. | Methods and apparatus for format selection for network optimization |
| US7802286B2 (en) * | 2007-07-24 | 2010-09-21 | Time Warner Cable Inc. | Methods and apparatus for format selection for network optimization |
| US8561116B2 (en) | 2007-09-26 | 2013-10-15 | Charles A. Hasek | Methods and apparatus for content caching in a video network |
| US8099757B2 (en) | 2007-10-15 | 2012-01-17 | Time Warner Cable Inc. | Methods and apparatus for revenue-optimized delivery of content in a network |
| US8813143B2 (en) | 2008-02-26 | 2014-08-19 | Time Warner Enterprises LLC | Methods and apparatus for business-based network resource allocation |
| US8411085B2 (en) * | 2008-06-27 | 2013-04-02 | Microsoft Corporation | Constructing view compositions for domain-specific environments |
| US20090322739A1 (en) * | 2008-06-27 | 2009-12-31 | Microsoft Corporation | Visual Interactions with Analytics |
| US8620635B2 (en) * | 2008-06-27 | 2013-12-31 | Microsoft Corporation | Composition of analytics models |
| US9866609B2 (en) | 2009-06-08 | 2018-01-09 | Time Warner Cable Enterprises Llc | Methods and apparatus for premises content distribution |
| US20100318898A1 (en) * | 2009-06-11 | 2010-12-16 | Hewlett-Packard Development Company, L.P. | Rendering definitions |
| US20100325564A1 (en) * | 2009-06-19 | 2010-12-23 | Microsoft Corporation | Charts in virtual environments |
| US8692826B2 (en) * | 2009-06-19 | 2014-04-08 | Brian C. Beckman | Solver-based visualization framework |
| US9330503B2 (en) | 2009-06-19 | 2016-05-03 | Microsoft Technology Licensing, Llc | Presaging and surfacing interactivity within data visualizations |
| US8866818B2 (en) * | 2009-06-19 | 2014-10-21 | Microsoft Corporation | Composing shapes and data series in geometries |
| US8788574B2 (en) * | 2009-06-19 | 2014-07-22 | Microsoft Corporation | Data-driven visualization of pseudo-infinite scenes |
| US8531451B2 (en) * | 2009-06-19 | 2013-09-10 | Microsoft Corporation | Data-driven visualization transformation |
| US8493406B2 (en) * | 2009-06-19 | 2013-07-23 | Microsoft Corporation | Creating new charts and data visualizations |
| US9513403B2 (en) * | 2009-07-27 | 2016-12-06 | Peck Labs, Inc | Methods and systems for displaying customized icons |
| US8799325B2 (en) * | 2010-03-12 | 2014-08-05 | Microsoft Corporation | Reordering nodes in a hierarchical structure |
| US9043296B2 (en) | 2010-07-30 | 2015-05-26 | Microsoft Technology Licensing, Llc | System of providing suggestions based on accessible and contextual information |
| CA2714228C (en) * | 2010-09-16 | 2011-10-11 | Ibm Canada Limited - Ibm Canada Limitee | Complex input to image transformation for distribution |
| JP5724344B2 (en) * | 2010-12-06 | 2015-05-27 | 株式会社リコー | Image forming apparatus, customization control method, and customization control program |
| US20120169739A1 (en) * | 2010-12-29 | 2012-07-05 | Thomas Meder | 360° multidimensional analytical visualizations |
| US8786620B2 (en) * | 2011-11-14 | 2014-07-22 | Microsoft Corporation | Discarding idle graphical display components from memory and processing |
| US11188509B2 (en) | 2012-02-20 | 2021-11-30 | Wix.Com Ltd. | System and method for generating a visual data structure associated with business information based on a hierarchy of components |
| US9996566B2 (en) * | 2012-02-20 | 2018-06-12 | Wix.Com Ltd. | Visual design system for generating a visual data structure associated with a semantic composition based on a hierarchy of components |
| US20140282188A1 (en) * | 2013-03-15 | 2014-09-18 | Moresteam Development Llc | Computer graphical user interface, system, and method |
| USD742893S1 (en) * | 2013-06-09 | 2015-11-10 | Apple Inc. | Display screen or portion thereof with graphical user interface |
| USD737833S1 (en) | 2013-06-09 | 2015-09-01 | Apple Inc. | Display screen or portion thereof with graphical user interface |
| US9619128B2 (en) | 2013-07-01 | 2017-04-11 | Microsoft Technology Licensing, Llc | Dynamic presentation prototyping and generation |
| US20150070358A1 (en) * | 2013-09-12 | 2015-03-12 | Marcello Judah Sachs | Thotput |
| WO2015042901A1 (en) | 2013-09-29 | 2015-04-02 | Microsoft Technology Licensing, Llc | Media presentation effects |
| US9349142B2 (en) | 2013-10-09 | 2016-05-24 | Ebay Inc. | Reflow of data presentation using tracking data |
| US10157593B2 (en) | 2014-02-24 | 2018-12-18 | Microsoft Technology Licensing, Llc | Cross-platform rendering engine |
| KR102294134B1 (en) * | 2014-10-30 | 2021-08-25 | 마이크로소프트 테크놀로지 라이센싱, 엘엘씨 | Authoring tools for synthesizing hybrid slide-canvas presentations |
| US9971334B2 (en) | 2015-04-09 | 2018-05-15 | Kwik Mark, Inc. | Inscription positioning apparatuses, systems, and methods of making and using the same |
| RU2606309C2 (en) * | 2015-06-09 | 2017-01-10 | Общество С Ограниченной Ответственностью "Яндекс" | Method to create annotated search index and server used therein |
| USD788161S1 (en) * | 2015-09-08 | 2017-05-30 | Apple Inc. | Display screen or portion thereof with graphical user interface |
| US9851882B2 (en) * | 2015-12-27 | 2017-12-26 | Thunder Power New Energy Vehicle Development Company Limited | Fully designable vehicle information panel interface |
| US10687115B2 (en) | 2016-06-01 | 2020-06-16 | Time Warner Cable Enterprises Llc | Cloud-based digital content recorder apparatus and methods |
| USD825612S1 (en) | 2016-07-27 | 2018-08-14 | Apple Inc. | Display screen or portion thereof with graphical user interface |
| USD962954S1 (en) | 2016-09-06 | 2022-09-06 | Apple Inc. | Display screen or portion thereof with graphical user interface |
| USD841677S1 (en) | 2017-06-04 | 2019-02-26 | Apple Inc. | Display screen or portion thereof with graphical user interface |
| US10984195B2 (en) * | 2017-06-23 | 2021-04-20 | General Electric Company | Methods and systems for using implied properties to make a controlled-english modelling language more natural |
| USD873284S1 (en) | 2017-09-09 | 2020-01-21 | Apple Inc. | Electronic device with graphical user interface |
| USD987669S1 (en) | 2017-09-11 | 2023-05-30 | Apple Inc. | Electronic device with graphical user interface |
| US10409895B2 (en) * | 2017-10-17 | 2019-09-10 | Qualtrics, Llc | Optimizing a document based on dynamically updating content |
| CA2990205A1 (en) * | 2017-12-28 | 2019-06-28 | Techinsights Inc. | Reverse engineering data analysis system, and integrated circuit component data processing tool and method thereof |
| US10939142B2 (en) | 2018-02-27 | 2021-03-02 | Charter Communications Operating, Llc | Apparatus and methods for content storage, distribution and security within a content distribution network |
| USD880495S1 (en) | 2018-06-03 | 2020-04-07 | Apple Inc. | Electronic device with graphical user interface |
| USD962244S1 (en) | 2018-10-28 | 2022-08-30 | Apple Inc. | Electronic device with graphical user interface |
| US20200320606A1 (en) * | 2019-04-02 | 2020-10-08 | Material Technologies, Llc | Electronic palette apparatus and methods |
| USD913315S1 (en) | 2019-05-31 | 2021-03-16 | Apple Inc. | Electronic device with graphical user interface |
| USD924912S1 (en) | 2019-09-09 | 2021-07-13 | Apple Inc. | Display screen or portion thereof with graphical user interface |
| US11520842B2 (en) | 2020-07-16 | 2022-12-06 | International Business Machines Corporation | Figure driven search query |
| US11200715B1 (en) | 2021-04-14 | 2021-12-14 | International Business Machines Corporation | Automated creation and design of presentation charts |
Citations (2)
| Publication number | Priority date | Publication date | Assignee | Title |
|---|---|---|---|---|
| EP1111543A2 (en) * | 1999-12-22 | 2001-06-27 | Adobe Systems, Inc. | Method and apparatus for painting groups of objects |
| RU2218602C2 (en) * | 2001-11-08 | 2003-12-10 | Карев Павел Викторович | Method for color-code display of variable multiple-parameter states of system or process |
Family Cites Families (148)
| Publication number | Priority date | Publication date | Assignee | Title |
|---|---|---|---|---|
| EP0057688A1 (en) | 1980-08-13 | 1982-08-18 | Comshare Incorporated | A machine for generating graphic charts |
| US4531150A (en) | 1982-11-05 | 1985-07-23 | Konishiroku Photo Industry Co., Ltd. | Image display system |
| US4686522A (en) | 1985-02-19 | 1987-08-11 | International Business Machines Corporation | Method of editing graphic objects in an interactive draw graphic system using implicit editing actions |
| US5337402A (en) | 1986-06-12 | 1994-08-09 | Keiji Kitagawa | Graphic data processing apparatus using displayed graphics for application program selection |
| JPS6438866A (en) | 1987-08-05 | 1989-02-09 | Hitachi Ltd | Document editing device |
| US5214755A (en) | 1989-04-25 | 1993-05-25 | Microsoft Corporation | Document processing method and system |
| JPH03177964A (en) | 1989-12-07 | 1991-08-01 | Toshiba Corp | Document arranging device |
| JP3093247B2 (en) | 1990-09-21 | 2000-10-03 | 株式会社東芝 | Presentation support environment system |
| US5649216A (en) | 1991-05-17 | 1997-07-15 | Joseph S. Sieber | Method and apparatus for automated layout of text and graphic elements |
| CA2048039A1 (en) | 1991-07-19 | 1993-01-20 | Steven Derose | Data processing system and method for generating a representation for and random access rendering of electronic documents |
| US5903454A (en) | 1991-12-23 | 1999-05-11 | Hoffberg; Linda Irene | Human-factored interface corporating adaptive pattern recognition based controller apparatus |
| US5404439A (en) * | 1992-04-15 | 1995-04-04 | Xerox Corporation | Time-space object containment for graphical user interface |
| US5426729A (en) | 1992-06-24 | 1995-06-20 | Microsoft Corporation | Method and system for nonuniformly adjusting a predefined shape |
| JPH08506670A (en) | 1993-01-22 | 1996-07-16 | タリジェント インコーポレイテッド | Flexible network system |
| JP2620576B2 (en) | 1993-04-15 | 1997-06-18 | インターナショナル・ビジネス・マシーンズ・コーポレイション | Method and system for adjusting a graphical user interface according to a font requested by a user |
| ATE190149T1 (en) | 1993-04-30 | 2000-03-15 | Ibm | AREA LAYOUT IN A VIEW ON A GRAPHIC DISPLAY SCREEN |
| US5909220A (en) | 1993-05-10 | 1999-06-01 | Sandow; Robin | Interactive computerized image coloring systems and methods for processing combinations of color with automated subroutines and color standardization for diverse color systems |
| US5479593A (en) | 1993-06-21 | 1995-12-26 | Electronic Data Systems Corporation | System and method for improved solving of equations employed during parametric geometric modeling |
| US5535134A (en) | 1994-06-03 | 1996-07-09 | International Business Machines Corporation | Object placement aid |
| US5596691A (en) | 1994-06-15 | 1997-01-21 | Claris Corporation | Computer system and method for manipulating the display of drawings |
| WO1996013006A1 (en) * | 1994-10-20 | 1996-05-02 | Mark Alan Zimmer | Digital mark-making method |
| US5748964A (en) | 1994-12-20 | 1998-05-05 | Sun Microsystems, Inc. | Bytecode program interpreter apparatus and method with pre-verification of data type restrictions |
| US5669006A (en) | 1995-02-23 | 1997-09-16 | International Business Machines Corporation | Method for automatically obtaining spatial layout for multimedia presentations |
| US5619631A (en) | 1995-06-07 | 1997-04-08 | Binaryblitz | Method and apparatus for data alteration by manipulation of representational graphs |
| US5673401A (en) | 1995-07-31 | 1997-09-30 | Microsoft Corporation | Systems and methods for a customizable sprite-based graphical user interface |
| US5872867A (en) | 1995-08-04 | 1999-02-16 | Sarnoff Corporation | Method and apparatus for generating image textures |
| US5999189A (en) | 1995-08-04 | 1999-12-07 | Microsoft Corporation | Image compression to reduce pixel and texture memory requirements in a real-time image generator |
| JPH09109351A (en) | 1995-10-16 | 1997-04-28 | Toppan Printing Co Ltd | Display information layout apparatus |
| US7124359B2 (en) | 1996-01-11 | 2006-10-17 | Canon Kabushiki Kaisha | Image edit device adapted to rapidly lay-out photographs into templates with means for preview and correction by user |
| US6173286B1 (en) | 1996-02-29 | 2001-01-09 | Nth Degree Software, Inc. | Computer-implemented optimization of publication layouts |
| US5818447A (en) | 1996-06-06 | 1998-10-06 | Microsoft Corporation | System and method for in-place editing of an electronic mail message using a separate program |
| US6057858A (en) | 1996-08-07 | 2000-05-02 | Desrosiers; John J. | Multiple media fonts |
| US5956737A (en) | 1996-09-09 | 1999-09-21 | Design Intelligence, Inc. | Design engine for fitting content to a medium |
| US5903902A (en) * | 1996-09-09 | 1999-05-11 | Design Intelligence, Inc. | Design engine with tree and component structure |
| DE69714598T2 (en) | 1996-09-09 | 2003-03-27 | Microsoft Corp | AUTOMATICALLY ARRANGING AND FORMATTING CONTENT FOR A DESIGN ON A MEDIUM |
| US5973692A (en) | 1997-03-10 | 1999-10-26 | Knowlton; Kenneth Charles | System for the capture and indexing of graphical representations of files, information sources and the like |
| US6061659A (en) | 1997-06-03 | 2000-05-09 | Digital Marketing Communications, Inc. | System and method for integrating a message into a graphical environment |
| US6288726B1 (en) | 1997-06-27 | 2001-09-11 | Microsoft Corporation | Method for rendering glyphs using a layout services library |
| US6321243B1 (en) | 1997-06-27 | 2001-11-20 | Microsoft Corporation | Laying out a paragraph by defining all the characters as a single text run by substituting, and then positioning the glyphs |
| US6774899B1 (en) | 1997-09-18 | 2004-08-10 | Mitsubishi Electric Research Laboratories, Inc. | Drawing graphs using user selectable visual oragnization features and/or other user controlled constraints |
| US5956043A (en) | 1997-09-18 | 1999-09-21 | Novell, Inc. | Textured tile rotation system and method |
| AU761202B2 (en) | 1997-09-22 | 2003-05-29 | Sony Corporation | Generation of a bit stream containing binary image/audio data that is multiplexed with a code defining an object in ascii format |
| US6289502B1 (en) | 1997-09-26 | 2001-09-11 | Massachusetts Institute Of Technology | Model-based software design and validation |
| US6204859B1 (en) | 1997-10-15 | 2001-03-20 | Digital Equipment Corporation | Method and apparatus for compositing colors of images with memory constraints for storing pixel data |
| KR100243385B1 (en) | 1997-10-28 | 2000-02-01 | 정선종 | Multimedia presentation working method |
| US6072480A (en) * | 1997-11-05 | 2000-06-06 | Microsoft Corporation | Method and apparatus for controlling composition and performance of soundtracks to accompany a slide show |
| AUPP027397A0 (en) | 1997-11-07 | 1997-12-04 | Documotion Research, Inc. | Tamper-evident form for securely carrying confidential information |
| JP3377419B2 (en) | 1997-11-11 | 2003-02-17 | インターナショナル・ビジネス・マシーンズ・コーポレーション | Instruction string generation method and apparatus, conversion method, and computer |
| US6289505B1 (en) | 1997-11-18 | 2001-09-11 | Sun Microsystems, Inc. | Method, apparatus and computer programmed product for binary re-optimization using a high level language compiler |
| RU2142162C1 (en) | 1998-01-19 | 1999-11-27 | Кашик Алексей Сергеевич | Method for dynamic displaying data about object |
| US6081816A (en) | 1998-03-18 | 2000-06-27 | Microsoft Corporation | Method for placing text around polygons and other constraints |
| US6189132B1 (en) | 1998-04-09 | 2001-02-13 | International Business Machines Corporation | Design rule correction system and method |
| WO1999056192A2 (en) | 1998-04-24 | 1999-11-04 | Starmine Corporation | Security analyst performance tracking and analysis system and method |
| US6256650B1 (en) | 1998-05-18 | 2001-07-03 | Microsoft Corporation | Method and system for automatically causing editable text to substantially occupy a text frame |
| US6301704B1 (en) | 1998-06-16 | 2001-10-09 | Silicon Graphics, Inc. | Method, system, and computer program product for using static single assignment form as a program representation and a medium for performing global scalar optimization |
| US6405225B1 (en) | 1998-06-17 | 2002-06-11 | Microsoft Corporation | Integrating email functionality into a word processor by incorporating an email GUI within the word processor |
| US6204849B1 (en) | 1998-07-17 | 2001-03-20 | Autodesk, Inc. | Non-ambiguous graphics selection |
| US6166738A (en) | 1998-09-14 | 2000-12-26 | Microsoft Corporation | Methods, apparatus and data structures for providing a user interface, which exploits spatial memory in three-dimensions, to objects |
| US6161098A (en) | 1998-09-14 | 2000-12-12 | Folio (Fn), Inc. | Method and apparatus for enabling small investors with a portfolio of securities to manage taxable events within the portfolio |
| US6715130B1 (en) | 1998-10-05 | 2004-03-30 | Lockheed Martin Corporation | Software requirements metrics and evaluation process |
| US6305012B1 (en) | 1998-12-03 | 2001-10-16 | International Business Machines Corporation | Method and apparatus for dynamic selection of instructions for compiling using tags |
| US6957191B1 (en) | 1999-02-05 | 2005-10-18 | Babcock & Brown Lp | Automated financial scenario modeling and analysis tool having an intelligent graphical user interface |
| US6456305B1 (en) | 1999-03-18 | 2002-09-24 | Microsoft Corporation | Method and system for automatically fitting a graphical display of objects to the dimensions of a display window |
| US6308322B1 (en) | 1999-04-06 | 2001-10-23 | Hewlett-Packard Company | Method and apparatus for reduction of indirect branch instruction overhead through use of target address hints |
| US6691282B1 (en) | 1999-06-22 | 2004-02-10 | Nortel Networks Limited | Method and apparatus for displaying and navigating containment hierarchies |
| US6667750B1 (en) | 1999-07-30 | 2003-12-23 | Curl Corporation | Multiple pass layout of graphical objects with elastics |
| US6826727B1 (en) | 1999-11-24 | 2004-11-30 | Bitstream Inc. | Apparatus, methods, programming for automatically laying out documents |
| US7246316B2 (en) | 1999-11-30 | 2007-07-17 | Siebel Systems, Inc. | Methods and apparatus for automatically generating presentations |
| US6593933B1 (en) | 2000-01-13 | 2003-07-15 | Microsoft Corporation | Block-based synthesis of texture in computer rendered images |
| US6448973B1 (en) | 2000-01-13 | 2002-09-10 | Microsoft Corporation | Virtual texture |
| US7055095B1 (en) | 2000-04-14 | 2006-05-30 | Picsel Research Limited | Systems and methods for digital document processing |
| US20010032151A1 (en) | 2000-04-18 | 2001-10-18 | Glenn Paul | Internet presentation system |
| US20010051962A1 (en) | 2000-06-08 | 2001-12-13 | Robert Plotkin | Presentation customization |
| US20020111969A1 (en) | 2000-09-28 | 2002-08-15 | Halstead Robert H. | System and method for processing graphical objects for layout using an elastic difference operation |
| US6774889B1 (en) * | 2000-10-24 | 2004-08-10 | Microsoft Corporation | System and method for transforming an ordinary computer monitor screen into a touch screen |
| US7231602B1 (en) | 2000-11-29 | 2007-06-12 | Microsoft Corporation | Live preview for reformatting document text |
| US20020065852A1 (en) | 2000-11-30 | 2002-05-30 | Matt Hendrickson | Online guided resume creation system that allows dynamic style formatting |
| US6944830B2 (en) * | 2000-12-21 | 2005-09-13 | Xerox Corporation | System and method for browsing hierarchically based node-link structures based on an estimated degree of interest |
| US6973618B2 (en) | 2000-12-29 | 2005-12-06 | International Business Machines Corporation | Method and system for importing MS office forms |
| US6950981B2 (en) | 2000-12-29 | 2005-09-27 | International Business Machines Corporation | Method and system for providing task information in a place |
| US6791582B2 (en) | 2000-12-29 | 2004-09-14 | International Business Machines Corporation | Method and system for identifying and displaying information that is new or has been updated in a place |
| US6701311B2 (en) * | 2001-02-07 | 2004-03-02 | International Business Machines Corporation | Customer self service system for resource search and selection |
| US6941478B2 (en) | 2001-04-13 | 2005-09-06 | Nokia, Inc. | System and method for providing exploit protection with message tracking |
| CN1384454A (en) | 2001-05-01 | 2002-12-11 | 株式会社东芝 | Information generalizing system and method |
| WO2003001413A1 (en) | 2001-06-22 | 2003-01-03 | Nosa Omoigui | System and method for knowledge retrieval, management, delivery and presentation |
| US6826729B1 (en) * | 2001-06-29 | 2004-11-30 | Microsoft Corporation | Gallery user interface controls |
| US20040205602A1 (en) | 2001-07-25 | 2004-10-14 | Douglas Croeni | Page layout design using geometric interference schema |
| JP2003044464A (en) | 2001-07-31 | 2003-02-14 | Seiko Epson Corp | Layout device and layout program |
| JP2003052582A (en) | 2001-08-10 | 2003-02-25 | Toshiba Tec Corp | Cleaning equipment |
| EP1298524A1 (en) | 2001-09-28 | 2003-04-02 | Ricoh Company, Ltd. | Conference support apparatus, information processor, teleconference system and computer product |
| AUPR962001A0 (en) | 2001-12-19 | 2002-01-24 | Redbank Manor Pty Ltd | Document display system and method |
| US20050001837A1 (en) | 2002-03-01 | 2005-01-06 | Shannon Michael P. | Method and internet based software for graphing sport statistics |
| US20030218641A1 (en) | 2002-05-23 | 2003-11-27 | International Business Machines Corporation | Method and system for navigating a hierarchical structure in a data processing system |
| TW578067B (en) | 2002-06-21 | 2004-03-01 | Inst Information Industry | Knowledge graphic system and method based on ontology |
| US20040001106A1 (en) | 2002-06-26 | 2004-01-01 | John Deutscher | System and process for creating an interactive presentation employing multi-media components |
| US6894726B2 (en) | 2002-07-05 | 2005-05-17 | Thomson Licensing S.A. | High-definition de-interlacing and frame doubling circuit and method |
| US7107525B2 (en) | 2002-07-23 | 2006-09-12 | Xerox Corporation | Method for constraint-based document generation |
| US7058902B2 (en) | 2002-07-30 | 2006-06-06 | Microsoft Corporation | Enhanced on-object context menus |
| US20040041838A1 (en) | 2002-09-04 | 2004-03-04 | Adusumilli Venkata J.R.B. | Method and system for graphing data |
| US7945846B2 (en) | 2002-09-06 | 2011-05-17 | Oracle International Corporation | Application-specific personalization for data display |
| US20040145603A1 (en) | 2002-09-27 | 2004-07-29 | Soares Stephen Michael | Online multimedia presentation builder and presentation player |
| KR100504476B1 (en) | 2002-10-30 | 2005-08-01 | 엘지전자 주식회사 | method and display system for controlling icon |
| KR20040041979A (en) | 2002-11-12 | 2004-05-20 | 한국전자통신연구원 | Graphic user interface |
| AU2002952711A0 (en) | 2002-11-18 | 2002-11-28 | Typefi Systems Pty Ltd | A method of formatting documents |
| KR100484181B1 (en) | 2002-12-02 | 2005-04-20 | 삼성전자주식회사 | Apparatus and method for authoring multimedia document |
| CA2414047A1 (en) * | 2002-12-09 | 2004-06-09 | Corel Corporation | System and method of extending scalable vector graphics capabilities |
| JP4241325B2 (en) | 2002-12-25 | 2009-03-18 | セイコーエプソン株式会社 | Layout system |
| TW562221U (en) | 2002-12-27 | 2003-11-11 | Hon Hai Prec Ind Co Ltd | Mounting device for disk drive |
| US20040133854A1 (en) | 2003-01-08 | 2004-07-08 | Black Karl S. | Persistent document object model |
| WO2004068320A2 (en) | 2003-01-27 | 2004-08-12 | Vincent Wen-Jeng Lue | Method and apparatus for adapting web contents to different display area dimensions |
| KR100459507B1 (en) | 2003-02-15 | 2004-12-03 | (주) 이모션 | Apparatus for manufacturing graphic contents |
| US20040172584A1 (en) * | 2003-02-28 | 2004-09-02 | Microsoft Corporation | Method and system for enhancing paste functionality of a computer software application |
| US7325186B2 (en) | 2003-02-28 | 2008-01-29 | Microsoft Corporation | Method and system for showing unannotated text nodes in a data formatted document |
| US7339598B2 (en) | 2003-07-11 | 2008-03-04 | Vistaprint Technologies Limited | System and method for automated product design |
| US7406660B1 (en) | 2003-08-01 | 2008-07-29 | Microsoft Corporation | Mapping between structured data and a visual surface |
| US20050034083A1 (en) | 2003-08-05 | 2005-02-10 | Denny Jaeger | Intuitive graphic user interface with universal tools |
| US7554689B2 (en) | 2003-10-15 | 2009-06-30 | Canon Kabushiki Kaisha | Document layout method |
| US7548334B2 (en) | 2003-10-15 | 2009-06-16 | Canon Kabushiki Kaisha | User interface for creation and editing of variable data documents |
| US20050091584A1 (en) | 2003-10-23 | 2005-04-28 | Microsoft Corporation | Methods for applying styles to visual aspects of user interface elements |
| GB2407677A (en) | 2003-10-31 | 2005-05-04 | Hewlett Packard Development Co | Post-rendering document space based on rules |
| US7178102B1 (en) | 2003-12-09 | 2007-02-13 | Microsoft Corporation | Representing latent data in an extensible markup language document |
| US7395510B2 (en) | 2003-12-16 | 2008-07-01 | Hewlett-Packard Development Company, L.P. | Method of, and system for, adjusting a document configuration |
| US7536048B2 (en) | 2004-01-15 | 2009-05-19 | Xerox Corporation | Method and apparatus for automatically determining image foreground color |
| JP2005275890A (en) | 2004-03-25 | 2005-10-06 | Nec Corp | Presence information issuing device, system and program |
| EP1741038A4 (en) * | 2004-04-26 | 2011-06-15 | Creo Inc | Systems and methods for comparing documents containing graphic elements |
| US20050289466A1 (en) | 2004-06-24 | 2005-12-29 | Kaihu Chen | Multimedia authoring method and system using bi-level theme templates |
| US20060064642A1 (en) | 2004-09-22 | 2006-03-23 | Edurite Technologies Pvt. Ltd. | Seamless presentation integrator |
| US8134575B2 (en) | 2004-09-30 | 2012-03-13 | Microsoft Corporation | Maintaining graphical presentations based on user customizations |
| US7348982B2 (en) | 2004-09-30 | 2008-03-25 | Microsoft Corporation | Method, system, and computer-readable medium for creating and laying out a graphic within an application program |
| US8510657B2 (en) | 2004-09-30 | 2013-08-13 | Microsoft Corporation | Editing the text of an arbitrary graphic via a hierarchical list |
| US7209815B2 (en) | 2004-12-28 | 2007-04-24 | Snap-On Incorporated | Test procedures using pictures |
| US7478079B2 (en) | 2005-01-14 | 2009-01-13 | Microsoft Corporation | Method for displaying a visual representation of mapping between a source schema and a destination schema emphasizing visually adjusts the objects such that they are visually distinguishable from the non-relevant and non-selected objects |
| US7743325B2 (en) | 2005-03-15 | 2010-06-22 | Microsoft Corporation | Method and computer-readable medium for fitting text to shapes within a graphic |
| US7750924B2 (en) | 2005-03-15 | 2010-07-06 | Microsoft Corporation | Method and computer-readable medium for generating graphics having a finite number of dynamically sized and positioned shapes |
| US20060277476A1 (en) | 2005-06-02 | 2006-12-07 | Hsuan-Cheng Lai | Method and system for dynamic generation of graphical content using a markup language |
| US7555711B2 (en) | 2005-06-24 | 2009-06-30 | Hewlett-Packard Development Company, L.P. | Generating a text layout boundary from a text block in an electronic document |
| US7747944B2 (en) | 2005-06-30 | 2010-06-29 | Microsoft Corporation | Semantically applying style transformation to objects in a graphic |
| WO2007011277A1 (en) | 2005-07-20 | 2007-01-25 | Obigo Ab | Method and arrangement in a display system |
| US7423646B2 (en) | 2005-11-08 | 2008-09-09 | Microsoft Corporation | Smart shape insert |
| US8042065B2 (en) | 2005-11-17 | 2011-10-18 | Microsoft Corporation | Smart copy/paste of graphical nodes |
| US8438486B2 (en) | 2006-02-09 | 2013-05-07 | Microsoft Corporation | Automatically converting text to business graphics |
| CN101231645B (en) | 2007-01-23 | 2012-03-28 | 鸿富锦精密工业(深圳)有限公司 | System and method for dynamics exhibiting tree type contents |
| US7949948B2 (en) | 2007-05-09 | 2011-05-24 | Microsoft Corporation | Constraint and rule-based page layout |
| US8225278B2 (en) | 2007-05-14 | 2012-07-17 | International Business Machines Corporation | Method of visualizing modifications of a hierarchical state diagram |
| US8479218B2 (en) | 2007-07-09 | 2013-07-02 | National Instruments Corporation | Automatically arranging objects in a graphical program block diagram |
| US8826174B2 (en) | 2008-06-27 | 2014-09-02 | Microsoft Corporation | Using visual landmarks to organize diagrams |
| US8176412B2 (en) | 2009-08-25 | 2012-05-08 | International Business Machines Corporation | Generating formatted documents |
| US8799325B2 (en) | 2010-03-12 | 2014-08-05 | Microsoft Corporation | Reordering nodes in a hierarchical structure |
-
2004
- 2004-12-15 US US11/013,655 patent/US8134575B2/en active Active
-
2005
- 2005-08-02 TW TW094126264A patent/TWI410887B/en not_active IP Right Cessation
- 2005-08-11 KR KR1020050073710A patent/KR101183351B1/en active IP Right Grant
- 2005-08-18 AU AU2005203711A patent/AU2005203711B2/en not_active Ceased
- 2005-08-29 CA CA2517399A patent/CA2517399C/en not_active Expired - Fee Related
- 2005-08-30 MY MYPI20054064A patent/MY150137A/en unknown
- 2005-08-30 MX MXPA05009277A patent/MXPA05009277A/en active IP Right Grant
- 2005-08-31 CN CN201010587370.1A patent/CN102044083B/en not_active Expired - Fee Related
- 2005-09-20 EP EP05108636A patent/EP1643451A1/en not_active Ceased
- 2005-09-22 JP JP2005275890A patent/JP4860218B2/en active Active
- 2005-09-26 BR BRPI0503878-2A patent/BRPI0503878B1/en not_active IP Right Cessation
- 2005-09-29 RU RU2010100807/08A patent/RU2524473C2/en not_active IP Right Cessation
- 2005-09-29 RU RU2005130349/09A patent/RU2389069C2/en not_active IP Right Cessation
-
2012
- 2012-01-31 US US13/362,879 patent/US8269790B2/en not_active Expired - Fee Related
- 2012-09-17 US US13/621,614 patent/US9619910B2/en active Active
-
2017
- 2017-03-23 US US15/467,065 patent/US10297061B2/en active Active
Patent Citations (2)
| Publication number | Priority date | Publication date | Assignee | Title |
|---|---|---|---|---|
| EP1111543A2 (en) * | 1999-12-22 | 2001-06-27 | Adobe Systems, Inc. | Method and apparatus for painting groups of objects |
| RU2218602C2 (en) * | 2001-11-08 | 2003-12-10 | Карев Павел Викторович | Method for color-code display of variable multiple-parameter states of system or process |
Cited By (2)
| Publication number | Priority date | Publication date | Assignee | Title |
|---|---|---|---|---|
| RU2749794C1 (en) * | 2017-10-30 | 2021-06-17 | Хуавэй Текнолоджиз Ко., Лтд. | Apparatus and method for facilitation of repeat performance of previous task based on context of mobile apparatus |
| RU2774320C2 (en) * | 2017-10-30 | 2022-06-17 | Хуавэй Текнолоджиз Ко., Лтд. | Device and method for simplifying the re-execution of a previously performed task based on the context of a mobile device |
Also Published As
| Publication number | Publication date |
|---|---|
| US20130024791A1 (en) | 2013-01-24 |
| AU2005203711A1 (en) | 2006-04-13 |
| EP1643451A1 (en) | 2006-04-05 |
| TWI410887B (en) | 2013-10-01 |
| US20060066632A1 (en) | 2006-03-30 |
| CN102044083A (en) | 2011-05-04 |
| BRPI0503878B1 (en) | 2017-11-14 |
| US9619910B2 (en) | 2017-04-11 |
| RU2389069C2 (en) | 2010-05-10 |
| MXPA05009277A (en) | 2006-04-05 |
| JP2006107491A (en) | 2006-04-20 |
| CA2517399A1 (en) | 2006-03-30 |
| US20120127178A1 (en) | 2012-05-24 |
| BRPI0503878A (en) | 2006-05-16 |
| KR101183351B1 (en) | 2012-09-14 |
| TW200620155A (en) | 2006-06-16 |
| US10297061B2 (en) | 2019-05-21 |
| US8269790B2 (en) | 2012-09-18 |
| RU2005130349A (en) | 2007-04-10 |
| CN102044083B (en) | 2014-06-04 |
| RU2010100807A (en) | 2011-07-20 |
| KR20060050401A (en) | 2006-05-19 |
| JP4860218B2 (en) | 2012-01-25 |
| CA2517399C (en) | 2015-02-17 |
| US8134575B2 (en) | 2012-03-13 |
| AU2005203711B2 (en) | 2010-11-18 |
| MY150137A (en) | 2013-11-29 |
| US20170193683A1 (en) | 2017-07-06 |
Similar Documents
| Publication | Publication Date | Title |
|---|---|---|
| RU2524473C2 (en) | Graphic representation support based on user settings | |
| ZA200506945B (en) | Maintaining graphical presentations based on user customizations | |
| US8605090B2 (en) | Modifying and formatting a chart using pictorially provided chart elements | |
| Zaman et al. | Gem-ni: A system for creating and managing alternatives in generative design | |
| US7555722B2 (en) | Dynamic link control object for dynamically presenting link options in connection with a content management server system | |
| US8438486B2 (en) | Automatically converting text to business graphics | |
| JP2009037362A (en) | Document system, and method, program, and recording medium for controlling document system | |
| Bonnett et al. | StructureMorph: creating scholarly 3D models for a convergent, digital publishing environment | |
| Roast et al. | The programming-like-analysis of an innovative media tool | |
| JP2008198010A (en) | Structured document creation support device and structured document creation support program | |
| Holzner | Special Edition Using Microsoft Office Visio 2007: Spec Edit Usin Micr Offi Visi |
Legal Events
| Date | Code | Title | Description |
|---|---|---|---|
| PC41 | Official registration of the transfer of exclusive right |
Effective date: 20150526 |
|
| MM4A | The patent is invalid due to non-payment of fees |
Effective date: 20141001 |
|
| BF4A | Cancelling a publication of earlier date [patents] |
Free format text: PUBLICATION IN JOURNAL SHOULD BE CANCELLED |
|
| MM4A | The patent is invalid due to non-payment of fees |
Effective date: 20200930 |