JP6919890B2 - Display device for optical analyzer - Google Patents
Display device for optical analyzer Download PDFInfo
- Publication number
- JP6919890B2 JP6919890B2 JP2017141930A JP2017141930A JP6919890B2 JP 6919890 B2 JP6919890 B2 JP 6919890B2 JP 2017141930 A JP2017141930 A JP 2017141930A JP 2017141930 A JP2017141930 A JP 2017141930A JP 6919890 B2 JP6919890 B2 JP 6919890B2
- Authority
- JP
- Japan
- Prior art keywords
- sample
- spectrum
- wavelength
- fluorescence
- axis
- Prior art date
- Legal status (The legal status is an assumption and is not a legal conclusion. Google has not performed a legal analysis and makes no representation as to the accuracy of the status listed.)
- Active
Links
- 230000003287 optical effect Effects 0.000 title claims description 45
- 238000005259 measurement Methods 0.000 claims description 155
- 238000001228 spectrum Methods 0.000 claims description 155
- 238000003384 imaging method Methods 0.000 claims description 21
- 230000003595 spectral effect Effects 0.000 claims description 18
- 238000000034 method Methods 0.000 claims description 16
- 230000005284 excitation Effects 0.000 description 159
- 238000002189 fluorescence spectrum Methods 0.000 description 83
- 238000000695 excitation spectrum Methods 0.000 description 33
- 238000002073 fluorescence micrograph Methods 0.000 description 11
- 239000000463 material Substances 0.000 description 10
- 238000012545 processing Methods 0.000 description 9
- 238000004458 analytical method Methods 0.000 description 7
- 238000010521 absorption reaction Methods 0.000 description 6
- 230000001678 irradiating effect Effects 0.000 description 6
- 239000000126 substance Substances 0.000 description 5
- 230000007423 decrease Effects 0.000 description 3
- 238000010586 diagram Methods 0.000 description 3
- 230000035945 sensitivity Effects 0.000 description 3
- 240000004050 Pentaglottis sempervirens Species 0.000 description 2
- 235000004522 Pentaglottis sempervirens Nutrition 0.000 description 2
- TZCXTZWJZNENPQ-UHFFFAOYSA-L barium sulfate Chemical compound [Ba+2].[O-]S([O-])(=O)=O TZCXTZWJZNENPQ-UHFFFAOYSA-L 0.000 description 2
- 230000000694 effects Effects 0.000 description 2
- 238000005516 engineering process Methods 0.000 description 2
- 239000007788 liquid Substances 0.000 description 2
- 239000007787 solid Substances 0.000 description 2
- 240000007594 Oryza sativa Species 0.000 description 1
- 235000007164 Oryza sativa Nutrition 0.000 description 1
- OAICVXFJPJFONN-UHFFFAOYSA-N Phosphorus Chemical compound [P] OAICVXFJPJFONN-UHFFFAOYSA-N 0.000 description 1
- 238000000701 chemical imaging Methods 0.000 description 1
- 238000012937 correction Methods 0.000 description 1
- 238000011161 development Methods 0.000 description 1
- 238000001917 fluorescence detection Methods 0.000 description 1
- 235000013305 food Nutrition 0.000 description 1
- 238000005286 illumination Methods 0.000 description 1
- 238000009434 installation Methods 0.000 description 1
- 238000000691 measurement method Methods 0.000 description 1
- 238000012986 modification Methods 0.000 description 1
- 230000004048 modification Effects 0.000 description 1
- TWNQGVIAIRXVLR-UHFFFAOYSA-N oxo(oxoalumanyloxy)alumane Chemical compound O=[Al]O[Al]=O TWNQGVIAIRXVLR-UHFFFAOYSA-N 0.000 description 1
- 230000000149 penetrating effect Effects 0.000 description 1
- 239000004810 polytetrafluoroethylene Substances 0.000 description 1
- 229920001343 polytetrafluoroethylene Polymers 0.000 description 1
- 239000000843 powder Substances 0.000 description 1
- 238000006862 quantum yield reaction Methods 0.000 description 1
- 239000011347 resin Substances 0.000 description 1
- 229920005989 resin Polymers 0.000 description 1
- 235000009566 rice Nutrition 0.000 description 1
- 239000003566 sealing material Substances 0.000 description 1
- 238000004611 spectroscopical analysis Methods 0.000 description 1
- 238000004148 unit process Methods 0.000 description 1
- 230000003313 weakening effect Effects 0.000 description 1
Images


Classifications
-
- G—PHYSICS
- G01—MEASURING; TESTING
- G01N—INVESTIGATING OR ANALYSING MATERIALS BY DETERMINING THEIR CHEMICAL OR PHYSICAL PROPERTIES
- G01N21/00—Investigating or analysing materials by the use of optical means, i.e. using sub-millimetre waves, infrared, visible or ultraviolet light
- G01N21/62—Systems in which the material investigated is excited whereby it emits light or causes a change in wavelength of the incident light
- G01N21/63—Systems in which the material investigated is excited whereby it emits light or causes a change in wavelength of the incident light optically excited
- G01N21/64—Fluorescence; Phosphorescence
-
- G—PHYSICS
- G01—MEASURING; TESTING
- G01J—MEASUREMENT OF INTENSITY, VELOCITY, SPECTRAL CONTENT, POLARISATION, PHASE OR PULSE CHARACTERISTICS OF INFRARED, VISIBLE OR ULTRAVIOLET LIGHT; COLORIMETRY; RADIATION PYROMETRY
- G01J3/00—Spectrometry; Spectrophotometry; Monochromators; Measuring colours
- G01J3/02—Details
- G01J3/0205—Optical elements not provided otherwise, e.g. optical manifolds, diffusers, windows
- G01J3/0248—Optical elements not provided otherwise, e.g. optical manifolds, diffusers, windows using a sighting port, e.g. camera or human eye
-
- G—PHYSICS
- G01—MEASURING; TESTING
- G01J—MEASUREMENT OF INTENSITY, VELOCITY, SPECTRAL CONTENT, POLARISATION, PHASE OR PULSE CHARACTERISTICS OF INFRARED, VISIBLE OR ULTRAVIOLET LIGHT; COLORIMETRY; RADIATION PYROMETRY
- G01J3/00—Spectrometry; Spectrophotometry; Monochromators; Measuring colours
- G01J3/02—Details
- G01J3/0205—Optical elements not provided otherwise, e.g. optical manifolds, diffusers, windows
- G01J3/0254—Spectrometers, other than colorimeters, making use of an integrating sphere
-
- G—PHYSICS
- G01—MEASURING; TESTING
- G01J—MEASUREMENT OF INTENSITY, VELOCITY, SPECTRAL CONTENT, POLARISATION, PHASE OR PULSE CHARACTERISTICS OF INFRARED, VISIBLE OR ULTRAVIOLET LIGHT; COLORIMETRY; RADIATION PYROMETRY
- G01J3/00—Spectrometry; Spectrophotometry; Monochromators; Measuring colours
- G01J3/02—Details
- G01J3/0264—Electrical interface; User interface
-
- G—PHYSICS
- G01—MEASURING; TESTING
- G01J—MEASUREMENT OF INTENSITY, VELOCITY, SPECTRAL CONTENT, POLARISATION, PHASE OR PULSE CHARACTERISTICS OF INFRARED, VISIBLE OR ULTRAVIOLET LIGHT; COLORIMETRY; RADIATION PYROMETRY
- G01J3/00—Spectrometry; Spectrophotometry; Monochromators; Measuring colours
- G01J3/28—Investigating the spectrum
- G01J3/44—Raman spectrometry; Scattering spectrometry ; Fluorescence spectrometry
- G01J3/4406—Fluorescence spectrometry
-
- G—PHYSICS
- G01—MEASURING; TESTING
- G01N—INVESTIGATING OR ANALYSING MATERIALS BY DETERMINING THEIR CHEMICAL OR PHYSICAL PROPERTIES
- G01N21/00—Investigating or analysing materials by the use of optical means, i.e. using sub-millimetre waves, infrared, visible or ultraviolet light
- G01N21/17—Systems in which incident light is modified in accordance with the properties of the material investigated
- G01N21/25—Colour; Spectral properties, i.e. comparison of effect of material on the light at two or more different wavelengths or wavelength bands
- G01N21/31—Investigating relative effect of material at wavelengths characteristic of specific elements or molecules, e.g. atomic absorption spectrometry
-
- G—PHYSICS
- G01—MEASURING; TESTING
- G01N—INVESTIGATING OR ANALYSING MATERIALS BY DETERMINING THEIR CHEMICAL OR PHYSICAL PROPERTIES
- G01N21/00—Investigating or analysing materials by the use of optical means, i.e. using sub-millimetre waves, infrared, visible or ultraviolet light
- G01N21/17—Systems in which incident light is modified in accordance with the properties of the material investigated
- G01N21/55—Specular reflectivity
-
- G—PHYSICS
- G01—MEASURING; TESTING
- G01N—INVESTIGATING OR ANALYSING MATERIALS BY DETERMINING THEIR CHEMICAL OR PHYSICAL PROPERTIES
- G01N21/00—Investigating or analysing materials by the use of optical means, i.e. using sub-millimetre waves, infrared, visible or ultraviolet light
- G01N21/62—Systems in which the material investigated is excited whereby it emits light or causes a change in wavelength of the incident light
- G01N21/63—Systems in which the material investigated is excited whereby it emits light or causes a change in wavelength of the incident light optically excited
- G01N21/64—Fluorescence; Phosphorescence
- G01N2021/6417—Spectrofluorimetric devices
- G01N2021/6419—Excitation at two or more wavelengths
-
- G—PHYSICS
- G01—MEASURING; TESTING
- G01N—INVESTIGATING OR ANALYSING MATERIALS BY DETERMINING THEIR CHEMICAL OR PHYSICAL PROPERTIES
- G01N21/00—Investigating or analysing materials by the use of optical means, i.e. using sub-millimetre waves, infrared, visible or ultraviolet light
- G01N21/62—Systems in which the material investigated is excited whereby it emits light or causes a change in wavelength of the incident light
- G01N21/63—Systems in which the material investigated is excited whereby it emits light or causes a change in wavelength of the incident light optically excited
- G01N21/64—Fluorescence; Phosphorescence
- G01N2021/6417—Spectrofluorimetric devices
- G01N2021/6421—Measuring at two or more wavelengths
-
- G—PHYSICS
- G01—MEASURING; TESTING
- G01N—INVESTIGATING OR ANALYSING MATERIALS BY DETERMINING THEIR CHEMICAL OR PHYSICAL PROPERTIES
- G01N21/00—Investigating or analysing materials by the use of optical means, i.e. using sub-millimetre waves, infrared, visible or ultraviolet light
- G01N21/62—Systems in which the material investigated is excited whereby it emits light or causes a change in wavelength of the incident light
- G01N21/63—Systems in which the material investigated is excited whereby it emits light or causes a change in wavelength of the incident light optically excited
- G01N21/64—Fluorescence; Phosphorescence
- G01N2021/6417—Spectrofluorimetric devices
- G01N2021/6423—Spectral mapping, video display
-
- G—PHYSICS
- G01—MEASURING; TESTING
- G01N—INVESTIGATING OR ANALYSING MATERIALS BY DETERMINING THEIR CHEMICAL OR PHYSICAL PROPERTIES
- G01N21/00—Investigating or analysing materials by the use of optical means, i.e. using sub-millimetre waves, infrared, visible or ultraviolet light
- G01N21/62—Systems in which the material investigated is excited whereby it emits light or causes a change in wavelength of the incident light
- G01N21/63—Systems in which the material investigated is excited whereby it emits light or causes a change in wavelength of the incident light optically excited
- G01N21/64—Fluorescence; Phosphorescence
- G01N2021/6491—Measuring fluorescence and transmission; Correcting inner filter effect
-
- G—PHYSICS
- G01—MEASURING; TESTING
- G01N—INVESTIGATING OR ANALYSING MATERIALS BY DETERMINING THEIR CHEMICAL OR PHYSICAL PROPERTIES
- G01N2201/00—Features of devices classified in G01N21/00
- G01N2201/04—Batch operation; multisample devices
Description
本発明は、光分析装置用の表示装置に関する。 The present invention relates to a display device for an optical analyzer.
試料容器に封入(収容)された密封材料や液体などを分析する分光蛍光光度計が知られている(非特許文献1)。また、積分球を用いて蛍光スペクトルを補正する分光蛍光光度計が知られている(非特許文献2)。さらに、分光画像を取得するスペクトルイメージングの技術を応用した蛍光指紋イメージング装置が知られている(非特許文献3)。 A spectrofluorometer for analyzing a sealing material, a liquid, or the like enclosed (contained) in a sample container is known (Non-Patent Document 1). Further, a spectrofluorometer that corrects a fluorescence spectrum using an integrating sphere is known (Non-Patent Document 2). Further, a fluorescence fingerprint imaging apparatus to which a technique of spectral imaging for acquiring a spectral image is applied is known (Non-Patent Document 3).
単一波長の励起光を発するLEDを光源として用いることにより、試料の蛍光を検出する蛍光検出装置が知られている(特許文献1)。また、ハイパースペクトルカメラを用いることにより、画像内の各画素における蛍光スペクトル情報を取得する装置が知られている(特許文献2)。 A fluorescence detection device that detects fluorescence of a sample by using an LED that emits excitation light of a single wavelength as a light source is known (Patent Document 1). Further, there is known an apparatus for acquiring fluorescence spectrum information in each pixel in an image by using a hyperspectral camera (Patent Document 2).
非特許文献1、2に示されるような蛍光光度計は、試料を設置し、励起光を照射した際の蛍光スペクトルや励起光の波長を変化させた際の蛍光強度を励起スペクトルとして取得していた。この時、試料室は暗室にする必要があるため、励起光が照射された際の試料の蛍光の発光分布や発光色、発光強度などの状態については確認することはできない。
In the fluorometers as shown in
一方、非特許文献3に示されるような蛍光指紋イメージング装置は、蛍光の発光情報を面内の分布を画像として取得する。この方法を用いれば、任意の励起光を照射した際の蛍光情報を画像として取得することが可能である。この時、白色光を光学フィルターにて分光するため、励起波長は光学フィルターの枚数に制限されてしまう。また、励起光はレンズを通じて試料に直接照射するため、励起光の照射密度は中心部に偏り、励起光量のムラが生じる。励起光量と蛍光強度は比例関係があるため、光量のムラは、試料面内の蛍光画像にムラを与えるおそれがある。 On the other hand, the fluorescence fingerprint imaging apparatus as shown in Non-Patent Document 3 acquires the fluorescence emission information as an image of the in-plane distribution. By using this method, it is possible to acquire fluorescence information when irradiating with arbitrary excitation light as an image. At this time, since the white light is separated by the optical filter, the excitation wavelength is limited to the number of optical filters. Further, since the excitation light irradiates the sample directly through the lens, the irradiation density of the excitation light is biased toward the central portion, and the amount of excitation light becomes uneven. Since the amount of excitation light and the fluorescence intensity are in a proportional relationship, unevenness in the amount of light may cause unevenness in the fluorescence image in the sample plane.
特許文献1では、非特許文献3と同じく試料に励起光を照射した状態で生じる蛍光に着目した画像データを取得している。ここでは、励起光に発光波長が単一のLEDを用いている。試料に応じて励起光のLEDを複数用意することで異なる励起波長で試料を励起させることができるが、励起波長はLEDの個数に限定される。また、非特許文献3および特許文献1では、蛍光の発光情報を面内の分布を画像として取得しているが、蛍光スペクトルを取得することはできず、あくまで画像内で蛍光の強弱を把握するに留まる。
In
特許文献2に示す装置では、ハイパースペクトルカメラを用いることで画像内の各画素における蛍光スペクトル情報を取得することができる。しかしながら、ハイパースペクトルカメラは高価であり、スペクトルのデータ取得間隔は5nm程度で分解能が低い。また、試料に対しては励起光を直接照射していることから励起光量のムラが生じ、試料面内の試料画像にムラを与えるおそれがある。 In the apparatus shown in Patent Document 2, the fluorescence spectrum information of each pixel in the image can be acquired by using the hyperspectral camera. However, the hyperspectral camera is expensive, and the spectrum data acquisition interval is about 5 nm, and the resolution is low. Further, since the sample is directly irradiated with the excitation light, the amount of the excitation light may be uneven, which may cause unevenness in the sample image in the sample surface.
また、非特許文献3に記載されているように、従来の測定現場においては、蛍光光度計にてスペクトル情報を取得し、その情報を基に励起、蛍光波長条件を絞り込んで、蛍光の試料画像を取得することが一般的である。そのため、スペクトルと試料画像の情報は、別々に独立して表示することが通常の方法である。 Further, as described in Non-Patent Document 3, in a conventional measurement site, spectral information is acquired by a fluorometer, excited based on the information, and fluorescence wavelength conditions are narrowed down to obtain a fluorescence sample image. It is common to obtain. Therefore, it is a usual method to display the spectrum and sample image information separately and independently.
すなわち、スペクトルと試料画像の情報は、各々異なる装置で取得し、別々に表示することが一般的である。スペクトルは光が照射された領域の全体を平均化したいわば平均的な情報であり、性質が領域毎に不均一な試料において、そのような不均一性を確認することは困難であった。一方、試料画像からそのような不均一性に関する情報を得ることは可能であるが、全体的な性質を表すスペクトルと併せて確認することは困難であった。試料の全体的な性質を表すスペクトルと試料の領域毎の性質を表す試料画像の双方を考慮して、試料の測定を行うことが求められている。このことは、蛍光光度計に限られず、他の光分析装置でも同じである。 That is, it is common that the spectrum and sample image information are acquired by different devices and displayed separately. The spectrum is so-called average information that averages the entire region irradiated with light, and it has been difficult to confirm such non-uniformity in a sample whose properties are non-uniform for each region. On the other hand, although it is possible to obtain information on such non-uniformity from the sample image, it has been difficult to confirm it together with the spectrum showing the overall properties. It is required to measure the sample in consideration of both the spectrum showing the overall properties of the sample and the sample image showing the properties of each region of the sample. This is not limited to the fluorometer, but is the same for other optical analyzers.
本発明は、精度が高くかつ利便性の高い試料測定を実現し得る光分析装置用の表示装置に関する。 The present invention relates to a display device for an optical analyzer that can realize highly accurate and highly convenient sample measurement.
本発明の光分析装置用の表示装置は、試料に光を照射して当該試料を分析する光分析装置の測定結果を表示する、光分析装置用の表示装置であって、制御部と、前記制御部が処理した測定データに基づく画像を表示する表示部と、を備え、前記測定データには、光の照射により試料が放出する出射光の強度を示すスペクトルと、撮像装置が撮像した試料の試料画像が含まれ、前記表示部は、前記スペクトルと前記試料画像とを、同一画面内で並べて表示する。 The display device for the optical analyzer of the present invention is a display device for the optical analyzer that irradiates a sample with light and displays the measurement result of the optical analyzer that analyzes the sample, and includes a control unit and the above. A display unit that displays an image based on the measurement data processed by the control unit is provided, and the measurement data includes a spectrum showing the intensity of the emitted light emitted by the sample due to irradiation of light and a sample imaged by the imaging device. A sample image is included, and the display unit displays the spectrum and the sample image side by side on the same screen.
本発明によれば、ムラを抑えた励起光を試料に照射するとともに、ムラを抑えた蛍光を取り出すことが可能であり、優れた試料画像とスペクトルを同時に取得することが可能である。更に本発明によれば、このような試料画像とスペクトルを同一画面内に表示することが可能であり、利便性が増すことになる。 According to the present invention, it is possible to irradiate a sample with excitation light with suppressed unevenness and extract fluorescence with suppressed unevenness, and it is possible to acquire an excellent sample image and a spectrum at the same time. Further, according to the present invention, it is possible to display such a sample image and a spectrum on the same screen, which increases convenience.
以下、本発明に係る分光蛍光光度計の好適な実施形態を、図1〜図26に基づいて詳述する。 Hereinafter, preferred embodiments of the spectral fluorometer according to the present invention will be described in detail with reference to FIGS. 1 to 26.
図1は、本発明に係る分光蛍光光度計の一実施形態を示す構成ブロック図である。図1を用いて本実施形態の分光蛍光光度計の構成を詳述する。 FIG. 1 is a block diagram showing an embodiment of a spectral fluorometer according to the present invention. The configuration of the spectral fluorometer of the present embodiment will be described in detail with reference to FIG.
本実施形態の分光蛍光光度計1は、試料に励起光を照射して、試料から放出された蛍光を測定する装置であり、光度計部10と、光度計部10内に配置され、光度計部10をコントロールし試料を分析するデータ処理部30と、入出力を行う操作部40とを備える。
The
光度計部10は、光源11と、光源11の光から分光して励起光を生成する励起側分光器12と、励起側分光器12からの光を分光するビームスプリッタ13と、ビームスプリッタ13で分光された一部の光の強度を測定するモニタ検知器14と、試料から放出された蛍光を単色光に分光する蛍光側分光器15と、単色の蛍光の電気信号を検知する検知器(蛍光検知器)16と、励起側分光器12の回折格子を駆動する励起側パルスモータ17と、蛍光側分光器15の回折格子を駆動する蛍光側パルスモータ18とを備える。
The
データ処理部30は、コンピュータ31と、コンピュータ31内に配置される制御部32と、試料からの蛍光をデジタル変換するA/D変換器33を備える。また、操作部40は、操作者が、コンピュータ31の処理に必要な入力信号を入力する操作パネル41と、コンピュータ31により処理された各種分析結果を表示する表示部42と、操作パネル41及び表示部42とコンピュータ31とを連結するインターフェース43とを備える。
The
操作者が操作パネル41により入力した測定条件に応じて、コンピュータ31が励起側パルスモータ17に信号を出力し、励起側パルスモータ17が駆動して励起側分光器12が目的の波長位置に設定される。また、同じく測定条件に応じて、コンピュータ31が蛍光側パルスモータ18に信号を出力し、蛍光側パルスモータ18が駆動して蛍光側分光器15が目的の波長位置に設定される。励起側分光器12、蛍光側分光器15は、所定のスリット幅を持つ回折格子やプリズムなどの光学素子を有しており、励起側パルスモータ17、蛍光側パルスモータ18を動力とし、ギヤやカム等の駆動系部品を介して光学素子を回転運動させることでスペクトル走査が可能となる。
The
さらに光度計部10は、積分球20を有する。積分球20は実質的に球形の形状を呈し、その内部には物質が存在せず、内部空間が画定されている。また、積分球20は、固体、紛体、液体等種々の形態をとる測定対象の試料を保持(収容や封入など)可能な試料保持部23を有する。試料保持部23は、積分球20に対し取り外し可能に構成され、円形板形状を呈し試料をばね応力にて保持する。
Further, the
さらに、本実施形態においては、積分球20の近傍にカメラモジュール(撮像装置)21が設けられている。カメラモジュール21は、試料からの蛍光の電気信号を検知して、スペクトルの強度を取得する検知器16とは異なり、試料からの蛍光により、試料画像(試料表面の画像)を撮像し、取得する装置である。本実施形態において、試料保持部23は、ビームスプリッタ13で分光された一部の励起光が、直接試料に照射されない位置に設置されている。一方、カメラモジュール21は、積分球20の中心から見て試料保持部23の位置とは対極の位置(対極の位置の近傍を含む)に設置され、光源11の光により照射された試料が放出する蛍光に基づき、試料の表面を撮像する。
Further, in the present embodiment, the camera module (imaging device) 21 is provided in the vicinity of the integrating
積分球20は、ビームスプリッタ13で分光された一部の励起光を内部に取り込む。積分球20の(内部空間を画定する)内面には、硫酸バリウムなどの高反射の白色材料等が塗布されている。積分球20は、入射した励起光を内面で反射、散乱させることにより、平均化された励起光を、試料保持部23に保持された試料に照射する。さらに、試料から放出された蛍光が、積分球20の内面で反射、散乱し、積分球から出て、蛍光側分光器15、検知器16に導かれる。
The integrating
表面測光の光学系の場合、試料の表面が荒れていたり、均一でなかったりすることがあり、光の散乱が大きくなるとともに散乱が不均一となり、試料の設定の仕方によって得られる結果が異なる、すなわち設置再現性が低下することでデータのばらつきが生じる可能性がある。例えば、操作者毎に試料の設定の具合は微妙に異なる可能性がある。 In the case of surface metering optical systems, the surface of the sample may be rough or uneven, and the scattering becomes large and non-uniform, and the results obtained differ depending on how the sample is set. That is, there is a possibility that data may vary due to a decrease in installation reproducibility. For example, the setting condition of the sample may be slightly different for each operator.
そこで、積分球20を用いることにより、光源11の照明強度にムラがあったとしても、積分球20に入射した励起光が内面で反射、散乱することにより平均化されてムラを抑えられる。光源11からの照射光が、試料表面、検出器及びカメラに直接入射することを防止するような配置が望ましい。従来の積分球20の使用法では、光源、バッフル及び検出器の配置により積分球20内での反射回数が増加して照射光が減衰し、結果として試料表面からの蛍光強度が弱くなる可能性もある。本実施形態の配置では、照射光の減衰も抑えられ、励起光の十分な強度を得ることが可能となる。このムラを抑えた励起光が試料保持部23に保持された試料に照射する。さらに、試料から放出された蛍光が、積分球20の内面で反射、散乱することにより、強度が均一化され、試料の設置の仕方に関わらず、ムラを抑えた蛍光を得ることが可能となる。積分球20の詳細は後に説明する。
Therefore, by using the integrating
放出された蛍光を蛍光側分光器15が取り込み、単色光に分光し、検知器16がこの単色光を検出し、A/D変換器33を経てコンピュータ31に信号強度として取り込まれ、表示部42にて各種分析結果が表示される。一方、放出された蛍光をカメラモジュール21が撮像し、試料画像を取得し、表示部42にて表示される。
The emitted fluorescence is taken in by the
一般に、検知器16から得られる試料からの蛍光の電気信号は、蛍光の強度を示す種々のスペクトルの形式で、表示部42が表示する。図2〜図5は、本実施形態の分光蛍光光度計1のみならず、一般的な分光蛍光光度計によっても得られる、二つの軸を含む二次元スペクトルの例を示している。図2はスペクトルの一例である励起スペクトル、図3はスペクトルの一例である蛍光スペクトル、図4はスペクトルの一例である時間変化スペクトル、図5(a)、(b)はスペクトルの一例である三次元スペクトルをそれぞれ示す。
Generally, the electrical signal of fluorescence from the sample obtained from the
図2に示す励起スペクトルは、試料保持部23内の試料に対し、励起光の励起波長を変化させた際の蛍光強度を測定することにより得られるスペクトルである。励起側分光器12が励起波長を測定開始波長から測定終了波長まで変化させ、各波長の励起光を試料に照射する。その時の固定波長に設定されている蛍光側分光器15を経て特定波長の蛍光の変化を検知器16が検出し、A/D変換器33を介してコンピュータ31に信号強度として取り込まれる。コンピュータ31(制御部32)が、この信号強度を解析処理し、表示部42が表示可能なスペクトルを生成する。
The excitation spectrum shown in FIG. 2 is a spectrum obtained by measuring the fluorescence intensity of the sample in the
表示部42は、測定結果として、励起波長と蛍光強度の図2に示されるような2次元の励起スペクトルを表示する。図2のスペクトル(グラフ)は、特定の蛍光波長(例えば550nm)において励起波長を変化させた際の蛍光強度(任意単位)を示している。
As a measurement result, the
図3に示す蛍光スペクトルは、試料保持部23内の試料に対し、固定波長の励起光を照射し、蛍光波長を変化させた際の波長毎の蛍光強度を測定することにより得られるスペクトルである。固定波長に設定された励起側分光器12からの励起光を試料に照射する。蛍光側分光器15は、その時の測定対象の蛍光を測定開始波長から測定終了波長まで変化させ、波長毎の蛍光の変化を検知器16が検出し、A/D変換器33を介してコンピュータ31に信号強度として取り込まれる。コンピュータ31(制御部32)が、この信号強度を解析処理し、表示部42が表示可能なスペクトルを生成する。
The fluorescence spectrum shown in FIG. 3 is a spectrum obtained by irradiating the sample in the
表示部42には、測定結果として、蛍光波長と蛍光強度の図3に示されるような2次元の蛍光スペクトルを表示する。図3のスペクトルは、励起光が特定波長(例えば450nm)であり、蛍光波長を変化させた際の蛍光強度を示している。
As a measurement result, the
図4に示す時間変化スペクトルは、試料保持部23内の試料に対し、固定波長の励起光を照射し、固定波長の蛍光の強度を単位時間毎に測定することにより得られるスペクトルである。固定波長に設定された励起側分光器12からの励起光を試料に照射し、その時に生じる蛍光をその時の固定波長に設定されている蛍光側分光器15を経て、時間毎の蛍光の強度変化を検知器16が検出する。これがA/D変換器33を介してコンピュータ31に信号強度として取り込まれる。
The time change spectrum shown in FIG. 4 is a spectrum obtained by irradiating the sample in the
表示部42は、測定結果として、測定時間と蛍光強度の図4に示されるような2次元の時間変化スペクトルを表示する。図4のスペクトルは、特定波長の励起光に対応した特定波長の蛍光(例えば550nm)の強度を検知した結果を示している。時間が経過することにより、試料中の蛍光物質の変化、分解などが生ずるため、強度は下がることが多い。
As a measurement result, the
図5(a)は、表示部42が表示する三次元スペクトルであり、特に三次元蛍光スペクトルを示す。試料に対し、励起波長を固定した際の蛍光スペクトルを測定し、蛍光スペクトル走査が終了したら、蛍光波長を測定開始波長に戻し、励起波長を所定の波長間隔だけ駆動、次の励起波長における蛍光スペクトルを測定する。得られた蛍光スペクトルを励起波長、蛍光波長、蛍光強度の三次元で記憶し、励起波長が最終の波長に達するまで繰り返すことにより、三次元蛍光スペクトルを取得することができる。本スペクトルは、図2の励起スペクトルと図3の蛍光スペクトルの組み合わせということができる。
FIG. 5A is a three-dimensional spectrum displayed by the
得られた三次元蛍光スペクトルは、同一の蛍光強度をそれぞれ線で結び、等高線図や鳥瞰図等の模擬三次元形式にて描写される。等高線で山となる励起波長および蛍光波長が、試料に適した励起波長、特徴的な蛍光波長となり、操作者は、試料の測定範囲内の励起波長と蛍光波長の蛍光特性を、容易に把握することが可能となる。このような三次元蛍光スペクトルは、試料中の蛍光物質の成分数や成分の同定等、多くの情報を得ることができる点で有用である。 The obtained three-dimensional fluorescence spectrum is drawn in a simulated three-dimensional format such as a contour map or a bird's-eye view by connecting the same fluorescence intensities with lines. The excitation wavelength and the fluorescence wavelength, which are peaks at the contour lines, become the excitation wavelength and the characteristic fluorescence wavelength suitable for the sample, and the operator can easily grasp the fluorescence characteristics of the excitation wavelength and the fluorescence wavelength within the measurement range of the sample. It becomes possible. Such a three-dimensional fluorescence spectrum is useful in that a lot of information such as the number of components of the fluorescent substance in the sample and the identification of the components can be obtained.
図5(b)は、表示部42が表示する他の三次元スペクトルであり、特に三次元時間変化スペクトルを示す。試料に対し、励起波長を固定した際の蛍光スペクトルを測定し、蛍光スペクトル走査が終了したら、蛍光波長を測定開始波長に戻し、一定時間経過後、同じ励起波長における蛍光スペクトルを測定する。得られた蛍光スペクトルを測定時間、蛍光波長、蛍光強度の三次元で記憶し、設定された測定時間に達するまで繰り返すことにより、三次元時間変化スペクトルを取得することができる。本スペクトルは、図3の蛍光スペクトルと図4の時間変化スペクトルの組み合わせということができる。得られた三次元時間変化スペクトルは、同一の蛍光強度をそれぞれ線で結び、等高線図や鳥瞰図等の模擬三次元形式にて描写される。このような三次元時間変化スペクトルは、蛍光スペクトルの時間変化を得るのに有用である。
FIG. 5B is another three-dimensional spectrum displayed by the
図6は、実施形態の積分球20の詳細を示す図であり、図6(a)は積分球20の上面図、図6(b)は積分球20の側面図を示す。本例の積分球20には、積分球20の外面と内面を貫通する六つのポート(穴)P1〜P6が設けられている。ポートP1とポートP3、ポートP2とポートP4、ポートP5とポートP6が、それぞれ互いに球の中心点を間に位置して対極する位置に設けられている。ビームスプリッタ13に対向する位置のポートP1には何も設けられておらず、励起側分光器12で生成され、ビームスプリッタ13で分光された励起光が通過可能となっている。ポートP5には、試料を保持した試料保持部23が取り付けられている。ポートP3、P4は、高反射の白色材料等(例えば積分球20の内面と同一の物質)で形成された白板22で塞がれており、積分球20の内面の一部をなしている。なお、開放により励起光および蛍光が逃げることによる光量の低下を抑制するため、ポートP2の対極のポートP4は白板22でふさぐことが望ましいが、必須ではない。蛍光側分光器15に対向する位置のポートP2、カメラモジュール21に対向する位置のポートP6には何も設けられていない。
6A and 6B are views showing the details of the integrating
本構成において、ポートP1から励起光を入射させると、励起光が、積分球20の内面で散乱、反射(拡散反射)し、積分球20の内部空間が励起光で満たされる。そして、ポートP1から入射した励起光の入射方向に対し、90度方向に蛍光を取り出すポートP2が配置されており、試料保持部23の試料から発せられた蛍光は、ポートP2を通過して蛍光側分光器15に導かれ、スペクトルが測定される。
In this configuration, when the excitation light is incident from the port P1, the excitation light is scattered and reflected (diffuse reflection) on the inner surface of the integrating
また、試料を保持する試料保持部23は、励起光が直接照射されない位置であるポートP5の位置に設置されている。カメラモジュール21は、ポートP5、すなわち試料保持部23の対極に位置するポートP6に対向するように設置されている。カメラモジュール21は、試料に焦点が合うようなレンズ、光量調整用の絞り、不要光をカットするロングパスフィルター、撮像素子等より構成される。カメラモジュール21は、データ処理部30のコンピュータ31により制御される。なお、試料保持部23の試料に励起光が直接照射されないことが満たされていれば、積分球20のポートの構成、数等は、図6に示すものには限定されない。また、本実施形態では各ポートの径がすべて同一であるが、同一にする必要は必ずしもない。また、白板22はそれが取り付けられるポートから外光が積分球内に入らない大きさであることが好ましい。試料保持部23の構造も特には限定されない。積分球20の内面の素材も特に限定はされないが、高反射率の素材で構成することが好ましい。
Further, the
図7は、試料画像(試料表面の画像)の一例を示す。分光蛍光光度計1の光源11からの励起光によって、試料保持部23の試料が照らされる。励起側分光器12を0次光(白色光)に設定した状態では、カメラモジュール21は、白色光源下の試料画像(白色光画像)を撮像し、取得することができる。励起側分光器12で目的波長の単色光に設定した状態では、カメラモジュール21は、単色光下の試料画像として蛍光を含む試料画像(蛍光画像)を撮像し、取得することができる。
FIG. 7 shows an example of a sample image (image of the sample surface). The sample in the
本実施形態においては、試料を保持する試料保持部23は、積分球20に入射した励起光が直接照射されず、積分球20の内面において散乱した励起光が照射可能な位置であるポートP5の位置に設置されている。したがって、ポートP1から入射した励起光は、試料を照射する前に、まず積分球20の内面に入射し、内面で反射、散乱するため、平均化された励起光が得られる。この平均化された励起光が試料保持部23の試料に入射するため、励起光のムラを抑えることができる。
In the present embodiment, the
励起光が入射した試料からは蛍光が放出されるが、この蛍光も積分球20の内面に入射し、内面で反射、散乱された後、積分球20の外へ放出され、蛍光側分光器15、検知器16に捉えられる。結果的に、検知器16は、積分球20の内面(の色、明るさなど)を蛍光によって観察することになるが、ムラの抑えられた励起光、蛍光による観察のため、試料の実態を反映した、精度の高いスペクトル(図3〜図5)を取得することが可能となる。
Fluorescence is emitted from the sample to which the excitation light is incident, and this fluorescence is also incident on the inner surface of the integrating
一方、カメラモジュール21は、積分球20の中心から見て試料保持部23の位置とは対極の位置(対極の位置の近傍を含む)に設置され、光源11の光により照射された試料が放出する蛍光に基づき、試料の表面と積分球内面を撮像する。よって、カメラモジュール21は、ムラの抑えられた励起光により生ずる蛍光を撮像するため、試料の実態を反映した、精度の高い試料画像(図7)を取得することが可能となる。
On the other hand, the
また、図6の形態によれば、カメラモジュール21は、試料保持部23の対極に位置しており、試料の表面から放出される蛍光を直接捉えて試料画像を撮像することができ、また、光学系の構造が複雑になるのを防止することができる。ただし、カメラモジュール21と試料保持部23が必ずしも対極に位置する必要はない。
Further, according to the form of FIG. 6, the
上述した様に、本実施形態の分光蛍光光度計1は、試料の実態を反映した優れたスペクトルと試料画像の双方を取得することができ、測定の精度を向上させることができる。また、本実施形態の分光蛍光光度計1は、測定の利便性を向上させることができ、さらには分析の効率性を向上させることができる。特に、コンピュータ31(制御部32)が、光度計部10で得た各種の測定データ(スペクトル、試料画像など)を処理し、表示部42が、この処理した測定データに基づき、同一画面内で、検知器16により取得される各種のスペクトルと、カメラモジュール21により取得される試料画像と並べて画面表示をする。この結果、測定の利便性、分析の効率性をさらに向上させることができる。以下、そのような例を説明する。図8〜図10は、本実施形態の分光蛍光光度計1によっても得られる、二つの軸を含む二次元スペクトルと試料画像を並べて表示する画面表示の例を示している。
As described above, the
図8に分光蛍光光度計1の励起波長を変化させた際に得られる励起スペクトルと、この変化に連動してカメラモジュール21が取得した試料画像を並べて表示した一例を示す。励起スペクトルは横軸が試料に照射された励起光の波長、縦軸が特定の蛍光波長における蛍光強度である。試料に照射された励起光の波長に応じて、カメラモジュール21が、所定の(一定の)波長間隔で試料を撮像する。コンピュータ31(制御部32)は、各試料画像を励起波長に対応させた複数の試料画像を含む試料画像一覧を生成し、表示部42が、励起スペクトルの励起波長軸に対応するように試料画像一覧を並べて表示する。試料画像一覧の左側等、適切な場所に白色光画像を表示しても良い。これにより、操作者は、励起スペクトルと試料画像一覧とを、対比しながら観察することが可能となり、各励起波長における試料の状態を容易に把握することができる。励起スペクトルにおける蛍光強度が強い場合、撮像された試料画像も明るく発光している状態となり、逆に蛍光強度が低い場合は試料画像も暗くなるなど、励起スペクトルを反映した試料画像が得られる。一方で、励起スペクトルは、固定された蛍光波長の強度を観測していため、それ以外の蛍光波長の強度に対しての情報は得られないが、異なる励起波長における試料画像を取得することにより、試料の色味の変化や試料内の蛍光の分布などを把握することができる。
FIG. 8 shows an example in which the excitation spectrum obtained when the excitation wavelength of the
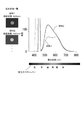
図9は、分光蛍光光度計1の励起波長を固定し蛍光波長を変化させた際に得られる蛍光スペクトルと、その励起波長においてカメラモジュール21が取得した試料画像の一例を示す。コンピュータ31(制御部32)は、当該励起波長における試料画像を特定し、表示部42が、蛍光スペクトルと試料画像一覧が並んだ態様で表示する。蛍光スペクトルは横軸が試料から放出した蛍光の波長、縦軸が蛍光の強度である。蛍光スペクトルは試料画像の発光色と相関性があるが平均的な情報であり、試料画像にて試料の色味や試料内の発光の分布を確認するにあたって有用な情報となる。また、蛍光波長に対応した色を表示する蛍光スペクトルバーも表示されている。
FIG. 9 shows an example of a fluorescence spectrum obtained when the excitation wavelength of the
図10は、分光蛍光光度計1の励起波長と蛍光波長を固定し、蛍光強度の時間変化を測定する時間変化スペクトルと、所定の(一定の)時間間隔で取得した試料画像の一例を示す。時間変化スペクトルは横軸が時間、縦軸が蛍光強度である。試料への励起光の照射の開始後、カメラモジュール21が、所定の(一定の)時間間隔で試料を撮像する。コンピュータ31(制御部32)は、各試料画像を励起波長に対応させた複数の試料画像を含む試料画像一覧を生成し、表示部42が、時間変化スペクトルの測定時間軸に対応するように試料画像一覧を並べて表示する。これにより、操作者は、時間変化スペクトルと試料画像一覧とを、対比しながら観察することが可能となり、各測定時間における試料の状態を容易に把握することができる。
FIG. 10 shows an example of a time change spectrum obtained by fixing the excitation wavelength and the fluorescence wavelength of the
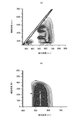
図11は、コンピュータ(制御部32)が処理した、光度計部10が得た少なくとも各種のスペクトルと試料画像を含む測定データに基づき、表示部42が、同一画面内にスペクトル、試料画像等の情報を測定終了後に表示する例を示す。表示部42がこのような各種データが統合された統合形式の測定データ表示(統合データ表示)を提供することにより、操作者は各種データを一元的に把握し、試料の性質を容易に把握することが可能となる。
In FIG. 11, based on the measurement data including at least various spectra and sample images obtained by the
操作者が、操作パネル41から統合データ表示を表示する旨の入力をすると、コンピュータ31(制御部32)が入力に対応した指示を表示部42に出力する。この出力を受けた表示部42は、1)画面の左上領域(A)(以下、「図11(A)」という)に三次元蛍光スペクトル、2)画面の右上領域(B)(以下、「図11(B)」という)に三次元蛍光スペクトルから切り出された励起スペクトル、3)画面の右下領域(C)(以下、「図11(C)」という)に三次元蛍光スペクトルから切り出された蛍光スペクトル、4)画面の左下領域(D)(以下、「図11(D)」という)に試料画像、それぞれをサブ画面の形式で表示する。ただし、いずれの領域にいずれのサブ画面を表示するかは自由であり、特に限定されない。また、本実施形態では領域の数(画面の分割数、サブ画面の数)は4つであるが、この数は特に限定されない。分割の形態も特に限定はされない。以下、図11の配置に基づき説明する。
When the operator inputs from the
図11(A)に示す三次元蛍光スペクトルは、図5(a)のものと同様にして得られる。すなわち、試料に対し、励起波長を固定した際の蛍光スペクトルを測定し、蛍光スペクトル走査が終了したら、蛍光波長を測定開始波長に戻し、励起波長を所定の波長間隔だけ駆動、次の励起波長における蛍光スペクトルを測定する。得られた蛍光スペクトルを励起波長、蛍光波長、蛍光強度の三次元で記憶し、励起波長が最終の波長に達するまで繰り返すことにより、三次元蛍光スペクトルを取得することができる。 The three-dimensional fluorescence spectrum shown in FIG. 11 (A) is obtained in the same manner as that in FIG. 5 (a). That is, the fluorescence spectrum when the excitation wavelength is fixed is measured with respect to the sample, and when the fluorescence spectrum scanning is completed, the fluorescence wavelength is returned to the measurement start wavelength, the excitation wavelength is driven by a predetermined wavelength interval, and the next excitation wavelength is obtained. Measure the fluorescence spectrum. The three-dimensional fluorescence spectrum can be obtained by storing the obtained fluorescence spectrum in three dimensions of the excitation wavelength, the fluorescence wavelength, and the fluorescence intensity and repeating the process until the excitation wavelength reaches the final wavelength.
この時、励起波長は、5nmから10nm程度の間隔で駆動させ三次元蛍光スペクトルを取得する。この励起波長間隔に合わせてカメラモジュール21が試料画像を撮影する。コンピュータ31(制御部32)は、励起波長に対応した複数の試料画像を含む試料画像一覧を生成する。そして、図11(A)に示す様に、表示部42が、励起波長に対応した励起波長軸(縦軸)に合わせて試料画像一覧を示すことにより、操作者は、三次元蛍光スペクトル特性と各励起波長における試料画像を、対比しながら確認することができる。この時、図では三次元蛍光スペクトルの右側に励起波長に合わせて撮影した試料画像一覧を表示しているが、励起波長と対比しながら表示させることが好ましく、三次元蛍光スペクトルの左側に表示しても構わない。
At this time, the excitation wavelength is driven at intervals of about 5 nm to 10 nm to acquire a three-dimensional fluorescence spectrum. The
図11(B)は、図11(A)のI−I線で切り出した励起スペクトルを表示している。コンピュータ31(制御部32)が生成し、表示部42が表示する縦軸のI−I線は、三次元蛍光スペクトルの蛍光波長軸(横軸)の特定位置に相当する特定の蛍光波長を選択可能な選択ツールである。操作者が操作パネル41を用いて操作することにより、I−I線を左右方向(水平方向)に移動(スライド)させ、停止した位置に相当する任意の蛍光波長を選択することが可能である。I−I線は、蛍光波長を選択するいわば選択線であり、トレースバー等と言われることがある。
FIG. 11 (B) shows the excitation spectrum cut out along the line I-I of FIG. 11 (A). The vertical axis I-I line generated by the computer 31 (control unit 32) and displayed by the
I−I線が停止した位置における図11(A)の三次元蛍光スペクトルの断面が、図11(B)の励起スペクトルに相当する。よって、操作者が図11(A)のI−I線を、操作パネル41の操作により左右にずらし、蛍光波長を変化させることで、図11(B)の励起スペクトルが連動して変化する。本例では、図11(A)のI−I線が560nmの蛍光波長を選択しており、図11(B)には560nmの蛍光波長に対する励起スペクトルが表示されている。また、試料画像は励起波長に連動して取得しているため、試料画像一覧は励起波長軸の下部に表示することが好ましい。
The cross section of the three-dimensional fluorescence spectrum of FIG. 11 (A) at the position where the I-I line is stopped corresponds to the excitation spectrum of FIG. 11 (B). Therefore, the operator shifts the I-I line of FIG. 11A to the left or right by operating the
図11(C)は、図11(A)のII−II線で切り出した蛍光スペクトルを表示している。コンピュータ31(制御部32)が生成し、表示部42が表示する横軸のII−II線は、三次元蛍光スペクトルの励起波長軸(縦軸)に相当する特定の励起波長を選択する選択ツールである。操作者が操作パネル41を用いて操作することにより、II−II線を上下方向(垂直方向)に移動(スライド)させ、停止した位置に相当する任意の励起波長を選択することが可能である。II−II線は、励起波長を選択するいわば選択線であり、トレースバー等と言われることがある。
FIG. 11 (C) shows the fluorescence spectrum cut out by the line II-II of FIG. 11 (A). The horizontal axis II-II line generated by the computer 31 (control unit 32) and displayed by the
II−II線が停止した位置における図11(A)の三次元蛍光スペクトルの断面が、図11(C)の蛍光スペクトルに相当する。よって、操作者が図11(A)のII−II線を、操作パネル41の操作により上下にずらし、励起波長を変化させることで、図11(C)の蛍光スペクトルが連動して変化する。本例では、図11(A)のII−II線が455nmの励起波長を選択しており、図11(C)には455nmの励起波長に対する蛍光スペクトルが表示されている。また、蛍光波長に対応した色を表示する蛍光スペクトルバーも表示されている。
The cross section of the three-dimensional fluorescence spectrum of FIG. 11 (A) at the position where the line II-II is stopped corresponds to the fluorescence spectrum of FIG. 11 (C). Therefore, the operator shifts the line II-II of FIG. 11A up and down by operating the
図11(D)は、試料画像を表示している。本例では左側に白色光画像、右側に蛍光画像が表示される。白色光画像は常に一定である。蛍光画像は、図11(A)のI−I線およびII−II線により選択された蛍光波長および励起波長における蛍光画像に相当し、本例では455nmの励起波長、560nmの蛍光波長における蛍光画像が表示される。 FIG. 11D displays a sample image. In this example, a white light image is displayed on the left side and a fluorescence image is displayed on the right side. The white light image is always constant. The fluorescence image corresponds to the fluorescence image at the fluorescence wavelength and the excitation wavelength selected by the I-I and II-II lines of FIG. 11 (A), and in this example, the fluorescence image at the excitation wavelength of 455 nm and the fluorescence wavelength of 560 nm. Is displayed.
尚、本例では、図11(B)において、II−II線が選択中の励起波長(455nm)を示す選択励起波長線(バー)L1が示されている。また、図11(C)において、I−I線が選択中の蛍光波長(560nm)を示す選択蛍光波長線(バー)L2が示されている。これらの選択線L1、L2は、励起スペクトル、蛍光スペクトル各々において、どの波長の試料画像が選択され、図11(D)で表示されているのかを容易に示すものである。I−I線およびII−II線を移動させることにより、連動して選択線L1、L2も移動することが望ましい。また、図11(A)および図11(B)における試料画像一覧中の試料画像のいずれかを選択することにより、選択に対応するスペクトルを図11(A)〜(C)に表示し、選択に対応して拡大した蛍光画像を図11(D)に表示してもよい。 In this example, in FIG. 11B, the selective excitation wavelength line (bar) L1 indicating the excitation wavelength (455 nm) for which the II-II line is being selected is shown. Further, in FIG. 11C, the selected fluorescence wavelength line (bar) L2 indicating the fluorescence wavelength (560 nm) selected by the I-I line is shown. These selection lines L1 and L2 easily indicate which wavelength of the sample image is selected and displayed in FIG. 11 (D) in each of the excitation spectrum and the fluorescence spectrum. It is desirable to move the selection lines L1 and L2 in conjunction with each other by moving the I-I line and the II-II line. Further, by selecting one of the sample images in the sample image list in FIGS. 11 (A) and 11 (B), the spectra corresponding to the selection are displayed in FIGS. 11 (A) to 11 (C) and selected. The enlarged fluorescence image corresponding to the above may be displayed in FIG. 11 (D).
なお、図12のように三次元蛍光スペクトルを図12(B)に配置し、図12(A)に励起スペクトルの切り出し、図12(C)に蛍光スペクトルの切り出し、図12(D)の位置に試料画像を表示しても良い。この配置とすることで、三次元蛍光スペクトルで表示している縦軸(励起波長軸)と横軸(蛍光波長軸)と三次元蛍光スペクトル切り出した励起スペクトルと蛍光スペクトルの対応性を把握しやすくなる。三次元蛍光スペクトルについては励起波長を横軸、蛍光波長を縦軸とする表示をすることもあるので、その際は切り出した励起スペクトルと蛍光スペクトルの位置も反転させても良い。 The three-dimensional fluorescence spectrum is arranged in FIG. 12 (B) as shown in FIG. 12, the excitation spectrum is cut out in FIG. 12 (A), the fluorescence spectrum is cut out in FIG. 12 (C), and the position in FIG. 12 (D). A sample image may be displayed on the screen. With this arrangement, it is easy to understand the correspondence between the vertical axis (excitation wavelength axis) and the horizontal axis (fluorescence wavelength axis) displayed in the three-dimensional fluorescence spectrum, and the excited excitation spectrum and the fluorescence spectrum. Become. Since the three-dimensional fluorescence spectrum may be displayed with the excitation wavelength on the horizontal axis and the fluorescence wavelength on the vertical axis, the positions of the cut out excitation spectrum and the fluorescence spectrum may be inverted in that case.
図13は、これまで示した各種のスペクトル等のデータの中で、励起スペクトルを取得する測定直前のスタンバイ中の測定画面の一例を示す。操作者が、操作パネル41を操作して所定の測定スタンバイの操作を行うと、表示部42は、測定画面として、測定表示エリアA1、測定条件表示エリアA2、ステータス表示エリアA3、試料画像表示エリアA4を表示する。測定表示エリアA1は、取得した試料のデータに基づくスペクトルと試料画像一覧を表示する。測定条件表示エリアA2は、操作者が操作パネル41を用いて入力した測定条件を表示する。測定条件には、励起波長、蛍光波長、蛍光強度、励起スリット幅、蛍光スリット幅等が含まれる。ステータス表示エリアA3は、現在の分光蛍光光度計1の稼働状態に応じたステータスを表示する。試料画像表示エリアA4は、最新の更新された試料画像を表示する。スタンバイ中では、試料についてデータは得られていないため、測定表示エリアA1には何も表示されていない。
FIG. 13 shows an example of the measurement screen during standby immediately before the measurement for acquiring the excitation spectrum among the data such as various spectra shown so far. When the operator operates the
図14は、励起スペクトル測定中の測定画面の一例を示す。操作者が、操作パネル41を操作して所定の測定開始の操作を行うと、分光蛍光光度計1が測定を開始し、表示部42は、測定表示エリアA1に励起スペクトルの表示を開始する。併せて、カメラモジュール21が一定の励起波長間隔をもって試料画像を取得し、試料画像一覧が、励起スペクトルの励起波長軸に相当する位置に表示される。操作者は、前もって操作パネル41を用いて、測定条件である試料画像の励起波長あたりの撮影間隔を入力している。測定が完了すると、図8に示すように励起スペクトルと励起波長に応じた試料画像一覧が表示される。
FIG. 14 shows an example of a measurement screen during excitation spectrum measurement. When the operator operates the
尚、図13、図14に示したのと同様の要領にて、図9に示す蛍光スペクトルを取得することができる。 The fluorescence spectrum shown in FIG. 9 can be obtained in the same manner as shown in FIGS. 13 and 14.
図15は、時間変化測定中の測定画面の一例を示す。測定が開始されると、表示部42は、測定表示エリアA1に蛍光強度の時間変化を表示する。併せて、一定の時間間隔で試料画像が取得され、画像一覧表示が、時間変化の時間軸に相当する位置に表示される。操作者は、前もって操作パネル41を用いて、測定条件である試料画像の時間あたりの撮影間隔を入力しておくこととする。測定が完了すると、図10に示すように蛍光強度の時間変化と時間に応じた試料画像一覧が表示される。
FIG. 15 shows an example of the measurement screen during the time change measurement. When the measurement is started, the
図16は、三次元蛍光スペクトル測定中の測定画面の一例を示す。測定が開始されると、表示部42は、測定表示エリアA1に三次元蛍光スペクトルを表示する。併せて、一定の励起波長間隔で試料画像が取得され、試料画像一覧が、三次元蛍光スペクトルの励起波長軸に相当する位置に表示される。操作者は、前もって操作パネル41を用いて、測定条件である試料画像の励起波長あたりの撮影間隔を入力しておくこととする。
FIG. 16 shows an example of a measurement screen during three-dimensional fluorescence spectrum measurement. When the measurement is started, the
以上述べた操作のうち、図8、図9、図16に示すデータを取得した後、操作者が操作パネル41を操作して、所定の統合データ表示を作成する旨の操作を行う。すると、コンピュータ31(制御部32)が、これらのデータを処理し、出力指示を表示部42に出力する。これにより、表示部42は、図11に示す統合データ表示を行う。
Among the operations described above, after acquiring the data shown in FIGS. 8, 9, and 16, the operator operates the
また、以上述べた操作のうち、図9、図10、図5(b)に示すデータを取得した後、操作者が操作パネル41を操作して、所定の統合データ表示を作成する旨の操作を行う。すると、コンピュータ31(制御部32)が、これらのデータを処理し、出力指示を表示部42に出力する。これにより、表示部42は、図17に示す統合データ表示を行う。
Further, among the operations described above, after acquiring the data shown in FIGS. 9, 10 and 5 (b), the operator operates the
図17は、図11の例とは別バージョンとして位置付けられ、コンピュータ(制御部32)が処理した、光度計部10が得た少なくとも各種のスペクトルと試料画像を含む測定データに基づき、表示部42が、同一画面内にスペクトル、試料画像等の情報を測定終了後に表示する例を示す。表示部42がこのような各種データが統合された統合形式の測定データ表示(統合データ表示)を提供することにより、操作者は各種データを一元的に把握し、試料の性質を容易に把握することが可能となる。
FIG. 17 is positioned as a different version from the example of FIG. 11, and is based on the measurement data including at least various spectra and sample images obtained by the
操作者が、操作パネル41から統合データ表示を表示する旨の入力をすると、コンピュータ31(制御部32)が入力に対応した指示を表示部42に出力する。この出力を受けた表示部42は、1)画面の左上領域(A)(以下、「図17(A)」という)に三次元時間変化スペクトル、2)画面の右上領域(B)(以下、「図17(B)」という)に三次元時間変化スペクトルから切り出された時間変化スペクトル、3)画面の右下領域(C)(以下、「図17(C)」という)に三次元時間変化スペクトルから切り出された蛍光スペクトル、4)画面の左下領域(D)(以下、「図17(D)」という)に試料画像、それぞれをサブ画面の形式で表示する。ただし、いずれの領域にいずれのサブ画面を表示するかは自由であり、特に限定されない。また、本実施形態では領域の数(画面の分割数、サブ画面の数)は4つであるが、この数は特に限定されない。分割の形態も特に限定はされない。以下、図17の配置に基づき説明する。
When the operator inputs from the
図17(A)に示す三次元時間変化スペクトルは、図5(b)のものと同様にして得られる。すなわち、試料に対し、励起波長を固定した際の蛍光スペクトルを測定し、蛍光スペクトル走査が終了したら、蛍光波長を測定開始波長に戻し、一定時間経過後に蛍光スペクトルを測定する。得られた蛍光スペクトルを測定時間、蛍光波長、蛍光強度の三次元で記憶し、設定された測定時間に達するまで繰り返すことにより、三次元の時間変化スペクトルを取得する。この時、測定時間は、5秒から10秒程度の間隔で駆動させ、三次元時間変化スペクトルを取得する。 The three-dimensional time change spectrum shown in FIG. 17 (A) is obtained in the same manner as that in FIG. 5 (b). That is, the fluorescence spectrum when the excitation wavelength is fixed is measured with respect to the sample, and when the fluorescence spectrum scanning is completed, the fluorescence spectrum is returned to the measurement start wavelength, and the fluorescence spectrum is measured after a lapse of a certain period of time. The obtained fluorescence spectrum is stored in three dimensions of measurement time, fluorescence wavelength, and fluorescence intensity, and repeated until the set measurement time is reached to acquire a three-dimensional time change spectrum. At this time, the measurement time is driven at intervals of about 5 seconds to 10 seconds to acquire a three-dimensional time change spectrum.
この測定時間間隔に合わせてカメラモジュール21が試料画像を撮影する。コンピュータ31(制御部32)は、測定時間に対応した複数の試料画像を含む試料画像一覧を生成する。そして、図17(A)に示す様に、表示部42が、測定時間に対応した測定時間軸(縦軸)に合わせて試料画像一覧を示すことにより、操作者は、三次元時間変化スペクトル特性と各測定時間における試料画像を対比しながら確認することができる。この時、図では三次元時間変化スペクトルの右側に測定時間に合わせて撮影した試料画像一覧を表示しているが、測定時間と対比して表示させることが好ましいため、三次元時間変化スペクトルの左側に表示しても構わない。
The
図17(B)は、図17(A)のI−I線で切り出した時間変化スペクトルを表示している。コンピュータ31(制御部32)が生成し、表示部42が表示する縦軸のI−I線は、三次元時間変化スペクトルの横軸の特定位置に相当する特定の蛍光波長を選択する選択ツールである。操作者が操作パネル41を用いて操作することにより、I−I線を左右方向(水平方向)に移動(スライド)させ、停止した位置に相当する任意の蛍光波長を選択することが可能である。I−I線は、蛍光波長を選択するいわば選択線であり、トレースバー等と言われることがある。
FIG. 17 (B) shows the time change spectrum cut out along the line I-I of FIG. 17 (A). The vertical axis I-I line generated by the computer 31 (control unit 32) and displayed by the
I−I線が停止した位置における図17(A)の三次元時間変化スペクトルの断面が、図17(B)の時間変化スペクトルに相当する。よって、操作者が図17(A)のI−I線を、操作パネル41の操作により左右にずらし、蛍光波長を変化させることで、図17(B)の励起スペクトルが連動して変化する。本例では、図17(A)のI−I線が540nmの蛍光波長を選択しており、図17(B)には540nmの蛍光波長に対する時間変化スペクトルが表示されている。また、試料画像は測定時間に連動して取得しているため、試料画像一覧は測定時間の軸の下部に表示することが好ましい。
The cross section of the three-dimensional time change spectrum of FIG. 17 (A) at the position where the I-I line is stopped corresponds to the time change spectrum of FIG. 17 (B). Therefore, the operator shifts the I-I line of FIG. 17 (A) to the left or right by operating the
図17(C)は、図17(A)のII−II線で切り出した蛍光スペクトルを表示している。コンピュータ31(制御部32)が生成し、表示部42が表示する横軸のII−II線は、三次元時間変化スペクトルの縦軸に相当する特定の測定時間を選択する選択ツールである。操作者が操作パネル41を用いて操作することにより、II−II線を上下方向(垂直方向)に移動(スライド)させ、停止した位置に相当する任意の測定時間を選択することが可能である。II−II線は、測定時間を選択するいわば選択線であり、トレースバー等と言われることがある。
FIG. 17 (C) shows the fluorescence spectrum cut out by the line II-II of FIG. 17 (A). The horizontal axis II-II line generated by the computer 31 (control unit 32) and displayed by the
II−II線が停止した位置における図17(A)の三次元時間変化スペクトルの断面が、図17(C)の蛍光スペクトルに相当する。よって、操作者が図17(A)のII−II線を、操作パネル41の操作により上下にずらし、測定時間を変化させることで、図17(C)の蛍光スペクトルが連動して変化する。本例では、図17(A)のII−II線が300秒の測定時間を選択しており、図17(C)には300秒の測定時間に対する蛍光スペクトルが表示されている。また、蛍光波長に対応した色を表示する蛍光スペクトルバーも表示されている。
The cross section of the three-dimensional time change spectrum of FIG. 17 (A) at the position where the line II-II is stopped corresponds to the fluorescence spectrum of FIG. 17 (C). Therefore, the operator shifts the line II-II of FIG. 17 (A) up and down by operating the
図17(D)は、試料画像を表示している。本例では左側に白色光画像、右側に蛍光画像が表示される。白色光画像は、例えば測定前に取得したものを表示してもよい。蛍光画像は、図17(A)のI−I線およびII−II線により選択された蛍光波長および測定時間における蛍光画像に相当し、本例では540nmの蛍光波長、300秒の測定時間における蛍光画像が表示される。 FIG. 17D displays a sample image. In this example, a white light image is displayed on the left side and a fluorescence image is displayed on the right side. As the white light image, for example, an image acquired before measurement may be displayed. The fluorescence image corresponds to the fluorescence image at the fluorescence wavelength and measurement time selected by the I-I and II-II lines of FIG. 17 (A), and in this example, the fluorescence has a fluorescence wavelength of 540 nm and fluorescence at a measurement time of 300 seconds. The image is displayed.
尚、本例では、図17(B)において、II−II線が選択中の測定時間(300秒)を示す選択測定時間線(バー)L3が示されている。また、図17(C)において、I−I線が選択中の蛍光波長(540nm)を示す選択蛍光波長線(バー)L2が示されている。これらの選択線L3、L2は、時間変化スペクトル、蛍光スペクトル各々において、どの時間または波長の試料が選択され、図17(D)で表示されているのかを容易に示すものである。I−I線およびII−II線を移動させることにより、連動して選択線L3、L2も移動することが望ましい。また、図17(A)および図17(B)における試料画像一覧中の試料画像のいずれかを選択することにより、選択に対応するスペクトルを図17(A)〜(C)に表示し、選択に対応して拡大した蛍光画像を図17(D)に表示してもよい。 In this example, in FIG. 17B, the selective measurement time line (bar) L3 indicating the measurement time (300 seconds) during which the II-II line is being selected is shown. Further, in FIG. 17C, the selective fluorescence wavelength line (bar) L2 indicating the fluorescence wavelength (540 nm) selected by the I-I line is shown. These selection lines L3 and L2 easily indicate which time or wavelength the sample is selected and displayed in FIG. 17 (D) in each of the time change spectrum and the fluorescence spectrum. It is desirable to move the selection lines L3 and L2 in conjunction with each other by moving the I-I line and the II-II line. Further, by selecting one of the sample images in the sample image list in FIGS. 17 (A) and 17 (B), the spectra corresponding to the selection are displayed in FIGS. 17 (A) to 17 (C) and selected. The enlarged fluorescence image corresponding to the above may be displayed in FIG. 17 (D).
図18および図19は、分光蛍光光度計1の他の実施形態を示す。本実施形態においても、試料保持部23は、励起光が直接照射されない位置にあるが、図6の構成とは異なり、積分球20のポートP4の位置に設置されている。そして、図1の構成にはないビームスプリッタ13aが、ポートP4に対極するポートP2に対向する位置に設けられている。そして、カメラモジュール21は、積分球20ではなく、ビームスプリッタ13aで分光され、90度方向に曲げられた蛍光が入射する位置、すなわち積分球20の外側に設けられている。すなわち、カメラモジュール21は、試料から放出し積分球20の内面で散乱した後、積分球20から出射、ビームスプリッタ13aで分光された蛍光を捉えて試料画像を撮像する。
18 and 19 show another embodiment of the
すなわち、本構成では、蛍光を取り出すポートとカメラモジュール21に光を取り込むポートとして共通のポートP2を使用するため、検知器16とカメラモジュール21は、積分球20に設けられた共通のポートP2を通過した蛍光を捉えることになる。そのため、積分球20の開口部は2箇所(ポートP1、P2)となり、図6の形態における開口部の数(ポートP1、P2、P6の3箇所)より減ることになる。開口部の数が多いと光量のロスにつながるため、蛍光スペクトルおよび試料画像におけるノイズの増大につながるおそれがある。本構成を用いることにより、開口部の数を減らし、光量のロスを低減し、ノイズを低減することができる。また、蛍光スペクトルと試料画像を同じ光路上で取得することができる。
That is, in this configuration, since the common port P2 is used as the port for taking out fluorescence and the port for taking in light to the
図20は、試料画像の背景処理に関する実施例を示す。本測定系にて試料画像を取得すると、試料画像内では試料部分と積分球20の内面(内壁)の領域が発現する。カメラモジュール(撮像装置)21の撮像素子が可視領域に所定の感度を有する場合(可視領域撮像装置)、可視領域が撮影対象となり、カラーの試料画像が得られる。分光蛍光光度計1は、紫外・可視・近赤外領域を測定対象とすることができるため、紫外領域に所定の感度を有する撮像素子(紫外領域撮像装置)、近赤外領域に所定の感度を有する撮像素子(近赤外領域撮像装置)を使用することにより、それら波長領域に対応する試料画像を取得することも可能である。撮像素子は、紫外領域撮像装置、可視領域撮像素子、近赤外領域撮像素子のそれぞれを目的に応じて単独で用いてもよいし、複数を組み合わせて用いてもよい。試料に励起光を照射した際、試料部分からは試料における励起光の反射光や蛍光が試料画像情報として得られる。なお、試料に吸収特性がある場合は、吸収の影響があるため、この部分は励起光と蛍光および吸収が加味された画像となる。
FIG. 20 shows an example regarding background processing of a sample image. When a sample image is acquired by this measurement system, a region of the sample portion and the inner surface (inner wall) of the integrating
一方、積分球20の内面は白色素材で覆われているため、吸収の影響はほぼ無く、この部分は励起光の単色光に相当する画像となる。積分球の内面部分の白色素材によっては、波長領域によって吸収の影響がある場合があり、この時には励起光の単色光の反射と積分球20の内面の白色素材の吸収の影響が加味された画像となる。試料部分の領域(試料領域)と積分球20の内面の領域(積分球内面領域)の波長特性は異なるため、それぞれの領域は異なる明度、色味の画像となる。積分球内面領域の明度は励起光の強さに相当し、色味は励起光の波長に相当するため有用な情報となる。一方で、試料領域の画像に着目したい場合、積分球内面領域は背景の領域に相当するため、励起波長を変化させた際に生じる背景の明度や色味の変化により、対比錯視が生じ試料領域の明度や色味を正確に視認することが困難になる。
On the other hand, since the inner surface of the integrating
そこでコンピュータ31(制御部32)は、試料画像において試料領域の座標および積分球内面領域の座標を設定し、積分球内面領域の座標を基に、この領域を背景として登録する。そして、コンピュータ31(制御部32)は、異なる励起波長条件下における背景色を特定の色に統一して塗りつぶし、処理後の画像を表示部42が表示する背景処理を実施する。これにより、励起波長の変化に伴う背景色を統一することができ、対比錯視の影響なく試料領域の明度や色味を比較することが可能となる。図20は、背景色を黒に統一または白に統一した図を例示しているが(二段目及び三段目)、背景は任意の色とすることができる。励起波長の変化に伴う積分球内面領域の明度・色味を比較したい際には、試料領域の座標を統一した色で塗りつぶし表示してもよい(最下段の白の例)。背景色の比較が容易となる。
Therefore, the computer 31 (control unit 32) sets the coordinates of the sample region and the coordinates of the inner surface region of the integrating sphere in the sample image, and registers this region as the background based on the coordinates of the inner surface region of the integrating sphere. Then, the computer 31 (control unit 32) unifies the background color under different excitation wavelength conditions to a specific color, and performs background processing for displaying the processed image on the
図21〜図23は、表示部42が、複数の試料の各々に対応した各種のスペクトルと試料画像を、同一画面内で並べて表示する例を示す。図21は、複数の試料における励起スペクトルと試料画像の測定結果を重ねて表示した際の表示例を示す。表示部42は、複数の試料の励起スペクトルを重ねて表示し、試料画像一覧には、試料毎の各励起波長における試料画像を並べて表示する。
21 to 23 show an example in which the
図22は、複数の試料における蛍光スペクトルと試料画像の測定結果を重ねて表示した際の表示例を示す。表示部42は、複数の試料の蛍光スペクトルを重ねて表示し、試料画像一覧には、試料毎の試料画像を並べて表示する。
FIG. 22 shows a display example when the fluorescence spectra of a plurality of samples and the measurement results of the sample images are superimposed and displayed. The
図23は、複数の試料における時間変化スペクトルと試料画像の測定結果を重ねて表示した際の表示例を示す。表示部42は、複数の試料の時間変化スペクトルを重ねて表示し、試料画像一覧には、試料毎の各測定時間における試料画像一覧を並べて表示する。
FIG. 23 shows a display example when the time change spectra of a plurality of samples and the measurement results of the sample images are superimposed and displayed. The
操作者は、図21〜図23の表示を観察することにより、複数の試料について、各種の情報を容易に比較することが可能となり、試料間の性質の違いを容易に把握することが可能となる。 By observing the displays shown in FIGS. 21 to 23, the operator can easily compare various types of information for a plurality of samples, and can easily grasp the difference in properties between the samples. Become.
図24は、反射スペクトルと試料画像の表示例を示す。反射スペクトルを測定する際には、積分球20に、試料を保持する試料保持部23の代わりに基準反射物として高反射率の白色素材(酸化アルミニウムやPTFE樹脂板など)を設置する。そして、基準反射物に分光した光を順次照射し、同一の波長における光量を100%の値としてベースラインを取得する。その後、積分球20に試料を収容した試料保持部23を設置し、試料から反射する光量の変化をベースラインの光量と比演算し、反射率を計測する。表示部42が、反射率に基づく反射スペクトルと試料画像一覧を並べて表示する。
FIG. 24 shows a display example of the reflection spectrum and the sample image. When measuring the reflection spectrum, a white material with high reflectance (aluminum oxide, PTFE resin plate, etc.) is installed on the integrating
図25は、積分球20のさらに他の実施形態を示し、微小領域の試料画像を取得するために好適な積分球20の構成である。本実施形態の積分球20には、黒色円板に任意の大きさの穴24aが設けられた平板状のアパーチャー24が、試料保持部23と、積分球20、特に試料保持部23とを設置するポートP5との間に設置されている。アパーチャー24は、試料から放出される蛍光を部分的に遮蔽する役割があり、アパーチャー24の穴24aの大きさ(径)が小さくなると、遮蔽される蛍光の量が増え、放出される蛍光の量が小さくなり、蛍光スペクトルと試料画像のS/N比に応じて、アパーチャー24の穴24aの径を決定することができる。例えば、高蛍光強度を有するLED用蛍光体では、強い蛍光を発するため、積分球20の内径がφ60mm、ポートP5の径がφ20mmの場合、アパーチャー24の外径はポートP5をふさぐ大きさであるφ20mmとし、その中心部に設ける穴24aの大きさはφ1mm程度まで小さくすることが可能である。
FIG. 25 shows still another embodiment of the integrating
図26は、アパーチャー24の有無による試料画像の比較を示す。アパーチャー24を設けることにより、微小領域の試料画像に着目することが可能となる。試料内の蛍光物質の分布が不均一な場合、局所的な情報を得ることにより、局所部分の情報のみを取得することが可能である。局所部分のみを観察することになるため、同一視野の場合、試料領域における画素数が少なくなる欠点がある。この問題は、アパーチャー24の穴24aの大きさに応じて、カメラモジュール21に搭載するレンズについて焦点距離の合ったズームレンズを使用することにより解決される。
FIG. 26 shows a comparison of sample images with and without the
本発明の分光蛍光光度計は積分球を搭載し、積分球に設置した試料について、各種のスペクトルを取得しつつ、試料の蛍光画像をも取得する。試料は、積分球において励起光が直接照射されない位置に設置され、試料には積分球の内面で拡散反射した励起光が照射される。これにより、ムラを抑え励起光により、均一な状態で生じる蛍光により得られるスペクトルおよび試料画像を観察することができる。 The spectrofluorometer of the present invention is equipped with an integrating sphere, and while acquiring various spectra of a sample placed on the integrating sphere, it also acquires a fluorescence image of the sample. The sample is placed on the integrating sphere at a position where the excitation light is not directly irradiated, and the sample is irradiated with the excitation light diffusely reflected on the inner surface of the integrating sphere. This makes it possible to suppress unevenness and observe the spectrum and sample image obtained by the fluorescence generated in a uniform state by the excitation light.
さらに、本発明の分光蛍光光度計は、制御部が、蛍光の強度を示す各種のスペクトルと試料画像を含む測定データを処理することにより、表示部がスペクトルと試料画像とを、同一画面内で並べて表示することが可能である。これにより、測定の利便性、分析の効率性をさらに向上させることができる。 Further, in the spectrofluorometer of the present invention, the control unit processes measurement data including various spectra indicating the intensity of fluorescence and a sample image, so that the display unit displays the spectrum and the sample image on the same screen. It is possible to display them side by side. As a result, the convenience of measurement and the efficiency of analysis can be further improved.
また、本発明によれば、蛍光を検知してその信号強度とともに試料の試料画像を同時に取得する分光蛍光測定及び画像撮像方法が提供される。当該方法は、励起光を積分球の内面に入射させ、内面にて散乱した励起光を測定対象の試料に照射し、励起光が照射した試料から放出された蛍光を検知し、蛍光を放出する試料の試料画像を撮像するものである。これにより、測定の利便性、分析の効率性をさらに向上させることができる。 Further, according to the present invention, there is provided a spectrofluorescence measurement and image imaging method that detects fluorescence and simultaneously acquires a sample image of a sample together with the signal intensity thereof. In this method, the excitation light is incident on the inner surface of the integrating sphere, the excitation light scattered on the inner surface is irradiated to the sample to be measured, the fluorescence emitted from the sample irradiated with the excitation light is detected, and the fluorescence is emitted. It captures a sample image of a sample. As a result, the convenience of measurement and the efficiency of analysis can be further improved.
尚、上述の説明においては、制御部32が処理し、表示部42が表示する測定データは、光度計部10から得られたものであり、分光蛍光光度計1の測定データが処理及び表示の対象となる。しかしながら、本実施形態で述べた表示部42の各種の処理態様は、分光蛍光光度計の測定データのみに適用されるものではない。すなわち、本発明の概念は、試料に光を照射して試料を分析する一般的な光分析装置に適用可能であり、この光分析装置の測定結果を表示する、光分析装置用の表示装置として本発明を把握することも可能である。一般的な光分析装置には、分光蛍光光度計のみならず、分光光度計、蛍光光度計、X線測定装置、その他の装置が含まれる。
In the above description, the measurement data processed by the
上記の光分析装置用の表示装置は、一般的な制御部と、制御部が処理した測定データに基づく画像を表示する表示部とを含むものであり、測定データには、光の照射により試料が放出する出射光の強度を示すスペクトルと、撮像装置が撮像した試料の試料画像が少なくとも含まれる。上述の実施形態においては、出射光の強度は蛍光の強度に相当するものである。そして、表示部が、図8〜図10に示す実施形態の様に、スペクトルと試料画像とを、同一画面内で並べて表示する。 The display device for the above-mentioned optical analyzer includes a general control unit and a display unit that displays an image based on the measurement data processed by the control unit, and the measurement data includes a sample by irradiation with light. It includes at least a spectrum showing the intensity of the emitted light emitted by the imager and a sample image of the sample imaged by the imaging device. In the above-described embodiment, the intensity of the emitted light corresponds to the intensity of fluorescence. Then, the display unit displays the spectrum and the sample image side by side on the same screen as in the embodiment shown in FIGS. 8 to 10.
図8に示す例と同様にして、制御部は、励起波長軸や蛍光波長軸に相当する各種の光の波長軸の各波長に対応した複数の試料画像を含む試料画像一覧を生成する。表示部は、この波長軸に対応するように、試料画像一覧を並べて表示すればよい。図10に示す例と同様にして、制御部は、測定時間軸の各測定時間に対応した複数の試料画像を含む試料画像一覧を生成し、表示部は、スペクトルの測定時間軸に対応するように、試料画像一覧を並べて表示してもよい。 Similar to the example shown in FIG. 8, the control unit generates a sample image list including a plurality of sample images corresponding to each wavelength of various wavelength axes of light corresponding to the excitation wavelength axis and the fluorescence wavelength axis. The display unit may display the sample image list side by side so as to correspond to this wavelength axis. Similar to the example shown in FIG. 10, the control unit generates a sample image list including a plurality of sample images corresponding to each measurement time on the measurement time axis, and the display unit corresponds to the measurement time axis of the spectrum. The sample image list may be displayed side by side.
ここでの光分析装置用の表示装置は、図11(A)に示す様な三次元スペクトルも表示可能である。この三次元スペクトルは、第1の波長軸、第2の波長軸、スペクトル強度軸を含むものである。第1の波長軸は実施形態の励起波長軸に相当し、試料への入射光の波長に対応する。第2の波長軸は実施形態の蛍光波長軸に相当し、試料からの出射光の波長に対応する。スペクトル強度軸は、第1の波長軸と第2の波長軸によって定まる出射光の強度に対応する。尚、第1の波長軸、第2の波長軸とは異なり、スペクトル強度軸は明確に軸の形では表されていないが、紙面に垂直な方向に伸びる仮想的な軸に相当し、本実施形態においては当該軸に対応した等高線が表現されている。 The display device for the optical analyzer here can also display a three-dimensional spectrum as shown in FIG. 11 (A). This three-dimensional spectrum includes a first wavelength axis, a second wavelength axis, and a spectral intensity axis. The first wavelength axis corresponds to the excitation wavelength axis of the embodiment and corresponds to the wavelength of the incident light on the sample. The second wavelength axis corresponds to the fluorescence wavelength axis of the embodiment and corresponds to the wavelength of the emitted light from the sample. The spectral intensity axis corresponds to the intensity of the emitted light determined by the first wavelength axis and the second wavelength axis. Unlike the first wavelength axis and the second wavelength axis, the spectral intensity axis is not clearly represented in the form of an axis, but it corresponds to a virtual axis extending in the direction perpendicular to the paper surface, and this implementation is carried out. In the form, contour lines corresponding to the axes are represented.
制御部は、図11(A)に示す例と同様に、第1の波長軸と第2の波長軸の少なくともいずれかの各波長に対応した複数の試料画像を含む試料画像一覧を生成し、表示部は、第1の波長軸と第2の波長軸のいずれかに対応するように、試料画像一覧を並べて表示する。 Similar to the example shown in FIG. 11A, the control unit generates a sample image list including a plurality of sample images corresponding to at least one wavelength of the first wavelength axis and the second wavelength axis. The display unit displays a list of sample images side by side so as to correspond to either the first wavelength axis and the second wavelength axis.
また、ここでの光分析装置用の表示装置は、図17(A)に示す様な三次元スペクトルも表示可能である。この三次元スペクトルは、波長軸と、測定時間軸と、スペクトル強度軸を含むものである。波長軸は実施形態の蛍光波長軸に相当し、試料への入射光の波長に対応するが、試料からの出射光の波長に対応したものであってもよい。測定時間軸は実施形態のものと同じである。スペクトル強度軸は、波長軸と測定時間軸によって定まる出射光の強度に対応する。尚、波長軸、測定時間軸とは異なり、スペクトル強度軸は明確に軸の形では表されていないが、紙面に垂直な方向に伸びる仮想的な軸に相当し、本実施形態においては当該軸に対応した等高線が表現されている。 Further, the display device for the optical analyzer here can also display a three-dimensional spectrum as shown in FIG. 17 (A). This three-dimensional spectrum includes a wavelength axis, a measurement time axis, and a spectral intensity axis. The wavelength axis corresponds to the fluorescence wavelength axis of the embodiment and corresponds to the wavelength of the incident light on the sample, but may correspond to the wavelength of the emitted light from the sample. The measurement time axis is the same as that of the embodiment. The spectral intensity axis corresponds to the intensity of the emitted light determined by the wavelength axis and the measurement time axis. Unlike the wavelength axis and the measurement time axis, the spectral intensity axis is not clearly represented in the form of an axis, but corresponds to a virtual axis extending in a direction perpendicular to the paper surface, and in the present embodiment, the axis corresponds to the axis. The contour lines corresponding to are expressed.
制御部は、図17(A)に示す例と同様に、測定時間軸の各測定時間に対応した複数の試料画像を含む試料画像一覧を作成するが、波長軸の各波長に対応した試料画像一覧を作成してもよい。表示部は、波長軸と測定時間軸のいずれかに対応するように、試料画像一覧を並べて表示する。 Similar to the example shown in FIG. 17A, the control unit creates a sample image list including a plurality of sample images corresponding to each measurement time on the measurement time axis, but the sample image corresponding to each wavelength on the wavelength axis. You may create a list. The display unit displays a list of sample images side by side so as to correspond to either the wavelength axis or the measurement time axis.
さらにここでの光分析装置用の表示装置は、図11、図17に示す様な統合形式の測定データ表示(統合データ表示)を提供することも可能である。制御部が、図11(B)および(C)または図17(B)および(C)に相当する第1の二次元スペクトルと第2の二次元スペクトルを生成する。さらに制御部は、図11(A)または図17(A)に相当する第1の二次元スペクトル及び第2の二次元スペクトルに含まれる三つの軸から構成される三次元スペクトルを生成する。図11、図17に示す様に、表示部は、第1の二次元スペクトルと、第2の二次元スペクトルと、三次元スペクトルと、試料画像とを同一画面内で並べて表示する。さらに制御部は、第1の二次元スペクトルと、第2の二次元スペクトルと、三次元スペクトルとのいずれかの軸に対応した複数の試料画像を含む試料画像一覧を生成し、表示部は、軸に対応するように、試料画像一覧を並べて表示することが可能である。 Further, the display device for the optical analyzer here can also provide a measurement data display (integrated data display) in an integrated format as shown in FIGS. 11 and 17. The control unit generates a first two-dimensional spectrum and a second two-dimensional spectrum corresponding to FIGS. 11 (B) and (C) or FIGS. 17 (B) and (C). Further, the control unit generates a first two-dimensional spectrum corresponding to FIG. 11A or FIG. 17A and a three-dimensional spectrum composed of three axes included in the second two-dimensional spectrum. As shown in FIGS. 11 and 17, the display unit displays the first two-dimensional spectrum, the second two-dimensional spectrum, the three-dimensional spectrum, and the sample image side by side on the same screen. Further, the control unit generates a sample image list including a plurality of sample images corresponding to any of the axes of the first two-dimensional spectrum, the second two-dimensional spectrum, and the three-dimensional spectrum, and the display unit displays. It is possible to display the sample image list side by side so as to correspond to the axis.
尚、本発明は、上述した実施形態に限定されるものではなく、適宜、変形、改良、等が可能である。その他、上述した実施形態における各構成要素の材質、形状、寸法、数値、形態、数、配置箇所、等は本発明を達成できるものであれば任意であり、限定されない。 The present invention is not limited to the above-described embodiment, and can be appropriately modified, improved, and the like. In addition, the material, shape, size, numerical value, form, number, arrangement location, etc. of each component in the above-described embodiment are arbitrary and are not limited as long as the present invention can be achieved.
本発明に係る分光蛍光光度計および光分析装置の表示装置は、試料の実態を反映した優れたスペクトルと試料画像の双方を取得するとともに、測定の利便性を向上させることができ、さらには分析の効率性を向上させることができる。よって、光を用いた試料の分析技術がさらに洗練されたものとなる。 The display device of the spectrofluorometer and the optical analyzer according to the present invention can acquire both an excellent spectrum reflecting the actual state of the sample and a sample image, improve the convenience of measurement, and further analyze. Efficiency can be improved. Therefore, the sample analysis technique using light becomes more sophisticated.
1 分光蛍光光度計
10 光度計部
11 光源
12 励起側分光器
13 ビームスプリッタ
14 モニタ検知器
15 蛍光側分光器
16 検知器
20 積分球
21 カメラモジュール(撮像装置)
22 白板
23 試料保持部
24 アパーチャー
30 データ処理部
31 コンピュータ
32 制御部
40 操作部
1
22
Claims (9)
制御部と、
前記制御部が処理した測定データに基づく画像を表示する表示部と、
を備え、
前記測定データには、光の照射により試料が放出する出射光の強度を示すスペクトルと、撮像装置が撮像した試料の試料画像が少なくとも含まれ、
前記表示部は、前記スペクトルと前記試料画像とを、同一画面内で前記スペクトルの軸の値と、各々が当該値において得られる複数の試料画像を対応付けた状態で、当該軸に複数の試料画像が隣接するように並べて表示し、
前記制御部は、
第1の二次元スペクトルと、
第2の二次元スペクトルと、
前記第1の二次元スペクトル及び前記第2の二次元スペクトルに含まれる三つの軸から構成される三次元スペクトルと、を生成し、
前記表示部は、前記第1の二次元スペクトルと、前記第2の二次元スペクトルと、前記三次元スペクトルと、前記試料画像とを同一画面内で並べて表示し、
前記表示部は、前記第1の二次元スペクトル及び前記第2の二次元スペクトルのいずれかの軸に対応した所定の波長間隔又は時間間隔をもって複数の試料画像を取得し、
前記制御部は、前記第1の二次元スペクトル及び前記第2の二次元スペクトルのいずれかの波長軸又は測定時間軸に対応した複数の試料画像を含む試料画像一覧を生成し、
前記表示部は、前記第1の二次元スペクトル及び前記第2の二次元スペクトルの波長軸又は測定時間軸のいずれかに対応するように、前記試料画像一覧を並べて表示し、
前記表示部は、操作者が操作することにより、前記第1の二次元スペクトル及び前記第2の二次元スペクトルの波長軸又は測定時間軸における特定の波長又は時間の位置を選択可能な二つのトレースバーを、前記三次元スペクトル上に表示するとともに、
前記表示部は、前記二つのトレースバーのいずれかが位置する前記三次元スペクトルの波長又は測定時間における試料画像を、前記三次元スペクトルの波長軸又は測定時間軸に隣接して配置し、
前記表示部は、前記二つのトレースバーが選択した特定の波長又は時間の位置におけるスペクトルを前記第1の二次元スペクトル及び前記第2の二次元スペクトル上に表示する、
光分析装置用の表示装置。 A display device for an optical analyzer that displays the measurement results of an optical analyzer that irradiates a sample with light and analyzes the sample.
Control unit and
A display unit that displays an image based on the measurement data processed by the control unit, and
With
The measurement data includes at least a spectrum showing the intensity of the emitted light emitted by the sample by irradiation with light and a sample image of the sample captured by the imaging device.
The display unit associates the spectrum and the sample image with the value of the axis of the spectrum and a plurality of sample images obtained at the value on the same screen, and a plurality of samples are associated with the axis. Display the images side by side so that they are adjacent to each other.
The control unit
The first two-dimensional spectrum and
The second two-dimensional spectrum and
A three-dimensional spectrum composed of the first two-dimensional spectrum and the three axes included in the second two-dimensional spectrum is generated.
The display unit displays the first two-dimensional spectrum, the second two-dimensional spectrum, the three-dimensional spectrum, and the sample image side by side on the same screen.
The display unit acquires a plurality of sample images at a predetermined wavelength interval or time interval corresponding to any axis of the first two-dimensional spectrum and the second two-dimensional spectrum.
The control unit generates a sample image list including a plurality of sample images corresponding to either the wavelength axis or the measurement time axis of the first two-dimensional spectrum and the second two-dimensional spectrum.
The display unit displays the sample image list side by side so as to correspond to either the wavelength axis or the measurement time axis of the first two-dimensional spectrum and the second two-dimensional spectrum.
The display unit has two traces that can be operated by an operator to select the position of a specific wavelength or time on the wavelength axis or the measurement time axis of the first two-dimensional spectrum and the second two-dimensional spectrum. The bar is displayed on the three-dimensional spectrum and is displayed.
The display unit arranges a sample image at the wavelength or measurement time of the three-dimensional spectrum in which either of the two trace bars is located adjacent to the wavelength axis or measurement time axis of the three-dimensional spectrum.
The display unit displays the spectrum at the position of the two specific wavelength trace bar has selected or time before Symbol first two-dimensional spectrum and the second on a two-dimensional spectrum,
Display device for optical analyzers.
制御部と、
前記制御部が処理した測定データに基づく画像を表示する表示部と、
を備え、
前記測定データには、光の照射により試料が放出する出射光の強度を示すスペクトルと、撮像装置が撮像した試料の試料画像が少なくとも含まれ、
前記表示部は、前記スペクトルと前記試料画像とを、同一画面内で前記スペクトルの軸の値と、各々が当該値に対応した複数の試料画像を対応付けた状態で並べて表示し、
前記制御部は、前記スペクトルの波長軸の各波長に対応した複数の試料画像を含む試料画像一覧を生成し、
前記表示部は、前記スペクトルの波長軸に対応するように、前記試料画像一覧を並べて表示する、光分析装置用の表示装置。 A display device for an optical analyzer that displays the measurement results of an optical analyzer that irradiates a sample with light and analyzes the sample.
Control unit and
A display unit that displays an image based on the measurement data processed by the control unit, and
With
The measurement data includes at least a spectrum showing the intensity of the emitted light emitted by the sample by irradiation with light and a sample image of the sample captured by the imaging device.
The display unit displays the spectrum and the sample image side by side on the same screen in a state in which the values of the axes of the spectrum and a plurality of sample images corresponding to the values are associated with each other.
The control unit generates a sample image list including a plurality of sample images corresponding to each wavelength of the wavelength axis of the spectrum.
The display unit is a display device for an optical analyzer that displays a list of sample images side by side so as to correspond to the wavelength axis of the spectrum.
前記制御部は、前記スペクトルの測定時間軸の各測定時間に対応した複数の試料画像を含む試料画像一覧を生成し、
前記表示部は、前記スペクトルの測定時間軸に対応するように、前記試料画像一覧を並べて表示する、光分析装置用の表示装置。 The display device for the optical analyzer according to claim 1.
The control unit generates a sample image list including a plurality of sample images corresponding to each measurement time on the measurement time axis of the spectrum.
The display unit is a display device for an optical analyzer that displays the sample image list side by side so as to correspond to the measurement time axis of the spectrum.
制御部と、
前記制御部が処理した測定データに基づく画像を表示する表示部と、
を備え、
前記測定データには、光の照射により試料が放出する出射光の強度を示すスペクトルと、撮像装置が撮像した試料の試料画像が少なくとも含まれ、
前記表示部は、前記スペクトルと前記試料画像とを、同一画面内で前記スペクトルの軸の値と、各々が当該値に対応した複数の試料画像を対応付けた状態で並べて表示し、
前記スペクトルは、
前記試料への入射光の波長に対応した第1の波長軸と、
前記試料からの出射光の波長に対応した第2の波長軸と、
前記第1の波長軸と前記第2の波長軸によって定まる前記強度に対応したスペクトル強度軸とを含む三次元スペクトルであり、
前記制御部は、前記第1の波長軸と前記第2の波長軸の少なくともいずれかの各波長に対応した複数の試料画像を含む試料画像一覧を生成し、
前記表示部は、前記第1の波長軸と前記第2の波長軸のいずれかに対応するように、前記試料画像一覧を並べて表示する、光分析装置用の表示装置。 A display device for an optical analyzer that displays the measurement results of an optical analyzer that irradiates a sample with light and analyzes the sample.
Control unit and
A display unit that displays an image based on the measurement data processed by the control unit, and
With
The measurement data includes at least a spectrum showing the intensity of the emitted light emitted by the sample by irradiation with light and a sample image of the sample captured by the imaging device.
The display unit displays the spectrum and the sample image side by side on the same screen in a state in which the values of the axes of the spectrum and a plurality of sample images corresponding to the values are associated with each other.
The spectrum is
A first wavelength axis corresponding to the wavelength of the incident light on the sample,
A second wavelength axis corresponding to the wavelength of the emitted light from the sample,
It is a three-dimensional spectrum including the first wavelength axis and the spectral intensity axis corresponding to the intensity determined by the second wavelength axis.
The control unit generates a sample image list including a plurality of sample images corresponding to at least one wavelength of the first wavelength axis and the second wavelength axis.
The display unit is a display device for an optical analyzer that displays a list of sample images side by side so as to correspond to either the first wavelength axis or the second wavelength axis.
制御部と、
前記制御部が処理した測定データに基づく画像を表示する表示部と、
を備え、
前記測定データには、光の照射により試料が放出する出射光の強度を示すスペクトルと、撮像装置が撮像した試料の試料画像が少なくとも含まれ、
前記表示部は、前記スペクトルと前記試料画像とを、同一画面内で前記スペクトルの軸の値と、各々が当該値に対応した複数の試料画像を対応付けた状態で並べて表示し、
前記スペクトルは、
前記試料への入射光の波長または前記試料からの出射光の波長に対応した波長軸と、
測定時間に対応した測定時間軸と、
前記波長軸と前記測定時間軸によって定まる前記強度に対応したスペクトル強度軸とを含む三次元スペクトルであり、
前記制御部は、前記波長軸と前記測定時間軸の少なくともいずれかの各波長または各測定時間に対応した複数の試料画像を含む試料画像一覧を作成し、
前記表示部は、前記波長軸と前記測定時間軸のいずれかに対応するように、前記試料画像一覧を並べて表示する、光分析装置用の表示装置。 A display device for an optical analyzer that displays the measurement results of an optical analyzer that irradiates a sample with light and analyzes the sample.
Control unit and
A display unit that displays an image based on the measurement data processed by the control unit, and
With
The measurement data includes at least a spectrum showing the intensity of the emitted light emitted by the sample by irradiation with light and a sample image of the sample captured by the imaging device.
The display unit displays the spectrum and the sample image side by side on the same screen in a state in which the values of the axes of the spectrum and a plurality of sample images corresponding to the values are associated with each other.
The spectrum is
A wavelength axis corresponding to the wavelength of the incident light on the sample or the wavelength of the emitted light from the sample.
The measurement time axis corresponding to the measurement time and
It is a three-dimensional spectrum including the wavelength axis and the spectral intensity axis corresponding to the intensity determined by the measurement time axis.
The control unit creates a sample image list including a plurality of sample images corresponding to each wavelength of at least one of the wavelength axis and the measurement time axis or each measurement time.
The display unit is a display device for an optical analyzer that displays a list of sample images side by side so as to correspond to either the wavelength axis or the measurement time axis.
前記制御部は、前記第1の二次元スペクトルと、前記第2の二次元スペクトルと、前記三次元スペクトルとのいずれかの軸に対応した複数の試料画像を含む試料画像一覧を生成し、
前記表示部は、前記軸に対応するように、前記試料画像一覧を並べて表示する、光分析装置用の表示装置。 The display device for the optical analyzer according to claim 1.
The control unit generates a sample image list including a plurality of sample images corresponding to any of the axes of the first two-dimensional spectrum, the second two-dimensional spectrum, and the three-dimensional spectrum.
The display unit is a display device for an optical analyzer that displays a list of sample images side by side so as to correspond to the axis.
前記制御部は、前記試料画像中の背景領域を特定の色で塗りつぶす処理を行う、光分析装置用の表示装置。 The display device for the optical analyzer according to claim 1.
The control unit is a display device for an optical analyzer that performs a process of filling a background area in the sample image with a specific color.
前記表示部は、複数の試料の各々に対応した前記スペクトルと前記試料画像を、同一画面内で並べて表示する、
光分析装置用の表示装置。 The display device for the optical analyzer according to claim 1.
The display unit displays the spectrum corresponding to each of the plurality of samples and the sample image side by side on the same screen.
Display device for optical analyzers.
基準反射物に光を照射して、得られる光量を100%の値としてベースラインを取得し、
光の照射により試料が反射する光量の変化を前記ベースラインの光量と比演算して反射率を計測し、
前記スペクトルとして、当該反射率に基づく反射スペクトルを表示する、
光分析装置用の表示装置。 The display device for the optical analyzer according to claim 1.
Irradiate the reference reflector with light, obtain a baseline with the obtained amount of light as a value of 100%, and obtain a baseline.
The change in the amount of light reflected by the sample due to irradiation with light is calculated by ratio with the amount of light at the baseline to measure the reflectance.
As the spectrum, a reflection spectrum based on the reflectance is displayed.
Display device for optical analyzers.
Priority Applications (3)
| Application Number | Priority Date | Filing Date | Title |
|---|---|---|---|
| JP2017141930A JP6919890B2 (en) | 2017-07-21 | 2017-07-21 | Display device for optical analyzer |
| EP18184563.7A EP3431966B1 (en) | 2017-07-21 | 2018-07-19 | Display device for photometric analyzer |
| US16/041,665 US10876967B2 (en) | 2017-07-21 | 2018-07-20 | Display device for photometric analyzer |
Applications Claiming Priority (1)
| Application Number | Priority Date | Filing Date | Title |
|---|---|---|---|
| JP2017141930A JP6919890B2 (en) | 2017-07-21 | 2017-07-21 | Display device for optical analyzer |
Publications (3)
| Publication Number | Publication Date |
|---|---|
| JP2019020363A JP2019020363A (en) | 2019-02-07 |
| JP2019020363A5 JP2019020363A5 (en) | 2019-08-08 |
| JP6919890B2 true JP6919890B2 (en) | 2021-08-18 |
Family
ID=63012946
Family Applications (1)
| Application Number | Title | Priority Date | Filing Date |
|---|---|---|---|
| JP2017141930A Active JP6919890B2 (en) | 2017-07-21 | 2017-07-21 | Display device for optical analyzer |
Country Status (3)
| Country | Link |
|---|---|
| US (1) | US10876967B2 (en) |
| EP (1) | EP3431966B1 (en) |
| JP (1) | JP6919890B2 (en) |
Families Citing this family (5)
| Publication number | Priority date | Publication date | Assignee | Title |
|---|---|---|---|---|
| JP7197134B2 (en) * | 2019-03-12 | 2022-12-27 | 株式会社日立ハイテクサイエンス | Fluorometer and observation method |
| JP7284457B2 (en) * | 2019-09-02 | 2023-05-31 | 株式会社日立ハイテクサイエンス | Quantum efficiency distribution acquisition method, quantum efficiency distribution display method, quantum efficiency distribution acquisition program, quantum efficiency distribution display program, spectrofluorophotometer and display device |
| EP4055370A1 (en) * | 2019-11-06 | 2022-09-14 | Uster Technologies AG | Apparatus and method for optically characterizing a textile sample |
| JP2022102776A (en) * | 2020-12-25 | 2022-07-07 | 株式会社日立ハイテクサイエンス | Spectrophotofluorometer, spectral fluorescence measurement method, and image imaging method |
| WO2023176174A1 (en) * | 2022-03-16 | 2023-09-21 | コニカミノルタ株式会社 | Analysis system and object analysis method |
Family Cites Families (21)
| Publication number | Priority date | Publication date | Assignee | Title |
|---|---|---|---|---|
| US5049738A (en) * | 1988-11-21 | 1991-09-17 | Conoco Inc. | Laser-enhanced oil correlation system |
| JP2799191B2 (en) * | 1989-08-24 | 1998-09-17 | オリンパス光学工業株式会社 | Method for forming two-dimensional concentration distribution image of intracellular ions |
| US5784162A (en) * | 1993-08-18 | 1998-07-21 | Applied Spectral Imaging Ltd. | Spectral bio-imaging methods for biological research, medical diagnostics and therapy |
| US6717668B2 (en) * | 2000-03-07 | 2004-04-06 | Chemimage Corporation | Simultaneous imaging and spectroscopy apparatus |
| US6826424B1 (en) * | 2000-12-19 | 2004-11-30 | Haishan Zeng | Methods and apparatus for fluorescence and reflectance imaging and spectroscopy and for contemporaneous measurements of electromagnetic radiation with multiple measuring devices |
| JP2005204958A (en) * | 2004-01-23 | 2005-08-04 | Pentax Corp | Autofluorescently observable electronic endoscope apparatus and system |
| US20060253261A1 (en) * | 2004-05-05 | 2006-11-09 | Chem Image Corporation | Digitizing biology |
| JP4459710B2 (en) * | 2004-05-11 | 2010-04-28 | Hoya株式会社 | Fluorescence observation endoscope device |
| AU2006245251B2 (en) * | 2005-05-12 | 2009-10-08 | Olympus Medical Systems Corp. | Biometric instrument |
| US7477378B2 (en) * | 2005-09-27 | 2009-01-13 | Chemimage Corporation | Method for correlating spectroscopic measurements with digital images of contrast enhanced tissue |
| JP2007232716A (en) * | 2006-02-03 | 2007-09-13 | Tokyo Institute Of Technology | Method of measuring oxygen concentration and/or oxygen distribution in sample |
| US7687769B2 (en) * | 2007-01-19 | 2010-03-30 | Schlumberger Technology Corporation | Methods and apparatus for multi dimension fluorescence spectrum measurement and correlations downhole |
| JP5215939B2 (en) * | 2009-05-26 | 2013-06-19 | 株式会社日立ハイテクノロジーズ | Spectrofluorometer and spectrophotometer |
| JP5432793B2 (en) * | 2010-03-29 | 2014-03-05 | オリンパス株式会社 | Fluorescence endoscope device |
| JP5445348B2 (en) * | 2010-06-23 | 2014-03-19 | 株式会社島津製作所 | Fluorescence spectrophotometer |
| JP5867073B2 (en) | 2011-12-28 | 2016-02-24 | 富士通株式会社 | Resin cure state monitoring device and resin cure state monitoring method |
| JP2013137119A (en) | 2011-12-28 | 2013-07-11 | Daikin Industries Ltd | Air conditioning device |
| WO2013190618A1 (en) * | 2012-06-18 | 2013-12-27 | 株式会社島津製作所 | Spectrophotofluorometer |
| WO2015103614A2 (en) * | 2014-01-06 | 2015-07-09 | The Florida International University Board Of Trustees | Near infrared optical imaging system for hemodynamic imaging, pulse monitoring, and mapping spatio-temporal features |
| JP2017026495A (en) * | 2015-07-23 | 2017-02-02 | 株式会社東芝 | Degradation information acquisition device, degradation information acquisition system, degradation information acquisition method and degradation information acquisition program |
| WO2017056830A1 (en) | 2015-10-02 | 2017-04-06 | シャープ株式会社 | Fluorescence detection device |
-
2017
- 2017-07-21 JP JP2017141930A patent/JP6919890B2/en active Active
-
2018
- 2018-07-19 EP EP18184563.7A patent/EP3431966B1/en active Active
- 2018-07-20 US US16/041,665 patent/US10876967B2/en active Active
Also Published As
| Publication number | Publication date |
|---|---|
| EP3431966A1 (en) | 2019-01-23 |
| EP3431966B1 (en) | 2021-06-30 |
| US10876967B2 (en) | 2020-12-29 |
| JP2019020363A (en) | 2019-02-07 |
| US20190025209A1 (en) | 2019-01-24 |
Similar Documents
| Publication | Publication Date | Title |
|---|---|---|
| JP6656210B2 (en) | Spectrofluorometer | |
| JP6919890B2 (en) | Display device for optical analyzer | |
| US11181480B2 (en) | Raman spectroscopy for minerals identification | |
| CN103649726B (en) | For fluorescence and the system and method for absorptance analysis | |
| US20080272312A1 (en) | Hyperspectral fluorescence and absorption bioimaging | |
| US10663345B2 (en) | Raman spectroscopy for minerals identification | |
| JP2010151801A (en) | Raman imaging apparatus | |
| WO2011027568A1 (en) | Spectrophotofluorometer | |
| JP7197134B2 (en) | Fluorometer and observation method | |
| JP2013003386A (en) | Image pickup apparatus and virtual slide device | |
| US11366013B2 (en) | Method of obtaining quantum efficiency distribution, method of displaying quantum efficiency distribution, program for obtaining quantum efficiency distribution, program for displaying quantum efficiency distribution, fluorescence spectrophotometer, and display device | |
| US11906428B2 (en) | Spectrofluorophotometer, spectrofluoro-measurement method, and image capturing method | |
| JPS58143254A (en) | Substance identifying device | |
| JP2021044694A (en) | Fluorescence photography device | |
| JP5033531B2 (en) | Spectrofluorometer | |
| US11879777B2 (en) | Cellphone-based raman spectrometer system for the detection and identification of chemical and biological molecules | |
| US20230003660A1 (en) | Method for optical monitoring and/or determination of properties of sample | |
| CN109477797B (en) | Light measuring device | |
| EP4014017A2 (en) | Raman spectroscopy for minerals identification | |
| JPH10227694A (en) | Luminescence identifying apparatus | |
| KR20200136032A (en) | Optical device capable of simultaneous measurement of object angle and spectral emission | |
| JP2019027886A (en) | Radiation characteristic measurement system and radiation characteristic measurement method |
Legal Events
| Date | Code | Title | Description |
|---|---|---|---|
| A521 | Written amendment |
Free format text: JAPANESE INTERMEDIATE CODE: A523 Effective date: 20190627 |
|
| A621 | Written request for application examination |
Free format text: JAPANESE INTERMEDIATE CODE: A621 Effective date: 20190627 |
|
| A871 | Explanation of circumstances concerning accelerated examination |
Free format text: JAPANESE INTERMEDIATE CODE: A871 Effective date: 20190627 |
|
| A975 | Report on accelerated examination |
Free format text: JAPANESE INTERMEDIATE CODE: A971005 Effective date: 20190709 |
|
| A131 | Notification of reasons for refusal |
Free format text: JAPANESE INTERMEDIATE CODE: A131 Effective date: 20190910 |
|
| A521 | Written amendment |
Free format text: JAPANESE INTERMEDIATE CODE: A523 Effective date: 20191105 |
|
| A131 | Notification of reasons for refusal |
Free format text: JAPANESE INTERMEDIATE CODE: A131 Effective date: 20200114 |
|
| A521 | Written amendment |
Free format text: JAPANESE INTERMEDIATE CODE: A523 Effective date: 20200316 |
|
| A131 | Notification of reasons for refusal |
Free format text: JAPANESE INTERMEDIATE CODE: A131 Effective date: 20200602 |
|
| A02 | Decision of refusal |
Free format text: JAPANESE INTERMEDIATE CODE: A02 Effective date: 20201006 |
|
| A521 | Written amendment |
Free format text: JAPANESE INTERMEDIATE CODE: A523 Effective date: 20210106 |
|
| C60 | Trial request (containing other claim documents, opposition documents) |
Free format text: JAPANESE INTERMEDIATE CODE: C60 Effective date: 20210106 |
|
| A911 | Transfer to examiner for re-examination before appeal (zenchi) |
Free format text: JAPANESE INTERMEDIATE CODE: A911 Effective date: 20210115 |
|
| C21 | Notice of transfer of a case for reconsideration by examiners before appeal proceedings |
Free format text: JAPANESE INTERMEDIATE CODE: C21 Effective date: 20210119 |
|
| A131 | Notification of reasons for refusal |
Free format text: JAPANESE INTERMEDIATE CODE: A131 Effective date: 20210209 |
|
| A521 | Written amendment |
Free format text: JAPANESE INTERMEDIATE CODE: A523 Effective date: 20210409 |
|
| TRDD | Decision of grant or rejection written | ||
| A01 | Written decision to grant a patent or to grant a registration (utility model) |
Free format text: JAPANESE INTERMEDIATE CODE: A01 Effective date: 20210615 |
|
| A61 | First payment of annual fees (during grant procedure) |
Free format text: JAPANESE INTERMEDIATE CODE: A61 Effective date: 20210715 |
|
| R150 | Certificate of patent or registration of utility model |
Ref document number: 6919890 Country of ref document: JP Free format text: JAPANESE INTERMEDIATE CODE: R150 |