JP6850757B2 - Demand forecasting system and method - Google Patents
Demand forecasting system and method Download PDFInfo
- Publication number
- JP6850757B2 JP6850757B2 JP2018055391A JP2018055391A JP6850757B2 JP 6850757 B2 JP6850757 B2 JP 6850757B2 JP 2018055391 A JP2018055391 A JP 2018055391A JP 2018055391 A JP2018055391 A JP 2018055391A JP 6850757 B2 JP6850757 B2 JP 6850757B2
- Authority
- JP
- Japan
- Prior art keywords
- event
- demand
- forecast
- value
- model
- Prior art date
- Legal status (The legal status is an assumption and is not a legal conclusion. Google has not performed a legal analysis and makes no representation as to the accuracy of the status listed.)
- Active
Links
- 238000000034 method Methods 0.000 title claims description 12
- 230000000694 effects Effects 0.000 claims description 61
- 230000000737 periodic effect Effects 0.000 claims description 29
- 238000005457 optimization Methods 0.000 claims description 9
- 238000004590 computer program Methods 0.000 claims description 2
- 238000012217 deletion Methods 0.000 claims description 2
- 230000037430 deletion Effects 0.000 claims description 2
- 238000007726 management method Methods 0.000 description 21
- 230000008859 change Effects 0.000 description 8
- 238000004891 communication Methods 0.000 description 6
- 230000006870 function Effects 0.000 description 6
- 230000002776 aggregation Effects 0.000 description 5
- 238000004220 aggregation Methods 0.000 description 5
- 230000002354 daily effect Effects 0.000 description 5
- 230000007774 longterm Effects 0.000 description 5
- 230000004048 modification Effects 0.000 description 5
- 238000012986 modification Methods 0.000 description 5
- 230000007423 decrease Effects 0.000 description 4
- 230000015654 memory Effects 0.000 description 4
- 238000012545 processing Methods 0.000 description 4
- 239000002245 particle Substances 0.000 description 3
- 230000009286 beneficial effect Effects 0.000 description 2
- 238000010586 diagram Methods 0.000 description 2
- 239000000284 extract Substances 0.000 description 2
- 230000006872 improvement Effects 0.000 description 2
- 230000001932 seasonal effect Effects 0.000 description 2
- 239000007787 solid Substances 0.000 description 2
- 238000004364 calculation method Methods 0.000 description 1
- 238000012937 correction Methods 0.000 description 1
- 230000003203 everyday effect Effects 0.000 description 1
- 238000000605 extraction Methods 0.000 description 1
- 230000006855 networking Effects 0.000 description 1
- 230000002093 peripheral effect Effects 0.000 description 1
- 238000001556 precipitation Methods 0.000 description 1
- 230000004044 response Effects 0.000 description 1
Images


Classifications
-
- G—PHYSICS
- G06—COMPUTING; CALCULATING OR COUNTING
- G06Q—INFORMATION AND COMMUNICATION TECHNOLOGY [ICT] SPECIALLY ADAPTED FOR ADMINISTRATIVE, COMMERCIAL, FINANCIAL, MANAGERIAL OR SUPERVISORY PURPOSES; SYSTEMS OR METHODS SPECIALLY ADAPTED FOR ADMINISTRATIVE, COMMERCIAL, FINANCIAL, MANAGERIAL OR SUPERVISORY PURPOSES, NOT OTHERWISE PROVIDED FOR
- G06Q30/00—Commerce
- G06Q30/02—Marketing; Price estimation or determination; Fundraising
-
- G—PHYSICS
- G06—COMPUTING; CALCULATING OR COUNTING
- G06Q—INFORMATION AND COMMUNICATION TECHNOLOGY [ICT] SPECIALLY ADAPTED FOR ADMINISTRATIVE, COMMERCIAL, FINANCIAL, MANAGERIAL OR SUPERVISORY PURPOSES; SYSTEMS OR METHODS SPECIALLY ADAPTED FOR ADMINISTRATIVE, COMMERCIAL, FINANCIAL, MANAGERIAL OR SUPERVISORY PURPOSES, NOT OTHERWISE PROVIDED FOR
- G06Q10/00—Administration; Management
- G06Q10/04—Forecasting or optimisation specially adapted for administrative or management purposes, e.g. linear programming or "cutting stock problem"
-
- G—PHYSICS
- G06—COMPUTING; CALCULATING OR COUNTING
- G06Q—INFORMATION AND COMMUNICATION TECHNOLOGY [ICT] SPECIALLY ADAPTED FOR ADMINISTRATIVE, COMMERCIAL, FINANCIAL, MANAGERIAL OR SUPERVISORY PURPOSES; SYSTEMS OR METHODS SPECIALLY ADAPTED FOR ADMINISTRATIVE, COMMERCIAL, FINANCIAL, MANAGERIAL OR SUPERVISORY PURPOSES, NOT OTHERWISE PROVIDED FOR
- G06Q10/00—Administration; Management
- G06Q10/06—Resources, workflows, human or project management; Enterprise or organisation planning; Enterprise or organisation modelling
- G06Q10/063—Operations research, analysis or management
- G06Q10/0631—Resource planning, allocation, distributing or scheduling for enterprises or organisations
-
- G—PHYSICS
- G06—COMPUTING; CALCULATING OR COUNTING
- G06Q—INFORMATION AND COMMUNICATION TECHNOLOGY [ICT] SPECIALLY ADAPTED FOR ADMINISTRATIVE, COMMERCIAL, FINANCIAL, MANAGERIAL OR SUPERVISORY PURPOSES; SYSTEMS OR METHODS SPECIALLY ADAPTED FOR ADMINISTRATIVE, COMMERCIAL, FINANCIAL, MANAGERIAL OR SUPERVISORY PURPOSES, NOT OTHERWISE PROVIDED FOR
- G06Q30/00—Commerce
- G06Q30/02—Marketing; Price estimation or determination; Fundraising
- G06Q30/0201—Market modelling; Market analysis; Collecting market data
- G06Q30/0202—Market predictions or forecasting for commercial activities
-
- H—ELECTRICITY
- H04—ELECTRIC COMMUNICATION TECHNIQUE
- H04L—TRANSMISSION OF DIGITAL INFORMATION, e.g. TELEGRAPHIC COMMUNICATION
- H04L41/00—Arrangements for maintenance, administration or management of data switching networks, e.g. of packet switching networks
- H04L41/14—Network analysis or design
- H04L41/147—Network analysis or design for predicting network behaviour
Landscapes
- Business, Economics & Management (AREA)
- Engineering & Computer Science (AREA)
- Strategic Management (AREA)
- Economics (AREA)
- Human Resources & Organizations (AREA)
- Entrepreneurship & Innovation (AREA)
- Development Economics (AREA)
- Theoretical Computer Science (AREA)
- General Business, Economics & Management (AREA)
- Marketing (AREA)
- Game Theory and Decision Science (AREA)
- General Physics & Mathematics (AREA)
- Physics & Mathematics (AREA)
- Accounting & Taxation (AREA)
- Finance (AREA)
- Tourism & Hospitality (AREA)
- Quality & Reliability (AREA)
- Operations Research (AREA)
- Educational Administration (AREA)
- Computer Networks & Wireless Communication (AREA)
- Signal Processing (AREA)
- Data Mining & Analysis (AREA)
- Management, Administration, Business Operations System, And Electronic Commerce (AREA)
Description
本発明は、概して、将来の需要を予測する技術に関する。 The present invention generally relates to techniques for predicting future demand.
コンサート、フェスティバルに代表されるイベントは主に数時間〜数日の期間で交通機関の利用者数(需要)に大きな影響を与えることが知られている。仮に将来発生するイベントが既知の場合、イベント効果を加味し、需要予測を行うことで予測精度を向上させることができる。例えば、需要予測システムとして次のような方法が提案されている。 It is known that events such as concerts and festivals have a great influence on the number of transportation users (demand) mainly in a period of several hours to several days. If an event that will occur in the future is known, the prediction accuracy can be improved by taking into account the event effect and performing a demand forecast. For example, the following method has been proposed as a demand forecasting system.
特許文献1では、過去に発生したイベント効果(特徴モデル)と将来発生するイベント予定を登録し、それらを元にイベント時における需要予測を行っている。しかしながら、大規模な都市で開催されるイベントは大小含めると無数にあるため、全てのイベントを1つ1つ登録することは登録作業コスト(登録作業の負担)が大きい。
In
一方、特許文献2では、イベント予定の登録がない場合においても、イベントが発生しているかどうかを当日の時系列のパタンから判断している。発生イベントを特定し、精度良く需要予測を行うためには、イベント時の時系列パタンを起こり得るイベントの数だけ定義する必要がある。そのため、特許文献1と同様に登録作業コストが大きい。また、特許文献2では、当日の時系列データを用いる必要があるため、将来(例えば、数週間〜数ヶ月先)の需要の予測を行うことはできない。
On the other hand, in
そこで、本発明は、イベント予定の事前登録が無くても、将来(例えば、数週間〜数ヶ月先)の需要予測を高精度に行うことを目的とする。 Therefore, it is an object of the present invention to perform future demand forecasting with high accuracy (for example, several weeks to several months ahead) even if there is no pre-registration of the event schedule.
イベントデータ作成部および需要予測部を備えた需要予測システムが構築される。イベントデータ作成部は、過去の時系列の需要実績値を示す需要実績データを基に基準値を作成し、当該基準値との差分がしきい値を超える1以上の需要実績値を探し、見つかった1以上の需要実績値に対応した1以上の時刻に従う1以上の期間を1以上のイベント発生期間したイベントデータを作成することを、複数の対象の各々について行う。需要予測部は、複数の対象のうちのいずれかの対象と将来の時期との指定を受け付け、当該指定された対象について、当該指定された対象に対応したイベントデータを基に、将来の時期でのイベントの発生有無と、イベントが発生するのであれば当該イベントが需要実績値に与える影響であるイベント効果との予測であるイベント予測を行う。需要予測部は、当該イベント予測の結果を基に将来の時期での需要の予測である需要予測を行い、当該需要予測の結果として予測された需要を表す需要結果情報を出力する。 A demand forecasting system equipped with an event data creation unit and a demand forecasting unit is constructed. The event data creation unit creates a reference value based on the actual demand data showing the actual demand value in the past time series, searches for and finds one or more actual demand values whose difference from the reference value exceeds the threshold value. It is performed for each of a plurality of objects to create event data in which one or more events occur in one or more periods according to one or more times corresponding to one or more actual demand values. The demand forecasting department accepts the designation of one of the multiple targets and the future time, and for the specified target, at the future time based on the event data corresponding to the specified target. If an event occurs, event prediction is performed, which is a prediction of whether or not the event has occurred and the event effect, which is the effect of the event on the actual demand value. The demand forecasting unit performs demand forecasting, which is a forecasting of demand in a future period, based on the result of the event forecasting, and outputs demand result information representing the forecasted demand as a result of the demand forecasting.
イベント予定の事前登録が無くても、将来の需要予測を高精度に行うことができる。 Even if there is no pre-registration of the event schedule, future demand forecasting can be performed with high accuracy.
以降、本発明の幾つかの実施形態を、図を参照しながら説明する。以降の実施形態では、駅利用者の需要予測を例として採用している。しかしながら、本発明の適用範囲は、駅に限定されることなく、例えば、物流分野の需給予測(在庫管理)や機器レンタルの需給予測などにも適用可能である。
[実施形態1]
Hereinafter, some embodiments of the present invention will be described with reference to the drawings. In the following embodiments, the demand forecast of station users is adopted as an example. However, the scope of application of the present invention is not limited to stations, and can be applied to, for example, supply and demand forecasting (inventory control) in the logistics field and supply and demand forecasting of equipment rental.
[Embodiment 1]
(需要予測システム) (Demand forecast system)
図1に沿って、実施形態1に係る需要予測システム1の構成等を説明する。
The configuration of the
需要予測システム1は、例えば、一般的なコンピュータを用いて実現可能である。需要予測システム1は、中央制御装置11、入力装置(例えば、キーボードおよびマウス)12、出力装置(例えば、ディスプレイ)13、通信装置14、主記憶装置15、および、補助記憶装置16を有する。これらの装置11〜16は、バスによって相互に接続されている。なお、通信装置14は、1以上の通信インターフェースデバイスでよい。1以上の通信インターフェースデバイスは、1以上の同種の通信インターフェースデバイス(例えば1以上のNIC(Network Interface Card))であってもよいし2以上の異種の通信インターフェースデバイス(例えばNICとHBA(Host Bus Adapter))であってもよい。主記憶装置15は、1以上のメモリでよい。1以上のメモリの少なくとも1つは、不揮発性のメモリでもよい。補助記憶装置16は、1以上の不揮発性記憶デバイスでよい。各不揮発記憶デバイスは、HDD(Hard Disk Drive)またはSSD(Solid State Drive)でよい。中央制御装置11は、1以上のプロセッサ(例えば、CPU(Central Processing Unit)でよい。
The
主記憶装置15における1以上のコンピュータプログラムが中央制御装置11によって実行されることで、トレンドモデル作成部21、周期性モデル作成部22、イベントデータ作成部23、および、需要予測部24といった機能が実現される。以降、「○○部」は、中央制御装置11が、補助記憶装置16から1以上のプログラムを読み出し、当該1以上のプログラムを主記憶装置15にロードし、当該1以上のプログラムを実行することで、実現されるものとする。
By executing one or more computer programs in the
補助記憶装置16は、需要実績テーブル31、イベントテーブル32、モデル管理テーブル33、需要予測結果テーブル34を記憶する。なお、以降の説明において、各テーブルの構成は一例であり、1つのテーブルは、2以上のテーブルに分割されてもよいし、2以上のテーブルの全部又は一部が1つのテーブルであってもよい。また、テーブル以外のデータ構造が採用されてもよい。
The
需要予測システム1は、ネットワーク4を介して、外部システム2及び外部サーバ3と通信可能である。ここで、外部システム2とは、例えば、実施形態2における運行最適化システム910(図13(A)参照)である。需要予測結果に合わせた運行最適化が可能となる。外部サーバ3とは、例えば、人流集計サーバであり、人流集計サーバに格納された人流集計履歴を、ネットワークを介して需要実績テーブル31として活用することも可能である。また、必要に応じてカレンダー情報を外部サーバ3から取得してもよい。
The
(需要実績テーブル) (Demand record table)
需要実績テーブル31は、需要予測システム1の入力データとしての需要実績データの集合である。図2に沿って、需要実績テーブル31を説明する。
The demand record table 31 is a set of demand record data as input data of the
需要実績テーブル31は、複数の駅(複数の対象の一例)の各々について過去の時系列の人数(需要実績値の一例)を示す需要実績データの集合である。例えば、需要実績テーブル31を構成する各レコードには、例えば、日付欄101、駅名欄102および人数欄103がある。日付欄101には日付が、駅名欄102には駅名が、人数欄103には日付および駅に紐付いた人数(駅利用者数)が記憶されている。
The demand record table 31 is a set of demand record data showing the number of people in the past time series (an example of the demand record value) for each of the plurality of stations (an example of a plurality of targets). For example, each record constituting the demand record table 31 has, for example, a
なお、図2では、1日単位で集計した例を記載しているが、需要実績データは1日単位の集計に限定されるものではない。例えば、需要実績テーブル31における需要実績データは、1時間単位など1日未満で集計した需要実績データや、1週間単位などの複数日で集計した需要実績データでもよい。 Although FIG. 2 shows an example of aggregation on a daily basis, the actual demand data is not limited to aggregation on a daily basis. For example, the actual demand data in the actual demand table 31 may be actual demand data aggregated in less than one day such as one hour, or actual demand data aggregated in a plurality of days such as one week.
本実施形態では、入力データである需要実績データの集計単位の粒度に合わせて需要予測を行うことが可能である。需要実績テーブル31の入力は、例えば、ネットワーク4を介して、外部システム2に接続することで行うことが出来る。需要実績テーブル31の具体的な例としては、レーザーセンサによって得られた駅内の通路を通過する人数を集計した結果などである。需要実績テーブル31はセンサによる人数集計結果に限らず、改札履歴情報などを用いてもよいし、図2の例に限定されず、商品の販売実績、電力消費履歴、サイトへのアクセス履歴など様々な入力を対象としてもよい。
In the present embodiment, it is possible to forecast the demand according to the particle size of the aggregation unit of the demand actual data which is the input data. The input of the demand record table 31 can be performed by connecting to the
(トレンドモデル作成部) (Trend model creation department)
図3に沿って、トレンドモデル作成の手順を説明する。なお、図3に示すトレンドモデル作成は、駅の需要実績データ毎に行われる。 The procedure for creating the trend model will be described with reference to FIG. The trend model shown in FIG. 3 is created for each station demand record data.
本実施形態における「トレンド」とは、長期的な視点でみたときの需要変動の傾向である。例えば、1日単位で集計されていた需要実績データに対し、長期的視点として1年単位での集計を行い、年毎の需要変動をトレンドとして扱うことが出来る。 The “trend” in the present embodiment is a tendency of demand fluctuation from a long-term perspective. For example, the demand performance data that has been aggregated on a daily basis can be aggregated on a yearly basis from a long-term perspective, and the annual demand fluctuation can be treated as a trend.
ステップS201において、トレンドモデル作成部21は、需要実績テーブル31を取得する。ステップS202において、トレンドモデル作成部21は、月、年などの長期的な単位期間で需要実績テーブル31を集計する。
In step S201, the trend
そして、ステップS203において、トレンドモデル作成部21は、変化点を抽出し、データを期間ごとに分割する。ステップS203における「変化点」とは、トレンドが大きく変化した時期(集計点)である。例えば、年単位で集計した結果において、年々10%の需要増加が5年続いた後、その後5年間は年々10%需要減少が続いて現在に至る場合、変化点は5年前の年となる。この場合、10年前〜5年前の期間と5年前〜現在の期間でデータが分割される。
Then, in step S203, the trend
ステップS204において、トレンドモデル作成部21は、分割した期間ごとに近似直線モデルあるいは近似曲線モデルを作成する。そして、ステップS205において、トレンドモデル作成部21は、作成したモデルをトレンドモデルとして、モデルIDを割当て、モデル管理テーブル33に記憶する。トレンドモデルの具体的イメージは後述する。
In step S204, the trend
(周期性モデル作成部) (Periodic model creation department)
図4に沿って、周期性モデル作成の手順を説明する。なお、図4に示す周期性モデル作成は、駅の需要実績データ毎に行われる。 The procedure for creating the periodicity model will be described with reference to FIG. The periodicity model shown in FIG. 4 is created for each station demand record data.
本実施形態における「周期性」とは、例えば季節毎の需要変動であり、夏に需要が増え、冬には需要が下がるといった毎年のように繰り返される需要変動である。 The “periodicity” in the present embodiment is, for example, seasonal fluctuations in demand, which are repeated every year, such as an increase in demand in summer and a decrease in demand in winter.
ステップS301において、周期性モデル作成部22は、需要実績データを取得する。ステップS302において、周期性モデル作成部22は、需要実績データからトレンド成分を除算する。ステップS302における「トレンド成分」とは、トレンドモデル作成部21で作成したトレンドモデルによって算出される値である。例えば、年率10%で需要増加していくトレンドモデルであった場合、その増加率を需要実績データから除算することで、トレンドを除去した定常性をもったデータを作成することができる。
In step S301, the periodicity
そして、ステップS303において、周期性モデル作成部22は、任意の周期Tで需要実績データからトレンド成分を除算したデータを分割する。例えば、周期性モデル作成部22は、季節性の周期性モデルを作成する場合は1年を1周期としてデータを分割する。
Then, in step S303, the periodicity
ステップS304において、周期性モデル作成部22は、周期Tのデータをフーリエ展開し、フーリエ級数モデルを作成する。そして、ステップS305において、周期性モデル作成部22は、作成したフーリエ級数モデルを周期性モデルとして、モデルIDを割当て、モデル管理テーブル33に記憶する。
In step S304, the periodic
本実施形態では周期性モデルの作成にフーリエ展開を用いることを例として記載したが、周期性モデルの作成はフーリエ展開に限定されるものではなく、例えば自己回帰モデルや移動平均モデルなどを用いてもよい。周期性モデルの具体的イメージは後述する。 In this embodiment, the use of Fourier expansion for creating the periodic model is described as an example, but the creation of the periodic model is not limited to the Fourier expansion, and for example, an autoregressive model or a moving average model is used. May be good. A specific image of the periodicity model will be described later.
(トレンドモデルのイメージ) (Image of trend model)
図5(A)に沿って、トレンドモデルの具体的なイメージを説明する。 A concrete image of the trend model will be described with reference to FIG. 5 (A).
図5(A)において、画面上の各ドットが前述したステップS202で集計した需要実績データであり、実線がトレンドモデル作成部21で作成したモデルの値である。データは期間1(201)と期間2(202)に分割され、2つのトレンドモデルy1(203)とy2(204)が作成されている。データが2分割されているのは変化点(205)でトレンドが大きく変化しているからであり、例えば1つ前の集計値との差分が前回差分と大きく乖離した点を変化点として抽出する。なお、期間1と期間2の組合せが、第1の期間の一例である。
In FIG. 5A, each dot on the screen is the actual demand data aggregated in step S202 described above, and the solid line is the value of the model created by the trend
(周期性モデルのイメージ) (Image of periodic model)
図5(B)に沿って、周期性モデルの具体的なイメージを説明する。 A concrete image of the periodicity model will be described with reference to FIG. 5 (B).
図5(B)において、画面上の各ドットが、前述したステップS303で需要実績テーブル31からトレンド成分を除算したデータであり、実線が、周期性モデル作成部22で作成したモデルの値である。データは1周期(211)毎に分割され、周期性モデルy(t)(212)が作成されている。ここで、1周期とは、例えば、1年単位などである。なお、1周期が、第2の期間の一例である。
In FIG. 5B, each dot on the screen is the data obtained by dividing the trend component from the demand record table 31 in step S303 described above, and the solid line is the value of the model created by the periodic
(イベントデータ作成部) (Event data creation department)
図6に沿って、イベントデータ作成の手順を説明する。なお、図6に示すイベントデータ作成は、駅の需要実績データ毎に行われる。 The procedure for creating event data will be described with reference to FIG. The event data shown in FIG. 6 is created for each station demand record data.
本実施形態における「イベント」とは、コンサート、学会、悪天候、連休など、普段とは異なる需要を引き起こす様々な事象であり、ある特定の事象を指すものではない。以後、需要変動の一要因をイベントと記載して説明する。 The "event" in the present embodiment is various events that cause unusual demand such as concerts, academic societies, bad weather, consecutive holidays, etc., and does not refer to a specific event. Hereinafter, one factor of demand fluctuation will be described as an event.
ステップS401において、イベントデータ作成部23は、トレンドモデルと周期性モデルを用いて基準値を作成する。本実施形態における“基準値”とは、イベントが発生しない場合に推定される需要の値である。具体的な数値を用いて基準値の一例を説明する。例えば、トレンドモデルによって年の需要平均値を算出した結果を仮に100とする。次に周期性モデルを用いて各季節の需要変動を推定し、仮に夏は年平均に対し3割増、冬は年平均に対し3割減であったとする。これにより、例えば8月の基準値はトレンド:100に周期性:3割増(+30)を加算した130となる。基準値は需要予測の粒度に合わせて(例えば1日単位で)作成する。
In step S401, the event
ステップS402において、イベントデータ作成部23は、需要実績テーブル31と基準値を比較する。ステップS403において、イベントデータ作成部23は、需要実績データを構成する時系列の需要実績値(本実施形態では人数)のうち、ステップS401において作成された基準値との差分がしきい値を超えた需要実績値を特定し、特定した需要実績値毎にイベントデータセットを作成する。各イベントデータセットについて、需要実績値から基準値を引いた値が、イベント効果とされる。例えば、需要実績データと基準値を1日単位で比較し、その差分が基準値の±30%以上の各需要実績値について、イベントデータセットが生成される。±30%はしきい値の一例であり、プラス値のみがしきい値とされてもよいし、しきい値は、パーセントのような相対値ではなく、1000人などの固定値でもよい。また、季節や年によってしきい値が変更されてもよい。なお、「データセット」とは、アプリケーションプログラムのようなプログラムから見た1つの論理的な電子データの塊であり、例えば、レコード、ファイル、キーバリューペア及びタプルのうちのいずれでもよい。
In step S402, the event
ステップS404において、イベントデータ作成部23は、特定の年月日、曜日、時期などで周期的に発生しているイベントについて、発生頻度、発生パタン、発生時期と合わせてイベント効果をモデル化し、イベントテーブル32にイベントデータセットを記憶し、ならびに、モデル管理テーブル33にイベント効果予測モデルを記憶する。また、ステップS405において、イベントデータ作成部23は、特定の条件下で発生しているイベントについて、発生条件と合わせてイベント効果をモデル化し、イベントテーブル32にイベントデータセットを記憶し、ならびに、モデル管理テーブル33にイベント効果予測モデルを記憶する。本実施形態ではS404とS405をシリアルな処理としているが、それぞれ独立して処理を行うことも可能であり、S404、S405を並行して処理するあるいはS404、S405のどちらか片方のみを処理してもよい。イベントテーブルおよびモデル管理テーブルの詳細については、後述する。
In step S404, the event
(イベントテーブル) (Event table)
図7(A)に沿って、イベントテーブル32を説明する。 The event table 32 will be described with reference to FIG. 7A.
イベントテーブル32を構成する各レコードは、イベントデータセットに相当する。複数の駅の各々について、1以上のイベントデータセットを含んだイベントデータが存在する。なお、ここで言う「駅」は、1つの駅に限らず、例えば“全駅”のように2以上の駅が1つの「駅」とされることもある。 Each record constituting the event table 32 corresponds to an event data set. For each of the plurality of stations, there is event data including one or more event data sets. The "station" referred to here is not limited to one station, and two or more stations such as "all stations" may be regarded as one "station".
イベントテーブル32を構成する各レコードには、例えば、抽出イベント名欄301、発生頻度欄302、発生パタン欄303、発生時期欄304、発生期間欄305、発生場所欄306、および、イベント効果予測モデルID欄307がある。イベントテーブル32においては、抽出イベント名欄301には、イベント名が、発生頻度欄302には、推定されたイベント発生頻度が、発生パタン欄303には、イベントの発生パタンが、発生時期欄304には、イベントの発生時期が、発生期間欄305には、イベントの継続日数が、発生場所欄306には、イベントの発生場所が、イベント効果予測モデルID欄307には、モデルIDが記憶されている。なお、「発生パタン」は、特定曜日のように周期的に発生するイベントを意味するパタンもあれば、“条件”のように特定条件が満たされた場合にのみ発生するイベントを意味するパタンもある。また、「時期」は、時間の長さに加えて開始時刻と終了時刻の少なくとも1つが定まっていることを意味し、それに対して、「期間」は、時間の長さが定まっているが開始時刻と終了時刻のいずれも定まっていないことを意味する。「発生場所」は、駅のような対象の一例である。「イベント効果予測モデル」は、イベント効果を予測するためのモデルである。“モデルID”は、後述するモデル管理テーブル33において、モデル(例えば予測式)を識別するために用いられる。
For each record constituting the event table 32, for example, the extraction
以下、1つの具体的な事例を用いてイベントテーブルの詳細を説明する。 Hereinafter, the details of the event table will be described using one specific example.
イベント1(イベント名“イベント1”のイベント)は、毎年の頻度である特定日に発生するイベントである。より具体的には、イベント1は、12月25日の1日の期間で全駅に対して需要変動が発生するイベントであり、イベント1のイベント効果予測モデルのIDは“C1”である。イベント1は、ステップS404によって、毎年の12月25日の全駅において、平常時と比較して需要実績値がしきい値を超えていたため抽出されたイベントである。イベントは自動で抽出されるため、抽出イベント名欄301にはイベント1、イベント2などの通し番号が記憶されている。本実施形態では、イベント名は自動割り当てを想定して記載しているが、管理画面などを設けてユーザーが任意にイベント名を変更してもよい。例えば、イベント1であれば、毎年12月25日に発生する事象であるため、イベント名を“クリスマス”に変更することでユーザーはより分かり易くイベントを管理可能である。イベントの発生パタンは、イベント1のような毎年の特定日といった周期的に発生するものの他に、イベント5のような不定期な頻度で発生する休日並び(例えば3連休)といった条件であってもよい。イベント5は、ステップS405によって、不定期で発生する3連休の全駅において、平常時と比較して需要がしきい値を超えていたため抽出されたイベントである。休日並びを条件とする場合、イベント抽出にはカレンダー情報(祝日情報)が必要となる。その際、カレンダー情報を外部サーバ3から取得する、あるいは補助記憶装置16に記憶させて読み込んでもよい。
Event 1 (event with the event name "
(モデル管理テーブル) (Model management table)
図7(B)に沿って、モデル管理テーブル33について説明する。 The model management table 33 will be described with reference to FIG. 7B.
モデル管理テーブル33には、トレンドモデル、周期性モデルおよびイベント効果予測モデルといった種々のモデルが記憶される。具体的には、例えば、モデル管理テーブル33を構成する各レコードには、モデルID欄311および予測式欄312がある。モデルID欄311にはモデルを識別するIDが、予測式欄312にはIDに対応したモデルとしての式が記憶されている。予測式欄312には、トレンドモデル、周期性モデル、イベント効果予測モデルなど、本実施形態で作成されたモデルが定数あるいは数式として記憶される。モデル管理テーブル33における「定数」とは、あるイベント時に必ず同じ需要となるというイベント効果予測モデルである。例えば、1月1日の駅利用者数が毎年しきい値を超えておおよそ基準値+3万人であることが分かった場合、1月1日のイベント効果予測モデルを定数:30000としてもよい。「数式」とは、単回帰モデルや重回帰モデルなどの予測モデルである。例えば、トレンドモデルの予測値をX1、周期性モデルの予測値をX2、イベント発生からの経過日数をX3(複数日継続するイベント)として、予測式を需要予測値Y = 0.4 * (X1 + X2) - 100 * X3などとしてもよい。この予測式では、イベント初日は基準値に対し、40%増のイベント効果があり、初日を基準として1日経過する毎に100人の需要低下があることをモデル化している。予測式の説明変数には外部サーバ3から取得した外部データを活用してもよい。具体的には需要に影響を与える外部要因として予想降水確率や予想気温などを予測式の説明変数に取り込んでもよい。また、天候および気候データ以外でも経済指標、SNS(Social Networking Service)情報、メディア情報、観光統計調査結果など、様々なデータを説明変数に取り込んでもよい。イベント効果予測モデルは入力データである需要実績データを基に作成され、そのタイミングは任意である。そのため、需要実績データが増える度にイベント効果予測モデルを更新する、年数回決まったタイミングでイベント効果予測モデルを更新する、イベント効果予測モデルを更新せずに使い続けるなどの運用方法が考えられる。また、イベント効果予測モデルは作成された後、ユーザーが手動で補正を加えてもよい。その際、修正前のモデルを別途記憶する、人手による修正モデルに修正フラグや修正者情報を付けて管理するなどを行ってもよい。
Various models such as a trend model, a periodic model, and an event effect prediction model are stored in the model management table 33. Specifically, for example, each record constituting the model management table 33 has a
(入力データとモデル化のイメージ) (Input data and modeling image)
図8に沿って、入力データとモデル化の具体的なイメージを説明する。 A concrete image of the input data and the modeling will be described with reference to FIG.
図8において、上部グラフ401は、入力された時系列の需要実績値であり、下部グラフ402〜404が、モデル化のイメージ図である。入力データは、2015年1月から2017年1月までの2年分の需要実績データである。仮に1年単位で集計したデータからトレンドモデルを作成した場合、グラフ402に示したような線形増加の回帰直線モデルが作成される。また、仮に1年周期で周期性モデルを作成した場合、グラフ403に示したような曲線モデルが作成される。イベントのモデル化は需要実績データが基準値から大きく外れ、かつ規則性を持って発生しているかどうかで判定され、例えば、グラフ404に示したように条件に合致した特定の需要実績データが抽出される。
In FIG. 8, the
(需要予測部) (Demand Forecasting Department)
図9に沿って、需要予測の手順を説明する。 The procedure for demand forecasting will be described with reference to FIG.
ステップS501において、需要予測部24は、需要予測の対象駅と将来時期との指定(入力)を受け付ける。以下、指定された駅を「指定駅」と言い、指定された将来の時期を「指定時期」と言う。ここで指定時期とは、例えば、数ヶ月先のある1日、あるいは翌日以降のある日からある日までの時期などである。予測は、例えば、指定時期を構成する時間単位(例えば1日)毎に行われてよい。また、指定時期は、“X年○月△日の10時〜11時”といった詳細な時期でもよい。この場合は入力された時間粒度毎の需要予測が行われる。
In step S501, the
ステップS502において、需要予測部24は、トレンドモデルと周期性モデルから基準値を予測する。基準値の計算方法についてはステップS401と同様の処理で行い、説明は省略する。なお、本実施形態では、駅毎に、過去の時期について、トレンドモデル作成部21によって作成されたトレンドモデルと、周期性モデル作成部22によって作成された周期性モデルとがモデル管理テーブル33に記憶されていてよい。需要予測部24は、指定駅について、当該指定駅に対応したトレンドモデルおよび周期性モデルを基に、基準値を予測してよい。
In step S502, the
ステップS503において、需要予測部24は、指定時期にイベントが発生する可能性があるかを判定する。具体的には、例えば、需要予測部24は、指定時期に属する日、曜日、月、休日などが、指定駅に対応したイベントデータが示す各イベントの発生パタンや発生時期と合致するかをチェックし、該当しているイベントがあった場合、対象日はイベント発生日であると判断する。このとき、カレンダー情報は外部サーバ3から取得する、あるいは補助記憶装置16に記憶させておいてもよい。
In step S503, the
対象日がイベント発生日である場合(ステップS503:Yes)、ステップS504において、需要予測部24は、イベント効果予測モデルから対象日のイベント需要を予測する。「イベント需要」とは、イベントの影響を受けた結果としての需要である。具体的には、例えば、需要予測部24は、対応するイベントに対応したイベント効果予測モデルIDに対応した予測式(モデル管理テーブル33の予測式を)参照し、イベント効果を予測する。より具体的には、例えば、予測式が3万の定数であった場合、イベント効果は3万となる。S505において、需要予測部24は、各予測値を合算したものを需要予測結果として記憶する。例えば、需要予測部24は、トレンド予測値(予測されたトレンドモデルを基に予測された需要):5万、周期性予測値(予測された周期性モデルを基に予測された需要):−2万、イベント効果予測値:3万とした場合、需要予測結果はそれらを合算した6万となる。なお、予測値としてイベント効果には、該当しているとされたイベントに対応した発生期間が考慮されてよい。
When the target date is the event occurrence date (step S503: Yes), in step S504, the
なお、対象日がイベント発生日でない場合(ステップS503:No)、需要予測部24は、ステップS502で予測した基準日を出力する。ステップS505において、算出される合計は、トレンド予測値と周期性予測値と基準値との合計になる。
If the target date is not the event occurrence date (step S503: No), the
(需要予測結果テーブル) (Demand forecast result table)
図10に沿って、需要予測結果テーブル34を説明する。 The demand forecast result table 34 will be described with reference to FIG.
需要予測結果テーブル34を構成する各レコードには、対象日欄501、駅名欄502および予測値欄503がある。対象日欄501には指定時期における予測の対象日(時間単位の粒度であれば時間情報も)が、駅名欄502には、駅名が、予測値欄503には、トレンド、周期性およびイベント効果といった3種類のモデルについて得られた3つの予測値とそれら合計といった需要予測結果が記憶されている。図10では、駅利用者数の予測が需要予測の一例であるため、需要予測結果テーブル34には駅名欄が設けられているが、例えば、改札履歴情報が用いられる場合、入場駅欄および出場駅欄が設けられてもよい。また、小売の需要予測であれば、駅名欄の代わりに対象とする店舗名欄を設けて需要予測を行ってもよいし、レンタル品の需要予測であれば、対象とする商品名欄を設けて需要予測を行ってもよい。需要予測結果テーブル34の構成は、入力データである需要実績データの構成に合わせた構成とすることができる。
Each record constituting the demand forecast result table 34 has a
予測値について、需要予測結果テーブル34における1番目のレコード(駅名“駅A”のレコード)を一例に説明する。当該レコードは、2017年12月25日の需要予測結果を示し、予測値の「合計」は、駅Aの利用者数を予測している。具体的には、予測値:トレンド“1000”は、例えば、年平均の駅利用者の予測値(例えば、“駅A”に対応しトレンドモデルから得られた値)として1000人であることを意味している。予測値:周期性“600”は、例えば、年平均に対する12月の駅利用者の需要増分(例えば、“駅A”に対応した周期性モデルから得られた値)が600人であることを意味している。予測値:イベント効果“−500”は、対象日にイベントが発生し、駅利用者が500人低下すると予測されていることを意味する。結果として、2017年12月25日に駅Aの利用者数は1100人(=1000+600+(−500))であると予測される。 Regarding the predicted value, the first record (record of the station name “station A”) in the demand forecast result table 34 will be described as an example. The record shows the demand forecast result on December 25, 2017, and the "total" of the forecast value predicts the number of users of station A. Specifically, the predicted value: the trend "1000" is, for example, 1000 people as the predicted value of the annual average station user (for example, the value obtained from the trend model corresponding to "station A"). Means. Predicted value: Periodicity "600" means that, for example, the increase in demand of station users in December with respect to the annual average (for example, the value obtained from the periodicity model corresponding to "Station A") is 600 people. Means. Predicted value: The event effect "-500" means that an event occurs on the target day and the number of station users is predicted to decrease by 500. As a result, it is predicted that the number of users of station A will be 1100 (= 1000 + 600 + (-500)) on December 25, 2017.
(システム画面) (System screen)
需要予測システム1は、ユーザー、例えば鉄道事業者が需要予測結果を確認する画面等を提供する。以下に具体的な画面の一例を説明する。
The
(システム画面1:需要予測画面1) (System screen 1: Demand forecast screen 1)
図11に沿って需要予測画面70を説明する。なお、以降の説明では、「UI」は、ユーザーインターフェースの略であり、典型的には、GUI(Graphical User Interface)部品である。
The
需要予測画面70は、需要予測の対象(駅)を選択するUI(例えばボタン)701および需要予測の対象時期(例えば対象日)を選択するUI(例えばボタン)702を有する。ユーザーは、画面70を用いて、需要予測対象とする駅と将来の時期を指定(選択)することができる。図11の例によれば、需要予測画面70では、2018年1月1日9時〜10時に駅Aの利用者が需要予測の対象として選択されている。
The
需要予測結果エリア704は、需要予測結果表示を要求するためのUI(例えばボタン)703が操作された場合に需要予測結果情報(需要予測結果を示す情報)が表示されるエリアである。具体的には、例えば、UI703が操作された場合に需要予測部24が呼び出され、呼び出された需要予測部24により需要予測が行われ、需要予測結果テーブル34に記憶された対象日の需要予測値が需要予測結果エリア704に表示される。需要予測結果エリア704では、予測値としての合計(“12000人”)がUI705に表示される。UI705に表示された合計(予測値)をより理解し易いように前年度比情報などの補足情報を706が、需要予想結果エリア704に表示されてもよい。
The demand
(システム画面2:需要予測画面2) (System screen 2: Demand forecast screen 2)
図12に沿って需要予測画面71を説明する。
The
需要予測画面71は、需要予測画面70の一変形例である。需要予測画面71は、需要実績値と需要予測値の確認を行うための時系列グラフ801を有する。時系列グラフ801において、実績値はドットで、基準値は実線で、自動抽出したイベントはイベント名(テキスト)と合わせて表示されている。また、予測値は破線で表示され、合わせて将来のイベント発生(イベント1の発生予測)を確認することができる。時系列グラフ801は、画面左下部(または他の部分)に設けられたUI802〜805が操作されたことに応答して表示されてよい。UI802は、対象とする入出場駅を指定するためのUIである。UI803は、需要実績データの入力範囲としての入力時期を指定するためのUIである。UI804は、需要予測結果の出力範囲としての出力時期を指定するためのUIである。UI805は、需要予測結果の表示を要求するためのUI(例えばボタン)である。需要予測画面71では、駅Aに入場し、駅Bで出場する鉄道利用者について、2015年1月〜2016年12月までの需要実績データを用いて、2017年1月〜2017年12月までの需要予測を行うことが選択されており、その結果が時系列グラフ801である。自動抽出されたイベントは1件であり、イベント1として画面上に表示され、その詳細情報はイベント発生予測エリア806に表示されている。イベント1は毎年12月25日に全駅で発生するイベントであり、基準値に対して需要が−50%となることが示されている。また、UI(例えばボタン)807を操作することで、イベント発生予測エリア806に表示されたイベント情報の編集、追加および削除のうちの少なくとも1つを行うことも出来る。イベント名や予測モデルは需要予測システム1によって自動的に作成されるものであるが、より適切なものにユーザーが変更してもよい。また、自動抽出されなかったイベントをユーザーが追加してもよい(イベント編集・追加画面の説明は省略する)。
[実施形態2]
The
[Embodiment 2]
実施形態2を説明する。その際、実施形態1との相違点を主に説明し、実施形態1との共通点については説明を省略または簡略する。 The second embodiment will be described. At that time, the differences from the first embodiment will be mainly described, and the common points with the first embodiment will be omitted or simplified.
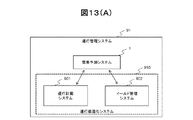
実施形態1では、需要実績データを入力とし、省コストな運用で高精度な需要予測を行うことが可能である。需要予測結果の活用の一例として、図13(A)に運行管理システム91の例を示す。運行管理システム91は、需要予測システム1と、需要予測システム1の外部システムの一例である運行最適化システム910とを含む。運行最適化システム910で、相互に接続された運行計画システム901およびイールド管理システム902を含む。
In the first embodiment, it is possible to input demand actual data and perform highly accurate demand forecast by cost-saving operation. As an example of utilizing the demand forecast result, FIG. 13A shows an example of the
運行計画システム901は、需要予測システム1によって予測された駅利用者(需要予測結果)を確認し、例えば、列車の定員と予測乗車人数に基づき、運転本数の最適化を行うことができる。より具体的には、例えば、運行計画システム901は、乗車率を100%前後にするような運行本数を計画することができる。また、運行計画システム901は、運行計画情報を需要予測システム1に入力することで、需要予測システム1が、例えば、列車の運転本数および定員と予測乗車人数に基づき、列車に乗車できず駅に滞留する駅利用者数を計算することも可能である。
The
イールド管理システム902は、例えば、列車の運転本数および定員と予測乗車人数に基づき、列車の運賃を変更することができる。より具体的には、例えば、イールド管理システム902は、新幹線の指定席の価格を季節や時間帯の需要に合わせて任意に変更させるなどの機能を有する。
The
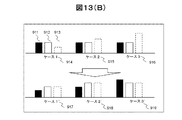
図13(B)に需要予測結果を用いた列車運行計画の具体的なイメージを示す。 FIG. 13B shows a concrete image of the train operation plan using the demand forecast result.
図13(B)には3種類の棒グラフ(911〜913)が6つのケース(914〜919)の各々について記載されている。3種類の棒グラフは、左から運賃911、輸送力912、需要予測913である。運賃911とは、例えば、駅Aから駅Bまでの列車移動に必要な料金である。輸送力とは、例えば、駅Aから駅Bの1日の列車運行本数に列車の定員を乗算したものである。需要予測913とは、例えば、需要予測システム1によって予測された駅Aから駅Bに移動する1日の駅利用者である。ケース1〜3(914〜916)は運賃や輸送力の初期値であり、ケース1’〜3’(917〜919)は図13(A)で示した運行計画システム901およびイールド管理システム902によって運賃や輸送力を変更した例である。ケース1(914)では、輸送力に対して、需要予測が小さいため、ケース1’(917)では運賃を下げて需要喚起を行っている(運賃を上下させて需要が上下するというモデルは別途用意しておく)。ケース2(915)では、輸送力に対して需要が大きいため、ケース2’(918)では需要予測に合わせて輸送力を上げている(運転本数を増やしている)。ケース3(916)では、輸送力に対して需要がかなり大きいため、ケース3’(919)では輸送力と運賃を合わせて上げている。これら運行計画の変更により、鉄道事業者と鉄道利用者双方にとって有益な輸送計画を立案することが可能となる。鉄道事業者と鉄道利用者双方にとって有益な運行計画とは、例えば、需要(鉄道を利用したい顧客)と供給(輸送力)が一致していること、収益(運賃×需要−運転コスト(輸送力))が最大となる輸送計画であること、などを満たす運行計画である。
[実施形態3]
FIG. 13B shows three types of bar graphs (911-913) for each of the six cases (914-919). The three types of bar graphs are
[Embodiment 3]
実施形態3を説明する。その際、実施形態1および2との相違点を主に説明し、実施形態1および2との共通点については説明を省略または簡略する。 The third embodiment will be described. At that time, the differences from the first and second embodiments will be mainly described, and the common points with the first and second embodiments will be omitted or simplified.
実施形態1および2では、イベント予定の事前登録がない場合においてもイベントの発生を加味した需要予測が可能である。しかし、イベントの中には不定期に発生するイベント、しきい値を超えないレベルでしか影響を与えない小規模イベント、数年に1回しか発生しない大イベントなど、自動抽出が難しいイベントも存在することが考えられる。仮にそれらのイベント発生日時、場所などが既知である場合、イベント予定を事前登録することにより、より高精度にイベントを加味した需要予測を行うことが可能となる。 In the first and second embodiments, it is possible to forecast the demand in consideration of the occurrence of the event even when there is no pre-registration of the event schedule. However, there are some events that are difficult to automatically extract, such as events that occur irregularly, small events that affect only at a level that does not exceed the threshold, and large events that occur only once every few years. It is conceivable to do. If the date and time of occurrence of these events, the location, etc. are known, it is possible to forecast the demand with the events taken into account with higher accuracy by pre-registering the event schedule.
図14(A)に、外部システムの一例としてのイベント事前登録DB(例えばDBシステム)921が需要予測システム1に接続されたシステムの一例を示す(「DB」は、データベースの略である)。図14(B)に、イベント事前登録DB921の構成を示す。
FIG. 14A shows an example of a system in which an event pre-registration DB (for example, DB system) 921 as an example of an external system is connected to the demand forecast system 1 (“DB” is an abbreviation for a database). FIG. 14B shows the configuration of the
イベント事前登録DB921を構成する各レコードには、例えば、イベント種931、開催日932、開催期間933、周辺駅934、規模935などが登録されている。それらのデータを需要予測システム1に入力することで、需要予測システム1で抽出できなかったイベントを、イベントデータDBの情報を用いることで補完を行い、より多くのイベント発生予測を行う。具体的には、例えば、8月10日に開催を予定している展示即売会が需要予測システム1で予測できていなかった場合(あるいは、実施形態1および2での需要予測の処理において)、需要予測部24が、イベント事前登録DB921における開催期間933、周辺駅934、規模935を参照し、当該イベント“展示即売会”による影響を受けた需要を予測する。より具体的には、例えば、8月10日から3日間の期間で30万人のイベント客が駅Dを利用して来場すると登録されているため、1日あたり10万人規模と考え、8月10日、11日、12日の駅Dの需要予測結果に対し、10万人を加算することで需要予測の精度を向上させることができる。
In each record constituting the
また、イベント事前登録DB921に登録されたイベント予定が既に需要予測システム1で自動抽出されている場合、イベント予測の補正やイベント後にその結果を、需要予測システム1(例えば、需要予測部24)がイベント事前登録DB921にフィードバックすることも可能である。具体的には、例えば、9月1日に開催を予定しているイベント“コンサート”が需要予測システム1で予測できている場合、需要予測部24が、予測されたイベント効果と、イベント事前登録DB921に登録されている規模935とを比較し、予測結果が妥当であるかどうかを確認することが出来る。仮に、予測されたイベント効果(予測値としてのイベント効果)とイベント規模との乖離(差分)が大きかった場合、予測されたイベント効果が、需要予測部24により自動補正されてもよいし、あるいは、ユーザーにより手動で補正されてもよい。イベント終了後は、需要予測部24が、予測値(例えば、イベント効果や合計)ならびにイベント規模と、需要実績とを比較することで、誤差を評価すること(および、当該誤差を基にイベントデータを補正すること)も可能であり、その結果をユーザーに提示してもよい。また、新たに蓄積された需要実績データを用いて予測モデルが更新されてもよい。
Further, when the event schedule registered in the
以上の説明を、例えば下記のように総括することができる。なお、下記の総括は、上述の説明に無い事項を含んでもよい。 The above description can be summarized as follows, for example. The following summary may include matters not described above.
需要予測システム1が、イベントデータ作成部23と、需要予測部24とを備える。イベントデータ作成部23が、需要実績データ(過去の時系列の需要実績値を示すデータ)を基に基準値を作成し、当該基準値との差分がしきい値を超える1以上の需要実績値を探し、見つかった1以上の需要実績値がイベントの影響を受けた需要実績値としたイベントデータを作成することを、複数の対象(例えば駅)の各々について行う。需要予測部24は、いずれかの対象と将来の時期との指定を受け付け、指定対象(当該指定された対象)について、当該指定対象に対応したイベントデータを基に、指定時期(指定された将来の時期)でのイベントの発生有無と、イベントが発生するのであれば当該イベントが需要実績値に与える影響であるイベント効果との予測であるイベント予測を行う。需要予測部24は、当該イベント予測の結果を基に、指定時期での需要の予測である需要予測を行い、当該需要予測の結果として予測された需要を表す需要結果情報を出力(表示)する。このように、過去の時系列の需要実績値を示す需要実績データを基にイベントの影響を受けた需要実績値が自動抽出される。これにより、イベント登録作業の省コスト化が実現される。そして、イベントの影響を受けた需要実績値は、需要実績データを基に作成された基準値との差分がしきい値を超えている需要実績値である。将来のイベント発生を予測することによる需要予測の高精度化が期待できる。
The
なお、需要予測システム1(および、上述した外部システム2(例えば、運行最適化システム910)、および、外部サーバ3)は、1以上の物理コンピュータで構成されてもよいし、1以上の物理コンピュータの各々にインストールされた所定のソフトウエアが実行されることで実現されるソフトウエアディファインドのシステムでもよい。また、システム1が「情報を表示する」ことは、システム1が有するディスプレイに当該情報を表示することであってもよいし、システム1が表示用計算機に表示用情報を送信することであってもよい(後者の場合は表示用計算機によって表示用情報が表示される)。
The demand forecasting system 1 (and the above-mentioned external system 2 (for example, the operation optimization system 910) and the external server 3) may be composed of one or more physical computers, or one or more physical computers. It may be a software-defined system realized by executing predetermined software installed in each of the above. Further, the
また、「時刻」の単位は、年月日のうちの少なくとも1つのように粗い単位でもよいし、さらに時分が追加された細かい単位でもよい。 Further, the unit of "time" may be a coarse unit such as at least one of the year, month and day, or a fine unit in which hours and minutes are added.
需要予測システム1は、需要実績データを基に1以上のモデル(例えば、トレンドモデルおよび周期性モデルの少なくとも1つ)を作成することを複数の対象の各々について行うモデル作成部(例えば、トレンドモデル作成部21および周期性モデル作成部22の少なくとも1つ)を更に備える。複数の対象の各々について、基準値は、当該対象についての1以上のモデルを用いて作成される。複数の対象の各々について、イベントデータは、見つかった1以上の需要実績値と、当該1以上の需要実績値に対応した1以上の時刻と、前記1以上のモデルとに基づくイベント効果の1以上の予測モデルである1以上のイベント効果予測モデルを含んだデータである。需要予測部24は、指定対象について作成された1以上のモデルと、指定対象に対応したイベントデータ中の1以上のイベント効果予測モデルとを基に、イベント予測および需要予測を行う。基準値は、需要実績データをモデル化することにより得られた1以上のモデルを基に作成されるので、精度の高い基準値を効率的に作成することが期待できる。
The
複数の対象の各々について、前記1以上のモデルは、第1の期間(例えば比較的長期の期間)での需要変動の傾向を示すモデルであるトレンドモデルと、第1の期間における第2の期間毎に繰り返される需要変動を示すモデルである周期性モデルとを含む。複数の対象の各々について、基準値は、トレンドモデルと周期性モデルとに基づいて作成された点である。トレンドモデルを基に長期の視点での需要変動の傾向がわかり、当該長期において周期的な需要変動がわかることが期待でき、故に、精度の高い基準値を効率的に作成することが期待できる。 For each of the plurality of objects, the one or more models are a trend model which is a model showing a tendency of demand fluctuation in a first period (for example, a relatively long period) and a second period in the first period. It includes a periodic model, which is a model showing demand fluctuations that are repeated every time. For each of the plurality of objects, the reference value is a point created based on the trend model and the periodic model. Based on the trend model, it can be expected that the trend of demand fluctuation from a long-term perspective can be understood, and that the periodic demand fluctuation can be understood in the long term. Therefore, it can be expected that a highly accurate reference value can be efficiently created.
複数の対象の各々について、イベントデータは、当該対象についてのイベント毎に対応したイベントデータセットを含む。各イベントについて、イベントデータセットは、当該イベントのイベント名、発生頻度、発生パタン、発生時期、発生期間、および、1以上のモデルの少なくとも1つを基に得られたイベント効果予測モデル、のうちの少なくともイベント効果予測モデルを含む。発生すると予測されたイベントに対応したイベントデータセット中のイベント効果予測モデル等に基づいて需要予測ができるため、需要予測を高精度に行うことが期待できる。 For each of the plurality of objects, the event data includes an event data set corresponding to each event for the object. For each event, the event dataset is one of the event name, frequency of occurrence, pattern of occurrence, time of occurrence, duration of occurrence, and event effect prediction model obtained based on at least one of one or more models. Includes at least an event effect prediction model. Since the demand can be predicted based on the event effect prediction model in the event data set corresponding to the event predicted to occur, it can be expected that the demand forecast can be performed with high accuracy.
なお、需要結果情報は、指定対象についてのイベント予測において発生が予測されたイベントに関する情報であって、当該イベントに対応したイベントデータセットにおける要素を含む。これにより、発生が予測されたイベントと予測された需要との関係性をユーザーが把握できることが期待できる。 The demand result information is information about an event predicted to occur in the event prediction for the designated target, and includes an element in the event data set corresponding to the event. As a result, it can be expected that the user can grasp the relationship between the event predicted to occur and the demand predicted to occur.
また、需要予測部24は、予測されたイベントに対応したイベントデータセットにおける要素の追加、削除および編集のうちの少なくとも1つを受け付ける。これにより、イベント名やイベント予測効果モデルといった要素がユーザーにとって正確にまたは分かり易くなることが期待できる。
In addition, the
需要予測部24は、指定時期におけるいずれかの期間が発生期間であるイベント予定に関するイベント予定データセット(例えば、イベント事前登録DB921におけるレコード)が事前登録されていれば、イベント予測の結果に加えて、事前登録されている当該イベント予定データセットに基づいて、需要予測を行う。これにより、需要予測の一層の高精度化が期待できる。
If the event schedule data set (for example, the record in the event pre-registration DB 921) related to the event schedule whose occurrence period is any period in the specified time is pre-registered, the
イベント予定データセットは、需要と同じ単位で表現されたイベント規模を含む。例えば、需要の単位が人数であれば、イベント規模も人数で表現されている。予測されたイベントが、事前登録されているイベント予定と一致しており、且つ、予測されたイベント効果とイベント規模との乖離が一定乖離を超えている場合に、当該イベント効果が、例えば需要予測部24により補正される。これにより、需要予測の一層の高精度化が期待できる。
The event schedule dataset contains the event scale expressed in the same units as demand. For example, if the unit of demand is the number of people, the scale of the event is also expressed by the number of people. When the predicted event matches the pre-registered event schedule and the deviation between the predicted event effect and the event scale exceeds a certain deviation, the event effect is, for example, a demand forecast. It is corrected by the
需要予測システム1が、運行最適化システム910に接続されている。指定対象は、第1の駅と第2の駅を含む。需要予測において予測された需要は、第1の駅と第2の駅間での利用者数(例えば乗客数)である。運行最適化システム910は、指定時期について、列車本数と、列車運賃と、予測された利用者数とを基に、列車本数および列車運賃の少なくとも1つを最適化する。これにより、需要予測に基づく最適な運行計画の立案が期待できる。
The
なお、本発明は前記した実施形態に限定されるものではなく、様々な変形例が含まれる。例えば、前記した実施形態は、本発明を分かり易く説明するために詳細に説明したものであり、必ずしも説明したすべての構成を備えるものに限定されるものではない。また、ある実施例の構成の一部を他の実施例の構成に置き換えることが可能であり、また、ある実施形態の構成に他の実施形態の構成を加えることも可能である。また、各実施形態の構成の一部について、他の構成の追加・削除・置換をすることが可能である。 The present invention is not limited to the above-described embodiment, and includes various modifications. For example, the above-described embodiment has been described in detail in order to explain the present invention in an easy-to-understand manner, and is not necessarily limited to those having all the described configurations. Further, it is possible to replace a part of the configuration of one embodiment with the configuration of another embodiment, and it is also possible to add the configuration of another embodiment to the configuration of one embodiment. Further, it is possible to add / delete / replace a part of the configuration of each embodiment with another configuration.
また、前記の各構成、機能、処理部、処理手段等は、それらの一部又は全部を、例えば集積回路で設計する等によりハードウエアで実現してもよい。また、前記の各構成、機能等は、プロセッサがそれぞれの機能を実現するプログラムを解釈し、実行することによりソフトウエアで実現してもよい。各機能を実現するプログラム、テーブル、ファイル等の情報は、メモリや、ハードディスク、SSD(Solid State Drive)等の記録装置、又は、ICカード、SDカード、DVD等の記録媒体に置くことができる。 Further, each of the above-mentioned configurations, functions, processing units, processing means and the like may be realized by hardware by designing a part or all of them by, for example, an integrated circuit. Further, each of the above configurations, functions, and the like may be realized by software by the processor interpreting and executing a program that realizes each function. Information such as programs, tables, and files that realize each function can be placed in a memory, a hard disk, a recording device such as an SSD (Solid State Drive), or a recording medium such as an IC card, an SD card, or a DVD.
また、制御線や情報線は説明上必要と考えられるものを示しており、製品上必ずしもすべての制御線や情報線を示しているとは限らない。実際には殆どすべての構成が相互に接続されていると考えてもよい。 In addition, control lines and information lines are shown as necessary for explanation, and not all control lines and information lines are shown in the product. In practice, it can be considered that almost all configurations are interconnected.
また、上述のイベント予測は、需要予測以外の用途にも利用可能であることが期待できる。例えば、次のようなイベント予測システムが構築されてもよい。すなわち、イベント予測システムは、イベントデータ作成部と、イベント予測部とを備えてよい。イベントデータ作成部は、過去の時系列の実績値を示す実績データを基に基準値を作成し、当該基準値との差分がしきい値を超える1以上の実績値を探し、見つかった1以上の実績値がイベントの影響を受けた実績値としたイベントデータを作成することを、複数の対象の各々について行ってよい。イベント予測部は、いずれかの対象と将来の時期との指定を受け付け、指定対象について、当該指定対象に対応したイベントデータを基に、指定時期でのイベントの発生有無と、イベントが発生するのであれば当該イベントがいずれのイベントであるかとの予測であるイベント予測を行ってよい。 Further, it can be expected that the above-mentioned event forecast can be used for applications other than demand forecast. For example, the following event prediction system may be constructed. That is, the event prediction system may include an event data creation unit and an event prediction unit. The event data creation unit creates a reference value based on the actual data indicating the actual value of the past time series, searches for an actual value of 1 or more whose difference from the reference value exceeds the threshold value, and finds 1 or more. It is possible to create event data in which the actual value of is the actual value affected by the event for each of the plurality of targets. The event prediction unit accepts the designation of one of the targets and the future time, and for the designated target, based on the event data corresponding to the designated target, whether or not an event occurs at the specified time and the event occurs. If so, event prediction, which is a prediction of which event the event is, may be performed.
1:需要予測装置、21:トレンドモデル作成部、22:周期性モデル作成部、23:イベントデータ作成部、24:需要予測部 1: Demand forecasting device, 21: Trend model creation unit, 22: Periodic model creation unit, 23: Event data creation unit, 24: Demand forecasting unit
Claims (11)
前記複数の対象のうちのいずれかの対象と将来の時期との指定を受け付け、当該指定された対象について、当該指定された対象に対応したイベントデータを基に、前記将来の時期でのイベントの発生有無と、イベントが発生するのであれば当該イベントが需要実績値に与える影響であるイベント効果との予測であるイベント予測を行い、当該イベント予測の結果を基に前記将来の時期での需要の予測である需要予測を行い、当該需要予測の結果として予測された需要を表す需要結果情報を出力する需要予測部と
を備える需要予測システム。 Create a standard value based on the actual demand data showing the actual demand value in the past time series, search for one or more actual demand values whose difference from the standard value exceeds the threshold value, and find one or more actual demand values. The event data creation unit that creates event data with the value as the actual demand value affected by the event for each of multiple targets,
Accepts the designation of one of the plurality of targets and the future time, and for the designated target, based on the event data corresponding to the designated target, the event in the future time Event forecasting is performed, which is a forecast of the presence or absence of occurrence and the event effect, which is the effect of the event on the actual demand value if an event occurs, and based on the result of the event forecast, the demand in the future period is A demand forecasting system including a demand forecasting unit that makes a demand forecast, which is a forecast, and outputs demand result information representing the forecasted demand as a result of the demand forecast.
を更に備え、
前記複数の対象の各々について、前記基準値は、当該対象についての前記1以上のモデルを用いて作成され、
前記複数の対象の各々について、前記イベントデータは、前記見つかった1以上の需要実績値と、当該1以上の需要実績値に対応した1以上の時刻と、前記1以上のモデルとに基づくイベント効果の1以上の予測モデルである1以上のイベント効果予測モデルを含んだデータであり、
前記需要予測部は、前記指定された対象について作成された1以上のモデルと、前記指定された対象に対応したイベントデータ中の1以上のイベント効果予測モデルとを基に、前記イベント予測および前記需要予測を行う、
請求項1に記載の需要予測システム。 A model creation unit that creates one or more models based on the actual demand data for each of the plurality of objects.
Further prepare
For each of the plurality of objects, the reference value is created using the one or more models for the object.
For each of the plurality of objects, the event data is an event effect based on the found one or more actual demand values, one or more times corresponding to the one or more actual demand values, and the one or more models. It is data including one or more event effect prediction models, which is one or more prediction models of.
The demand forecasting unit predicts the event and the event forecasting based on one or more models created for the designated target and one or more event effect forecasting models in the event data corresponding to the designated target. Make a demand forecast,
The demand forecasting system according to claim 1.
第1の期間での需要変動の傾向を示すモデルであるトレンドモデルと、
前記第1の期間における第2の期間毎に繰り返される需要変動を示すモデルである周期性モデルと
を含み、
前記複数の対象の各々について、前記基準値は、前記トレンドモデルと前記周期性モデルとに基づいて作成された点である、
請求項2に記載の需要予測システム。 For each of the plurality of objects, the one or more models
A trend model, which is a model showing the trend of demand fluctuations in the first period,
Including a periodic model, which is a model showing demand fluctuations repeated every second period in the first period.
For each of the plurality of objects, the reference value is a point created based on the trend model and the periodic model.
The demand forecasting system according to claim 2.
各イベントについて、前記イベントデータセットは、当該イベントのイベント名、発生頻度、発生パタン、発生時期、発生期間、および、前記1以上のモデルの少なくとも1つを基に得られたイベント効果予測モデル、のうちの少なくともイベント効果予測モデルを含む、
請求項2に記載の需要予測システム。 For each of the plurality of objects, the event data includes an event data set corresponding to each event for the object.
For each event, the event data set includes an event name, frequency of occurrence, pattern of occurrence, time of occurrence, duration of occurrence, and an event effect prediction model obtained based on at least one of the above-mentioned one or more models. Of which includes at least an event effect prediction model,
The demand forecasting system according to claim 2.
請求項4に記載の需要予測システム。 The demand result information is information about an event predicted to occur in the event prediction for the specified target, and includes an element in the event data set corresponding to the event.
The demand forecasting system according to claim 4.
請求項5に記載の需要予測システム。 The demand forecasting unit accepts at least one of addition, deletion, and editing of elements in the event data set corresponding to the predicted event.
The demand forecasting system according to claim 5.
前記指定された対象は、第1の駅と第2の駅を含み、
前記需要予測において予測された需要は、前記第1の駅と前記第2の駅間での利用者数であり、
前記運行最適化システムは、前記将来の時期について、列車本数と、列車運賃と、予測された利用者数とを基に、列車本数および列車運賃の少なくとも1つを最適化するシステムである、
請求項1に記載の需要予測システム。 It is connected to the operation optimization system and
The designated object includes a first station and a second station, and includes
The demand predicted in the demand forecast is the number of users between the first station and the second station.
The operation optimization system is a system that optimizes at least one of the number of trains and the train fare based on the number of trains, the train fare, and the predicted number of users for the future time.
The demand forecasting system according to claim 1.
請求項4に記載の需要予測システム。 If the event schedule data set for the event schedule whose occurrence period is any period in the future period is pre-registered, the demand forecast unit is pre-registered in addition to the result of the event forecast. Make the demand forecast based on the event schedule data set.
The demand forecasting system according to claim 4.
前記予測されたイベントが、事前登録されているイベント予定と一致しており、且つ、前記予測されたイベント効果と前記イベント規模との乖離が一定乖離を超えている場合に、当該イベント効果が補正される、
請求項8に記載の需要予測システム。 The event schedule dataset contains the event scale expressed in the same units as demand.
The event effect is corrected when the predicted event matches the pre-registered event schedule and the deviation between the predicted event effect and the event scale exceeds a certain deviation. Be done,
The demand forecasting system according to claim 8.
前記複数の対象のうちのいずれかの対象と将来の時期との指定を受け付け、
前記指定された対象について、
当該指定された対象に対応したイベントデータを基に、前記将来の時期でのイベントの発生有無と、イベントが発生するのであれば当該イベントが需要実績値に与える影響であるイベント効果との予測であるイベント予測を行い、
前記イベント予測の結果を基に前記将来の時期での需要の予測である需要予測を行い、
当該需要予測の結果として予測された需要を表す需要結果情報を出力する、
需要予測方法。 Create a standard value based on the actual demand data showing the actual demand value in the past time series, search for one or more actual demand values whose difference from the standard value exceeds the threshold value, and find one or more actual demand values. Create event data with the value as the actual demand value affected by the event for each of the multiple targets.
Accepting the designation of one of the above multiple targets and the future time,
For the specified target
Based on the event data corresponding to the specified target, it is predicted whether or not an event will occur in the future time, and if an event occurs, the event effect, which is the effect of the event on the actual demand value. Make an event prediction and
Based on the result of the event forecast, the demand forecast, which is the forecast of the demand in the future period, is performed.
Outputs demand result information representing the predicted demand as a result of the demand forecast.
Demand forecast method.
前記複数の対象のうちのいずれかの対象と将来の時期との指定を受け付け、
前記指定された対象について、
当該指定された対象に対応したイベントデータを基に、前記将来の時期でのイベントの発生有無と、イベントが発生するのであれば当該イベントが需要実績値に与える影響であるイベント効果との予測であるイベント予測を行い、
前記イベント予測の結果を基に前記将来の時期での需要の予測である需要予測を行い、
当該需要予測の結果として予測された需要を表す需要結果情報を出力する、
ことをコンピュータに実行させるコンピュータプログラム。 Create a standard value based on the actual demand data showing the actual demand value in the past time series, search for one or more actual demand values whose difference from the standard value exceeds the threshold value, and find one or more actual demand values. Create event data with the value as the actual demand value affected by the event for each of the multiple targets.
Accepting the designation of one of the above multiple targets and the future time,
For the specified target
Based on the event data corresponding to the specified target, it is predicted whether or not an event will occur in the future time, and if an event occurs, the event effect, which is the effect of the event on the actual demand value. Make an event prediction and
Based on the result of the event forecast, the demand forecast, which is the forecast of the demand in the future period, is performed.
Outputs demand result information representing the predicted demand as a result of the demand forecast.
A computer program that lets a computer do things.
Priority Applications (5)
| Application Number | Priority Date | Filing Date | Title |
|---|---|---|---|
| JP2018055391A JP6850757B2 (en) | 2018-03-22 | 2018-03-22 | Demand forecasting system and method |
| US16/644,439 US20200202365A1 (en) | 2018-03-22 | 2018-09-18 | Demand forecast system and method |
| EP18910717.0A EP3770841A4 (en) | 2018-03-22 | 2018-09-18 | Demand prediction system and method |
| PCT/JP2018/034445 WO2019181009A1 (en) | 2018-03-22 | 2018-09-18 | Demand prediction system and method |
| TW108107740A TWI698829B (en) | 2018-03-22 | 2019-03-08 | Demand forecasting system and method |
Applications Claiming Priority (1)
| Application Number | Priority Date | Filing Date | Title |
|---|---|---|---|
| JP2018055391A JP6850757B2 (en) | 2018-03-22 | 2018-03-22 | Demand forecasting system and method |
Publications (2)
| Publication Number | Publication Date |
|---|---|
| JP2019168868A JP2019168868A (en) | 2019-10-03 |
| JP6850757B2 true JP6850757B2 (en) | 2021-03-31 |
Family
ID=67988343
Family Applications (1)
| Application Number | Title | Priority Date | Filing Date |
|---|---|---|---|
| JP2018055391A Active JP6850757B2 (en) | 2018-03-22 | 2018-03-22 | Demand forecasting system and method |
Country Status (5)
| Country | Link |
|---|---|
| US (1) | US20200202365A1 (en) |
| EP (1) | EP3770841A4 (en) |
| JP (1) | JP6850757B2 (en) |
| TW (1) | TWI698829B (en) |
| WO (1) | WO2019181009A1 (en) |
Families Citing this family (8)
| Publication number | Priority date | Publication date | Assignee | Title |
|---|---|---|---|---|
| JP2020071635A (en) * | 2018-10-31 | 2020-05-07 | トヨタ自動車株式会社 | Display control method, display controller, and display control program for demand forecast information |
| US11636381B1 (en) * | 2019-07-24 | 2023-04-25 | Legion Technologies, Inc. | Event streams in a machine learning system for demand forecasting |
| JP6914313B2 (en) * | 2019-11-15 | 2021-08-04 | 楽天グループ株式会社 | Information processing equipment, information processing methods, and programs |
| JP7175351B2 (en) * | 2021-01-11 | 2022-11-18 | 三菱電機株式会社 | Fare identification device, fare identification method and fare identification program |
| CN113360831B (en) * | 2021-06-01 | 2022-06-10 | 深圳市中晴云科技有限公司 | Intelligent logistics information system based on Internet of things |
| JP7390092B2 (en) * | 2021-08-20 | 2023-12-01 | Lineヤフー株式会社 | Information processing device, information processing method, and information processing program |
| CN114330908A (en) * | 2021-12-31 | 2022-04-12 | 中国民航信息网络股份有限公司 | Seat booking demand prediction method and device and revenue management system |
| CN117726193B (en) * | 2024-02-01 | 2024-05-14 | 创意信息技术股份有限公司 | City management event intervention control method, device, equipment and storage medium |
Family Cites Families (10)
| Publication number | Priority date | Publication date | Assignee | Title |
|---|---|---|---|---|
| TW473680B (en) * | 2000-07-18 | 2002-01-21 | Longitude Inc | Financial products having demand-based, adjustable returns, and trading exchange therefor |
| US7080026B2 (en) * | 2000-10-27 | 2006-07-18 | Manugistics, Inc. | Supply chain demand forecasting and planning |
| JP2004295226A (en) * | 2003-03-25 | 2004-10-21 | Matsushita Electric Works Ltd | Demand prediction support system, its program, and computer readable recording medium for recording this program |
| JP4596945B2 (en) | 2005-03-24 | 2010-12-15 | 富士通株式会社 | Data center demand forecasting system, demand forecasting method and demand forecasting program |
| JP2007316747A (en) * | 2006-05-23 | 2007-12-06 | Toshiba Tec Corp | Server and program for predicting number of visitors |
| JP4905086B2 (en) * | 2006-11-29 | 2012-03-28 | 富士通株式会社 | Event type estimation system, event type estimation method, and event type estimation program |
| JP4796167B2 (en) | 2009-03-27 | 2011-10-19 | 株式会社デンソーアイティーラボラトリ | Event judgment device |
| US20110047004A1 (en) * | 2009-08-21 | 2011-02-24 | Arash Bateni | Modeling causal factors with seasonal pattterns in a causal product demand forecasting system |
| WO2016067369A1 (en) * | 2014-10-28 | 2016-05-06 | 株式会社日立製作所 | People-flow analysis system and people-flow analysis method |
| JP6742894B2 (en) * | 2016-06-09 | 2020-08-19 | 株式会社日立製作所 | Data prediction system and data prediction method |
-
2018
- 2018-03-22 JP JP2018055391A patent/JP6850757B2/en active Active
- 2018-09-18 EP EP18910717.0A patent/EP3770841A4/en not_active Withdrawn
- 2018-09-18 US US16/644,439 patent/US20200202365A1/en not_active Abandoned
- 2018-09-18 WO PCT/JP2018/034445 patent/WO2019181009A1/en active Application Filing
-
2019
- 2019-03-08 TW TW108107740A patent/TWI698829B/en active
Also Published As
| Publication number | Publication date |
|---|---|
| TWI698829B (en) | 2020-07-11 |
| WO2019181009A1 (en) | 2019-09-26 |
| JP2019168868A (en) | 2019-10-03 |
| US20200202365A1 (en) | 2020-06-25 |
| EP3770841A4 (en) | 2021-09-22 |
| EP3770841A1 (en) | 2021-01-27 |
| TW201941146A (en) | 2019-10-16 |
Similar Documents
| Publication | Publication Date | Title |
|---|---|---|
| JP6850757B2 (en) | Demand forecasting system and method | |
| Antonio et al. | Predicting hotel booking cancellations to decrease uncertainty and increase revenue | |
| Mu et al. | Disruption management of the vehicle routing problem with vehicle breakdown | |
| Fügener et al. | Master surgery scheduling with consideration of multiple downstream units | |
| JP2016027461A (en) | Revenue management system and revenue management method | |
| JP2019192002A (en) | Inventory management apparatus, inventory management method, and program | |
| JP2006331060A (en) | Cost factor management system | |
| Repko et al. | Scenario tree airline fleet planning for demand uncertainty | |
| António et al. | Using data science to predict hotel booking cancellations | |
| WO2014201201A1 (en) | Method for generating a discrete forecasted staff report | |
| JP2016168970A (en) | Evaluation system and method for evaluating operation information | |
| JP7257306B2 (en) | Passenger flow prediction device, passenger flow prediction method and passenger flow prediction program | |
| JP6265871B2 (en) | Sales operation support system and sales operation support method | |
| JP2004094809A (en) | Hotel reservation estimating model creating method | |
| JP2018088069A (en) | Transportation service information providing apparatus and transportation service information providing method | |
| JP7295723B2 (en) | MAINTENANCE WORK PLANNING SUPPORT DEVICE AND MAINTENANCE WORK PLANNING SUPPORT METHOD | |
| JP7369098B2 (en) | Tenant eviction prediction device, tenant eviction prediction method, and tenant eviction prediction system | |
| JP7163105B2 (en) | Demand forecasting system and method | |
| US20230138588A1 (en) | Server and method of determining an advanced booking fee for an advance booking | |
| CN114626660A (en) | Method and apparatus for surge regulation forecasting | |
| US20180261102A1 (en) | Managing uncertainty for reliable fleet assignment across aircraft fleet operators | |
| JP7411603B2 (en) | Information processing device, program, and information processing method | |
| JP4392436B2 (en) | Point management method, card system, and point management apparatus | |
| JP6735875B1 (en) | Reservation number prediction device | |
| US20230304805A1 (en) | Travel plan proposal system |
Legal Events
| Date | Code | Title | Description |
|---|---|---|---|
| A621 | Written request for application examination |
Free format text: JAPANESE INTERMEDIATE CODE: A621 Effective date: 20200214 |
|
| TRDD | Decision of grant or rejection written | ||
| A01 | Written decision to grant a patent or to grant a registration (utility model) |
Free format text: JAPANESE INTERMEDIATE CODE: A01 Effective date: 20210216 |
|
| A61 | First payment of annual fees (during grant procedure) |
Free format text: JAPANESE INTERMEDIATE CODE: A61 Effective date: 20210308 |
|
| R150 | Certificate of patent or registration of utility model |
Ref document number: 6850757 Country of ref document: JP Free format text: JAPANESE INTERMEDIATE CODE: R150 |