JP5969907B2 - Driving efficiency estimation device and program - Google Patents
Driving efficiency estimation device and program Download PDFInfo
- Publication number
- JP5969907B2 JP5969907B2 JP2012260641A JP2012260641A JP5969907B2 JP 5969907 B2 JP5969907 B2 JP 5969907B2 JP 2012260641 A JP2012260641 A JP 2012260641A JP 2012260641 A JP2012260641 A JP 2012260641A JP 5969907 B2 JP5969907 B2 JP 5969907B2
- Authority
- JP
- Japan
- Prior art keywords
- flow rate
- compressor
- efficiency
- data set
- time
- Prior art date
- Legal status (The legal status is an assumption and is not a legal conclusion. Google has not performed a legal analysis and makes no representation as to the accuracy of the status listed.)
- Expired - Fee Related
Links
Images


Description
本発明は、コンプレッサ制御技術に関し、特に並列運転される複数のコンプレッサについて、コンプレッサの運転効率を個別に推定する運転効率推定技術に関する。 The present invention relates to a compressor control technique, and more particularly to an operation efficiency estimation technique for individually estimating compressor operation efficiency for a plurality of compressors operated in parallel.
工場などの施設では、複数のコンプレッサを用いた圧縮空気供給システムを設け、これらコンプレッサを並列的に運転することにより、空気(あるいは冷媒などの混合ガス)をそれぞれ圧縮し、得られた圧縮空気をタンクで一旦集気した後、ヘッダから施設の各負荷へ分配供給するものとなっている。 In facilities such as factories, a compressed air supply system using a plurality of compressors is provided, and by operating these compressors in parallel, the air (or mixed gas such as refrigerant) is compressed, and the obtained compressed air is used. Once collected in the tank, it is distributed and supplied from the header to each load of the facility.
このような圧縮空気供給システムで消費される電力エネルギーは、設備全体で消費する電力エネルギーのうち、比較的大きな割合を占める。このため、設備の省エネルギーや省CO2を考えた場合、圧縮空気供給システムでの省エネルギーや省CO2、すなわち各コンプレッサにおける運転効率の向上が求められる。 The power energy consumed by such a compressed air supply system occupies a relatively large proportion of the power energy consumed by the entire facility. For this reason, when energy saving and CO2 saving of equipment are considered, energy saving and CO2 saving in the compressed air supply system, that is, improvement in operating efficiency in each compressor is required.
コンプレッサの運転効率は、メーカーから技術資料として提示されているが、この運転効率は、例えば、コンプレッサを最大吐出量で一定時間安定して運転させた定格運転時に得られる最良な値、すなわち定格効率、あるいは吐出量を最大より落とした状態であっても、ある吐出量で一定時間運転した状態、いわゆる定常状態における効率である。したがって、新規なコンプレッサを、常時、ほぼ定格運転させるか流量変化を生じることなく運転することができれば、このような最良の運転効率が得られる。 The operating efficiency of the compressor is presented as technical data by the manufacturer. This operating efficiency is the best value obtained during rated operation when the compressor is operated stably for a certain time at the maximum discharge rate, that is, the rated efficiency. Or, even in a state where the discharge amount is lower than the maximum, it is the efficiency in a so-called steady state in which the discharge amount is operated for a certain period of time. Therefore, if the new compressor can be operated at almost the rated operation at all times or without causing a change in flow rate, such an optimum operation efficiency can be obtained.
しかし、圧縮空気供給システムでは、負荷側の稼働状況に応じて消費される圧縮空気量が変化するため、コンプレッサの運転状態を調整して、供給する圧縮空気量および空気圧を適切な値に維持する必要がある。このため、コンプレッサの運転状態が変化するような実際の状況では、仕様としてメーカから提示されている効率は得られない。したがって、各コンプレッサが、実際にどのような運転効率で運転されているのか、把握する必要がある。 However, in the compressed air supply system, the amount of compressed air consumed varies depending on the operating condition on the load side, so the operating state of the compressor is adjusted to maintain the supplied compressed air amount and air pressure at appropriate values. There is a need. For this reason, in an actual situation where the operating state of the compressor changes, the efficiency presented by the manufacturer as the specification cannot be obtained. Therefore, it is necessary to grasp what operating efficiency each compressor is actually operating.
また、コンプレッサの運転効率は、運転状態だけでなくコンプレッサの経年変化などによっても低下するため、定期的にメンテナンスを行う必要がある。この際、運転効率の低下が最も大きいコンプレッサから、メンテナンスを行うことにより、圧縮空気供給システム全体の運転効率を早期に改善することができる。したがって、各コンプレッサの運転効率を個別にリアルタイムに把握することが重要となる。 Further, since the operating efficiency of the compressor is lowered not only by the operating state but also by the aging of the compressor, it is necessary to perform maintenance periodically. At this time, by performing maintenance from the compressor having the greatest decrease in operating efficiency, the operating efficiency of the entire compressed air supply system can be improved at an early stage. Therefore, it is important to grasp the operational efficiency of each compressor individually in real time.
また、圧縮空気供給システムでは、圧縮空気の供給圧や流量により測定した負荷の大きさに応じて各コンプレッサの起動/停止させることにより、効率よくコンプレッサを稼働させる台数制御を実施している。この場合、各コンプレッサのうち、運転効率のよいものから順に選択して起動させる方法が、省エネ、省CO2を踏まえた台数制御の基本的な考え方となっている。したがって、各コンプレッサの運転効率を個別に把握することが重要となる。 Further, in the compressed air supply system, the number control for efficiently operating the compressors is performed by starting / stopping each compressor according to the magnitude of the load measured by the supply pressure or flow rate of the compressed air. In this case, among the compressors, a method of selecting and starting the compressors in order from those having the highest operating efficiency is a basic concept of unit control based on energy saving and CO2 saving. Therefore, it is important to grasp the operation efficiency of each compressor individually.
従来、このような圧縮空気供給システムにおいて、個々のコンプレッサの運転効率を管理する技術が提案されている(例えば、特許文献1−3など参照)。これらによれば、コンプレッサごとに収集した、当該コンプレッサにおける電力使用量などの供給エネルギー指標に加えて、当該コンプレッサにおける流量データなどの消費エネルギー指標を用いて、個々のコンプレッサにおける運転効率を求めるものとなっている。 Conventionally, in such a compressed air supply system, a technique for managing the operation efficiency of each compressor has been proposed (see, for example, Patent Documents 1-3). According to these, in addition to the supply energy index collected for each compressor, such as the amount of power used in the compressor, the consumption efficiency index such as the flow rate data for the compressor is used to obtain the operating efficiency of each compressor. It has become.
このような従来技術では、各コンプレッサにおける電力使用量などの供給エネルギー指標に加え、各コンプレッサにおける流量データなどの消費エネルギー指標を用いて、個々のコンプレッサの運転効率を求めるものとなっている。このため、コンプレッサごとに、当該コンプレッサから出力された圧縮空気の流量を測定する流量計などの設備機器が必要となる。したがって、従来技術によれば、コンプレッサの運転効率を求めるためには、コンプレッサごとに設備機器の追加が必要となり、設備コストだけでなく管理コストも必要な上、機器追加のためにコンプレッサを一時停止する必要も生じるという問題点があった。 In such a conventional technique, the operating efficiency of each compressor is obtained by using a consumption energy index such as flow rate data in each compressor in addition to a supply energy index such as power consumption in each compressor. For this reason, equipment such as a flow meter for measuring the flow rate of the compressed air output from the compressor is required for each compressor. Therefore, according to the prior art, in order to obtain the compressor operating efficiency, it is necessary to add equipment to each compressor, and not only equipment costs but also management costs are required, and the compressor is temporarily stopped for equipment addition. There was a problem that it was necessary to do.
本発明はこのような課題を解決するためのものであり、コンプレッサごとに設備機器の追加を必要とすることなく、継続的に運転を続けたままコンプレッサの運転効率を容易に推定できるコンプレッサ効率推定技術を提供することを目的としている。 The present invention is for solving such problems, and it is possible to easily estimate the operation efficiency of the compressor while continuously operating without requiring the addition of equipment for each compressor. The purpose is to provide technology.
このような目的を達成するために、本発明にかかる運転効率推定装置装置は、並列運転されるn(nは2以上の整数)台のコンプレッサCi(i=1〜nの整数)について、これらコンプレッサの運転効率を個別に推定する運転効率推定装置であって、
各時間tにおける、前記各コンプレッサCiで単位時間あたりに使用された個々の電力を示す電力使用量Wtiと、これらコンプレッサCiから供給された圧縮空気全体の流量を示す全体流量Qtとを収集し、これら電力使用量Wtiと全体流量Qtとを当該時間tのデータ組として記憶部へ格納するデータ収集部と、前記記憶部に格納されている前記データ組のうちから、前記全体流量Qtが減少状態にあるデータ組を対象データ組Dtとしてm個(=n×2)選択し、これら対象データ組Dtごとに求めた、当該全体流量Qtに関する流量変化率λtと、当該全体流量Qtおよび当該電力使用量Wtiと、コンプレッサCiごとの流量変化率と運転効率との関係を近似する1次関数の切片および傾きを示す運転効率特性係数aiおよびbiとを用いて、上記式に示す当該全体流量Qtに関する流量算出式を、対象データ組Dtごとにm個生成し、これら流量算出式を連立方程式として解くことにより、前記運転効率特性係数aiおよびbiを計算する係数計算部と、任意の時間xにおける流量変化率λxに、当該コンプレッサCiの運転効率特性係数biを乗算して、当該コンプレッサCiの運転効率特性係数aiを加算することにより、当該時間xにおけるコンプレッサCiの運転効率Uxiを計算する運転効率計算部とを備えている。
In order to achieve such an object, the operation efficiency estimating apparatus according to the present invention is configured for n (n is an integer of 2 or more) compressors Ci (i = 1 to n) in parallel operation. An operating efficiency estimation device for individually estimating the operating efficiency of a compressor,
At each time t, a power usage Wti indicating individual power used per unit time in each compressor Ci and an overall flow rate Qt indicating the flow rate of the entire compressed air supplied from the compressor Ci are collected, A data collection unit that stores the power consumption Wti and the total flow rate Qt in the storage unit as a data set of the time t, and the total flow rate Qt is reduced from the data set stored in the storage unit. M (= n × 2) are selected as target data sets Dt, and the flow rate change rate λt for the total flow rate Qt, the total flow rate Qt, and the power usage obtained for each target data set Dt are selected. Operating efficiency characteristic coefficients ai and bi indicating the intercept and slope of a linear function approximating the relationship between the amount Wti, the flow rate change rate for each compressor Ci, and the operating efficiency Are used to generate m calculation formulas relating to the total flow rate Qt shown in the above formula for each target data set Dt, and solving these flow calculation formulas as simultaneous equations, the operational efficiency characteristic coefficients ai and bi By multiplying the flow rate change rate λx at an arbitrary time x by the operation efficiency characteristic coefficient bi of the compressor Ci and adding the operation efficiency characteristic coefficient ai of the compressor Ci. and an operation efficiency calculation unit for calculating the operation efficiency Uxi of the compressor Ci at x.
また、本発明にかかる上記運転効率推定装置の一構成例は、前記係数計算部が、前記連立方程式の係数行列Aに関する条件数κ(A)(Condition Number)を計算して、この条件数κ(A)としきい値κthとを比較することにより、前記対象データ組Dtから十分な解精度が得られるか否かを判定し、当該条件数κ(A)が当該しきい値κthより大きい場合には、当該条件数κ(A)が当該しきい値κth以下となるまで、当該対象データ組Dtを構成するデータ組の一部入れ替えを繰り返し行うようにしたものである。 Also, in one configuration example of the operation efficiency estimation apparatus according to the present invention, the coefficient calculation unit calculates a condition number κ (A) (Condition Number) related to the coefficient matrix A of the simultaneous equations, and the condition number κ When (A) and the threshold value κth are compared to determine whether sufficient solution accuracy can be obtained from the target data set Dt, and the condition number κ (A) is greater than the threshold value κth In this case, part of the data sets constituting the target data set Dt is repeatedly exchanged until the condition number κ (A) becomes equal to or less than the threshold value κth.
また、本発明にかかるプログラムは、コンピュータを、前述した運転効率推定装置の各部として機能させるためのプログラムである。 Moreover, the program concerning this invention is a program for functioning a computer as each part of the driving | running efficiency estimation apparatus mentioned above.
本発明によれば、各コンプレッサの運転効率が、一般的な圧縮空気供給システムに予め設置されている電力計で得られた各コンプレッサの電力使用量と、流量計で得られた全体流量とに基づき計算される。このため、コンプレッサごとに、例えば当該コンプレッサにおける流量データを測定するための流量計などの設備機器の追加を必要とすることなく、各コンプレッサの運転効率を容易に推定することが可能となる。 According to the present invention, the operating efficiency of each compressor is reduced to the power consumption of each compressor obtained with a power meter installed in advance in a general compressed air supply system and the total flow rate obtained with the flow meter. Calculated based on For this reason, it becomes possible to estimate the operating efficiency of each compressor easily without requiring addition of equipment such as a flow meter for measuring flow rate data in the compressor, for example.
また、コンプレッサごとに運転効率が推定できるため、各コンプレッサが、実際にどのような運転効率で運転されているのかを、管理者が容易に把握することができる。これにより、台数制御における運転順序を見直すことができ、省エネルギーや省CO2を実現できる。また、各コンプレッサに対するメンテナンスの要否、さらには、どのコンプレッサから順にメンテナンスを実施するかを計画することができるとともに、コンプレッサの交換要否判断にも極めて有用なデータを提供することができる。 In addition, since the operation efficiency can be estimated for each compressor, the administrator can easily grasp what operation efficiency each compressor is actually operating. Thereby, the operation order in the unit control can be reviewed, and energy saving and CO2 saving can be realized. In addition, it is possible to plan whether or not maintenance is required for each compressor, and from which compressor to perform maintenance in order, and it is possible to provide extremely useful data for determining whether or not to replace a compressor.
[発明の原理]
まず、本発明の原理について説明する。
n(nは2以上の整数)台のコンプレッサC1〜Cnが並列運転される圧縮空気供給システムにおいて、各コンプレッサC1〜Cnの運転効率を、従来の方法で個別に観測して分析した結果、ある特定の時間帯で、運転効率が低下する傾向があることがわかった。また、より詳細に空気流量と運転効率との関係を分析した結果、空気流量が低下している時間帯に、運転効率が低下していることがわかった。
[Principle of the Invention]
First, the principle of the present invention will be described.
In a compressed air supply system in which n (n is an integer of 2 or more) compressors C1 to Cn are operated in parallel, the operation efficiency of each of the compressors C1 to Cn is individually observed and analyzed by a conventional method. It was found that the operation efficiency tends to decrease in a specific time zone. Further, as a result of analyzing the relationship between the air flow rate and the operation efficiency in more detail, it was found that the operation efficiency was reduced during the time zone in which the air flow rate was decreasing.
図2は、空気流量の流量変化率に依存する運転効率特性を示すグラフである。ここでは、横軸が空気流量の変化率λ[%]を示し、縦軸が原単位からなるコンプレッサCi(i=1〜nの整数)の運転効率Ui[m3/kWh]を示している。このグラフによれば、流量変化率λが0以上の正側領域、すなわち直前時間に比べて空気流量が同じまたは増加している場合、コンプレッサCiの運転効率Uiはほぼ一定であり、流量変化率λが0より小さい負側領域、すなわち直前時間に比べて空気流量が減少した場合、その流量変化率λの大きさに応じて運転効率Uiが低減している。この原因の1つとして、空気流量の減少時には、コンプレッサCiのモータ等主要な電力発生源がそれまでの慣性により回転するため、流量の減少に比べて電力の低下が遅れて応答することが考えられる。 FIG. 2 is a graph showing operating efficiency characteristics depending on the flow rate change rate of the air flow rate. Here, the horizontal axis represents the rate of change λ [%] of the air flow rate, and the vertical axis represents the operating efficiency Ui [m 3 / kWh] of the compressor Ci (i = 1 to n) consisting of the basic unit. . According to this graph, when the flow rate change rate λ is 0 or more, that is, when the air flow rate is the same or increased as compared with the immediately preceding time, the operation efficiency Ui of the compressor Ci is substantially constant, and the flow rate change rate. When the air flow rate is reduced compared to the negative side region where λ is less than 0, that is, immediately before the time, the operation efficiency Ui is reduced in accordance with the magnitude of the flow rate change rate λ. One of the causes is that when the air flow rate decreases, the main power generation source such as the motor of the compressor Ci rotates due to the inertia so far, so that the power decrease responds later than the flow rate decrease. It is done.
本発明は、このようなコンプレッサCiにおける空気流量の流量変化率λに依存する運転効率特性のうち、流量変化率λが0より小さい負側領域における特性について、1次関数で近似できることに着目したものである。すなわち、時間tにおける全体流量Qtの流量変化率をλtとし、1次関数の切片および傾きをそれぞれai,biとした場合、時間tにおけるコンプレッサCiの運転効率Utiは、次の式(1)で表される。
![]()
![]()
また、運転効率特性係数ai,biは、各コンプレッサC1〜Cnに固有の値を持つことが観測された。このことから、この1次関数を用いれば、時間tにおけるコンプレッサCiの個別流量Qtiは、次の式(2)で表される。なお、時間tにおける全体流量をQtとし、時間tから単位時間だけ遡った時間t−1における全体流量をQt−1とし、上記1次関数の切片および傾きをそれぞれai,biとした場合、時間tにおけるλtは、次の式(3)で表される。
![]()

![]()
したがって、時間tにおけるコンプレッサCiでの電力使用量をWtiとした場合、コンプレッサC1〜Cn全体の全体流量Qtは、次の式(4)で表される。
ここで、コンプレッサCiがn台ある場合、ai,biもn個ずつ存在するため、式(4)をm(=n×2)個分用意すれば、これらを連立方程式として解くことにより、ai,biを求めることができる。
さらに、コンプレッサC1〜Cn全体の全体流量Qtと各コンプレッサCiの電力使用量Wtiとは、大幅な設備を追加することなく、一般的な圧縮空気供給システム1において、時間tごとに容易に測定できる。
Here, when there are n compressors Ci, there are n ai and bi, respectively. Therefore, if Equation (4) is prepared for m (= n × 2), by solving these as simultaneous equations, ai , Bi can be obtained.
Further, the overall flow rate Qt of the entire compressors C1 to Cn and the power consumption Wti of each compressor Ci can be easily measured at every time t in the general compressed
したがって、本発明は、時間tごとに測定したQtとWtiとのデータ組のうちから、Qtが減少状態にある対象データ組Dtをm個の取得して、これらDtを用いて式(4)からなる流量算出式をm個生成し、これら流量算出式からなる連立方程式を解くことにより、ai,biを計算するようにしたものである。
また、この後、任意の時間xにおけるQx,Qx−1を式(3)に代入して求めたλxと、先に求めた当該コンプレッサCiのai,biとを式(1)に代入して、時間xにおける各コンプレッサCiの運転効率Uxiを求めるようにしたものである。
Therefore, the present invention acquires m target data sets Dt in which Qt is decreasing from the data sets of Qt and Wti measured at each time t, and uses these Dt to obtain equation (4). Are generated, and ai and bi are calculated by solving simultaneous equations composed of these flow rate calculation formulas.
Thereafter, λx obtained by substituting Qx and Qx−1 at an arbitrary time x into the equation (3) and ai and bi of the compressor Ci obtained previously are substituted into the equation (1). The operation efficiency Uxi of each compressor Ci at time x is obtained.
[第1の実施の形態]
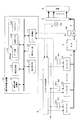
次に、図1を参照して、本発明の第1の実施の形態にかかる運転効率推定装置10について説明する。図1は、運転効率推定装置の構成を示すブロック図である。
[First Embodiment]
Next, with reference to FIG. 1, the driving | running
この運転効率推定装置10は、全体としてコントローラ、サーバ装置、パーソナルコンピュータなどの情報処理装置からなり、複数のコンプレッサC(C1〜Cn)が並列運転される圧縮空気供給システム1から収集した、個々のコンプレッサC1〜Cnに関する電力使用量Wti(i=1〜nの整数)と全体流量Qtとに基づいて、個々のコンプレッサC1〜Cnに関する運転効率を推定する機能を有している。
The operation
図1に示した圧縮空気供給システム1において、供給電力PWによりコンプレッサC1〜Cnを並列運転して得た圧縮空気は、管路2を介してタンク3に一旦集気された後、管路4およびヘッダ5を介して、圧縮空気を消費する加工機などの各負荷6に供給される。これらコンプレッサCは、コンプレッサ制御部7により、管路4に設けられた流量計4Aで時間tごとに測定した圧縮空気の全体流量Qtや、ヘッダ5に設けられた圧力計5Aで測定された圧縮空気の気圧Ptに基づく台数制御により、運転/停止、あるいはロード/アンロードが個別に制御されて、負荷6に対して圧縮空気を安定供給する。
In the compressed
[運転効率推定装置]
次に、図1を参照して、運転効率推定装置10の構成について説明する。
運転効率推定装置10には、主な機能部として、データ収集部11、操作入力部12、画面表示部13、記憶部14、係数計算部15、および運転効率計算部16が設けられている。
[Operating efficiency estimation device]
Next, the configuration of the driving
The driving
データ収集部11は、コンプレッサCi(i=1〜nの整数)ごとに設けられた電力計8(81〜8n)で測定された、各時間tにおける単位時間あたりに使用された個々の電力を示す電力使用量Wtiと、管路4に設けられた流量計4Aで測定された、これらコンプレッサCiから供給された圧縮空気全体の流量を示す全体流量Qtとを収集する機能と、これら電力使用量Wtiと全体流量Qtとを当該時間tのデータ組14Aとして記憶部14へ格納する機能とを有している。
The
操作入力部12は、キーボードやマウスなどの操作入力装置からなり、オペレータの操作を検出して出力する機能を有している。
画面表示部13は、LCDなどの画面表示装置からなり、運転効率推定のための操作画面や各機能部で得られたデータ画面を表示する機能を有している。
The
The
記憶部14は、ハードディスクや半導体メモリからなり、各機能部での処理に用いる各種の処理データやプログラム14Pを記憶する機能を有している。
プログラム14Pは、コンピュータで実行することにより各機能部を実現するためのプログラムであり、外部装置や記録媒体から読み込まれて、予め記憶部14に格納される。
The
The
記憶部14で記憶される主な処理データとして、データ組14Aと係数データ14Bがある。
データ組14Aは、データ収集部11により収集された、各時間tにおける各コンプレッサCiでの電力使用量Wtiと全体流量Qtとの組からなるデータである。
図3は、データ組の構成例である。ここでは、データ収集部11で収集された電力使用量Wtiおよび全体流量Qtが時間tごとに格納されている。
Main processing data stored in the
The
FIG. 3 is a configuration example of a data set. Here, the power usage amount Wti and the total flow rate Qt collected by the
係数データ14Bは、各コンプレッサCiの運転効率特性のうち、流量変化率λが0より小さい負側領域における特性を近似した1次関数の運転効率特性係数、すなわち切片aiおよび傾きbiを示すデータである。
図4は係数データの構成例である。ここでは、コンプレッサCiごとに、運転効率特性係数である、切片aiおよび傾きbiが格納されている。
The
FIG. 4 is a configuration example of coefficient data. Here, for each compressor Ci, an intercept ai and an inclination bi, which are operating efficiency characteristic coefficients, are stored.
係数計算部15は、記憶部14に格納されているデータ組14Aのうちから、全体流量Qtが減少中のデータ組を対象データ組Dtとしてm個(=n×2)選択する機能と、これらDtごとに、当該Qtに関する単位時間当たりの流量変化率λtを計算する機能と、これらDtごとのQtおよび当該電力使用量Wtiと、コンプレッサCiごとの運転効率特性係数aiおよびbiを用いて、前述した式(2)のQtiに関する流量算出式を、Dtごとにm個生成する機能と、これら流量算出式を連立方程式として解くことにより、各コンプレッサCiのaiおよびbiを計算する機能とを有している。
The
運転効率計算部16は、任意の時間xにおけるコンプレッサCiの運転効率Uxiを求める際、前述した式(1)に基づいて、当該時間xにおける流量変化率λxに、当該コンプレッサCiの運転効率特性係数biを乗算して、当該コンプレッサCiの運転効率特性係数aiを加算することにより、当該Uxiを計算する機能と、得られたUxiを画面表示部13で画面表示する機能とを有している。
When the operation
[第1の実施の形態の動作]
次に、本実施の形態にかかる運転効率推定装置10の動作について説明する。
まず、図5を参照して、運転効率推定装置10での係数計算処理について説明する。図5は、運転効率推定装置での係数計算処理を示すフローチャートである。
係数計算部15は、操作入力部12で検出されたオペレータ操作に応じて、あるいは一定時間ごとに、図5の係数計算処理を実行する。なお、係数計算処理にあたって、記憶部14には、データ収集部11により収集された各時間tにおけるデータ組14Aが予め格納されているものとする。
[Operation of First Embodiment]
Next, operation | movement of the driving
First, with reference to FIG. 5, the coefficient calculation process in the driving
The
係数計算部15は、まず、記憶部14のデータ組14Aから、未選択の時間tにおけるデータ組を選択し(ステップ100)、当該データ組の全体流量Qtを、例えば時間tから単位時間分だけ前に測定された全体流量Qt−1と比較して、Qtが減少中であるか確認する(ステップ101)。この場合、流量変化率λtを先に計算して、このλtの正負を確認してもよい。
The
ここで、Qt≧Qt−1(λt≧0)の場合(ステップ101:NO)、係数計算部15は、ステップ100へ戻って、未選択の時間におけるデータ組を新たに選択する。
一方、Qt<Qt−1(λt<0)の場合(ステップ101:YES)、係数計算部15は、当該データ組を対象データ組Dtとして抽出し、記憶部14に格納する(ステップ102)。
Here, when Qt ≧ Qt−1 (λt ≧ 0) (step 101: NO), the
On the other hand, when Qt <Qt−1 (λt <0) (step 101: YES), the
このようにして、係数計算部15は、Qtが減少状態にあるデータ組がDtとして、m個分抽出されるまで(ステップ103:NO)、繰り返し実行する。
Dtがm個分だけ抽出された場合(ステップ103:YES)、係数計算部15は、コンプレッサCiごとに、運転効率特性係数ai,biを割り当て(ステップ104)、Dtごとに、当該Qtに関する単位時間当たりの流量変化率λtを、前述した式(3)に基づき計算する(ステップ105)。
In this manner, the
When only Dt are extracted (step 103: YES), the
続いて、係数計算部15は、DtごとのQtおよびWtiと、コンプレッサCiごとのai,biを用いて、前述した式(4)のQtに関する流量算出式を、Dtごとにm個生成する(ステップ106)。
この後、係数計算部15は、これらm個の流量算出式から、前述した式(6)のような連立方程式を生成し(ステップ107)、これを解くことにより、各コンプレッサCiのaiおよびbiを計算し(ステップ108)、得られたai,biを記憶部14に係数データ14Bとして格納し(ステップ109)、一連の係数計算処理を終了する。
Subsequently, the
Thereafter, the
次に、図6を参照して、運転効率推定装置10での運転効率計算処理について説明する。図6は、運転効率推定装置での運転効率計算処理を示すフローチャートである。
運転効率計算部16は、操作入力部12で検出されたオペレータ操作に応じて、あるいは一定時間ごとに、図6の運転効率計算処理を実行する。なお、運転効率計算処理にあたって、記憶部14には、係数計算部15により計算された各コンプレッサCiごとに、運転効率特性係数ai,biが係数データ14Bとして格納されているものとする。
Next, the driving efficiency calculation process in the driving
The driving
運転効率計算部16は、まず、記憶部14のデータ組14Aを参照して、運転効率対象として指定された任意の時間xのデータ組から全体流量Qxを取得し(ステップ110)、前述と同様にして、流量変化率λxを計算する(ステップ111)。
First, the operation
この後、運転効率計算部16は、記憶部14の係数データ14Bから各コンプレッサCiの運転効率特性係数ai,biを取得し、これらai,biと流量変化率λxとを前述した式(1)に代入することにより、時間xにおける運転効率UxiをコンプレッサCiごとに計算する(ステップ112)。
Thereafter, the operating
また、運転効率計算部16は、記憶部14に予め格納されている各コンプレッサCiの定格効率Uriを取得し、UriからUxiを減算した値をUriで除算することにより、運転効率劣化率Rxiを計算し(ステップ113)、これらを画面表示部13で画面表示し(ステップ114)、一連の運転効率計算処理を終了する。
Further, the operating
図7は、運転効率の個別表示画面例である。ここでは、各コンプレッサC1〜CnのうちコンプレッサC1に関する、特定の時間x「11:00」における運転効率Ux1と運転効率特性とが、グラフ表示されており、横軸が流量変化率λxを示し、縦軸が運転効率Ux1(原単位)を示している。また、グラフには、コンプレッサC1の定格効率Ur1、定格効率Ur1を基準とした運転効率Ux1の劣化率を示す運転効率劣化率Rx1、運転効率特性係数a1からなる最大効率Uxmax1、および運転効率特性係数b1からなる、単位流量変化率当たりにおける運転効率Ux1の低下率Rdx1が、ともに表示されている。 FIG. 7 is an example of an individual display screen for operating efficiency. Here, the operation efficiency Ux1 and the operation efficiency characteristic at a specific time x “11:00” regarding the compressor C1 among the compressors C1 to Cn are displayed in a graph, and the horizontal axis indicates the flow rate change rate λx. The vertical axis represents the operating efficiency Ux1 (basic unit). Further, the graph shows the rated efficiency Ur1 of the compressor C1, the operating efficiency deterioration rate Rx1 indicating the deterioration rate of the operating efficiency Ux1 based on the rated efficiency Ur1, the maximum efficiency Uxmax1 composed of the operating efficiency characteristic coefficient a1, and the operating efficiency characteristic coefficient The decrease rate Rdx1 of the operation efficiency Ux1 per unit flow rate change rate, which is composed of b1, is displayed together.
この個別表示画面により、管理者は、運転効率Uxiや運転効率劣化率Rxiに基づいて、選択したコンプレッサCiが時間xにおいて、どのような状況で運転されているかを容易に確認することができる。また、最大効率Uxmaxiにより、コンプレッサCiで得られる最も良い効率を把握できるとともに、低下率Rdxiにより、流量変化率λxが低下するに連れて、どの程度の割合で運転効率Uxiが低下するのかを詳細に確認することができる。 With this individual display screen, the administrator can easily confirm under what circumstances the selected compressor Ci is operating at time x based on the operation efficiency Uxi and the operation efficiency deterioration rate Rxi. In addition, the maximum efficiency Uxmaxi can grasp the best efficiency obtained by the compressor Ci, and the reduction rate Rdxi details how much the operation efficiency Uxi decreases as the flow rate change rate λx decreases. Can be confirmed.
また、図8は、運転効率の一覧表示画面例である。ここでは、前述した時間xにおける運転効率Uxi、定格効率Uri、運転効率劣化率Rxi、最大効率Uxmaxi、および低下率Rdxiが、コンプレッサC1〜Cnごとに一覧表で表示されている。
この一覧表示画面により、時間xにおける各コンプレッサC1〜Cnに関する運転状況および運転効率特性を、容易に確認できるとともに、コンプレッサC1〜Cn間で容易に比較することができる。
Moreover, FIG. 8 is an example of a list display screen of driving efficiency. Here, the operation efficiency Uxi, the rated efficiency Uri, the operation efficiency deterioration rate Rxi, the maximum efficiency Uxmaxi, and the decrease rate Rdxi at the time x described above are displayed in a list for each of the compressors C1 to Cn.
With this list display screen, it is possible to easily confirm the operation status and the operation efficiency characteristics regarding the compressors C1 to Cn at the time x, and to easily compare the compressors C1 to Cn.
[第1の実施の形態の効果]
このように、本実施の形態は、係数計算部15が、記憶部14に格納されているデータ組14Aのうちから、全体流量Qtが減少状態にあるデータ組を対象データ組Dtとしてm個(=n×2)選択し、これら対象データ組Dtごとに求めた、当該全体流量Qtに関する流量変化率λtと、当該全体流量Qtおよび当該電力使用量Wtiと、コンプレッサCiごとの流量変化率と運転効率との関係を近似する1次関数の切片および傾きを示す運転効率特性係数aiおよびbiとを用いて、当該全体流量Qtに関する流量算出式を、対象データ組Dtごとにm個生成し、これら流量算出式を連立方程式として解くことにより、運転効率特性係数aiおよびbiを計算し、運転効率計算部16が、任意の時間xにおける流量変化率λxに、当該コンプレッサCiの運転効率特性係数biを乗算して、当該コンプレッサCiの運転効率特性係数aiを加算することにより、当該時間xにおけるコンプレッサCiの運転効率Uxiを計算するようにしたものである。
[Effect of the first embodiment]
As described above, in the present embodiment, the
これにより、各コンプレッサCiの運転効率Uxiが、一般的な圧縮空気供給システム1に予め設置されている電力計8で得られた各コンプレッサCiの電力使用量Wxiと、流量計4Aで得られた全体流量Qxとに基づき計算される。このため、コンプレッサCiごとに、例えば当該コンプレッサCiにおける流量データを測定するための流量計などの設備機器の追加を必要とすることなく、各コンプレッサCiの運転効率Uxiを容易に推定することが可能となる。この際、電力計8が設置されていない場合には、コンプレッサCiごとに電力計8の追加が必要となるが、従来のようにコンプレッサCiごとに流量計まで追加する必要はない。
Thereby, the operation efficiency Uxi of each compressor Ci was obtained by the electric power consumption Wxi of each compressor Ci obtained by the wattmeter 8 previously installed in the general compressed
また、コンプレッサC1〜Cnごとに運転効率が推定できるため、前述の図7や図8に示したような、運転効率の個別表示画面や一覧表示画面により、各コンプレッサC1〜Cnが、実際にどのような運転効率で運転されているのかを、管理者が容易に把握することができる。これにより、台数制御における運転順序を見直すことができ、省エネルギーや省CO2を実現できる。また、各コンプレッサC1〜Cnに対するメンテナンスの要否、さらには、どのコンプレッサC1〜Cnから順にメンテナンスを実施するかを計画することができるとともに、コンプレッサC1〜Cnの交換要否判断にも極めて有用なデータを提供することができる。 In addition, since the operation efficiency can be estimated for each of the compressors C1 to Cn, each compressor C1 to Cn is actually selected by the individual display screen or list display screen of the operation efficiency as shown in FIG. 7 or FIG. The administrator can easily grasp whether the vehicle is operating with such driving efficiency. Thereby, the operation order in the unit control can be reviewed, and energy saving and CO2 saving can be realized. Further, it is possible to plan whether or not maintenance is required for each of the compressors C1 to Cn, and which compressor C1 to Cn is to be maintained in order, and is extremely useful for determining whether or not to replace the compressors C1 to Cn. Data can be provided.
また、本実施の形態では、図5の係数計算処理および図6の運転効率計算処理について、それぞれオペレータ操作に応じて、あるいは一定時間ごとに実行する場合について説明した。この際、コンプレッサC1〜Cnの運転効率特性については、それほど急激に変化するものではないため、係数計算処理については、例えばメンテナンス周期に合わせて、数ヶ月や1年単位自動実行するようにしてもよい。また、運転効率計算処理については、常時、最新の全体流量Qxに基づき、一定時間ごとに実行すれば、コンプレッサC1〜Cnごとに最新の運転効率Uxiを確認することができる。なお、記憶部14に保存されているデータ組14Aに基づいて、過去の任意の時間xにおける全体流量Qxから、その時間xにおける運転効率Uxiを確認することもできる。
Further, in the present embodiment, a case has been described in which the coefficient calculation process in FIG. 5 and the operation efficiency calculation process in FIG. 6 are executed according to an operator operation or at regular intervals. At this time, since the operation efficiency characteristics of the compressors C1 to Cn do not change so rapidly, the coefficient calculation process may be automatically executed for several months or one year according to the maintenance cycle, for example. Good. Further, if the operation efficiency calculation process is always executed at regular intervals based on the latest overall flow rate Qx, the latest operation efficiency Uxi can be confirmed for each of the compressors C1 to Cn. Note that, based on the data set 14 </ b> A stored in the
[第2の実施の形態]
次に、本発明の第2の実施の形態にかかる運転効率推定装置10について説明する。
本実施の形態では、係数計算部15における対象データ組の生成について説明する。
[Second Embodiment]
Next, the driving
In the present embodiment, generation of a target data set in the
係数計算部15では、m個の流量算出式を連立方程式として解くことにより、各コンプレッサCiの運転効率特性係数ai,biを計算している。ここで、コンピュータにおいて連立方程式を解く場合、用いる流量算出式の組合せによっては、所望の計算精度が得られない場合がある。
The
例えば、時間t=1において測定された、コンプレッサCiでの電力使用量,全体流量,流量変化率を、それぞれW1i,Q1i,λ1とし、時間t=2において測定されたコンプレッサCiでの電力使用量,全体流量,流量変化率を、それぞれW2i,Q2i,λ2とした場合、これらQ1i,Q2iに関する流量計算式は、次の式(5)で表される。
また、式(5)からなる連立方程式を考えた場合、式(6)のような行列式で表現され、これを解くことによって、未知である運転効率特性係数ai,biが得られる。
図9は、連立方程式とその解を示すグラフであり、横軸がaiを示し、縦軸がbiを示している。ここでは、式(5)の流量計算式が平面ai,bi上に直線L1,L2として投影されており、式(6)の連立方程式の解Sが、直線L1,L2の交点として求められる。 FIG. 9 is a graph showing simultaneous equations and their solutions, in which the horizontal axis represents ai and the vertical axis represents bi. Here, the flow rate calculation formula of Formula (5) is projected on the planes ai and bi as straight lines L1 and L2, and the solution S of the simultaneous equations of Formula (6) is obtained as the intersection of the straight lines L1 and L2.
ここで、直線L1,L2相互間の傾きが大きい場合、すなわち直線L1,L2の法線ベクトルN1,N2が大きく異なる場合、直線L1,L2決定する係数、ここでは、測定データWi1,λ1×W1i,Wi2,λ2×W2iを要素とする正方行列からなる係数行列Aに、誤差が含まれていても、直線L1,L2の交点、すなわち解Sの位置はあまり変化しない。
しかしながら、直線L1,L2相互間の傾きが極めて小さい場合、すなわち法線ベクトルN1,N2がほぼ等しい場合、直線L1,L2決定する係数の誤差により、直線L1,L2の交点の位置が大きく変化するため、解Sの誤差εが大きくなり、解Sの精度が低下する。
Here, when the slope between the straight lines L1 and L2 is large, that is, when the normal vectors N1 and N2 of the straight lines L1 and L2 are greatly different, coefficients for determining the straight lines L1 and L2, here, measurement data Wi1, λ1 × W1i , Wi2, λ2 × W2i, even if an error is included in the coefficient matrix A composed of a square matrix, the intersection of the straight lines L1, L2, that is, the position of the solution S does not change much.
However, when the slope between the straight lines L1 and L2 is extremely small, that is, when the normal vectors N1 and N2 are substantially equal, the position of the intersection of the straight lines L1 and L2 changes greatly due to an error in the coefficient that determines the straight lines L1 and L2. Therefore, the error ε of the solution S increases, and the accuracy of the solution S decreases.
また、コンピュータで連立方程式を解く場合、一般に公開されている様々な解析ソフトウェアを利用することが可能であるが、いずれの解析ソフトウェアにおいても、処理時間と解析精度とがトレードオフの関係にあるため、ある程度の処理時間で解計算処理を打ち切ることになる。
したがって、直線L1,L2相互間の傾きが極めて小さい場合、このような解計算処理の打ち切り程度の違いによっても、直線L1,L2の交点の位置が大きく変化することになり、解Sの誤差εが大きくなる。
In addition, when solving simultaneous equations with a computer, it is possible to use various publicly available analysis software. However, in any analysis software, there is a trade-off between processing time and analysis accuracy. The solution calculation process is terminated in a certain processing time.
Therefore, when the slope between the straight lines L1 and L2 is extremely small, the position of the intersection of the straight lines L1 and L2 changes greatly even if the difference in the degree of the solution calculation process is terminated, and the error ε of the solution S Becomes larger.
本実施の形態は、係数計算部15において、対象データ組Dtから得られる解精度の判定を行うことにより、解Sの感度がある程度低く、測定データや解計算処理の打ち切りの影響を受けにくい対象データ組を選択するようにしたものである。
In the present embodiment, the
すなわち、本実施の形態にかかる係数計算部15は、このような連立方程式の係数変化に対する解Sの感度を示す指標として、連立方程式の係数行列Aに関する条件数κ(A)(Condition Number)を計算する機能と、この条件数κ(A)としきい値κthとを比較することにより、対象データ組Dtから十分な解精度が得られるか否かについて解精度判定を行う機能と、当該条件数κ(A)が当該しきい値κthより大きい場合には、当該条件数κ(A)が当該しきい値κth以下となるまで、当該対象データ組Dtを構成するデータ組の一部入れ替えを繰り返し行う機能とを有している。
That is, the
この際、条件数κ(A)については、次の式(7)に示すように、行列ノルムを用いる公知の計算手法を用いればよい。式(7)において、||A||は、係数行列Aの行列ノルムであり、||A-1||は、係数行列Aの逆行列A-1の行列ノルムである。なお、行列ノルムについては、フロベニウス・ノルムや最大ノルム等の様々な計算式が存在するが、これらはお互いに等価性(同値性)が成立することが照明されている場合がある。このような場合、計算所要時間や得られた運転効率特性係数ai,biのばらつきなどの指標に基づいて、任意の計算式を選択して用いればよい。
![]()
![]()
また、しきい値κthについては、対象となる圧縮空気供給システム1の構成、さらにはコンプレッサC1〜Cnの管理に要求される精度ごとに、固有の最適値が存在することから、必要な精度の有効数字の桁数に合わせて決めてもよいし、得られた運転効率特性係数ai,biのばらつきなどの指標に基づいて、経験的に決定してもよく、データの取得状況に応じてオペレータが変更、または自動的に変更する等、状況に応じて決定すればよい。
The threshold value κth has a specific optimum value for each accuracy required for the configuration of the target compressed
[第2の実施の形態の動作]
次に、図10を参照して、本実施の形態にかかる運転効率推定装置10の動作について説明する。図10は、運転効率推定装置での対象データ組生成処理を示すフローチャートである。
係数計算部15は、前述した図5のステップ107において、図10に示す対象データ組生成処理を実行する。
[Operation of Second Embodiment]
Next, with reference to FIG. 10, operation | movement of the driving
The
係数計算部15は、まず、図5のステップ106で生成したm個の流量算出式から、前述した式(6)のような連立方程式を生成し(ステップ200)、この連立方程式の係数行列Aについて、例えば前述した式(7)に基づいて、条件数κ(A)を計算する(ステップ201)。
続いて、係数計算部15は、条件数κ(A)と記憶部14に予め設定しておいたしきい値κthとを比較する(ステップ202)。
First, the
Subsequently, the
ここで、条件数κ(A)>しきい値κthの場合(ステップ202:NO)、係数計算部15は、データ組14Aのうちから、対象データ組Dtとして選択していない1つのデータ組を新規データ組として選択する(ステップ203)。この際、新規データ組としては、例えば、データ組14Aのうち、対象データ組Dtよりも古いもであって、かつ、最も新しいものから順に選択すればよい。これにより、選択済の対象データ組Dtとは時間的に乖離していないものを新規データ組として選択でき、データ組の入れ替えによる運転効率特性係数ai,biの誤差への影響を最小限に抑えることができる。
Here, when the condition number κ (A)> threshold value κth (step 202: NO), the
次に、係数計算部15は、対象データ組Dtのうちから、まだ除外していない1つのデータ組を除外データ組として選択する(ステップ204)。この際、除外データ組としては、例えば、対象データ組Qtのうち、まだ除外していないデータ組であって、かつ、最も古いデータ組から順に選択すればよい。
続いて、係数計算部15は、この除外データ組を新規データ組と入れ替えた後(ステップ205)、前述した図5のステップ105と同様にして、新規データ組のQtに関する単位時間当たりの流量変化率λtを、前述した式(3)に基づき計算する(ステップ206)。
Next, the
Subsequently, the
この後、係数計算部15は、同じくステップ106と同様にして、新規データ組のQtおよびWtiと、コンプレッサCiごとのai,biを用いて、前述した式(2)のQtに関する流量算出式をm個生成し(ステップ207)、ステップ200へ移行する。
これにより、除外データ組が新規データ組と入れ替えられた新たな対象データ組Dtについて、条件数κ(A)による対象データ組の解精度判定が、繰り返し行われる。この際、除外データを元に戻した状態から、繰り返し実行することになる。
Thereafter, the
As a result, for the new target data set Dt in which the excluded data set is replaced with the new data set, the solution accuracy determination of the target data set by the condition number κ (A) is repeatedly performed. At this time, it is repeatedly executed from the state in which the excluded data is restored.
一方、ステップ202において、条件数κ(A)≦しきい値κthの場合(ステップ202:YES)、係数計算部15は、その時点に選択されている対象データ組Dtで、十分な解精度が得られることが確認されたため、対象データ組生成処理を終了し、図5のステップ108へ移行して、対象データ組Dtから生成した連立方程式による、運転効率特性係数ai,biの計算処理を実行する。
On the other hand, when the condition number κ (A) ≦ threshold value κth is satisfied in step 202 (step 202: YES), the
[第2の実施の形態の効果]
このように、本実施の形態は、係数計算部15が、連立方程式の係数行列Aに関する条件数κ(A)を計算し、この条件数κ(A)としきい値κthとの比較することにより、十分な解精度が得られるか否か解精度判定を行い、条件数κ(A)がしきい値κthより大きい場合には、条件数κ(A)がしきい値κth以下となるまで、対象データ組Dtの入れ替えを繰り返し行うようにしたものである。
[Effect of the second embodiment]
Thus, in the present embodiment, the
これにより、データ組14Aのうちから、十分な解精度が得られる対象データ組Dtが自動的に選択されて、運転効率特性係数ai,biが計算される。したがって、測定データや解計算処理の打ち切りの影響が低減された、誤差の少ない運転効率特性係数ai,biを得ることができる。 As a result, the target data set Dt that provides sufficient solution accuracy is automatically selected from the data set 14A, and the operating efficiency characteristic coefficients ai and bi are calculated. Therefore, it is possible to obtain the operation efficiency characteristic coefficients ai and bi with less error, in which the influence of the censoring of the measurement data and the solution calculation process is reduced.
[実施の形態の拡張]
以上、実施形態を参照して本発明を説明したが、本発明は上記実施形態に限定されるものではない。本発明の構成や詳細には、本発明のスコープ内で当業者が理解しうる様々な変更をすることができる。また、各実施形態については、矛盾しない範囲で任意に組み合わせて実施することができる。
[Extended embodiment]
The present invention has been described above with reference to the embodiments, but the present invention is not limited to the above embodiments. Various changes that can be understood by those skilled in the art can be made to the configuration and details of the present invention within the scope of the present invention. In addition, each embodiment can be implemented in any combination within a consistent range.
また、各実施の形態において、例えば、係数計算部15に対して、複数のデータ組Dtを渡し、複数の運転効率特性の組 ai,biを計算させ、ai,biそれぞれの標準偏差等を計算させて要求されるばらつきより小さくなったら、計算を終了するなどしてもよい。
In each embodiment, for example, a plurality of data sets Dt are passed to the
また、各実施の形態では、運転効率を推定する対象として、コンプレッサで圧縮空気を生成して負荷へ供給する圧縮空気供給システムを例に説明したが、これに限定されるものではなく、圧縮空気以外、例えば冷媒などの混合ガスを圧縮して負荷へ供給する圧縮ガス供給システムなどの他のシステムにも、前述と同様にして各実施の形態を適用でき、同様の作用効果を得ることができる。 In each embodiment, the compressed air supply system that generates compressed air by the compressor and supplies it to the load has been described as an example of the target for estimating the operation efficiency. However, the present invention is not limited to this. Other than the above, for example, the embodiments can be applied to other systems such as a compressed gas supply system that compresses a mixed gas such as a refrigerant and supplies the compressed gas to the load in the same manner as described above. .
1…圧縮空気供給システム、C1〜Cn,Ci…コンプレッサ、2,4…管路、3…タンク、4A…流量計、5…ヘッダ、5A…圧力計、6…負荷、7…コンプレッサ制御部、8(81〜8n)…電力計、10…運転効率推定装置、11…データ収集部、12…操作入力部、13…画面表示部、14…記憶部、14A…データ組、14B…係数データ、14P…プログラム、15…係数計算部、16…運転効率計算部、Qt,Qx…全体流量、Wt1〜Wtn,Wti,Wxi…電力使用量、Dt…対象データ組、λt,λx…流量変化率、ai…運転効率特性係数(切片)、bi…運転効率特性係数(傾き)、Uti,Uxi…運転効率、Uri…定格効率、Rxi…運転効率劣化率、Uxmaxi…最大効率、Rdxi…低減率、S…解、κ(A)…条件数、κth…しきい値。
DESCRIPTION OF
Claims (3)
各時間tにおける、前記各コンプレッサCiで使用された個々の電力を示す電力使用量Wtiと、これらコンプレッサCiから供給された圧縮空気全体の流量を示す全体流量Qtとを収集し、これら電力使用量Wtiと全体流量Qtとを当該時間tのデータ組として記憶部へ格納するデータ収集部と、
前記記憶部に格納されている前記データ組のうちから、前記全体流量Qtが減少状態にあるデータ組を対象データ組Dtとしてm個(=n×2)選択し、これら対象データ組Dtごとに求めた、当該全体流量Qtに関する流量変化率λtと、当該全体流量Qtおよび当該電力使用量Wtiと、コンプレッサCiごとの流量変化率と運転効率との関係を近似する1次関数の切片および傾きを示す運転効率特性係数aiおよびbiとを用いて、次式
任意の時間xにおける流量変化率λxに、当該コンプレッサCiの運転効率特性係数biを乗算して、当該コンプレッサCiの運転効率特性係数aiを加算することにより、当該時間xにおけるコンプレッサCiの運転効率Uxiを計算する運転効率計算部と
を備えることを特徴とする運転効率推定装置。 An operating efficiency estimation device that individually estimates the operating efficiency of n (n is an integer of 2 or more) compressors Ci (i = an integer of 1 to n) that are operated in parallel,
At each time t, a power usage amount Wti indicating individual power used by each compressor Ci and an overall flow rate Qt indicating the total flow rate of compressed air supplied from the compressor Ci are collected, and these power usage amounts are collected. A data collection unit for storing Wti and the total flow rate Qt in the storage unit as a data set of the time t;
From the data sets stored in the storage unit, m (= n × 2) data sets in which the overall flow rate Qt is in a decreasing state are selected as target data sets Dt, and for each target data set Dt The obtained flow rate change rate λt for the total flow rate Qt, the total flow rate Qt and the power consumption Wti, and the intercept and slope of a linear function that approximates the relationship between the flow rate change rate and the operating efficiency for each compressor Ci. Using the operational efficiency characteristic coefficients ai and bi shown,
By multiplying the flow rate change rate λx at an arbitrary time x by the operation efficiency characteristic coefficient bi of the compressor Ci and adding the operation efficiency characteristic coefficient ai of the compressor Ci, the operation efficiency Uxi of the compressor Ci at the time x An operation efficiency estimation device comprising: an operation efficiency calculation unit that calculates
前記係数計算部は、前記連立方程式の係数行列Aに関する条件数κ(A)(Condition Number)を計算して、この条件数κ(A)としきい値κthとを比較することにより、前記対象データ組Dtから十分な解精度が得られるか否かを判定し、当該条件数κ(A)が当該しきい値κthより大きい場合には、当該条件数κ(A)が当該しきい値κth以下となるまで、当該対象データ組Dtを構成するデータ組の一部入れ替えを繰り返し行う
ことを特徴とする運転効率推定装置。 In the driving efficiency estimating device according to claim 1,
The coefficient calculation unit calculates a condition number κ (A) (Condition Number) related to the coefficient matrix A of the simultaneous equations, and compares the condition number κ (A) with a threshold value κth, thereby obtaining the target data. It is determined whether sufficient solution accuracy can be obtained from the set Dt. If the condition number κ (A) is greater than the threshold value κth, the condition number κ (A) is equal to or less than the threshold value κth. The driving efficiency estimation device is characterized by repeatedly performing partial replacement of data sets constituting the target data set Dt.
Priority Applications (2)
| Application Number | Priority Date | Filing Date | Title |
|---|---|---|---|
| JP2012260641A JP5969907B2 (en) | 2012-11-29 | 2012-11-29 | Driving efficiency estimation device and program |
| CN201310618318.1A CN103853691B (en) | 2012-11-29 | 2013-11-27 | Running efficiency estimating device and method |
Applications Claiming Priority (1)
| Application Number | Priority Date | Filing Date | Title |
|---|---|---|---|
| JP2012260641A JP5969907B2 (en) | 2012-11-29 | 2012-11-29 | Driving efficiency estimation device and program |
Publications (2)
| Publication Number | Publication Date |
|---|---|
| JP2014105671A JP2014105671A (en) | 2014-06-09 |
| JP5969907B2 true JP5969907B2 (en) | 2016-08-17 |
Family
ID=50861360
Family Applications (1)
| Application Number | Title | Priority Date | Filing Date |
|---|---|---|---|
| JP2012260641A Expired - Fee Related JP5969907B2 (en) | 2012-11-29 | 2012-11-29 | Driving efficiency estimation device and program |
Country Status (2)
| Country | Link |
|---|---|
| JP (1) | JP5969907B2 (en) |
| CN (1) | CN103853691B (en) |
Cited By (1)
| Publication number | Priority date | Publication date | Assignee | Title |
|---|---|---|---|---|
| JP7012219B2 (en) | 2018-03-30 | 2022-01-28 | パナソニックIpマネジメント株式会社 | Manufacturing method of laminated varistor |
Families Citing this family (2)
| Publication number | Priority date | Publication date | Assignee | Title |
|---|---|---|---|---|
| CN104989634B (en) * | 2015-07-09 | 2017-10-27 | 广东美芝制冷设备有限公司 | Monitoring system and method for compressor |
| JP7372198B2 (en) * | 2020-05-08 | 2023-10-31 | 株式会社荏原製作所 | Display system, display device and display method |
Family Cites Families (5)
| Publication number | Priority date | Publication date | Assignee | Title |
|---|---|---|---|---|
| JP5133332B2 (en) * | 2009-12-15 | 2013-01-30 | 日立オートモティブシステムズ株式会社 | Control device for internal combustion engine |
| JP2011248568A (en) * | 2010-05-26 | 2011-12-08 | Hitachi Plant Technologies Ltd | Energy management system |
| JP5621457B2 (en) * | 2010-09-21 | 2014-11-12 | 株式会社デンソー | Compressor operation control system |
| JP5469575B2 (en) * | 2010-09-22 | 2014-04-16 | アイシン高丘株式会社 | Energy management system |
| CN102713293B (en) * | 2011-07-22 | 2013-08-28 | 三浦工业株式会社 | Number-of-compressors controlling system |
-
2012
- 2012-11-29 JP JP2012260641A patent/JP5969907B2/en not_active Expired - Fee Related
-
2013
- 2013-11-27 CN CN201310618318.1A patent/CN103853691B/en not_active Expired - Fee Related
Cited By (1)
| Publication number | Priority date | Publication date | Assignee | Title |
|---|---|---|---|---|
| JP7012219B2 (en) | 2018-03-30 | 2022-01-28 | パナソニックIpマネジメント株式会社 | Manufacturing method of laminated varistor |
Also Published As
| Publication number | Publication date |
|---|---|
| JP2014105671A (en) | 2014-06-09 |
| CN103853691B (en) | 2017-03-01 |
| CN103853691A (en) | 2014-06-11 |
Similar Documents
| Publication | Publication Date | Title |
|---|---|---|
| US20120296606A1 (en) | Method, computer program, and system for performing interpolation on sensor data for high system availability | |
| EP3346205B1 (en) | Inspection management system and inspection management method | |
| JP6427357B2 (en) | Diagnosis support system and diagnosis support method | |
| CN109074066B (en) | Method for optimizing life cycle of filter and system for monitoring ventilation system | |
| JP6777142B2 (en) | System analyzer, system analysis method, and program | |
| JP5827426B1 (en) | Predictive diagnosis system and predictive diagnosis method | |
| JP5969907B2 (en) | Driving efficiency estimation device and program | |
| JP5928104B2 (en) | Performance monitoring device, performance monitoring method, and program thereof | |
| JP6489235B2 (en) | System analysis method, system analysis apparatus, and program | |
| KR20180040452A (en) | Method for detecting anomaly using equipment age index and apparatus thereof | |
| US20120072140A1 (en) | Systems, methods, and devices for analyzing utility usage with load duration curves | |
| JP6244637B2 (en) | Measurement data correction method, measurement data monitoring system, and measurement data monitoring program | |
| JP2013250958A (en) | Operational status diagnosis device for diagnosing operational status of apparatus and equipment, operational status diagnosis method, and operational status diagnosis program | |
| JP6194246B2 (en) | Refrigerator performance evaluation apparatus and method | |
| JP5969912B2 (en) | Driving efficiency estimation device and program | |
| TWI773883B (en) | Factory evaluation device, factory evaluation method, and factory evaluation program | |
| CN114645841B (en) | Method, device and storage medium for matching supply and demand of compressed air system | |
| JP2017082681A (en) | Turbine analysis device, turbine analysis method and program | |
| JP6381282B2 (en) | Abnormality detection apparatus and program | |
| JP2014106724A (en) | Air-conditioning diagnostic device and energy consumption management device | |
| KR102293466B1 (en) | Energy management apparatus and method thereof | |
| JP5907926B2 (en) | Monitoring device and program | |
| JP2018156231A (en) | Energy control system and energy management method | |
| JP7230371B2 (en) | Abnormality detection device, abnormality detection method, abnormality detection program and abnormality detection system | |
| KR20200045980A (en) | Method and system for direct estimation of exact power in real-time |
Legal Events
| Date | Code | Title | Description |
|---|---|---|---|
| A621 | Written request for application examination |
Free format text: JAPANESE INTERMEDIATE CODE: A621 Effective date: 20150916 |
|
| A977 | Report on retrieval |
Free format text: JAPANESE INTERMEDIATE CODE: A971007 Effective date: 20160620 |
|
| TRDD | Decision of grant or rejection written | ||
| A01 | Written decision to grant a patent or to grant a registration (utility model) |
Free format text: JAPANESE INTERMEDIATE CODE: A01 Effective date: 20160705 |
|
| A61 | First payment of annual fees (during grant procedure) |
Free format text: JAPANESE INTERMEDIATE CODE: A61 Effective date: 20160708 |
|
| R150 | Certificate of patent or registration of utility model |
Ref document number: 5969907 Country of ref document: JP Free format text: JAPANESE INTERMEDIATE CODE: R150 |
|
| LAPS | Cancellation because of no payment of annual fees |