JP5832747B2 - Device operating method and device for evaluating sensory cortex function - Google Patents
Device operating method and device for evaluating sensory cortex function Download PDFInfo
- Publication number
- JP5832747B2 JP5832747B2 JP2010532381A JP2010532381A JP5832747B2 JP 5832747 B2 JP5832747 B2 JP 5832747B2 JP 2010532381 A JP2010532381 A JP 2010532381A JP 2010532381 A JP2010532381 A JP 2010532381A JP 5832747 B2 JP5832747 B2 JP 5832747B2
- Authority
- JP
- Japan
- Prior art keywords
- stimulus
- stimuli
- sensory
- presented
- subject
- Prior art date
- Legal status (The legal status is an assumption and is not a legal conclusion. Google has not performed a legal analysis and makes no representation as to the accuracy of the status listed.)
- Active
Links
- 230000001953 sensory effect Effects 0.000 title claims description 145
- 238000011017 operating method Methods 0.000 title 1
- 230000000007 visual effect Effects 0.000 claims description 173
- 238000000034 method Methods 0.000 claims description 131
- 238000005070 sampling Methods 0.000 claims description 120
- 230000004044 response Effects 0.000 claims description 90
- 230000035945 sensitivity Effects 0.000 claims description 66
- 230000006870 function Effects 0.000 claims description 43
- 208000010412 Glaucoma Diseases 0.000 claims description 39
- 210000001508 eye Anatomy 0.000 claims description 37
- 210000001525 retina Anatomy 0.000 claims description 29
- 230000008859 change Effects 0.000 claims description 24
- 238000012545 processing Methods 0.000 claims description 22
- 210000001747 pupil Anatomy 0.000 claims description 21
- 230000000763 evoking effect Effects 0.000 claims description 18
- 210000000857 visual cortex Anatomy 0.000 claims description 17
- 206010064930 age-related macular degeneration Diseases 0.000 claims description 14
- 208000002780 macular degeneration Diseases 0.000 claims description 14
- 206010047571 Visual impairment Diseases 0.000 claims description 11
- 230000008569 process Effects 0.000 claims description 11
- 208000029257 vision disease Diseases 0.000 claims description 11
- 230000004393 visual impairment Effects 0.000 claims description 11
- 206010012689 Diabetic retinopathy Diseases 0.000 claims description 10
- 208000006011 Stroke Diseases 0.000 claims description 9
- 201000006417 multiple sclerosis Diseases 0.000 claims description 8
- 230000001788 irregular Effects 0.000 claims description 6
- 238000012886 linear function Methods 0.000 claims description 6
- 230000006399 behavior Effects 0.000 claims description 5
- 230000005670 electromagnetic radiation Effects 0.000 claims description 5
- 230000008904 neural response Effects 0.000 claims description 5
- 230000004424 eye movement Effects 0.000 claims description 3
- 230000002708 enhancing effect Effects 0.000 claims 2
- 230000004064 dysfunction Effects 0.000 claims 1
- 230000004936 stimulating effect Effects 0.000 claims 1
- 208000024891 symptom Diseases 0.000 claims 1
- 238000012360 testing method Methods 0.000 description 49
- 230000000694 effects Effects 0.000 description 43
- 238000001228 spectrum Methods 0.000 description 35
- 238000007689 inspection Methods 0.000 description 34
- 230000000638 stimulation Effects 0.000 description 34
- 230000008901 benefit Effects 0.000 description 27
- 238000011156 evaluation Methods 0.000 description 23
- 210000004027 cell Anatomy 0.000 description 17
- 230000002207 retinal effect Effects 0.000 description 15
- 210000000653 nervous system Anatomy 0.000 description 14
- 230000003068 static effect Effects 0.000 description 14
- 238000012937 correction Methods 0.000 description 13
- 210000003994 retinal ganglion cell Anatomy 0.000 description 12
- 208000037265 diseases, disorders, signs and symptoms Diseases 0.000 description 11
- 230000008520 organization Effects 0.000 description 11
- 238000001914 filtration Methods 0.000 description 10
- 238000004458 analytical method Methods 0.000 description 8
- 238000005259 measurement Methods 0.000 description 8
- 230000001965 increasing effect Effects 0.000 description 7
- 238000000926 separation method Methods 0.000 description 7
- 230000000875 corresponding effect Effects 0.000 description 6
- 230000002829 reductive effect Effects 0.000 description 6
- 102000001554 Hemoglobins Human genes 0.000 description 5
- 108010054147 Hemoglobins Proteins 0.000 description 5
- 238000005311 autocorrelation function Methods 0.000 description 5
- 210000003050 axon Anatomy 0.000 description 5
- 230000001054 cortical effect Effects 0.000 description 5
- 230000007547 defect Effects 0.000 description 5
- 238000013461 design Methods 0.000 description 5
- 238000001514 detection method Methods 0.000 description 5
- 201000010099 disease Diseases 0.000 description 5
- 238000005286 illumination Methods 0.000 description 5
- 230000033001 locomotion Effects 0.000 description 5
- 239000011159 matrix material Substances 0.000 description 5
- 230000003595 spectral effect Effects 0.000 description 5
- 208000001072 type 2 diabetes mellitus Diseases 0.000 description 5
- 241001465754 Metazoa Species 0.000 description 4
- 238000010521 absorption reaction Methods 0.000 description 4
- 230000006378 damage Effects 0.000 description 4
- 230000007423 decrease Effects 0.000 description 4
- 230000006735 deficit Effects 0.000 description 4
- 208000035475 disorder Diseases 0.000 description 4
- 238000009499 grossing Methods 0.000 description 4
- 238000012544 monitoring process Methods 0.000 description 4
- 230000002123 temporal effect Effects 0.000 description 4
- 208000012902 Nervous system disease Diseases 0.000 description 3
- 208000025966 Neurological disease Diseases 0.000 description 3
- 206010047555 Visual field defect Diseases 0.000 description 3
- 230000009286 beneficial effect Effects 0.000 description 3
- 210000004556 brain Anatomy 0.000 description 3
- 238000004364 calculation method Methods 0.000 description 3
- 238000011161 development Methods 0.000 description 3
- 230000018109 developmental process Effects 0.000 description 3
- 238000003745 diagnosis Methods 0.000 description 3
- 238000010586 diagram Methods 0.000 description 3
- 230000001771 impaired effect Effects 0.000 description 3
- 230000000670 limiting effect Effects 0.000 description 3
- 210000005036 nerve Anatomy 0.000 description 3
- 230000003287 optical effect Effects 0.000 description 3
- 210000004761 scalp Anatomy 0.000 description 3
- 210000003625 skull Anatomy 0.000 description 3
- 208000003098 Ganglion Cysts Diseases 0.000 description 2
- 208000017442 Retinal disease Diseases 0.000 description 2
- 208000005400 Synovial Cyst Diseases 0.000 description 2
- 238000007563 acoustic spectroscopy Methods 0.000 description 2
- 230000009471 action Effects 0.000 description 2
- 210000003484 anatomy Anatomy 0.000 description 2
- 238000003491 array Methods 0.000 description 2
- 230000001276 controlling effect Effects 0.000 description 2
- 230000005684 electric field Effects 0.000 description 2
- PCHJSUWPFVWCPO-UHFFFAOYSA-N gold Chemical compound [Au] PCHJSUWPFVWCPO-UHFFFAOYSA-N 0.000 description 2
- 230000003993 interaction Effects 0.000 description 2
- 238000013507 mapping Methods 0.000 description 2
- 239000000463 material Substances 0.000 description 2
- 230000005055 memory storage Effects 0.000 description 2
- 210000004126 nerve fiber Anatomy 0.000 description 2
- 230000001537 neural effect Effects 0.000 description 2
- 230000000926 neurological effect Effects 0.000 description 2
- 230000004751 neurological system process Effects 0.000 description 2
- 230000002093 peripheral effect Effects 0.000 description 2
- 230000004439 pupillary reactions Effects 0.000 description 2
- 238000011002 quantification Methods 0.000 description 2
- 230000005855 radiation Effects 0.000 description 2
- 208000014733 refractive error Diseases 0.000 description 2
- 230000002441 reversible effect Effects 0.000 description 2
- 210000001044 sensory neuron Anatomy 0.000 description 2
- 238000009662 stress testing Methods 0.000 description 2
- 230000000542 thalamic effect Effects 0.000 description 2
- 230000009466 transformation Effects 0.000 description 2
- OPCMVVKRCLOEDQ-UHFFFAOYSA-N 1-(4-chlorophenyl)-2-(methylamino)pentan-1-one Chemical compound ClC1=CC=C(C=C1)C(C(CCC)NC)=O OPCMVVKRCLOEDQ-UHFFFAOYSA-N 0.000 description 1
- CYJRNFFLTBEQSQ-UHFFFAOYSA-N 8-(3-methyl-1-benzothiophen-5-yl)-N-(4-methylsulfonylpyridin-3-yl)quinoxalin-6-amine Chemical compound CS(=O)(=O)C1=C(C=NC=C1)NC=1C=C2N=CC=NC2=C(C=1)C=1C=CC2=C(C(=CS2)C)C=1 CYJRNFFLTBEQSQ-UHFFFAOYSA-N 0.000 description 1
- 206010002329 Aneurysm Diseases 0.000 description 1
- 201000004569 Blindness Diseases 0.000 description 1
- 208000032131 Diabetic Neuropathies Diseases 0.000 description 1
- 241000282412 Homo Species 0.000 description 1
- 241000238413 Octopus Species 0.000 description 1
- 208000000208 Wet Macular Degeneration Diseases 0.000 description 1
- 230000032683 aging Effects 0.000 description 1
- 230000003321 amplification Effects 0.000 description 1
- 238000013459 approach Methods 0.000 description 1
- UVXCXZBZPFCAAJ-UHFFFAOYSA-N arc-111 Chemical class C1=C2OCOC2=CC2=C(N(CCN(C)C)C(=O)C3=C4C=C(C(=C3)OC)OC)C4=CN=C21 UVXCXZBZPFCAAJ-UHFFFAOYSA-N 0.000 description 1
- 230000003542 behavioural effect Effects 0.000 description 1
- 230000015572 biosynthetic process Effects 0.000 description 1
- 210000005252 bulbus oculi Anatomy 0.000 description 1
- 238000006243 chemical reaction Methods 0.000 description 1
- 239000003086 colorant Substances 0.000 description 1
- 230000000052 comparative effect Effects 0.000 description 1
- 238000013527 convolutional neural network Methods 0.000 description 1
- 230000002596 correlated effect Effects 0.000 description 1
- 230000003247 decreasing effect Effects 0.000 description 1
- 230000001934 delay Effects 0.000 description 1
- 238000004141 dimensional analysis Methods 0.000 description 1
- 230000003292 diminished effect Effects 0.000 description 1
- 238000009826 distribution Methods 0.000 description 1
- 229940079593 drug Drugs 0.000 description 1
- 239000003814 drug Substances 0.000 description 1
- 230000007717 exclusion Effects 0.000 description 1
- 238000002599 functional magnetic resonance imaging Methods 0.000 description 1
- 238000007429 general method Methods 0.000 description 1
- 239000010931 gold Substances 0.000 description 1
- 229910052737 gold Inorganic materials 0.000 description 1
- 230000012010 growth Effects 0.000 description 1
- 210000003128 head Anatomy 0.000 description 1
- 230000009599 head growth Effects 0.000 description 1
- 239000004973 liquid crystal related substance Substances 0.000 description 1
- 230000001404 mediated effect Effects 0.000 description 1
- 230000009525 mild injury Effects 0.000 description 1
- 230000009526 moderate injury Effects 0.000 description 1
- 230000035772 mutation Effects 0.000 description 1
- 238000003199 nucleic acid amplification method Methods 0.000 description 1
- 210000001328 optic nerve Anatomy 0.000 description 1
- 238000005457 optimization Methods 0.000 description 1
- 238000003909 pattern recognition Methods 0.000 description 1
- 239000000049 pigment Substances 0.000 description 1
- 238000003825 pressing Methods 0.000 description 1
- 230000000750 progressive effect Effects 0.000 description 1
- 230000010344 pupil dilation Effects 0.000 description 1
- 238000011084 recovery Methods 0.000 description 1
- 230000009467 reduction Effects 0.000 description 1
- 238000011160 research Methods 0.000 description 1
- 230000008458 response to injury Effects 0.000 description 1
- 230000009528 severe injury Effects 0.000 description 1
- 230000001629 suppression Effects 0.000 description 1
- 238000010998 test method Methods 0.000 description 1
- 210000001103 thalamus Anatomy 0.000 description 1
- 238000012876 topography Methods 0.000 description 1
- 230000001052 transient effect Effects 0.000 description 1
- 238000011282 treatment Methods 0.000 description 1
- 230000004400 visual pathway Effects 0.000 description 1
- 210000000239 visual pathway Anatomy 0.000 description 1
- 230000037303 wrinkles Effects 0.000 description 1
Images


Classifications
-
- A—HUMAN NECESSITIES
- A61—MEDICAL OR VETERINARY SCIENCE; HYGIENE
- A61B—DIAGNOSIS; SURGERY; IDENTIFICATION
- A61B3/00—Apparatus for testing the eyes; Instruments for examining the eyes
- A61B3/02—Subjective types, i.e. testing apparatus requiring the active assistance of the patient
- A61B3/024—Subjective types, i.e. testing apparatus requiring the active assistance of the patient for determining the visual field, e.g. perimeter types
-
- A—HUMAN NECESSITIES
- A61—MEDICAL OR VETERINARY SCIENCE; HYGIENE
- A61B—DIAGNOSIS; SURGERY; IDENTIFICATION
- A61B5/00—Measuring for diagnostic purposes; Identification of persons
- A61B5/24—Detecting, measuring or recording bioelectric or biomagnetic signals of the body or parts thereof
- A61B5/316—Modalities, i.e. specific diagnostic methods
- A61B5/369—Electroencephalography [EEG]
- A61B5/377—Electroencephalography [EEG] using evoked responses
- A61B5/378—Visual stimuli
Description
本発明は神経系の機能の評価に関し、具体的には複数の感覚次元の感覚野の評価、最も具体的には第二次視覚野の評価に関する。 The present invention relates to the evaluation of the function of the nervous system, specifically to the evaluation of sensory areas of a plurality of sensory dimensions, most specifically to the evaluation of the secondary visual cortex.
本発明は主として、ヒトおよび動物対象の感覚野、具体的には目の視野の改良された評価および定量化のための方法および装置として使用する目的で開発されたものであり、以下、本発明の説明はこのアプリケーションに関連して行う。しかしながら、本発明がこの特定の用途分野に限定されないことは認識されるであろう。これらの感覚野は、感覚野内の点の集まりにおける感覚神経の能力の測度で定義される。本明細書において説明する発明は、これらの感覚野の変異をより正確に決定するための方法および装置を提供し、感覚野の変異は、成長、老化、瞼、メガネフレームの位置または頭蓋形状を含む病気の進行または自然な進行に関連する場合があり、これらは全て、感覚野の感度を変えるか、感覚野の範囲の物理的限界を変える可能性がある。 The present invention was developed primarily for use as a method and apparatus for improved evaluation and quantification of sensory areas of human and animal subjects, specifically the visual field of the eye. Will be described in connection with this application. However, it will be appreciated that the invention is not limited to this particular field of application. These sensory areas are defined by a measure of the ability of sensory nerves in a collection of points within the sensory area. The invention described herein provides a method and apparatus for more accurately determining these sensory cortex mutations, which are related to growth, aging, wrinkles, eyeglass frame position or skull shape. It may be related to the progression of the disease involved or natural progression, all of which can change the sensitivity of the sensory cortex or the physical limits of the sensory cortex range.
本明細書を通じて、背景技術に関するあらゆる論考は、いかなる場合も、そのような背景技術が先行技術であること、のみならず、そのような背景技術が当該分野で広く知られている、または当該分野における共通の一般的知識の一部を形成することを是認するものとして見なされるべきではない。 Throughout this specification, any discussion of background art is in any case not only that such background art is prior art, but also such background art is widely known in the art, or Should not be viewed as an admission to form part of the common general knowledge in
ヒトの視野は、一般に、静的視野検査によって評価される。静的視野検査では、視野内に分散される予め設定された点の集まりの各々において光の小さいスポットを連続的に提示することが一般的に行われる。検査スポットの各提示に続いて、対象は、固視標的を凝視し続けながら提示されたばかりの検査光が見えたか否かを指示する。典型的には、対象は、ボタンを押すこと等の行動で反応してそのスポットが見えたことを指示する。視野の特定の部分は、固有の視覚的能力を有する可能性がある。したがって、視野検査の目的は、視野の各部分の視覚的能力を評価することにある。 The human visual field is generally assessed by static visual field examination. In static visual field inspection, it is common practice to continuously present small spots of light in each of a set of preset points dispersed within the visual field. Following each presentation of the inspection spot, the subject indicates whether the inspection light just presented was visible while continuing to stare at the fixation target. Typically, the subject reacts with actions such as pressing a button to indicate that the spot has been seen. Certain parts of the field of view may have unique visual capabilities. Thus, the purpose of visual field inspection is to assess the visual ability of each part of the visual field.
視覚的能力はしばしば、スポット刺激を見るための感度または確実性によって特徴づけられる。したがって、これらの行動ベース形式の視野検査に関しては2つの基本的方法、すなわち、閾値上検査と閾値検査とが存在する。閾値上検査では、視野内の予め設定されたロケーション集合の各々において幾つかの提示が行われ、次に、正しい応答の頻度を使用して視覚的能力が推定される。閾値検査では、検査刺激の強度または対比が方針にしたがって変えられ、見える最小基準回数が達成される時点の僅かな開始刺激力、すなわち閾値が決定される。局部的な視覚的感度を決定するために操作される他の刺激変数は、所定の検査領域へ提示される小さいオブジェクトの数、または提示される検査刺激のサイズである。したがって、視覚的感度は僅かな閾値刺激の逆数に一致され、よって小さい閾値は高い感度に対応する。 Visual ability is often characterized by sensitivity or certainty to see spot stimuli. Therefore, there are two basic methods for these behavior-based visual field tests: an over-threshold test and a threshold test. In an over-threshold test, several presentations are made at each of a pre-set set of locations in the field of view, and then visual ability is estimated using the correct frequency of response. In the threshold test, the intensity or contrast of the test stimulus is varied according to the policy, and a slight starting stimulus, i.e., threshold, is determined when the minimum reference number of looks is achieved. Another stimulus variable that is manipulated to determine local visual sensitivity is the number of small objects presented to a given examination area, or the size of the examination stimulus presented. Thus, the visual sensitivity is matched to the reciprocal of a small threshold stimulus, so a small threshold corresponds to a high sensitivity.
視野をマッピングする代替的な、より客観的な方法は、所謂多焦点的方法を使用するものである。これらの方法では、各々が異なる視野ロケーションへ提示される刺激の集合が使用される。各ロケーションにおける刺激の出現または非出現は、互いに統計学的に独立である時間系列によって変調される。理想的には、この統計学的独立性は完全であるべきであり、すなわち、変調シーケンスは直交性であるべきである。特定の直交シーケンス(Maddess & Jamesに付与された米国特許第5,539,482号、その開示内容は相互参照により全体が本明細書に組み込まれる)および直交に近いシーケンス(Sutterに付与された米国特許第4,846,567号を含む)に関連する種々の特許が存在するが、最近の解析方法は、全てMaddess & Jamesに付与された、開示内容が相互参照により全て本明細書に組み込まれる米国特許第6,315,414号、米国特許第7,006,863号および国際公開第WO 2005/051193号に記述されているように、より一般的な刺激の使用を可能にする。 An alternative, more objective method of mapping the field of view is to use a so-called multifocal method. These methods use a set of stimuli, each presented to a different visual field location. The appearance or non-occurrence of stimuli at each location is modulated by a time sequence that is statistically independent of each other. Ideally this statistical independence should be perfect, i.e. the modulation sequence should be orthogonal. Specific orthogonal sequences (US Pat. No. 5,539,482 to Maddess & James, the disclosure of which is incorporated herein in its entirety by reference) and near orthogonal sequences (US Pat. No. 4,846,567 to Sutter) The latest analysis methods are all assigned to Maddess & James, the disclosure of which is hereby incorporated by reference in its entirety, US Pat. No. 6,315,414, US Pat. Enables the use of more general stimuli as described in 7,006,863 and WO 2005/051193.
多焦点的方法の概念は、刺激の時間統計学的独立性は多くのシーケンスが同時に提示されることを可能にし、各ロケーションにおける提示に対して推定される応答が視覚神経系の神経活動の記録から回復されることを可能にする、ということにある。刺激に対する神経応答は、電気的もしくは磁気的センサまたは検出器、赤外光または他の電磁放射線の吸収、散乱または偏向の変化、機能的磁気応答画像または瞳孔反応によって記録され得る。 The concept of the multifocal method allows the temporal statistical independence of stimuli to allow many sequences to be presented simultaneously, and the estimated response to presentation at each location is a record of neural activity in the visual nervous system. To be able to be recovered from. Neural responses to stimuli can be recorded by electrical or magnetic sensors or detectors, absorption of infrared light or other electromagnetic radiation, changes in scattering or deflection, functional magnetic response images or pupillary responses.
静的視野検査は、一定サイズの手持ち式の刺激が視野の周辺から中心へ向かって、すなわち凝視固定点へ向かって移動される動的視野検査から発生したものである。動的視野検査では、対象は、中心へ向かうその軌跡に沿ってどの点で検査刺激が見えるかを指示し、視野の中心から所定の距離において見ることのできる最小サイズの刺激が視覚的感度の示度として採用される。最も有力な動的視野検査システムは、1945ゴールドマンシステム(Goldman system)である。ゴールドマンシステムは、標準的な刺激スポットサイズセットを規定した。その後これらは、大部分の静的視野検査で標準刺激サイズとして極く一般的に採用されている。静的視野検査は検査手順の自動標準化を提供し、主にこれを理由として、大幅に動的視野検査に取って代わっている。この名称における静的という用語は、検査刺激が固定点においてフラッシュされることに由来し、これらの点は、典型的には規則的なサンプリング格子内に配列されている。静的視野検査を実行するための最も一般的な2つのシステムは、Carl Zeiss Meditecが製造する様々なバージョンのハンフリー視野計(HFA)、およびHaag-Streit AGが製造する様々なオクトパス視野計である。これらのデバイスの影響を示すものとして、他の企業が製造する視野計は、米国食品医薬品局の承認を得るためにしばしばHFAとの実質的同等性を主張する。 A static visual field test originates from a dynamic visual field test where a hand-held stimulus of a certain size is moved from the periphery of the field of view to the center, i.e. towards the fixation point. In a dynamic visual field test, the subject indicates at which point along the trajectory towards the center the test stimulus is visible, and the smallest size stimulus that can be seen at a given distance from the center of the visual field is the visual sensitivity. Adopted as an indication. The most powerful dynamic visual field inspection system is the 1945 Goldman system. The Goldman system defined a standard stimulus spot size set. These are then very commonly adopted as standard stimulus sizes in most static visual field tests. Static visual field inspection provides automatic standardization of inspection procedures and largely replaces dynamic visual field inspection mainly because of this. The term static in this name comes from the fact that test stimuli are flushed at fixed points, which are typically arranged in a regular sampling grid. The two most common systems for performing static perimetry are the various versions of Humphrey perimeter (HFA) manufactured by Carl Zeiss Meditec, and the various octopus perimeter manufactured by Haag-Streit AG. . As an indication of the impact of these devices, perimeters manufactured by other companies often claim substantial equivalence to HFA to obtain US Food and Drug Administration approval.
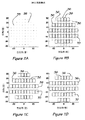
多くの静的視野検査で、標準検査刺激はゴールドマン指標サイズIIIである。まれに、これより大きいサイズVの刺激が使用される。最も一般的な静的視野検査に使用される検査格子は、視野の中心24〜30度をカバーする。サンプル格子は、6度の典型的分離を有する点の正方形格子であり、これらの検査ロケーションのうちの50以上が調査される。検査格子の軸は、水平および垂直に配向される。一部の静的視野計は、2度の分離を得るために検査格子を均等に収縮または拡大することを可能にする。HFAはよくゴールドスタンダードと見なされ、また最も多く販売されている視野計でもある。他社がまねる最も一般的に使用されているHFA検査は、検査点の分離が6度のHFA24−2検査パターンである。ゴールドマン指標サイズIIIのスポットは、直径0.431度を有する。規格HFA24−2検査格子は54個の検査ロケーションを有し、よって検査スポットは合計7.84平方度をカバーする。24−2パターンによりスパンされる視野のエリアは、1368平方度(すなわち、24−2パターンにおける点格子は38個の正方形を画定し、各々が一辺6度である故に38*36平方度=1368平方度)である。したがって、この検査スポットは合計で、検査される視野エリアの0.573%しかサンプリングしない。他のほとんどの視野計も、同様に視野のカバー率は低い。明らかに、視野の重大な細部が見逃される多大な範囲が存在する。この問題は、一般にアンダーサンプリングと称される。アンダーサンプリングは、動的視野検査において同じスポットサイズが使用される場合、但しスポットが視野を横断する経路に沿って途切れのない動作で掃引される場合にはさほど問題ではなく、網膜の一部も欠けていない可能性があった。 In many static visual field tests, the standard test stimulus is Goldman index size III. In rare cases, a larger size V stimulus is used. The inspection grid used for the most common static visual field inspection covers the center 24-30 degrees of the visual field. The sample grid is a square grid of points with a typical separation of 6 degrees, and more than 50 of these inspection locations are investigated. The axis of the inspection grid is oriented horizontally and vertically. Some static perimeters allow the examination grid to be evenly contracted or expanded to obtain a two degree separation. HFA is often considered the gold standard and is the most widely sold perimeter. The most commonly used HFA inspection imitated by other companies is the HFA 24-2 inspection pattern with 6 inspection point separations. Goldman index size III spots have a diameter of 0.431 degrees. The standard HFA 24-2 inspection grid has 54 inspection locations, so the inspection spot covers a total of 7.84 square degrees. The area of the field of view spanned by the 24-2 pattern is 1368 square degrees (ie, the point grid in the 24-2 pattern defines 38 squares, each of which is 6 degrees on a side, so 38 * 36 square degrees = 1368). Square degrees). Therefore, this inspection spot samples a total of only 0.573% of the visual field area to be inspected. Most other perimeters have low field coverage as well. Clearly, there is a great range where critical details of the field of view are missed. This problem is commonly referred to as undersampling. Undersampling is not a problem when the same spot size is used in dynamic visual field examinations, but when the spot is swept in an uninterrupted motion along the path traversing the visual field. There was a possibility that it was not missing.
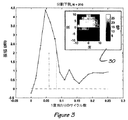
二次元のサンプリング技術について考察する場合には、アンダーサンプリングという結果が、価値のあるまたは重要な情報を単に見逃すことよりも悪いことは明らかである。逆に、サンプリング格子が粗すぎて視野上の感度の急激な変化を捉えられない場合、HFAサンプリングスキームは測定される視野の外観を歪める可能性がある。これは、サンプリング格子が粗すぎて視野上の感度の急激な変化を捉えられない場合に発生する。より具体的には、s度の規則的スペーシングを有する任意のサンプリング格子は、サンプリングアレイが確実に提示できる最も高い空間周波数である臨界サンプリング周波数Scを規定する。Scは、ナイキストサンプリング周波数と呼ばれることがある。静的視野計では一般的な6度のサンプリングスペーシングの場合、Scは水平および垂直的な1度当たり1/12サイクル(cpd)から直交的な1/(12*√2)までの間で変わる。したがって、視野が1度当たりScサイクル(cpd)より速く変わる空間変調を有していれば、これらは、エイリアシングと呼ばれるプロセスを介して、サンプリングされる視野内により低い空間周波数として出現する。テレビ画面に見られる薄い縞模様のオブジェクトによるモアレパターンおよび「ジャジング」効果は、エイリアシングによって生じるアーティファクトの一般的な例である。 When considering two-dimensional sampling techniques, it is clear that the result of undersampling is worse than simply missing valuable or important information. Conversely, if the sampling grid is too coarse to capture a sudden change in sensitivity on the field of view, the HFA sampling scheme can distort the appearance of the field of view being measured. This occurs when the sampling grid is too coarse to capture a sudden change in sensitivity on the field of view. More specifically, an arbitrary sampling lattice with s of the regular spacing defines the critical sampling frequency S c is the highest spatial frequency sampling array can reliably presented. S c is sometimes called the Nyquist sampling frequency. If the sampling spacing typical 6 degrees in a static perimeter, S c is between horizontal and vertical, one-time per 1/12 cycle (cpd) to orthogonal as 1 / (12 * √2) Will change. Therefore, as long as it has a field of view quickly changed spatial modulation than S c cycles per degree (cpd), these are via a process called aliasing appears as lower spatial frequencies by the field of view to be sampled. Moire patterns and “jazzing” effects due to thin striped objects found on television screens are common examples of artifacts caused by aliasing.
サンプリングされる画像のこれらの歪みは、NScと(N+1)Sc(但し、Nは1で始まる奇整数)との間で生じる、Scより高い空間周波数S>Scが周波数Sc−rem(S,Sc)を有するように見えることを理由に、偶数であって2で始まるNの場合の周波数rem(S,Sc)において生じる。但し、remは剰余関数である。より単純に言えば、視野におけるScを超える周波数は、空間的な歪み効果を生み出す様々な位相および方向性でScより低い何らかの周波数として出現する。これらのより高い周波数は低周波数を装うことから、誤って測定されるこれらの周波数はエイリアス、このプロセスはエイリアシングと称されることがある。 These distortions of the image to be sampled, NS c and (N + 1) S c (where, N is the odd integer beginning with 1) occurs between the high spatial frequency than S c S> S c is the frequency S c - rem (S, S c) on the grounds that appear to have, it occurs at a frequency in the case of N starting with 2 an even number rem (S, S c). Here, rem is a remainder function. More simply, frequencies above S c in the field of view appear as some frequencies below S c in various phases and orientations that produce spatial distortion effects. Since these higher frequencies impersonate lower frequencies, these erroneously measured frequencies are sometimes referred to as aliases, and this process is sometimes referred to as aliasing.
アンチエイリアシングフィルタは、デジタル化システムのフロントエンドエレクトロニクスでは非常に一般的なものである。すなわち、サンプリング周波数が復元する可能性のあるより高い周波数はサンプリングの前に除去される。しかしながら、このような時間フィルタは、空間エイリアシングの除去をアシストしない。したがって、検査刺激における空間エイリアシングの影響を克服することのできる改良された評価方法に対する要望が存在する。 Anti-aliasing filters are very common in front-end electronics of digitization systems. That is, higher frequencies where the sampling frequency may be restored are removed before sampling. However, such a temporal filter does not assist in removing spatial aliasing. Accordingly, there is a need for an improved evaluation method that can overcome the effects of spatial aliasing in test stimuli.
第1の態様によれば、対象の少なくとも1つの感覚野の機能を評価するための方法が提供されている。本方法は、少なくとも1つの感覚野の選択されたロケーションへ刺激を提示することを含んでもよい。選択されたロケーションは、少なくとも1つの感覚野の一部分をスパンするサンプリング格子上の点に中心が置かれてもよい。個々の刺激がサンプリング格子の複数の点において同時に提示される場合、これらの個々の刺激は、視野の感覚次元によって画定される空間において重なるように構成されてもよい。対象の視野へ提示される刺激は、付随する応答(または複数の応答)を喚起する場合がある。個々の刺激は、サンプリング格子により表され得るものより高い空間周波数を個々に表示しないように大きくかつ側面が平滑であってもよい。 According to a first aspect, a method is provided for evaluating the function of at least one sensory area of a subject. The method may include presenting the stimulus to a selected location of at least one sensory area. The selected location may be centered at a point on the sampling grid that spans a portion of at least one sensory field. If individual stimuli are presented simultaneously at multiple points of the sampling grid, these individual stimuli may be configured to overlap in a space defined by the sensory dimension of the visual field. Stimulation presented to the subject's field of view may elicit an associated response (or responses). Individual stimuli may be large and smooth on the sides so as not to individually display higher spatial frequencies than can be represented by the sampling grid.
本方法はさらに、センサを用いて対象の感覚野における応答を検出する工程を含んでもよい。本方法はさらに、検出された応答を処理する工程を含んでもよい。検出された応答を処理する工程は、検出された応答を選択されたロケーションにおける対象の感覚野の機能に関連づけることであってもよい。 The method may further comprise detecting a response in the sensory area of the subject using a sensor. The method may further include processing the detected response. The step of processing the detected response may be associating the detected response with a function of the subject's sensory area at the selected location.
第1の態様の一構成では、対象の少なくとも1つの感覚野の機能を評価するための方法が提供され、本方法は、
前記感覚野の選択されたロケーションへ刺激を提示する工程であって、前記選択されたロケーションは、少なくとも1つの感覚野の一部分をスパンするサンプリング格子上の点に中心が置かれ、個々の刺激が前記サンプリング格子の複数の点において同時に提示される場合、前記個々の刺激は少なくとも1つの視野の感覚次元によって画定される空間において重なる工程と、
センサを用いて、前記刺激により喚起される対象の感覚野内の応答を検出する工程と、
前記検出された応答を前記選択されたロケーションにおける対象の感覚野の機能に関連づけるべく処理する工程と
を含む。
In one configuration of the first aspect, a method for assessing the function of at least one sensory area of a subject is provided, the method comprising:
Presenting a stimulus to a selected location of the sensory field, the selected location being centered at a point on a sampling grid spanning a portion of at least one sensory field, wherein each stimulus is When presented simultaneously at multiple points of the sampling grid, the individual stimuli overlap in a space defined by the sensory dimension of at least one visual field;
Using a sensor to detect a response in the sensory area of the subject evoked by the stimulus;
Processing the detected response to correlate to a function of the sensory area of interest at the selected location.
刺激は、個々の刺激が同時に提示される場合にこれらの個々の刺激が十分に重なり合いかつ側面が平滑であってサンプリング格子上の刺激の空間エイリアシングを最小限に抑えるように構成されてもよい。個々の刺激は、これらがサンプリング格子により表示され得るものより高い空間周波数を個々に表示しないように十分に大きくかつ側面が平滑であってもよい。すなわち、刺激は、サンプリング格子が正確に表示できない空間周波数をほとんどまたは全く送信しなくてもよい。あるいは、もしくは並行して、刺激は、同時に提示されれば個々の刺激が十分に重なり合い、よってナイキストレートと称されかつサンプリング格子のジオメトリにより画定されるサンプリング格子の臨界サンプリング周波数より高い空間周波数をほとんどまたは全く伝達しないように構成されてもよい。個々の刺激のプロファイル(具体的には、プロファイルのエッジおよび/または角)は、滑らかに変化していてもよい。個々の刺激の滑らかに変わるプロファイルは、低い空間周波数のフーリエ成分しか含むことができないほど十分に平滑であってもよい。個々の刺激は、ぼかされてもよい。刺激のプロファイルは、個々の刺激が、サンプリング格子の複数の点により画定されサンプリング格子により表示され得る最も高い空間周波数以下である空間周波数しか含まないように、滑らかに変わっていてもよい。十分に平滑である、またはぼやけた個々の刺激には、対象が十分な屈折矯正を受けなくてもよく(すなわち、屈折矯正が誤った、不十分なものであっても、全く行われなくてもよく)、対象の視野の評価結果にさほど影響がない、という重大な利点がある。 The stimuli may be configured such that when individual stimuli are presented simultaneously, these individual stimuli are sufficiently overlapped and smooth on the sides to minimize spatial aliasing of the stimuli on the sampling grid. The individual stimuli may be large enough and smooth on the sides so that they do not individually display higher spatial frequencies than can be displayed by the sampling grid. That is, the stimulus may transmit little or no spatial frequency that the sampling grid cannot accurately display. Alternatively, or in parallel, the stimuli overlap well with the individual stimuli when presented at the same time, and thus have a spatial frequency almost higher than the critical sampling frequency of the sampling grid, referred to as the Nyquist rate and defined by the sampling grid geometry. Alternatively, it may be configured not to transmit at all. Individual stimulus profiles (specifically, the edges and / or corners of the profile) may vary smoothly. The smoothly varying profile of an individual stimulus may be sufficiently smooth that it can contain only low spatial frequency Fourier components. Individual stimuli may be blurred. The stimulus profile may vary smoothly so that individual stimuli contain only spatial frequencies that are below the highest spatial frequency defined by the sampling grid and displayed by the sampling grid. Individual stimuli that are sufficiently smooth or blurred may not require the subject to undergo sufficient refractive correction (ie, even if the refractive correction is wrong or inadequate, it is not performed at all) There is a significant advantage that the evaluation result of the visual field of the subject is not significantly affected.
感覚野は、水平の経線軸および垂直の経線軸を有してもよく、刺激は、個々の刺激が感覚野のこれらの垂直または水平の経線軸のいずれかに重ならないように適合化されてもよい。 The sensory cortex may have a horizontal meridian axis and a vertical meridian axis, and the stimuli are adapted so that individual stimuli do not overlap either of these vertical or horizontal meridian axes of the sensory cortex Also good.
刺激は、刺激を知覚的に空間周波数が倍増されて出現させる配列で提示されてもよい。刺激は、空間的に周波数が倍増された配列が知覚されるように提示されてもよい。刺激は、周波数倍増周波数より低い、または高い空間周波数が知覚される配列で提示されてもよい。刺激は、周波数倍増周波数より30%低いものから周波数倍増周波数の200%までの空間周波数が知覚される配列で提示されてもよい。知覚される空間周波数は、知覚される倍増空間周波数の30%〜200%までの範囲内であってもよい。サンプリング格子は、極座標表現で提示されてもよい。刺激は、使用に際して各刺激が感覚野内のほぼ同数の感覚細胞を刺激するように選ばれてもよい。視野の各部分に対する個々の刺激のサイズおよび形状は、極座標表現内で関心のある視野変化における空間的自己相関を計算することによって推定されてもよい。極座標表現の座標は、半径および極角度の線形または非線形関数であってもよい。 The stimuli may be presented in an arrangement that causes the stimuli to appear perceptually at a doubled spatial frequency. The stimulus may be presented such that an array with spatially doubled frequency is perceived. Stimuli may be presented in an arrangement in which spatial frequencies below or above the frequency doubling frequency are perceived. Stimuli may be presented in an array in which spatial frequencies from 30% below the frequency doubling frequency to 200% of the frequency doubling frequency are perceived. The perceived spatial frequency may be in the range of 30% to 200% of the perceived double spatial frequency. The sampling grid may be presented in a polar coordinate representation. The stimuli may be chosen such that in use each stimulus stimulates approximately the same number of sensory cells in the sensory field. The size and shape of individual stimuli for each part of the field of view may be estimated by calculating the spatial autocorrelation at the field change of interest within the polar coordinate representation. The polar coordinate representation may be a linear or non-linear function of radius and polar angle.
本方法はさらに、約3対1のアスペクト比を有する1つ以上のフィルタの作動によって、極座標表現内の概して細長い特徴を拡大する工程を含んでもよい。線形フィルタは、実行手段またはガウス窓を備えてもよい。1つ以上のフィルタは、エッジ保存フィルタであってもよい。エッジ保存フィルタは、メジアンフィルタ、前後方向メジアンフィルタまたは反復的非線形フィルタのうちの1つ以上から選択されてもよい。 The method may further include the step of enlarging the generally elongated feature in the polar representation by actuation of one or more filters having an aspect ratio of about 3 to 1. The linear filter may comprise execution means or a Gaussian window. The one or more filters may be edge preserving filters. The edge preserving filter may be selected from one or more of a median filter, a front-back median filter, or an iterative nonlinear filter.
本方法はさらに、応答を記録する工程を含んでもよい。応答は、メモリに記録されてもよい。応答は、応答を処理する工程より前、または応答の処理後のいずれかで記録されてもよい。処理された応答は、処理後に記録されてもよい。メモリは、メモリ格納用データベースまたはデバイスであっても、コンピュータ読取り可能メモリデバイスであってもよい。 The method may further comprise recording the response. The response may be recorded in memory. The response may be recorded either before the step of processing the response or after processing of the response. The processed response may be recorded after processing. The memory may be a memory storage database or device or a computer readable memory device.
対象の感覚野において刺激により喚起される応答は、以下:例えば、刺激により喚起される皮質電位を検出するために対象の頭皮上に装着される複数の記録用電極を備える脳波計(EEG)デバイスを使用して、電界および/または電位の変化を検出することにより電気的ポテンシャルを検出することと、例えば脳磁計(MEG)の記録エレメントのEEGに類似する装置の磁場および/または磁気的ポテンシャルを検出することと、感覚神経系の活動により生成される還元ヘモグロビンの神経系を介する流れから生じる核差動磁気共鳴信号によって誘発される電界または磁界の一方または双方を検出することと、あるいは、例えば感覚神経系の活動により生成される還元ヘモグロビンまたは酸化ヘモグロビンにより差動的に散乱または吸収される赤外線を検出することとにより電磁放射線を検出することから成る群から選択される方法、または類似の編成による検出方法によって検出されてもよい。あるいは、対象の感覚野において刺激により喚起される応答は、神経過程により影響される赤外信号に応答する、音響分光法を含む音響信号の変化を検出することによって、対象の一方もしくは双方の瞳孔の応答変化を検出することによって、または対象の目の動きの変化を検出することによって検出されてもよい。 The response evoked by the stimulus in the subject's sensory cortex is as follows: for example, an electroencephalograph (EEG) device comprising a plurality of recording electrodes mounted on the subject's scalp to detect the cortical potential evoked by the stimulus To detect the electric potential by detecting changes in the electric field and / or potential, and for example, to determine the magnetic field and / or magnetic potential of the device similar to the EEG of the recording element of a magnetoencephalograph (MEG). Detecting and / or detecting one or both of an electric or magnetic field elicited by a nuclear differential magnetic resonance signal resulting from a flow through the nervous system of reduced hemoglobin generated by sensory nervous system activity, or, for example, Differential scattering or absorption by reduced hemoglobin or oxygenated hemoglobin generated by sensory nervous system activity The method is selected from the group consisting of detecting the electromagnetic radiation by a detecting infrared rays or may be detected by the detection method according to a similar organization. Alternatively, the response evoked by a stimulus in the subject's sensory cortex is detected by detecting changes in the acoustic signal, including acoustic spectroscopy, in response to an infrared signal affected by the neural process, so that one or both pupils of the subject May be detected by detecting a change in response of the subject or by detecting a change in the eye movement of the subject.
処理する工程は、刺激により刺激される感覚野の各刺激部分の応答を特徴づける線形および/または非線形重み関数を計算する工程を含んでもよい。処理する工程は、記録される応答を感覚野の刺激部分の直線表現へ変換する工程を含んでもよい。処理する工程は、記録される応答を感覚野の刺激部分の極座標表現へ変換する工程を含んでもよい。処理する工程はさらに、関心のある視野変化における空間的自己相関を計算することによって視野の各部分について個々の刺激のサイズおよび形状を推定することと、個々の刺激をディスプレイへ送信して感覚野検査の間に対象へ提示することとを含んでもよい。処理する工程は、極座標表現内の関心のある視野変化における空間的自己相関を計算することを含んでもよい。極座標表現の座標は、半径および極角度の線形または非線形関数として計算されてもよい。 Processing may include calculating linear and / or non-linear weight functions that characterize the response of each stimulus portion of the sensory area stimulated by the stimulus. The step of processing may include the step of converting the recorded response into a linear representation of the stimulus portion of the sensory area. The processing step may include converting the recorded response into a polar coordinate representation of the stimulus portion of the sensory cortex. The processing step further estimates the size and shape of the individual stimuli for each part of the visual field by calculating the spatial autocorrelation at the visual field changes of interest, and sends the individual stimuli to the display to Presenting to the subject during the examination. The processing step may include calculating a spatial autocorrelation at a visual field change of interest in the polar coordinate representation. The coordinates of the polar representation may be calculated as a linear or non-linear function of radius and polar angle.
刺激は、ディスプレイ上に連続式に提示されてもよく、または1つ以上の刺激が並行/同時的に提示されてもよい。並行して提示される刺激は、統計学的に独立したロケーションにおいて提示されてもよい。並行して提示される刺激は、多焦点配列で提示されてもよい。連続して、または並行して提示される刺激は、空間的にまばらに提示されてもよい。連続して、または並行して提示される刺激は、時間的にまばらに提示されてもよい。連続して、または並行して提示される刺激は、空間的かつ時間的の双方でまばらに提示されてもよい。 The stimuli may be presented continuously on the display, or one or more stimuli may be presented in parallel / simultaneously. Stimuli presented in parallel may be presented at statistically independent locations. Stimuli presented in parallel may be presented in a multifocal arrangement. Stimulations presented sequentially or in parallel may be presented sparsely in space. Stimuli presented sequentially or in parallel may be presented sparsely in time. Stimuli presented sequentially or in parallel may be presented sparsely both spatially and temporally.
2つ以上の空間的にまばらな刺激は、同時に提示されてもよい。これらの刺激は、多焦点配列で提示されてもよい。 Two or more spatially sparse stimuli may be presented simultaneously. These stimuli may be presented in a multifocal arrangement.
刺激は、多次元サンプリング格子上の点に提示されてもよい。刺激は、規則的なサンプリング格子上のロケーションに提示されてもよい。刺激は、不規則なサンプリング格子上のロケーションに提示されてもよい。刺激は、ランダムに変わるサンプリング格子上のロケーションに提示されてもよい。 Stimuli may be presented at points on the multidimensional sampling grid. Stimuli may be presented at locations on a regular sampling grid. Stimuli may be presented at locations on an irregular sampling grid. The stimulus may be presented at a location on the sampling grid that varies randomly.
評価される感覚野は、対象の少なくとも1つの視覚野、少なくとも1つの聴覚野または触覚野よりなる群から選択されてもよい。評価される感覚野は、対象の少なくとも1つの視覚野、少なくとも1つの聴覚野および触覚野よりなる群から選択される2つ以上の感覚野であってもよい。評価される感覚野は、対象の1つまたは2つの視覚野、1つまたは2つの聴覚野および1つ以上の触覚野よりなる群から選択される任意の2つ、3つ、4つ、5つまたはそれより多くの、もしくは全ての感覚野の組合せであってもよい。評価される感覚野は、これらの感覚野の大きさの部分集合を含む複合的な感覚野であってもよく、例えば、刺激の集合は視覚野および聴覚野の水平次元のみをスパンする。 The sensory area to be evaluated may be selected from the group consisting of at least one visual area, at least one auditory area or tactile area of the subject. The sensory area to be evaluated may be two or more sensory areas selected from the group consisting of at least one visual area, at least one auditory area and tactile area of the subject. The sensory area to be evaluated is any two, three, four, five, selected from the group consisting of one or two visual areas, one or two auditory areas and one or more tactile areas of the subject. It may be a combination of one or more or all sensory areas. The sensory area that is evaluated may be a complex sensory area that includes a subset of the size of these sensory areas, for example, the set of stimuli spans only the horizontal dimension of the visual and auditory areas.
評価される感覚野は、対象の少なくとも1つの視覚野であってもよい。評価される視覚野は、対象の一方または両方の網膜の視野感度であってもよい。対象の一方または両方の網膜の視覚野を評価する方法は、視覚障害を引き起こす状態を診断するための方法であってもよい。対象の一方または両方の網膜の視覚野を評価する方法は、局所的な視覚障害を引き起こす状態を診断するための方法であってもよい。前記状態は、緑内障、加齢黄斑変性症または糖尿病性網膜症のうちの1つ以上であってもよく、局所的な視覚障害は脳卒中または多発性硬化症等の神経学的疾患が原因で生じるものであってもよい。 The sensory area to be evaluated may be at least one visual area of the subject. The visual cortex to be evaluated may be the visual field sensitivity of one or both retinas of the subject. The method of assessing the visual cortex of one or both retinas of a subject may be a method for diagnosing a condition that causes visual impairment. The method of assessing the visual cortex of one or both retinas of a subject may be a method for diagnosing a condition that causes local visual impairment. The condition may be one or more of glaucoma, age-related macular degeneration, or diabetic retinopathy, and local visual impairment is caused by a neurological disease such as stroke or multiple sclerosis. It may be a thing.
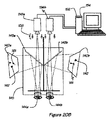
第2の態様によれば、対象の少なくとも1つの感覚野の機能を評価するための装置が提供されている。本装置は、少なくとも1つの感覚野の選択されたロケーションへ刺激を提示するためのディスプレイを備えてもよい。選択されたロケーションは、感覚野の一部分をスパンするサンプリング格子上の点に中心が置かれていてもよい。刺激は、個々の刺激がサンプリング格子の点で同時に提示される場合、これらの個々の刺激が少なくとも1つの感覚野の感覚次元により画定される空間で重なるように適合化されてもよい。 According to a second aspect, an apparatus is provided for evaluating the function of at least one sensory area of a subject. The apparatus may comprise a display for presenting stimuli to selected locations in at least one sensory area. The selected location may be centered at a point on the sampling grid that spans a portion of the sensory field. The stimuli may be adapted such that when individual stimuli are presented simultaneously at the points of the sampling grid, these individual stimuli overlap in a space defined by the sensory dimension of at least one sensory area.
対象の視野へ提示される刺激は、付随する応答を喚起してもよい。本装置はさらに、対象の感覚野における、提示される刺激により喚起される応答を検出するためのセンサを備えてもよい。個々の刺激は、これらが、関心のある感覚野変化の空間的自己相関における関心のある特徴により例示されるように十分に大きくかつ側面が平滑にされた個々の刺激であり、よってサンプリング格子により表され得るものより高い空間周波数を個々に表示しないように適合化されてもよい。 Stimulation presented to the subject's field of view may elicit an accompanying response. The apparatus may further comprise a sensor for detecting a response evoked by the presented stimulus in the subject's sensory area. The individual stimuli are individual stimuli that are large enough and smoothed on the sides as illustrated by the feature of interest in the spatial autocorrelation of the sensory field changes of interest, and thus by the sampling grid It may be adapted not to individually display higher spatial frequencies than can be represented.
本装置はさらに、検出された応答を処理するためのプロセッサを備えてもよい。検出された応答の処理は、検出された応答を、選択されたロケーションにおける対象の感覚野の機能に関連づけるためのものであってもよい。 The apparatus may further comprise a processor for processing the detected response. The processing of the detected response may be for associating the detected response with a function of the subject's sensory area at the selected location.
第2の態様の一つの配置においては、対象の感覚野の機能を評価するための装置が提供され、本装置は、
前記感覚野の選択されたロケーションへ刺激を提示するためのディスプレイであって、前記選択されたロケーションは、前記感覚野の一部分をスパンするサンプリング格子上の点に中心が置かれていて、個々の刺激は、前記サンプリング格子の点で同時に提示される場合、前記感覚野の感覚次元により画定される空間で重なるディスプレイと、
前記提示される刺激により喚起される対象の感覚野における応答を検出するためのセンサと、
前記検出された応答を前記選択されたロケーションにおける対象の感覚野の機能に関連づけるべく処理するためのプロセッサと
を備える。
In one arrangement of the second aspect, an apparatus for assessing the function of the subject's sensory area is provided, the apparatus comprising:
A display for presenting a stimulus to a selected location of the sensory field, wherein the selected location is centered at a point on a sampling grid spanning a portion of the sensory field; When stimuli are presented simultaneously at the points of the sampling grid, the display overlaps in the space defined by the sensory dimension of the sensory area;
A sensor for detecting a response in a sensory area of a subject evoked by the presented stimulus;
A processor for processing the detected response to correlate to a function of the subject's sensory cortex at the selected location.
ディスプレイは、サンプリング格子上の刺激の空間エイリアシングが最小限に抑えられるように、個々の刺激が同時に提示されれば十分に重なるような構成であってもよい刺激を提示すべく適合化されてもよい。すなわち、刺激は、サンプリング格子が正確に表示し得ない空間周波数をほとんどまたは全く送信しなくてもよい。あるいは、もしくは並行して、刺激は、同時に提示されれば個々の刺激が十分に重なり合い、よってナイキストレートと称されかつサンプリング格子のジオメトリにより画定されるサンプリング格子の臨界サンプリング周波数より高い空間周波数をほとんどまたは全く伝達しないように構成されてもよい。刺激のプロファイルは、滑らかに変化していてもよい。個々の刺激の滑らかに変わるプロファイル(具体的には、プロファイルのエッジおよび/または角)は、低い空間周波数のフーリエ成分しか含むことができないほど十分に平滑であってもよい。個々の刺激は、ぼかされてもよい。刺激のプロファイルは、個々の刺激が、サンプリング格子の複数の点により画定されサンプリング格子により表示され得る最も高い空間周波数以下である空間周波数しか含まないように、滑らかに変わっていてもよい。十分に平滑である、またはぼやけた個々の刺激には、対象が十分な屈折矯正を受けなくてもよく(すなわち、屈折矯正が誤った、不十分なものであっても、全く行われなくてもよく)、対象の視野の評価結果にさほど影響がない、という重大な利点がある。 The display may be adapted to present stimuli that may be configured to overlap sufficiently if individual stimuli are presented simultaneously, so that spatial aliasing of the stimuli on the sampling grid is minimized. Good. That is, the stimulus may transmit little or no spatial frequency that the sampling grid cannot accurately display. Alternatively, or in parallel, the stimuli overlap well with the individual stimuli when presented at the same time, and thus have a spatial frequency almost higher than the critical sampling frequency of the sampling grid, referred to as the Nyquist rate and defined by the sampling grid geometry. Alternatively, it may be configured not to transmit at all. The stimulation profile may change smoothly. The smoothly varying profile of an individual stimulus (specifically, the edges and / or corners of the profile) may be sufficiently smooth that it can contain only low spatial frequency Fourier components. Individual stimuli may be blurred. The stimulus profile may vary smoothly so that individual stimuli contain only spatial frequencies that are below the highest spatial frequency defined by the sampling grid and displayed by the sampling grid. Individual stimuli that are sufficiently smooth or blurred may not require the subject to undergo sufficient refractive correction (ie, even if the refractive correction is wrong or inadequate, it is not performed at all) There is a significant advantage that the evaluation result of the visual field of the subject is not significantly affected.
本装置は、刺激を、刺激を知覚的に空間周波数が倍増されて出現させる配列で提示するように適合化されてもよい。本装置は、刺激を、空間的に周波数が倍増された配置が知覚されるように提示すべく適合化されてもよい。本装置は、刺激を、周波数倍増周波数より低い、または高い空間周波数が知覚される配列で提示すべく適合化されてもよい。本装置は、刺激を、周波数倍増周波数より30%低いものから周波数倍増周波数の200%までの範囲内の空間周波数が知覚される配列で提示すべく適合化されてもよい。知覚される空間周波数は、知覚される倍増空間周波数の30%から200%までの範囲内であってもよい。 The device may be adapted to present the stimuli in an arrangement that causes the stimuli to appear perceptually at a doubled spatial frequency. The device may be adapted to present the stimulus such that a spatially frequency-doubled arrangement is perceived. The device may be adapted to present stimuli in an arrangement in which spatial frequencies below or above the frequency doubling frequency are perceived. The device may be adapted to present stimuli in an arrangement in which spatial frequencies are perceived in a range from 30% below the frequency doubling frequency to 200% of the frequency doubling frequency. The perceived spatial frequency may be in the range of 30% to 200% of the perceived double spatial frequency.
評価される感覚野(または複数の感覚野)は、水平の経線軸および垂直の経線軸を有してもよく、かつ本装置は、ディスプレイ上へ提示される個々の刺激が感覚野の垂直の経線軸または水平の経線軸のいずれかと重ならないように適合化されてもよい個々の刺激を提示すべく適合化されてもよい。 The sensory area (or multiple sensory areas) to be evaluated may have a horizontal meridian axis and a vertical meridian axis, and the device allows individual stimuli presented on the display to be perpendicular to the sensory area. It may be adapted to present individual stimuli that may be adapted not to overlap either the meridian axis or the horizontal meridian axis.
本装置は、サンプリング格子を極座標表現で提示するように適合化されてもよい。刺激は、使用に際して、各刺激が感覚野におけるほぼ同数の感覚細胞を刺激するように設計されてもよい。本装置のディスプレイは、サンプリング格子を極座標表現で提示するように適合化されてもよい。 The apparatus may be adapted to present the sampling grid in a polar coordinate representation. The stimuli may be designed so that, in use, each stimulus stimulates approximately the same number of sensory cells in the sensory cortex. The display of the device may be adapted to present the sampling grid in a polar coordinate representation.
本装置はさらに、概して細長い特徴を極座標サンプリング格子で拡大するための1つ以上のフィルタを備えてもよい。1つ以上のフィルタは、実行手段またはガウス窓であってもよい1つ以上の線形フィルタを備えてもよい。1つ以上のフィルタは、エッジ保存フィルタであってもよい。エッジ保存フィルタは、メジアンフィルタ、前後方向メジアンフィルタまたは反復的非線形フィルタのうちの1つ以上から選択されてもよい。 The apparatus may further comprise one or more filters for enlarging generally elongated features with a polar sampling grid. The one or more filters may comprise one or more linear filters, which may be execution means or Gaussian windows. The one or more filters may be edge preserving filters. The edge preserving filter may be selected from one or more of a median filter, a front-back median filter, or an iterative nonlinear filter.
本装置はさらに、刺激により喚起される対象の感覚野における応答を検出するためのセンサを備えてもよい。このセンサは、以下:例えば刺激により喚起される皮質電位を検出するために対象の頭皮上に装着される複数の記録用電極を備える脳波計(EEG)デバイスを使用して、電界および/または電位の変化を検出することにより電気的ポテンシャルを検出するためのセンサと、例えば脳磁計(MEG)の記録エレメントのEEGに類似する装置の磁場および/または磁気的ポテンシャルを検出するためのセンサと、感覚神経系の活動により生成される還元ヘモグロビンの神経系を介する流れから生じる核差動磁気共鳴信号によって誘発される電界または磁界の一方または双方を検出するためのセンサと、あるいは、例えば感覚神経系の活動により生成される還元ヘモグロビンにより差動的に散乱または吸収される赤外線を検出することとにより電磁放射線を検出するためのセンサとからなる群から、または類似の編成による検出方法のセンサから選択されてもよい。センサは、対象からの皮質神経応答を検出するためのセンサであってもよい。あるいは、対象の感覚野において刺激により喚起される応答は、神経過程により影響される赤外信号に応答する、音響分光法を含む音響信号の変化を検出するためのセンサ、対象の瞳孔の応答変化を検出するためのセンサ、または対象の目の動きの変化を検出するためのセンサによって検出されてもよい。 The apparatus may further include a sensor for detecting a response in the target sensory area that is evoked by the stimulus. This sensor uses the following: an electroencephalograph (EEG) device comprising a plurality of recording electrodes mounted on the subject's scalp, for example to detect cortical potentials evoked by a stimulus, and thus electric fields and / or potentials. A sensor for detecting an electrical potential by detecting a change in a magnetic field, a sensor for detecting a magnetic field and / or a magnetic potential of a device similar to the EEG of a recording element of a magnetoencephalograph (MEG), for example, and a sense A sensor for detecting one or both of the electric and / or magnetic fields elicited by nuclear differential magnetic resonance signals resulting from the flow of reduced hemoglobin through the nervous system generated by the activity of the nervous system, or for example of the sensory nervous system By detecting infrared radiation that is differentially scattered or absorbed by reduced hemoglobin produced by activity From the group consisting of a sensor for detecting the magnetic radiation, or may be selected from sensors detecting method according to a similar organization. The sensor may be a sensor for detecting a cortical nerve response from a subject. Alternatively, the response evoked by a stimulus in the sensory area of the target is a sensor for detecting changes in the acoustic signal, including acoustic spectroscopy, in response to an infrared signal affected by a neural process, and a response change in the target pupil Or a sensor for detecting a change in the movement of the subject's eyes.
検出された応答は、メモリに記録されてもよい。応答は、応答を処理する工程より前、または応答処理後のいずれかで記録されてもよい。処理された応答は、処理後に記録されてもよい。メモリは、メモリ格納用データベースまたはデバイスであっても、コンピュータ読取り可能メモリデバイスであってもよい。 The detected response may be recorded in the memory. The response may be recorded either before the step of processing the response or after the response processing. The processed response may be recorded after processing. The memory may be a memory storage database or device or a computer readable memory device.
プロセッサは、刺激により刺激される感覚野の各刺激部分の応答を特徴づける線形および/または非線形重み関数を計算するように適合化されてもよい。プロセッサは、記録される応答を感覚野の刺激部分の直線表現へ変換するように適合化されてもよい。プロセッサは、記録される応答を感覚野の刺激部分の極座標表現へ変換するように適合化されてもよい。 The processor may be adapted to calculate linear and / or non-linear weight functions that characterize the response of each stimulus portion of the sensory field stimulated by the stimulus. The processor may be adapted to convert the recorded response into a linear representation of the stimulus portion of the sensory area. The processor may be adapted to convert the recorded response into a polar coordinate representation of the stimulus portion of the sensory area.
プロセッサはさらに、関心のある視野変化における空間的自己相関を計算することによって視野の各部分について個々の刺激のサイズおよび形状を推定するように適合化されてもよく、また、刺激をディスプレイに提示するように適合化されてもよい。プロセッサは、極座標表現内の関心のある視野変化における空間的自己相関を計算してもよい。極座標表現の座標は、半径および極角度の線形または非線形関数であってもよい。 The processor may be further adapted to estimate the size and shape of individual stimuli for each part of the visual field by calculating the spatial autocorrelation at the visual field changes of interest and presents the stimuli on the display May be adapted to do so. The processor may calculate a spatial autocorrelation at the field of interest change in the polar coordinate representation. The polar coordinate representation may be a linear or non-linear function of radius and polar angle.
ディスプレイは、CRT、LCD、プラズマ、LEDまたはOLEDの各画像表示画面よりなる群から選択されてもよい。 The display may be selected from the group consisting of CRT, LCD, plasma, LED or OLED image display screens.
プロセッサは、ディスプレイ上に個々の刺激を連続式に提示するように適合化されてもよく、あるいは、1つ以上の刺激が並行/同時的に提示されてもよい。並行して提示される刺激は、統計学的に独立したロケーションにおいて提示されてもよい。並行して提示される刺激は、多焦点配列で提示されてもよい。連続して、または並行して提示される刺激は、空間的にまばらに提示されてもよい。連続して、または並行して提示される刺激は、時間的にまばらに提示されてもよい。連続して、または並行して提示される刺激は、空間的かつ時間的の双方でまばらに提示されてもよい。 The processor may be adapted to present individual stimuli sequentially on the display, or one or more stimuli may be presented in parallel / simultaneously. Stimuli presented in parallel may be presented at statistically independent locations. Stimuli presented in parallel may be presented in a multifocal arrangement. Stimulations presented sequentially or in parallel may be presented sparsely in space. Stimuli presented sequentially or in parallel may be presented sparsely in time. Stimuli presented sequentially or in parallel may be presented sparsely both spatially and temporally.
本装置は、2つ以上の空間的にまばらな刺激を同時に提示するように適合化されてもよい。あるいは、本装置は、刺激を多焦点配列で提示するように適合化されてもよい。 The device may be adapted to present two or more spatially sparse stimuli simultaneously. Alternatively, the device may be adapted to present stimuli in a multifocal arrangement.
本装置は、刺激を多次元サンプリング格子上の点に同時に提示するように適合化されてもよい。刺激は、規則的なサンプリング格子上のロケーションに提示されてもよい。刺激は、不規則なサンプリング格子上のロケーションに提示されてもよい。刺激は、ランダムに変わるサンプリング格子上のロケーションに提示されてもよい。 The device may be adapted to simultaneously present stimuli to points on a multidimensional sampling grid. Stimuli may be presented at locations on a regular sampling grid. Stimuli may be presented at locations on an irregular sampling grid. The stimulus may be presented at a location on the sampling grid that varies randomly.
本装置は、対象の少なくとも1つの視覚野、少なくとも1つの聴覚野または触覚野よりなる群から選択されてもよい感覚野を評価するように適合化されてもよい。本装置は、対象の少なくとも1つの視覚野、少なくとも1つの聴覚野および触覚野よりなる群から選択されてもよい2つ以上の感覚野を評価するように適合化されてもよい。本装置は、対象の1つまたは2つの視覚野、1つまたは2つの聴覚野および1つ以上の触覚野よりなる群から選択される任意の2つ、3つ、4つ、5つまたはそれより多くの、もしくは全ての感覚野の組合せであってもよい感覚野を評価するように適合化されてもよい。本装置は、これらの感覚野の大きさの部分集合を含む複合的な感覚野であってもよい、例えば、刺激の集合は視覚野および聴覚野の水平次元のみをスパンする感覚野を評価するように適合化されてもよい。 The apparatus may be adapted to evaluate a sensory area that may be selected from the group consisting of at least one visual area, at least one auditory area or tactile area of the subject. The apparatus may be adapted to evaluate two or more sensory areas that may be selected from the group consisting of at least one visual area, at least one auditory area and tactile area of the subject. The device may be any two, three, four, five or more selected from the group consisting of one or two visual areas, one or two auditory areas and one or more tactile areas of the subject. It may be adapted to evaluate sensory areas, which may be a combination of more or all sensory areas. The device may be a complex sensory area that includes a subset of these sensory field sizes, for example, a set of stimuli that evaluates sensory areas that span only the horizontal dimension of the visual and auditory areas. May be adapted as follows.
本装置は、対象の少なくとも1つの視覚野を評価するように適合化されてもよい。評価される視覚野は、対象の一方または両方の網膜の視野感度であってもよい。本装置は、対象の一方または両方の網膜の視覚野を評価するように適合化されてもよく、かつ視覚障害を引き起こす状態を診断するように適合化されてもよい。対象の一方または両方の網膜の視覚野の評価は、局所的な視覚障害を引き起こす状態を診断するように適合化されてもよい。前記状態は、緑内障、加齢黄斑変性症または糖尿病性網膜症のうちの1つ以上である場合があり、または、局所的な視覚障害は脳卒中または対象の片目もしくは両目に影響する多発性硬化症等の神経学的疾患が原因で生じるものである場合がある。 The apparatus may be adapted to evaluate at least one visual area of the subject. The visual cortex to be evaluated may be the visual field sensitivity of one or both retinas of the subject. The device may be adapted to assess the visual cortex of one or both retinas of a subject and may be adapted to diagnose a condition that causes visual impairment. Evaluation of the visual cortex of one or both retinas of a subject may be adapted to diagnose a condition that causes local visual impairment. The condition may be one or more of glaucoma, age-related macular degeneration, or diabetic retinopathy, or the local visual impairment is a stroke or multiple sclerosis affecting one or both eyes of the subject May be caused by neurological diseases such as
第3の態様では、対象の少なくとも1つの感覚野の機能を評価するためのシステムが提供されていて、本システムは第2の態様の装置を備え、前記装置は第1の態様の方法を実行するように適合化される。 In a third aspect, a system is provided for evaluating the function of at least one sensory area of a subject, the system comprising a device of the second aspect, said device performing the method of the first aspect. Adapted to do.
第4の態様では、対象の1つ以上の感覚野を評価するための第2および第3の態様の装置またはシステムの使用法が提供されている。評価される感覚野は視覚野であってもよく、評価は、緑内障、加齢黄斑変性症、糖尿病性網膜症、脳卒中または対象の片目もしくは両目に影響する多発性硬化症のうちの任意の1つ以上の評価であってもよい。 In a fourth aspect, there is provided use of the apparatus or system of the second and third aspects for evaluating one or more sensory areas of a subject. The sensory cortex evaluated may be the visual cortex, and the evaluation may be any one of glaucoma, age-related macular degeneration, diabetic retinopathy, stroke or multiple sclerosis affecting one or both eyes of the subject. There may be more than one evaluation.
第2または第3の態様の装置またはシステムの使用は各々、対象の1つ以上の感覚野を評価するための第1の態様の方法に一致するものであってもよい。評価される感覚野は視覚野であってもよく、評価は、緑内障、加齢黄斑変性症、糖尿病性網膜症、脳卒中または対象の片目もしくは両目に影響する多発性硬化症のうちの任意の1つ以上の評価であってもよい。 Each use of the device or system of the second or third aspect may be consistent with the method of the first aspect for assessing one or more sensory areas of the subject. The sensory cortex evaluated may be the visual cortex, and the evaluation may be any one of glaucoma, age-related macular degeneration, diabetic retinopathy, stroke or multiple sclerosis affecting one or both eyes of the subject. There may be more than one evaluation.
本明細書に開示している発明の態様は、ヒトおよび動物対象の感覚野、具体的には目の視野を評価および定量化するための改良された方法、ならびにこの改良された方法を実行するための装置およびシステムを規定する。主として、緑内障、糖尿病性網膜症(DR)または加齢黄斑変性症(AMD)等の疾患過程に起因する視覚的感度変化の検出に有益であるが、本方法は、正常な盲点の位置、頭蓋形状により決定される特定の正常なヒトの視野の絶対限界、または様々な形式の応力検査において発生する場合のある、または頭部成長の関数としての視野の可逆変化、または小児期の正常な発達の間の神経学的変化といったものを決定するために使用されてもよい。また本方法は、脳卒中または多発性硬化症等の神経学的疾患によって生じる局所的視覚障害を評価するために使用されてもよい。しかしながら、本明細書に記載する例は、提示できる種々の視野感度の入手が容易であるという理由で主に眼疾緑内障を患うヒトに関連している。しかしながら、本明細書に記述している方法および装置が加齢黄斑変性症、糖尿病性網膜症、脳卒中または多発性硬化症等の視覚的感度喪失の他の原因にも適用可能であることは認識されるであろう。 Aspects of the invention disclosed herein implement an improved method for assessing and quantifying sensory cortex of human and animal subjects, specifically the visual field of the eye, and the improved method. Define an apparatus and system for Although primarily useful for detecting changes in visual sensitivity due to disease processes such as glaucoma, diabetic retinopathy (DR) or age-related macular degeneration (AMD), this method is useful for detecting normal blind spot position, skull Absolute limits of a specific normal human visual field determined by shape, or reversible changes in visual field as a function of head growth that may occur in various forms of stress testing, or normal development in childhood May be used to determine such things as neurological changes during. The method may also be used to assess local visual impairment caused by neurological diseases such as stroke or multiple sclerosis. However, the examples described herein relate mainly to humans suffering from eye glaucoma because of the availability of various visual field sensitivities that can be presented. However, it is recognized that the methods and apparatus described herein are applicable to other causes of visual sensitivity loss such as age-related macular degeneration, diabetic retinopathy, stroke or multiple sclerosis Will be done.
本明細書に開示している発明の態様は、標準的行動媒介性視野検査に、または視野をマッピングするための多焦点的方法にも等しく適用可能である。より一般的には、本方法は、2つの触覚次元または聴覚および視覚次元または任意数のこのような感覚次元または任意の組合せについて画定される感覚野等の他の感覚野の評価へ容易に拡大してもよい。不規則なサンプリング格子には幾つかの利点があり、具体的には、正常なナイキストレートを超える感覚野の周波数成分の、位相ではないにしても電力を推定する能力がある。 Aspects of the invention disclosed herein are equally applicable to standard behavior-mediated visual field inspection or to multifocal methods for mapping visual fields. More generally, the method easily extends to the assessment of other sensory areas, such as sensory areas defined for two tactile dimensions or auditory and visual dimensions or any number of such sensory dimensions or any combination. May be. An irregular sampling grid has several advantages, specifically the ability to estimate the power, if not the phase, of the frequency components of the sensory field that exceed the normal Nyquist rate.
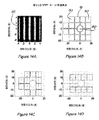
本発明者らは、視野が、視覚空間に渡って感度が急激に変わる領域を含む場合があること、および感度が急激に変わるこれらの領域に起因して、小さい検査刺激と現行の視野計に使用される粗い空間サンプリングとの組合せがこれらの高い空間周波数をエイリアシングによって被測定視野の歪みに変形することを見出している。これらの設計上の欠陥の偏在性は、意外にも当業者が、標準的な視野検査装置におけるエイリアシングによる潜在的問題を認識していないことを強く示している。したがって、本明細書に開示している態様の編成において、視野を定量化するために使用される視覚的刺激を、これらが特定のサンプリング格子内の隣接するロケーションに提示されると重なり合うように設計されかつぼやけたエッジを有するように修正することは、一般に使用されている方法および装置を凌ぐ著しい利点を提供することが認識される。サンプリング格子に関する大型サイズとエッジのぼかしとの組合せは、格子が規則的かランダムかに関わらずサンプリング格子の密度によって確実には表示され得ない高い空間周波数による潜在的な歪み効果を防止することが見出されている。 The inventors have found that the field of view may include regions where the sensitivity changes abruptly across visual space, and due to these regions where the sensitivity changes rapidly, small test stimuli and current perimeters It has been found that the combination with the coarse spatial sampling used transforms these high spatial frequencies into a field of view distortion by aliasing. The ubiquity of these design defects surprisingly strongly indicates that those skilled in the art are not aware of potential problems due to aliasing in standard vision inspection equipment. Thus, in the organization of the aspects disclosed herein, the visual stimuli used to quantify the field of view are designed to overlap when they are presented at adjacent locations within a particular sampling grid. It is recognized that modifying to have a blurred and blurred edge provides significant advantages over commonly used methods and apparatus. The combination of large size and edge blurring on the sampling grid prevents potential distortion effects due to high spatial frequencies that cannot be reliably displayed by the density of the sampling grid, whether the grid is regular or random. Has been found.
本明細書に開示している方法および装置のさらなる重要な利点は、同時に提示されれば重なり合う多くの刺激を有することによって特定の刺激が視野感度変化の所定のパッチと重なる場合もあり、これにより、局所化された感度差を識別するその刺激の能力が最大化されることにある。 A further important advantage of the method and apparatus disclosed herein is that certain stimuli may overlap certain patches of visual field sensitivity change by having many stimuli that overlap if presented simultaneously. The ability of the stimulus to identify localized sensitivity differences is to be maximized.
網膜神経節細胞、具体的にはその軸索が視神経乳頭または視神経円板まで辿る経路、の解剖学的構造のさらなる考察、および後頭視覚野の各半分は視野の左または右半分しか表示しないという事実を介して、視野の水平および垂直経線に沿って画定される視覚的感度のステップは珍しいものではないことが認識される。したがって、刺激は潜在的に互いに重なり合うべきものではあるが、視野評価のための方法および装置の特定の編成、特にこれらの経線に重ならない、または交わらない視覚刺激集合の編成では、視覚的感度のこのような経線ステップを検出する能力は最大化される場合があることが見出されている。 Further consideration of the anatomy of retinal ganglion cells, specifically the path that their axons follow to the optic disc or optic disc, and that each half of the occipital visual cortex displays only the left or right half of the field of view Through fact, it is recognized that the steps of visual sensitivity defined along the horizontal and vertical meridians of the field of view are not uncommon. Thus, the stimuli should potentially overlap each other, but in certain arrangements of methods and devices for visual field assessment, especially in the arrangement of visual stimulus sets that do not overlap or intersect these meridians, It has been found that the ability to detect such meridian steps may be maximized.
さらなる態様では、本発明者らによって、視野の極座標マップは網膜感度のむらのある変化を特徴づけることにさらに適合していることが認識されている。したがって、異なるサンプリング格子を用いて取得される視野のマップが異なる被測定視野を比較する目的で標準化された単一表現に変換されるべきものである場合、その表現が規格極座標表現であれば、視野の分析に著しい利点がもたらされる場合がある。これは、各視野ロケーションにおける最適な刺激サイズを決定するために、視野変化の空間的自己相関関数等の測定値が関連座標系において決定されることも可能にする。視野のこのような極座標表現は、容易に認識され得る拡大した矩形形状または単純な線形勾配に視野感度の一般的変化がマップされる緑内障において特に効用がある。最後に、半径方向の座標表現は中心視野へ適切な重みを与えることが認識されていて、極性刺激は、個々の刺激が各々ほぼ同数の感覚細胞を刺激するように設計されることが可能である。 In a further aspect, it has been recognized by the inventors that the polar map of the field of view is further adapted to characterize uneven changes in retinal sensitivity. Thus, if the field of view maps obtained using different sampling grids are to be converted into a standardized single representation for the purpose of comparing different measured fields of view, if the representation is a standard polar coordinate representation, There may be significant advantages to visual field analysis. This also allows measurements such as the spatial autocorrelation function of the visual field change to be determined in the relevant coordinate system to determine the optimal stimulus size at each visual field location. Such a polar representation of the field of view is particularly useful in glaucoma where general changes in field sensitivity are mapped to an enlarged rectangular shape or simple linear gradient that can be easily recognized. Finally, it is recognized that radial coordinate representations give appropriate weights to the central field of view, and polar stimuli can be designed so that each individual stimulus stimulates approximately the same number of sensory cells each. is there.
ある特定の配置では、対象の感覚野の成分パーツの機能状態を評価するための方法が提供されていて、本方法は、
(a)関心のある感覚野のその部分をスパンする潜在的に多元性の規則的または不規則なサンプリング格子上の点に中心が置かれた感覚野の個々の部分へ刺激を提示する工程であって、前記個々の刺激は十分に大きく、十分滑らかに変わるプロファイルを有し、よってこれらの刺激は多次元感覚野内で見出される、前記サンプリング格子の密度では正確に表現され得ないものより高い周波数を伝達せず、よって前記サンプリング格子の点において同時に提示されれば前記個々の刺激は空間で重なり合う工程と、
(b)特定の刺激が感度の変化した感覚野の所定のパッチと十分に重なり合うように、エイリアシングがサンプリングに与える影響を大幅に減らすために必要と思われる刺激位置より多い位置を重ね合わせる工程と
を含む。
In one particular arrangement, a method is provided for evaluating the functional state of the component parts of the subject's sensory area, the method comprising:
(A) presenting a stimulus to an individual part of the sensory field centered at a point on a potentially multi-dimensional regular or irregular sampling grid spanning that part of the sensory field of interest; And the individual stimuli have a sufficiently large and sufficiently smoothly changing profile, so that these stimuli are found in multidimensional sensory areas, higher frequencies than can be accurately represented by the density of the sampling grid The individual stimuli overlap in space if presented simultaneously at the points of the sampling grid, and
(B) superimposing more positions than would be needed to significantly reduce the effect of aliasing on sampling so that a particular stimulus is sufficiently overlapped with a given patch of sensory area with altered sensitivity; including.
視野を特徴づけるための各刺激のサイズおよび形状は、網膜に関連する視覚野または視床視覚部位の感覚ニューロンの半径方向対称性およびより高い中心窩密度に関連して選ばれてもよい。視野を特徴づけるための各刺激のサイズおよび形状は、個々の刺激の各々が網膜に関連する視覚野または視床視覚部位のほぼ同数の感覚ニューロンを刺激するように選ばれてもよい。 The size and shape of each stimulus for characterizing the visual field may be chosen in relation to the radial symmetry and higher foveal density of sensory neurons in the visual cortex or thalamic visual region associated with the retina. The size and shape of each stimulus for characterizing the visual field may be chosen such that each individual stimulus stimulates approximately the same number of sensory neurons in the visual cortex or thalamic visual site associated with the retina.
視野の各部分に対する個々の刺激の最適なサイズおよび形状は、視野データの極座標表現内部の関心のある視野変化における空間的自己相関等の測定値を計算することによって推定されてもよい。前記極座標表現において、変換される空間の座標は半径および極角度の線形または非線形関数であってもよい。 The optimal size and shape of individual stimuli for each part of the field of view may be estimated by calculating measurements such as spatial autocorrelation at the field of interest changes within the polar representation of the field of view data. In the polar coordinate representation, the coordinates of the space to be transformed may be a linear or nonlinear function of radius and polar angle.
刺激の大きさは、ある測定状況では利用可能な信号対雑音比が特に損傷のある視野においてより低い場合があることを考慮すれば、極空間における分析から最適であると予測されるものより大きくてもよい。 The magnitude of the stimulus is greater than what is expected to be optimal from analysis in polar space, considering that in some measurement situations the available signal-to-noise ratio may be lower, especially in damaged fields of view. May be.
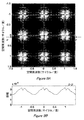
重なり合い滑らかに変わる(すなわち、十分に平滑である、またはぼやけた)刺激は、空間周波数を倍増する錯覚を表示することがある。重なり合いエッジがぼかされた刺激は、実際の刺激空間周波数より高い空間周波数を表示することがある。このより高い空間周波数は、実際の刺激空間周波数の2倍より高い場合がある。低空間周波数コンテンツの優位性に基づいて、より高い空間周波数は概して1cpdを下回ってもよい。重なり合いぼかされた刺激は、視野の一領域内の急激なコントラスト反転、急激なオンセットおよびオフセット、または視野を横断する急激な移動よりなる群から選択される時間変調と結合されてもよい。時間変調により、刺激は10Hz〜30Hzの間の速度で変調されてもよいが、刺激内の比較的少ない比率の周波数を構成するという条件で、任意の領域において他の周波数も含んでもよい。 A stimulus that overlaps and changes smoothly (ie, is sufficiently smooth or blurred) may display the illusion of doubling the spatial frequency. A stimulus with overlapping edges blurred may display a higher spatial frequency than the actual stimulus spatial frequency. This higher spatial frequency may be higher than twice the actual stimulation spatial frequency. Based on the superiority of low spatial frequency content, higher spatial frequencies may generally be below 1 cpd. Overlapped blurring may be combined with a time modulation selected from the group consisting of abrupt contrast reversals, abrupt onsets and offsets within a region of the field of view, or abrupt movement across the field of view. With time modulation, the stimulus may be modulated at a rate between 10 Hz and 30 Hz, but may also include other frequencies in any region, provided that it constitutes a relatively small proportion of frequencies within the stimulus.
特定の編成において、個々の刺激は、サンプリング格子がサンプリング格子密度により画定される正常なナイキストレートを上回ることになる感覚野内の周波数の電力の推定を可能にすべく適切にランダムであったことを条件として、関心のある幾つかの周波数を伝達するように、不十分にぼかされたプロファイルまたは不十分な重なり合いを有してもよい。 In a particular organization, the individual stimuli were appropriately random to allow estimation of the frequency power in the sensory field that would result in the sampling grid exceeding the normal Nyquist rate defined by the sampling grid density. As a condition, you may have a poorly blurred profile or insufficient overlap to convey some frequencies of interest.
使用に際して、個々の刺激は、視野評価が行われている対象の視野の各部分へ個々に提示されてもよい。対象の行動応答は、各ロケーションへ提示される刺激について決定されてもよい。行動応答は、対象によるボタン押しであってもよい。刺激の最小コントラストまたは輝度の閾値は、各刺激ロケーション毎に決定されてもよい。閾値上刺激を認識する周波数は、各刺激ロケーション毎に決定されてもよい。 In use, individual stimuli may be presented individually to each portion of the subject's field of view for which the field of view is being evaluated. A subject's behavioral response may be determined for the stimulus presented to each location. The action response may be a button press by the object. A minimum contrast or brightness threshold for the stimulus may be determined for each stimulus location. The frequency for recognizing the above-threshold stimulus may be determined for each stimulus location.
刺激の提示方法は多焦点式であってもよく、そのロケーションにおける各刺激は時間系列によって変調されていく。時間系列は、検査されている対象の神経系の各部分へ提示される各刺激に対して測定された応答を特徴づけるように適合化される線形および非線形重み関数が推定されることを可能にすべく十分に統計学的に独立していてもよい。測定される応答は、検査されている対象の神経系の各刺激に対する応答の推定値を提供してもよい。測定される応答は、所定の刺激系列と異なる遅延における刺激系列自体との間の相互作用に対する応答を含んでもよい。測定される応答は、第1のロケーションにおける刺激と他のロケーションおよび幾つかの遅延における少なくとも1つの他の刺激との間の相互作用を含んでもよい。測定される応答は、客観的に測定される検出および神経系からの神経活動の記録から推定されてもよい。記録される測定値は、必要に応じて適切なセンサおよび/またはレコーダによって検出および/または記録されてもよい。センサは、電気または磁気センサ、赤外線または他の電磁放射線の吸収、散乱または偏向の変化を検出することに適するセンサ、機能的な磁気共鳴画像センサ、または対象の一方もしくは両方の瞳孔の応答を検出するためのセンサよりなる群から選択されてもよい。検出された応答は、次に、メモリデバイス等の適切なレコーダに記録されてもよい。 The presentation method of the stimulus may be multifocal, and each stimulus at the location is modulated by a time sequence. The time series allows linear and nonlinear weight functions to be estimated that are adapted to characterize the measured response to each stimulus presented to each part of the nervous system being examined. It may be statistically independent enough. The measured response may provide an estimate of the response to each stimulus of the subject's nervous system being examined. The measured response may include a response to an interaction between a predetermined stimulus sequence and the stimulus sequence itself at a different delay. The measured response may include an interaction between a stimulus at the first location and at least one other stimulus at another location and several delays. The measured response may be estimated from objectively measured detections and recordings of neural activity from the nervous system. The recorded measurements may be detected and / or recorded by appropriate sensors and / or recorders as needed. Sensors detect electrical or magnetic sensors, sensors suitable for detecting changes in absorption or scattering or deflection of infrared or other electromagnetic radiation, functional magnetic resonance imaging sensors, or the response of one or both pupils of a subject You may select from the group which consists of a sensor for doing. The detected response may then be recorded on a suitable recorder such as a memory device.
視野感度は極座標表現に変換されてもよく、よって、視野感度の局所的変化は容易に識別される場合がある。極座標表現は、極座標領域における視野変化を認識するための分析を提供してもよい。様々な視野計のサンプリング方針からのデータは、そうでなければ異なるサンプリング格子上に記述されるデータを比較するために標準的な極座標表現に変換されてもよい。 Field sensitivity may be converted to a polar coordinate representation, and thus local changes in field sensitivity may be easily identified. The polar coordinate representation may provide an analysis for recognizing field changes in the polar coordinate region. Data from various perimeter sampling strategies may be converted to a standard polar representation to compare data otherwise described on different sampling grids.
以下、添付の図面を参照して、本発明の方法、装置およびシステムの編成を単に例示的に説明する。
別段の定義のない限り、本明細書に使用される全ての技術的および科学的用語は、本発明が属する分野の当業者により一般的に理解されるものと同じ意味を有する。以下、本発明の目的に沿って、下記の用語を定義する。 Unless defined otherwise, all technical and scientific terms used herein have the same meaning as commonly understood by one of ordinary skill in the art to which this invention belongs. Hereinafter, the following terms are defined in accordance with the object of the present invention.
本明細書において、不定冠詞「1つの」は、その冠詞の文法的目的語の1つまたは2つ以上(すなわち、少なくとも1つ)を指す。例を挙げると、「1つのエレメント」は1つのエレメントまたは2つ以上のエレメントを指す。 As used herein, the indefinite article “one” refers to one or more (ie, at least one) of the grammatical objects of that article. By way of example, “an element” refers to one element or more than one element.
本明細書において、「約」という用語は、1つ以上の基準量に対して30%、好適には20%、より好適には10%変わる量(例えば、周波数または確率)を指して使用される。 As used herein, the term “about” is used to refer to an amount (eg, frequency or probability) that varies by 30%, preferably 20%, more preferably 10% relative to one or more reference amounts. The
本明細書を通じて、文脈上他の意味に解すべき場合を除き、「備える、含む」という動詞の原形、三人称単数形および現在分詞形は記述された工程もしくはエレメント、または工程もしくはエレメントよりなる群の包含を含意するものとして理解されるが、他の任意の工程もしくはエレメント、または工程もしくはエレメントよりなる群の除外を含意するものではない。 Throughout this specification, unless the context requires otherwise, the verb form “third-person singular” and the present participle form “include, include” are described steps or elements or groups of steps or elements. It is understood as implying inclusion, but does not imply the exclusion of any other step or element or group of steps or elements.
本明細書に記述されたものに類似する、または同等の任意の方法および素材は、本発明の実施または検査において使用されることが可能であるが、記述されている方法および素材は好適なものである。本明細書に記述された方法、装置およびシステムが様々な方法で、様々な目的で実装されてもよいことは認識されるであろう。本明細書における記述は、単に例示的なものである。 Although any methods and materials similar or equivalent to those described herein can be used in the practice or testing of the present invention, the methods and materials described are preferred It is. It will be appreciated that the methods, apparatus, and systems described herein may be implemented in a variety of ways and for a variety of purposes. The descriptions herein are merely exemplary.
図1〜図4を参照すると、現行の視野計設計は、そのサンプリング格子により画定されるScを上回る空間周波数の存在に起因してアンダーサンプリングおよびエイリアシング効果を呈することが分かる。具体的に、多くの異なる対象から取得された511件のHFA10−2視野測定に基づく図1を参照する。10−2パターンは、精細度が標準的な検査格子の3倍である水平および垂直に2度で分離された検査点の正方形格子を有する任意選択の検査パターンである。したがって、このより精細な格子のScは3倍であって、視野感度における周波数が標準的な粗い6度の格子の場合のScより高い周波数で存在するかどうかを確認することを可能にする。図1の右上における挿入図10は、緑内障患者のサンプルからの測定された(合計511件の)視野の平均感度を示す。緑内障は、その初期段階で局所的な視覚障害または失明に繋がる網膜への局所的損傷をもたらす疾患である。視野の局所的な不可視領域は、暗点と称される。図1の3つのトレース12、14および16は各々、測定された511件の視野の511の二次元振幅スペクトルから導出された関数による水平、垂直および対角トランセクトである。導出されたこれらの関数を差スペクトルと称する。
Referring to FIGS. 1-4, the current perimeter design, it can be seen that exhibit under-sampling and aliasing effects due to the presence of spatial frequencies above S c which is defined by the sampling grid. Specifically, reference is made to FIG. 1 based on 511 HFA 10-2 visual field measurements obtained from many different subjects. The 10-2 pattern is an optional inspection pattern having a square grid of inspection points separated at 2 degrees horizontally and vertically with a definition three times that of a standard inspection grid. Therefore, an S c is 3 times the finer grid, possible that the frequency in the visual field sensitivity to confirm whether there at a frequency higher than the S c in the case of the grating of a standard coarse 6 degrees To do.
図1の挿入図10に示すように、全ての視野は、半径10度のほぼ円形の窓によって境界される。この窓処理は、より高い空間周波数を有する幾つかのアーティファクトをスペクトルに生じさせる。この効果を最小限に抑えるために、実際の緑内障視野に各々1つのダミー視野が構築された。ダミー視野は実際の視野の円形窓の正確な形状を有していて、ダミー視野内の各点は所定の実際の視野からの点の平均と入れ替えられた。したがって、実際の視野の各々について、そのダミーはその実際の視野と同じ平均感度値を有していた。次に、511件のダミー視野の各々からの振幅スペクトルが計算された。これらのダミー視野は、視野内の任意の構造を除いて実際の視野の全ての空間特性を有することに留意されたい。次に、ダミースペクトルを対応する実際視野のスペクトルの各々から減算することによって差スペクトルが形成された。したがって、差スペクトルは、平坦な円形視野からは予測されないと思われる任意の余分な周波数を示している。
As shown in
図1は、ゼロ(0)振幅を記す水平の点線15の下に2つの垂直な点線11および13を示している。左側の垂直線は、サンプリング格子6度の対角分離のためのSc、1度当たり1/(12*√2)サイクル(cpd)を示す。右側の垂直線は、水平および垂直方向のSc、1/12cpdを示す。3つのトレース12、14および16は、差スペクトルの平均周波数コンテンツを示す。エラーバーは標準誤差である。特に6度のサンプリング格子のScを上回る周波数における極小のエラーバーは、これらの周波数がほとんど全てゼロ振幅から極度に異なるものであることを示している。挿入図10に存在する平均視野から推察できるように、緑内障対象の視野の多くは、視野の水平経線において緑内障では一般的な感度ステップを示した。このステップは、高い空間周波数コンテンツを垂直方向に増大させる。これは、差スペクトルの平均垂直トランセクト(トレース12)によって実証される。この効果は、差スペクトルの水平経線に対応するトランセクト(トレース16)を考慮することによって最小化され、このような周波数はいずれも視野内の感度ステップに直交する。差スペクトルを介する対角トランセクト(トレース14)も、視野内の水平に方向づけられるステップにさほど影響されない。
FIG. 1 shows two vertical
視野ステップの相対的寄与を観察する別の方法は、確定的ステップを含む、または含まない視野の差スペクトルを比較するものである。図2は、上部視野に1つのステップを生成する感度抑圧を有していた24件の視野の結果を示している。この場合もやはり、右上の挿入図20に実際の平均緑内障視野を表示している。図2のトレース22は、図1の差スペクトル平均の水平、垂直および対角トランセクトの平均を示す。垂直な破線および一点鎖線(各々、21および23)は、6度サンプリング格子のSc値を示す。図3は、挿入図30に見られるように垂直に反転されたステップを示した、測定された210件の緑内障視野の差スペクトル平均による水平、垂直および対角トランセクトの平均を示す。図4は、挿入図31における平均視野から推察できるように確定的ステップが存在しなかった277件の緑内障視野の差スペクトル平均による水平、垂直および対角トランセクトの平均を示す。この場合でも、6度の格子のナイキストレートScを大幅に上回る周波数が存在している。
Another way of observing the relative contribution of the visual field step is to compare the difference spectra of the visual field with or without a deterministic step. FIG. 2 shows the results for 24 views that had sensitivity suppression that produced one step in the upper view. Again, the actual average glaucoma field of view is displayed in the
これらの検査データが、規格24−2検査に使用される方法と同じ方法を使用したHFA検査計器から得られたものである点は重大であり、空間内の視野の変調周波数が、6度サンプリング格子のナイキストレートを大幅に上回って存在することは明らかである。先に言及したように、これらのより高い周波数は、0からScまでの帯域において、より低い、エイリアスのかかった空間周波数として現れる。この折返しは、視野変調がナイキスト周波数の約3倍の周波数にまで拡大することに起因して少なくとも3回発生する点に留意されたい。スーパーナイキスト周波数の振幅は、約1dBである。折返しが複数回発生することから、これにより、生じる歪パターンの振幅は乗算される可能性がある。様々な周波数は、その位相に依存して構築的に加算される可能性がある。よって全体として、視野を歪ませる偽パターンが約6dBの振幅で発生する可能性がある。静的視野計は再現精度が低いことで知られ、これは、視野の損傷が大きくなるほど悪くなる。この損傷は視野の空間周波数変調をより高くし、かつこれらのますます高まる高周波数成分は測定される視野を歪ませる傾向があって、おそらくは再現精度不足に寄与している可能性がある。
低空間周波数コンテンツを有する大きく重なり合う刺激
Significantly, these inspection data are obtained from HFA inspection instruments using the same method used for Standard 24-2 inspection, and the modulation frequency of the visual field in space is 6 degrees sampling. Clearly, it exists well above the lattice Nyquist rate. As noted previously, these higher frequencies, the band from 0 to S c, lower, appear as spatial frequency hazy alias. Note that this folding occurs at least three times due to the field modulation expanding to a frequency about three times the Nyquist frequency. The amplitude of the Super Nyquist frequency is about 1 dB. Since the aliasing occurs a plurality of times, this may multiply the amplitude of the resulting distortion pattern. Various frequencies can be added constructively depending on their phase. Therefore, as a whole, a false pattern that distorts the visual field may occur with an amplitude of about 6 dB. Static perimeters are known for their low reproducibility, which worsens as the visual field damage increases. This damage makes the field of view spatial frequency modulation higher, and these increasingly high frequency components tend to distort the field of view being measured, possibly contributing to poor reproduction accuracy.
Largely overlapping stimuli with low spatial frequency content
図5Aは、視野計のための潜在的刺激を示す。この事例において、刺激は光の二次元ガウス形スポットである。図5Bは等高線図と同じ刺激を示し、等高線の各ステップは刺激の最大明度の10%である。図5Dは、規則的な正方形格子内に配列されたこれらのガウス刺激の集合体を示す。格子点は、1度の視角で分離されている。図5Dは、視野内の視野検査用刺激として可能性のある位置を表している。図5Cは、仰角0度におけるこの集合の水平トランセクトであり、この分離においてガウス刺激が重なり合うことを示す。 FIG. 5A shows a potential stimulus for the perimeter. In this case, the stimulus is a two-dimensional Gaussian spot of light. FIG. 5B shows the same stimulus as the contour plot, where each step in the contour line is 10% of the maximum brightness of the stimulus. FIG. 5D shows a collection of these Gaussian stimuli arranged in a regular square grid. The lattice points are separated at a viewing angle of 1 degree. FIG. 5D shows possible positions in the field of view as stimuli for visual field examination. FIG. 5C is a horizontal transect of this set at an elevation of 0 degrees, showing that Gaussian stimuli overlap in this separation.
図6は、ガウス刺激の変調におけるそれより高い空間周波数を含むランダムな視野のモデルを示す。当業者は、図5Dまたは図6のいずれかの刺激に類似する刺激を有する視野をサンプリングすれば、ナイキストレートの2倍の間隔で、この場合は1cpdの間隔で離隔される低域通過フィルタをかけられた視野のコピースペクトルを含む二次元空間周波数スペクトルが生じる結果となることを理解するであろう。サンプル格子が視野のスペクトルの周波数コンテンツにとって粗すぎるものであれば、視野のスペクトルのコピーにおける高い周波数が主スペクトルにおける低い周波数に追加され、これがエイリアシングの元になる。図7Aはスペクトルの一例を示し、図7Bは0cpdに近いA−Aにおけるスペクトルによる水平トランセクトを示し、スペクトルの重なり合いが非常に大きく、過剰なエイリアスのかかった周波数が生成されることが示されている。先に示唆したように、視野検査用刺激をより大きくかつ側面をより滑らかにすれば、測定される視野を重篤に歪める可能性のあるこの効果は和らぐはずである。明らかに、狭く、よって空間的に比較的はっきりとした刺激および正方形の粗いサンプリング格子は視野のスペクトルのコピーを重複させ、よって、ナイキストレートを超える、この場合は水平および垂直に1度当たり0.5サイクルの高い空間周波数が高位のコピーからの周波数を主スペクトルへとリークさせ、測定される視野を歪める可能性のあるより低い「エイリアスのかかった」空間周波数として出現させることが認められる。 FIG. 6 shows a random field model that includes higher spatial frequencies in the modulation of Gaussian stimuli. Those skilled in the art can sample a field of view having a stimulus similar to that of either FIG. 5D or FIG. 6 with a low-pass filter that is separated by twice the Nyquist rate, in this case by 1 cpd. It will be understood that a two-dimensional spatial frequency spectrum is produced that includes a copy spectrum of the applied field of view. If the sample grating is too coarse for the frequency content of the field spectrum, the high frequency in the field spectrum copy is added to the low frequency in the main spectrum, which is the source of aliasing. FIG. 7A shows an example of a spectrum and FIG. 7B shows a horizontal transect due to the spectrum at A-A close to 0 cpd, showing that the spectrum overlap is very large and that an excessively aliased frequency is generated. Yes. As suggested above, making the perimetry stimulus larger and smoother on the sides should mitigate this effect, which can severely distort the measured visual field. Clearly, the narrow and thus spatially distinct stimulus and the square coarse sampling grid overlap the spectral copy of the field of view, thus exceeding the Nyquist rate, in this case horizontal and vertical by 0.1 ° per degree. It is observed that a high spatial frequency of 5 cycles causes the frequencies from the higher copies to leak into the main spectrum and appear as lower “aliased” spatial frequencies that can distort the field of view being measured.
規則的な格子を用いるサンプリングの効果は、不規則かつランダムな格子を用いるサンプリングについて考えられる利点を際立たせる。主たる利点は、二次元感覚野の場合、エイリアスのかかった周波数は原点から均一に隔たった環スペクトルへと散乱され、このエイリアスのかかった周波数は構築的に加算されそうにないランダム相を有することにある。より高次元の感覚野の場合、この環は多次元球になる。さらに、感覚野の周波数スペクトルの位相ではなく電力のみが必要であるとすれば、これは、サンプリング格子が適切にランダムであることを条件として任意の高さまでの周波数で行うことができる。これは、時間領域におけるサンプリングに基づいて予測されるが、この概念は複数の次元へ容易に拡大できることが妥当である。 The effect of sampling with a regular grid highlights the possible advantages of sampling with an irregular and random grid. The main advantage is that in the case of a two-dimensional sensory area, the aliased frequency is scattered into a ring spectrum that is uniformly spaced from the origin, and this aliased frequency has a random phase that is unlikely to be constructively added. It is in. In the case of higher dimensional sensory areas, this ring becomes a multidimensional sphere. Furthermore, if only power is required rather than the phase of the frequency spectrum of the sensory cortex, this can be done at frequencies up to an arbitrary height, provided that the sampling grid is appropriately random. This is predicted based on sampling in the time domain, but it is reasonable that this concept can be easily extended to multiple dimensions.
これは、サンプリング格子がランダムであって、おそらくは検査セッションの実行中に関心のある感覚野の領域内で変化し、やはりエイリアシングの効果を最小限に抑えかつ潜在的に感覚野において正常なナイキストレートを超えるより高い周波数の電力に関する情報を提供する可能性を開く。この情報は、緑内障等の疾患、または視野限界を決定する異なる頭蓋形状を有する特定の人種または動物種に帰属すること等の正常過程、または様々な形式のストレス検査により課される正常なヒトの感覚野の可逆変化、または小児期の正常な発達によって発生する変化のいずれかに起因して生じる母集団ノルムからの逸脱を特徴づける際に有益である場合がある。 This is because the sampling grid is random and probably varies within the area of the sensory area of interest during the execution of the test session, again minimizing the effects of aliasing and potentially normal Nyquist rate in the sensory area Open up the possibility of providing information about higher frequency power beyond. This information is a normal human being imposed by a normal process, such as glaucoma or other disease or belonging to a specific race or animal species with a different skull shape that determines the visual field limit, or various forms of stress testing May be useful in characterizing deviations from the population norm caused by either reversible changes in the sensory cortex or changes caused by normal childhood development.
図8Aおよび8Bは、大きさが図5の場合の2倍であるガウス刺激を示す。図5の場合と同じ間隔1度で配置されると、図8Cは、同時に提示されるものとすれば刺激の重なり合いがほぼ完全であることを示す。しかしながら、より大きいこれらの刺激のアンチエイリアシングフィルタリング効果は、まだ図9Aの振幅スペクトルにおいて示されるようなスペクトルのコピーを分離するほど十分なものではなく、エイリアシングの効果が依然として発生することが示されている。図8のより大きい刺激はスーパーナイキスト空間周波数の振幅を低減させているが、エイリアシングを防止するほど十分ではない。これは、エイリアシングを減らすためにぼやけた刺激の略重複が必要であることを示し、また、この歪み効果を除去するためにはサンプリング格子のスペーシングより遙かに大きい重なり合いが必要であることが見出されている。正確な重なり合いは、刺激および視野の、すなわちアンチエイリアシングフィルタの空間周波数コンテンツに依存する。空間的に低域通過性の空間周波数スペクトルを有する刺激の場合、重なり合いは最小限、隣接する刺激が高さの半分まで接触し、格子内のサンプリングロケーション間の平均距離の5倍以上は拡大できるようなものであるべきである。当然ながら、前記効果は、視野の変調がここで使用している例(図6)ほど急激でない場合は少なくなる。 8A and 8B show a Gaussian stimulus that is twice as large as in FIG. When placed at the same interval of 1 degree as in FIG. 5, FIG. 8C shows that the stimulus overlap is almost perfect if presented simultaneously. However, the anti-aliasing filtering effect of these larger stimuli is still not sufficient to separate a copy of the spectrum as shown in the amplitude spectrum of FIG. 9A, indicating that the aliasing effect still occurs. Yes. The larger stimulus in FIG. 8 reduces the amplitude of the Super Nyquist spatial frequency, but is not sufficient to prevent aliasing. This indicates that approximately overlapping blurry stimuli are necessary to reduce aliasing, and that much greater overlap than sampling grid spacing is required to remove this distortion effect. Has been found. The exact overlap depends on the spatial frequency content of the stimulus and field of view, ie the anti-aliasing filter. For stimuli with a spatial frequency spectrum that is spatially low-passable, overlap is minimal, adjacent stimuli touch up to half the height, and can expand by more than five times the average distance between sampling locations in the grid Should be like that. Of course, the effect is less when the modulation of the field of view is not as sharp as the example used here (FIG. 6).
したがって広義には、視野内の空間エイリアシングの克服において重大な利点をもたらすことが見出されている方法は、検査刺激を従来の視野計に使用されるものより遙かに大きくし、かつ刺激に滑らかなエッジをもたせるものである。より大きくエッジが滑らかなこれらの刺激は視野を空間的にフィルタリングして視野のより短いレンジの変動を効果的に除去し、よってエイリアシング効果を排除する。HFAレポートに対する閾値のグレースケールプロットの線形補間によって部分的に行われるようなサンプリング後の平滑化は、Scを超える全ての周波数がその時点までに既にScを下回るエイリアスのかかった周波数に移動されていることを理由にエイリアシングの問題を解決しない点に留意されたい。平滑化は、サンプリングプロセスにおいて、またはその前に発生しなければならない。したがって、いかなる形式のアンチエイリアシングフィルタも持たない現行の視野計設計は、暗に、そのサンプリング格子が画定するScを上回る空間周波数は存在しないという概念に基づいて予測されている。 Thus, broadly, methods that have been found to provide significant advantages in overcoming spatial aliasing in the field of view make test stimuli much larger than those used in conventional perimeters and It has a smooth edge. These larger and smoother stimuli spatially filter the field of view to effectively eliminate shorter range variations of the field of view, thus eliminating aliasing effects. Smoothing after sampling, as partially performed by linear interpolation of the gray-scale plot of threshold for HFA report, moves to the frequency hazy alias all frequencies above S c is below the already S c so far Note that this does not solve the aliasing problem. Smoothing must occur in or before the sampling process. Accordingly, the current perimeter design without also anti-aliasing filter of any type, implicitly, is predicted based on the concept that the spatial frequency is no greater than S c in which the sampling grid is defined.
したがって、緑内障視野内における標準的な6度視野計格子のナイキストレートより高い空間周波数の存在に起因して、重なり合う刺激は、エイリアシングの効果を最小限に抑えることにより視野の評価において重大な利点を提供することが見出されている。エイリアシングを減らす有益な効果をも凌いで、視野計のための重なり合う刺激の使用は、1つの刺激による多くの移動により1つの刺激が局所化された損傷領域を識別する最適位置において発生するという見通しが存在するという理由で、動的視野検査の有用性の幾分かの回復を有効化すること等の重大な追加的利点も有する。これは、刺激の最適なサイズまたは形状とは何か?という問題に繋がる。 Thus, due to the presence of higher spatial frequencies in the glaucoma visual field than the standard 6 degree perimeter grid Nyquist rate, overlapping stimuli have significant advantages in visual field assessment by minimizing the effects of aliasing. It has been found to provide. Beyond the beneficial effect of reducing aliasing, the use of overlapping stimuli for perimeters is likely to occur at the optimal location where one stimulus will identify a localized damaged area due to many movements by one stimulus There are also significant additional advantages such as enabling some recovery of the usefulness of dynamic visual field inspection. What is the optimal size or shape of the stimulus? It leads to the problem.
視野の所定の部分にとって最適な刺激形状を決定する際には、目の解剖学的構造自体が使用される。例えば、緑内障疾患の場合、この疾患は、軸索とも呼ばれるその神経線維が視神経をつくる網膜神経節細胞の進行性喪失を引き起こす。これらの細胞は、その最も稠密な部分が網膜の中心窩に位置し、その密度は網膜の中心窩から外側への偏心に伴って減少する。偏心度eccの密度関数D(ecc)は、D(ecc)=a(c+ecc)−zによって密接に近似される。但し、指数zは典型的には約2以下であり、cは中心窩網膜密度および網膜偏心度の増大に伴う密度の外中心窩ロールオフを決定し、aは単に全体的なスケーリング係数である[各偏心度におけるD(ecc)とナイキストレートとの関係は、T.Maddess、外著「Evidence for spatial aliasing effects in the Y-like cells of the magnocellular visual pathway」Vision Research、第38巻、1843-1859ページ、1998年、において論じられている]。網膜神経節細胞の高い中心密度は、緑内障が同サイズの2つの暗点、すなわち網膜の周辺部に1つおよび中心部に1つの暗点を生成していれば、中心部の暗点はさらに多くの網膜神経節細胞の死によって生成されていることを含意する。これを理由に、中心部の暗点は概して、重篤な緑内障をより確実に診断づけるものと見なされる[例えば、E.Hodapp、外著「The asymptomatic patient with the elevated pressure」Clinical decisions in glaucoma、52-61ページ、1993年、を参照されたい]。 In determining the optimal stimulus shape for a given portion of the field of view, the eye anatomy itself is used. For example, in the case of glaucoma disease, the disease causes progressive loss of retinal ganglion cells whose nerve fibers, also called axons, make up the optic nerve. These cells are located at their densest part in the fovea of the retina, and their density decreases with eccentricity outward from the fovea of the retina. The density function D (ecc) of the eccentricity ecc is closely approximated by D (ecc) = a (c + ecc) −z . Where the index z is typically less than about 2, c determines the foveal retinal density and the outer foveal roll-off of the density with increasing retinal eccentricity, and a is simply an overall scaling factor [The relationship between D (ecc) and Nyquist rate at each eccentricity is shown in T. Maddess, et al., “Evidence for spatial aliasing effects in the Y-like cells of the magnocellular visual pathway” Vision Research, 38, 1843- 1859, 1998, discussed]. The high central density of retinal ganglion cells means that if the glaucoma produces two dark spots of the same size, one at the periphery of the retina and one at the center, It implies that it is produced by the death of many retinal ganglion cells. For this reason, the central dark spot is generally regarded as a more reliable diagnosis of severe glaucoma [see, for example, E. Hodapp, “The asymptomatic patient with the elevated pressure” Clinical decisions in glaucoma, See pages 52-61, 1993].
緑内障による視野障害の重篤さを等級づける幾つかの他の方法も中心視野、とりわけハンフリー視野計の緑内障半視野指数、および「構造および機能評価」(SAFE)方法[C.A.Johnson、外著「Structure and function evaluation(SAFE):I.criteria for glaucomatous visual field loss using standard automated perimetry(SAP)Aand short wavelength automated perimetry(SWAP)」American Journal of Ophthalmology、第134巻、177-185ページ、2002年、を参照されたい]等を基礎とする等級付けスキーム、およびAdvanced Glaucoma Intervention Study(AIGS)グループ刊行の幾分類似したスキーム[「The Advanced Glaucoma Intervention Study(AGIS):1.Study design and methods and baseline characteristics of study patients」、Control Clinical Trials、第15巻、299-325ページ、1994年]に特に重きを置いている。 Several other methods of grading the severity of visual field impairment due to glaucoma are also available in the central vision, especially the Humphrey perimetry glaucoma half-field index, and the “Structure and Function Evaluation” (SAFE) method [CAJohnson, et al., “Structure”. and function evaluation (SAFE): I. criteria for glaucomatous visual field loss using standard automated perimetry (SAP) A and short wavelength automated perimetry (SWAP), American Journal of Ophthalmology, Vol. 134, pp. 177-185, 2002. Grading schemes based on, etc., and somewhat similar schemes published by the Advanced Glaucoma Intervention Study (AIGS) group [“The Advanced Glaucoma Intervention Study (AGIS): 1. Study design and methods and baseline characteristics of study patients ”, Control Clinical Trials, Vol. 15, pp. 299-325, 1994].
SAFE方法およびAIGS方法は共に、HFA視野点のクラスタをプールしている。これは、SAFEおよびAIGSのプール領域のサイズおよび形状に一致する全体的により大きい検査領域が視野の分析において追加的な利点を提供する場合があることを示唆する。 Both the SAFE and AIGS methods pool clusters of HFA field points. This suggests that an overall larger examination area that matches the size and shape of the SAFE and AIGS pool areas may provide additional advantages in the field of view analysis.
周波数重複法(FDT)視野計およびより新しいマトリックス視野計は共に、これらのプール領域とほぼ同じサイズ、約10平方度の検査刺激を使用するが、FDT検査領域は空間的に重なり合わず、刺激ははっきりとしたエッジを有する[例えば、各々Maddessに付与された米国特許第5,065,767号および米国特許第5,912,723号を参照されたい]。 Both the Frequency Overlap (FDT) perimeter and the newer matrix perimeter use test stimuli that are approximately the same size as these pooled areas, approximately 10 square degrees, but the FDT test areas do not overlap spatially and stimulate Have sharp edges [see, eg, US Pat. No. 5,065,767 and US Pat. No. 5,912,723, each assigned to Maddess].
より多数の個々の刺激を使用しかつこれらを視野内にこれらが空間的に重なり合うように位置合わせすれば(しかしながらこれは実際には、偶発的な重なり合いが可能であり得る多焦点的な刺激提示方法を除いて、刺激が同時に提示されれば発生しない)エイリアシング効果を最小限に抑えることができるだけでなく、重なり合いのプロセスが、最適サイズである可能性のある大きい刺激の1つは大抵が視野内の障害のある領域に中心を置いて提示されることを意味する点については、本発明者らによって認識されている。米国特許第5,065,767号および米国特許第5,912,723号は共に大きい刺激を用いる検査の利点を示しているが、これらは刺激が空間周波数重複錯覚現象を呈することを要求していて、重なり合う刺激を用いて視覚不感受性パッチのロケーションをより正しく識別すること、およびエイリアシングに対する防護を開示または示唆していない。 If you use a larger number of individual stimuli and align them in the field of view so that they overlap spatially (however, this is actually a multifocal stimulus presentation where accidental overlap may be possible Except for the method, it does not occur if the stimuli are presented at the same time (not only can the aliasing effect be minimized), but one of the large stimuli for which the overlapping process may be the optimal size is mostly visual field It has been recognized by the present inventors that it is meant to be centered on the faulty area within. US Pat. No. 5,065,767 and US Pat. No. 5,912,723 both show the advantages of testing with large stimuli, but these require that the stimuli exhibit a spatial frequency overlap illusion, and can be visualized using overlapping stimuli. It does not disclose or suggest better identification of the location of insensitive patches and protection against aliasing.
広域通過解像視野検査(HPR)として知られる視野検査の一形式は空間的に重なり合う刺激を含み、異なるサイズのリング形刺激がHPRサンプル格子の各視野ロケーションに中心を置いて提示される。この方法におけるタスクは、原則的にはより大きいリング刺激が重なり合う可能性のある各ロケーションで見える最小の刺激サイズを見出すことにある。しかしながら、この重なり合いは、HPRのリング標的の各々が高い空間周波数のみを含み、よって測定される視野へはその視野に含まれる高い空間周波数を伝達してエイリアシングを発生させることからエイリアシングの効果を低減しない。 One type of visual field exam known as wide-pass resolution field of view (HPR) involves spatially overlapping stimuli, with different sizes of ring stimuli being presented centered at each visual field location of the HPR sample grid. The task in this method is to find the smallest stimulus size visible at each location where in principle larger ring stimuli may overlap. However, this overlap reduces aliasing effects because each HPR ring target contains only a high spatial frequency, thus transmitting the high spatial frequency contained in the field of view to generate aliasing. do not do.
これに対して、本明細書に記述している刺激は、サンプリング格子が復元できるものより低い空間周波数のみを含む。 In contrast, the stimuli described herein include only lower spatial frequencies than those that the sampling grid can recover.
図10A〜10Cは、HFA30−2検査パターンにおけるものに類似する視野ロケーションの6度格子上へ提示されてもよい、本明細書に記述している方法による重なり合う空間刺激の一例を示す。図11Aは、この30−2検査ロケーションの中心による格子を示し、小さい円は標準HFA刺激のサイズを近似している。先に述べた24−2パターンは、同じ格子上のこれらの検査点の部分集合を表している。 FIGS. 10A-10C illustrate an example of overlapping spatial stimuli according to the method described herein that may be presented on a 6 degree grid of field locations similar to those in the HFA 30-2 test pattern. FIG. 11A shows a grid with the center of this 30-2 test location, with a small circle approximating the size of a standard HFA stimulus. The 24-2 pattern described above represents a subset of these inspection points on the same grid.
図10A〜10Cの刺激例は、重なり合う刺激の一例を示している。具体的には、図10Aは、刺激パッチ70の相対振幅を刺激パッチ70の中心に対する視野位置の関数として示すグレースケールプロットであり、図10Bは、等振幅の等高線を20%間隔で有する図10Aの刺激の等高線図であり、図10Cは、振幅をコントラストとして記述した、刺激パッチ70を介する多くのトランセクト74を示す。トランセクト74は、刺激70のプロファイルを示すものである。この例では、刺激70は、6度格子上の隣接する刺激領域間に略重複を生じさせるに足る大きさであり、すなわち6度の半値全幅(FWHM)71より大きいことに留意されたい。また、刺激70のプロファイルのエッジ73および/または角75は滑らかに変化している(すなわち、十分に平滑またはぼかされている)。個々の刺激70が滑らかに変化する度合いは、そうでなければ測定される視野の形状を歪ませる可能性もあるエイリアシング効果を形成しかねないより高い空間周波数を視野内に伝えないように選ばれる。十分に平滑またはぼやけた個々の刺激の使用には、対象が検査される際にその目の屈折率を十分に測定される必要(すなわち、検査中の対象が屈折率を矯正される必要)はないという重大な利点があることが見出されている。すなわち、誤った、不十分な屈折矯正でも、または屈折矯正なしであっても、対象の視野の評価結果にさほど影響はない。
The stimulus examples in FIGS. 10A to 10C show an example of overlapping stimuli. Specifically, FIG. 10A is a grayscale plot showing the relative amplitude of
刺激の滑らかさは、刺激のフーリエ変換がそれ自体ではサンプリング格子により規定されるナイキストレートより高い周波数を含まなければ十分である。図10Aにおける刺激例のエッジ73は、高い空間周波数コンテンツを含まないことからぼかされて見える。したがって、この特定タイプの刺激をぼやけた刺激と称することができる。当業者は、刺激パッチ70が所望される具体的な格子サイズまたは検査パターンに依存して代替サイズおよび形状である可能性もあること、ならびに刺激パッチ70のエッジ73のロールオフは、エッジが高周波数の空間的フーリエ成分を導入しなければ、エイリアシング効果の所望される低減およびこれまでに述べたようなタイプの刺激の他の利点を達成する代替形状である可能性があることも認識するであろう。
Stimulus smoothness is sufficient if the Fourier transform of the stimulus does not itself contain higher frequencies than the Nyquist rate defined by the sampling grid. The
これらの重なり合う低空間周波数刺激の有利な追加的特徴は、個々の刺激パッチが高空間周波数成分を含まず、よってその画像コントラストは球面または円柱矯正のいずれかの数ジオプタの屈折異常によって減退されないことにある。すなわち、本明細書に記述しているぼやけた重なり合う刺激を用いた視覚評価を受けている対象/患者で、誤った眼鏡(または、例えばコンタクトレンズである他の難治性視力補助装置)の矯正を有する者には、刺激70が完全に矯正された視力を有する対象と何ら変わらずに見える。これには、所定のいかなる対象にとっても、その感覚神経系が正常であれば、その対象の視覚評価検査の結果はその視力矯正の正誤に関わらず変わらない、という重大な利点がある。したがって、対象をこれらの大きい、エッジがぼやけた刺激を用いて検査する際には、十分な屈折矯正を達成するためにさほど配慮をしなくてもよい。
An advantageous additional feature of these overlapping low spatial frequency stimuli is that the individual stimulus patches do not contain high spatial frequency components, so that their image contrast is not diminished by refractive errors of either a spherical or cylindrical correction few diopters. It is in. That is, correction of erroneous eyeglasses (or other refractory vision aids such as contact lenses) in subjects / patients undergoing visual assessment using the blurry overlapping stimuli described herein. To those who have it, the
図11Aは、格子ロケーション35を有する視野検査フィールドの一例を示す。適切な刺激は、これらのロケーションにおいて対象の視野へ提示することができる。図11B〜Dまでは、上述の方法にしたがって対象視野を評価するための重なり合った刺激パッチの一例(図10Aのパッチ70の通り)を示す。等高線36は、刺激70の50%振幅(半値全幅)を表す。図11Bは全ての50%等高線36を示しているが、隣接する刺激間の重なり合いをより明らかに見せるために半量は点線で描かれている。図11Cおよび11Dもやはり、各々重なり合う等高線をより明らかに見せるために図11Bのパッチの半量を示している。実際の視野検査での使用に際しては、刺激70は、ある特定の格子ロケーション35において一度に1つずつ提示されるか、もしくは2つ以上の刺激70が同時に提示されるべきものであれば、同時的刺激の格子ロケーション35は、好適には、どの検査提示においても2つの刺激が空間的に同時に重ならないように、隣接しない格子ロケーションになる(しかしながら、多焦点方法を用いる編成の中には、刺激が刺激系列内の幾つかの点で重なり合っていてもよいものもある)。視野計では典型的であるように、刺激は一度に1つずつ提示され、連続して提示される刺激の位置は、提示される可能性のあるロケーション(すなわち、図11Aの格子ロケーション35)から成る格子全体にランダム化される。あるいは、刺激は多焦点編成で提示される可能性もあり、この場合、多焦点方法は幾つかの刺激が任意の提示系列上で同時に示されることを可能にするが、任意の1つの格子ロケーションにおける刺激の発現を制御する時間系列は、各領域に対する応答の推定を可能にするほど十分統計学的に、刺激の集合に対する神経系の応答記録から独立している。
FIG. 11A shows an example of a visual field inspection field having a
図12A〜12Dは、網膜神経節細胞の解剖学的構造における重要な特徴を示している。これらの4つのパネル、図12A〜12Dは、各々、目の内部を検査するための顕微鏡の一形式である眼底カメラにより瞳孔を介して見える網膜後部の線図表示である。視神経乳頭40は、各パネルの左側に、垂直に細長い小さな楕円として描かれている。視神経乳頭40を網膜の各部分へ繋ぐ多くの細い弧状の線41は、網膜神経節細胞の軸索(縫線として知られる場合もある)の可能な経路を表す。中心窩42は、各パネルの中心のすぐ左の弧、具体的には網膜神経節細胞の軸索が視神経乳頭40(視神経円板としても知られる)へと辿る経路41の焦点に位置づけられる。大きく黒い斑43〜49は、視覚的刺激に対して低減した感度を示す網膜の斑を表す。特に興味深い点は、網膜上部からの網膜神経節細胞はその軸索を視神経円板上部へと送り、網膜内部についてはこの逆であることにある。その結果として、緑内障で発生する可能性があるように、視神経円板40において、または視神経円板40の近くで障害を発生させるプロセスはどれも、視覚的感度が変化した弧状の障害セクタ(例えば、図12A、C、Dの斑43または49)または三角形のセクタ(例えば、図12Cの斑48)へと移向する可能性がある。別の共通の特徴として、感度が変化したこれらの斑は、結果的に各々図2および図3の挿入図20および30が示すような所謂感度のステップとなるかなりはっきりとした水平の境界を生み出す水平経線(例えば、各々図12BおよびDの障害のある斑46または49を参照されたい)に関係している可能性がある。後頭視覚野における卒中等の神経学的問題は、しばしば垂直経線に関連する視覚的感度の変化に繋がる。これを理由に、水平および垂直経線に渡って重なり合う刺激にはしないことに意味がある場合がある。これは視野計の一般的特徴であり、例えば30−2検査格子において見受けられる(図10A)。これを、より大きい重なり合う刺激を使用する刺激によって達成するためには、刺激70を、図13に示すようにこれらの境界51および52から僅かに離して移動させることが理に叶っていると思われる。
Figures 12A-12D illustrate important features in the anatomy of retinal ganglion cells. These four panels, FIGS. 12A-12D, are each a diagrammatic representation of the posterior retina visible through the pupil with a fundus camera, which is a form of microscope for examining the interior of the eye. The
図11A〜11Dに示されたものに類似する編成は、FDT視野計の一般的なN−30検査パターンの重なり合う刺激バージョンに関して考えられてもよい。例えば、図14Aは、図示された縞模様62が空間周波数重複パターンを表す編成としての1つの可能性を示している。空間周波数の倍化は、刺激が高い時間周波数と低い空間周波数との論理積を含む場合に発生する。これは、約200ms未満で急激に出現して消滅する、または視野内を高速で浮動する刺激、ならびにFDTに使用されるコントラスト反転方法を包含する。代替方法として、空間−時間的条件の所定の組合せで発生し得る倍化以上の高い空間周波数の視感を生み出す刺激を使用するものがある。
An organization similar to that shown in FIGS. 11A-11D may be considered for overlapping stimulus versions of a typical N-30 test pattern of an FDT perimeter. For example, FIG. 14A illustrates one possibility as an organization in which the illustrated
図10Aに示された刺激は、FDT刺激とほぼ同じサイズであるが、滑らかなエッジを有する点がこれらの刺激とは異なる。今回の例では、平滑化は、周波数重複パターンを図10Aのそれに類似する包絡線で乗算することによって達成されている。この場合もやはり、これは、屈折矯正の誤り(すなわち、特定の対象における間違った、または不十分な視覚屈折矯正)および標準的なFDT刺激のはっきりとしたエッジに見受けられる高い空間周波数によるエイリアシング効果に対する刺激方法の耐性をさらに向上させる。例えば、マトリックス視野計24−2検査パターンにおいて使用されるようなより小さい刺激、但し図14Aに示す縞模様62と同じ、または類似する空間周波数を有する刺激に関しては、より小さい刺激ではエッジが比例的に大きい刺激部分を形成することに起因して、滑らかなエッジの刺激がさらなる有益な効果を有する。また、対象が、それ自体は低い空間周波数しか含まない空間周波数重複性の刺激よりもはっきりとしたエッジの方へより多くの注意を向ければ、これは達成される感度測定にも影響する。対象がエッジの高い空間周波数コンテンツに注意を向ければ、これにより、達成される応答は周波数倍化をもたらす低い空間周波数ではなくこれらの高い空間周波数へと偏り、よって周波数倍化刺激の利点[各々Maddessに付与された米国特許第5,065,767号および米国特許第5,912,723号を参照されたい]は低減される。
The stimuli shown in FIG. 10A are approximately the same size as the FDT stimuli, but differ from these stimuli in having smooth edges. In this example, smoothing is achieved by multiplying the frequency overlap pattern by an envelope similar to that of FIG. 10A. Again, this is an aliasing effect due to refractive errors (ie, incorrect or insufficient visual refraction correction in certain subjects) and high spatial frequencies found at the sharp edges of standard FDT stimuli. Further improve resistance to stimulation methods. For example, for smaller stimuli as used in the matrix perimeter 24-2 test pattern, but for stimuli having the same or similar spatial frequency as the
視野の一領域内での視野における、その時間変調が10Hzから30Hzまでの範囲内の電力バルクを有することに対応する高速コントラスト反転、高速オンセットおよびオフセットまたは高速移動と結合された、4cpdという高い空間周波数が使用されてもよい中心窩およびその近くを除いて概して1度当たり1サイクル(cpd)より下の低い空間周波数コンテンツの優位性に起因して、刺激は、実際の空間周波数コンテンツより高い、実際の刺激空間周波数の1倍から数倍の空間周波数を有するように見えることが可能である。 As high as 4 cpd combined with fast contrast inversion, fast onset and offset or fast movement in the field of view within a field of view, corresponding to its time modulation having a power bulk in the range from 10 Hz to 30 Hz Stimulation is higher than actual spatial frequency content due to the superiority of low spatial frequency content, typically below 1 cycle per degree (cpd) except at and near the fovea where spatial frequency may be used It can appear to have a spatial frequency that is one to several times the actual stimulation spatial frequency.
図14Bは、(図14Aが示すような)周波数重複型62である可能性もある刺激60による右目用の標準FDT N−30格子を示す。図11および13とは異なり、この場合の刺激等高線61は、先行諸図の場合の50%刺激レベルではなく、刺激の絶対境界を表している。図14Cおよび14Dは、重なり合う刺激60の相次ぐ追加を示す(但し、刺激60のうちの幾つかは明確を期して外形を点線で描いている)。重なり合う刺激の正確な数、そのサイズおよび領域ならびにサンプリングされる視野領域の全体的範囲が、本明細書に記述しているぼやけた刺激を重ね合わせる方法を損なうことなく変更されてもよいことは認識されるであろう。このような検査の実際の実装は、行動式または多焦点式の何れでも可能である。
極座標表現
FIG. 14B shows a standard FDT N-30 grid for the right eye with a stimulus 60 that may be frequency overlapped 62 (as shown in FIG. 14A). Unlike FIGS. 11 and 13, the stimulus contour 61 in this case represents the absolute boundary of the stimulus, not the 50% stimulus level in the preceding figures. FIGS. 14C and 14D show the sequential addition of overlapping stimuli 60 (although some of the stimuli 60 are outlined in dotted lines for clarity). It is recognized that the exact number of overlapping stimuli, their size and area, and the overall range of the field of view to be sampled may be altered without compromising the method of overlaying the blurry stimuli described herein. Will be done. The actual implementation of such an inspection can be either behavioral or multifocal.
Polar coordinate representation
図12Cは、中心窩へ向かって突き出す、感度が変化した小さい弧状の斑47を示す。中心窩領域における網膜神経節細胞の比較的高い密度に関する先の論議を考えれば、この物理的に小さい斑は、網膜の周辺領域におけるより大きい斑よりも多数の障害のある細胞に対応する場合がある。したがって、正しい刺激サイズを決定する方法は、網膜の様々な部分における神経節細胞の密度に関連して慎重に設計される必要がある。先に指摘したように、網膜神経節細胞の数はヒトの中心窩では著しく増大される。この増幅は、視覚野において略反映され、よって、所定の網膜偏心度に関して斑状網膜の感度変化を検出するために最適なサイズを有する刺激は、皮質の感度変化の検出にとっても最適になる。かなりのところまで、偏心によって生じる網膜細胞の密度変化は中心窩を中心にして半径方向にほとんど対称性である。半径方向の対称性からの最適化され得る小さい逸脱は幾つか存在するが、説明上の便宜から本論考では考慮されていない[さらなる情報は、C. Curcio、Allen KA共著「Topography of ganglion cells in human retina」Journal of Comparative Neurology、第300巻、5-25ページ、1990年、を参照されたい]。 FIG. 12C shows a small arcuate plaque 47 of varying sensitivity protruding towards the fovea. Given the previous discussion on the relatively high density of retinal ganglion cells in the foveal region, this physically small plaque may correspond to more impaired cells than the larger plaque in the peripheral region of the retina. is there. Therefore, the method for determining the correct stimulus size needs to be carefully designed in relation to the ganglion cell density in various parts of the retina. As pointed out above, the number of retinal ganglion cells is markedly increased in the human fovea. This amplification is largely reflected in the visual cortex, so that a stimulus having the optimal size to detect a change in sensitivity of the retinal retina for a given degree of retinal eccentricity is also optimal for detection of a change in sensitivity of the cortex. To a great extent, the change in density of retinal cells caused by eccentricity is almost symmetrical radially about the fovea. There are some minor deviations that can be optimized from radial symmetry, but they are not considered in this discussion for explanatory purposes. [For more information, see Topography of ganglion cells in C. Curcio and Allen KA. Human retina "Journal of Comparative Neurology, Vol. 300, pages 5-25, 1990].
まず、直線系について考察すると、斑の平均的なシフト不変のサイズを求めるために、斑状変化を示す視野の空間的自己相関関数が計算されてもよい。しかしながら、このアプローチには、網膜または網膜視覚脳部位等の略極座標系における有用性に限界がある。したがって、水平(h)空間および垂直(v)空間上に画定される何らかのサンプリング格子において取得される視野データV(h,v)が中心窩からの半径(r)および中心窩を中心とする極角度(θ)に関連して画定される極座標表現V(r,θ)に変換されれば、感度が変化した領域を明白に識別するために、新しい極座標表現において自己相関測度または何らかの類似測度が計算されてもよい。このような極変換を使用すれば、得られる関数は、変換された空間において単位面積が各単位面積当たり一定数の網膜細胞に関連づけられる座標を有することが見出されている。したがってすなわち、当該空間におけるある特定の斑は、何らかの単位細胞数に対応する可能性がある。視野特性をこのような方法で定量化するための極座標表現、および後に論じるように、この表現から取得され得る対応する利点の使用が、視野評価のためにいまだ当業者によって実現されていないことは確信される。さらに、最初の極座標表現の最適化が利用可能であって、この場合、変換される視野の大きさは真の視野半径および極角度の幾つかの非線形関数f(x)またはg(x)である場合もあって、例えばV(ρ,Ψ)であり、ここで、ρ=f(r)およびΨ=g(θ)もまた可能である。例えば、非線形変換の方が、網膜の何らかの1または複数部分における網膜神経節細胞密度によく合致する場合もある。説明の便宜上、以下の論考は線形事例に限定されているが、非線形極座標表現が本明細書に記述される方法に包含されることは認識されるであろう。 First, considering the linear system, a spatial autocorrelation function of the visual field showing the patchy change may be calculated to determine the average shift-invariant size of the patch. However, this approach has limited utility in a substantially polar coordinate system such as the retina or retinal visual brain region. Accordingly, the field-of-view data V (h, v) acquired in any sampling grid defined on the horizontal (h) space and the vertical (v) space is the radius (r) from the fovea and the pole centered on the fovea. Once converted to the polar coordinate representation V (r, θ) defined in relation to the angle (θ), an autocorrelation measure or some similar measure is used in the new polar coordinate representation in order to unambiguously identify regions with changed sensitivity. It may be calculated. Using such a polar transformation, it has been found that the resulting function has coordinates in which the unit area is associated with a fixed number of retinal cells per unit area in the transformed space. Therefore, a specific plaque in the space may correspond to some unit cell number. The polar coordinate representation for quantifying visual field characteristics in this way, and the use of corresponding advantages that can be obtained from this representation, as discussed later, has not yet been realized by those skilled in the art for visual field assessment. Be convinced. In addition, optimization of the first polar coordinate representation is available, in which case the field size to be transformed is a number of nonlinear functions f (x) or g (x) of the true field radius and polar angle. In some cases, for example, V (ρ, ψ), where ρ = f (r) and ψ = g (θ) are also possible. For example, the non-linear transformation may better match the retinal ganglion cell density in any one or more parts of the retina. For convenience of explanation, the following discussion is limited to linear cases, but it will be appreciated that non-linear polar representations are encompassed by the methods described herein.
図15Aは、HFA24−2検査パターンを用いて取得された視野90内の点の感度に関するデータを示す。本図においては、視野90の各領域91における相対感度がグレーレベルで示され、暗部は低感度(すなわち、障害のある感度)に相当し、明部は高感度に相当する。視野90内の各点の感度データは、黒色を背景にして提示されるチェック模様91として表現される。チェック模様91のサイズは、そのデータを取得するために使用された刺激のサイズを指すものではない。この事例において、刺激は、示されているチェック模様の各々の中心に空間的に提示された極小のゴールドマンサイズIII刺激であった。直線空間の標準的な象限1〜4は、プロットを囲む表記法Q1〜Q4によって示されている。仰角0度の直上で方位角−15度における黒色のチェック模様80は、視覚的に非感受性である視神経円板40により生成される正常な盲点である。この視野プロットは、先に述べたV(h,v)関数の一例を表現している。図15Aからは、この視野が、凝視から半径方向へ低下する全体的な感度喪失を示していることが分かる。このタイプの喪失は緑内障に共通するものであり、大きい刺激によって十分に検出される。図15Bは図15Aにおけるものと同じデータを示しているが、これは、中心窩からの半径(r)および中心窩を中心とする極角度(θ)に関連して画定される極座標に変換され、よって先に述べたように、半径の関数としての視野の感度減少(図15A)が極座標表現における減少した感度の線形勾配として出現する(図15B)ようなV(r,θ)関数の一例を表す。三重の列(82、84、86および88)はQ1〜Q4で記され、図15Aの各象限に対応する。第1象限82は、図15Bの底部に再現されて、(例えば、図12の損傷された機能46または49において見出されるように)第1象限と第4象限と(Q1およびQ4)の境界に存在する感度のステップが容易に観察されることを可能にしている。この極座標表現では、3度の方位角/仰角半径内部の視野の中心窩部分(すなわち、図15Bのカラム81)が大幅に拡大されているが、これはそこに存在するより多数の網膜感覚細胞に合致するものであって、結果として視野分類における中心暗点を強調していることに留意されたい。正常な盲点は、中央Q2ローの真下の黒色チェック模様80に対応する。
FIG. 15A shows data relating to the sensitivity of points within the field of
図15Bにおける左から右、カラム81、83、85および87を介した半径偏心の増大に伴う感度の全体的な低下は明らかである。この視野表現の自己相関関数を計算することは、先に述べたようにこの場合のこの極座標表現における中心窩からの距離の方が網膜細胞の数に等しいことに起因して意味があると思われる。 The overall decrease in sensitivity with increasing radial eccentricity from left to right, columns 81, 83, 85 and 87 in FIG. 15B is apparent. The calculation of the autocorrelation function of this visual field representation seems to be meaningful because the distance from the fovea in this polar coordinate representation in this case is equal to the number of retinal cells as described above. It is.
図16Aは、緑内障によって極めて重篤に損傷されている視野100の例を示す。第2象限における残余周辺部の感度を示す弧101は、図16Bの21度のカラム87上部において感度を示す垂直の延長部となって見えている。水平経線に渡る感度のステップは、第1象限から第4象限への境界に渡るステップ103としてはっきりと見られる。第2象限における感度喪失の弧105は、第2象限における暗い垂直の矩形106に位置する。(領域107における)第1象限のほとんど全てである喪失は、図15Bの上部2ローから成る大きな水平の矩形108へと移動する。
FIG. 16A shows an example of a
図17Aは、緑内障患者からの視野のさらなる例110を示し、中心窩より下の小さい弧状または弓形の暗点111を表示している。図15Bの極座標表現において、この弧111は、極角度240度を中心としてカラム3度の下側にある、図16Bにおける喪失を有するカラム112へと移動する。図17は、同じく緑内障患者からの視野のさらなる例115を示し、さらにもう少し偏心的な弓形の暗点116を表示している。この暗点116は、極角度約210度を中心としてカラム9度内にある垂直な矩形117へと移動する。
FIG. 17A shows a further example 110 of a field of view from a glaucoma patient, displaying a small arcuate or arcuate dark spot 111 below the fovea. In the polar coordinate representation of FIG. 15B, this arc 111 moves to the
全体として、視野の極変換は幾つかの利点を有することが分かる。具体的に言えば、
・中心窩付近の細胞数の相対倍率が考慮される。よってこれは、暗点の平均自己相関長さ等の測度の細胞数中心様式による計算を可能にする。
・弧、セクタおよび半径方向に表現される喪失などの網膜障害の一般的特徴が、極座標表現において容易に識別される隆起方向に平行な矩形または線形勾配に移動する。
・水平および垂直経線に渡るステップ等の特徴が保存される。
Overall, it can be seen that the polar conversion of the field of view has several advantages. Specifically,
• Consider the relative magnification of the number of cells near the fovea. This therefore allows for calculations such as the average autocorrelation length of the dark spots in a cell number centric manner.
General features of retinal disorders such as arcs, sectors and loss expressed in the radial direction move to a rectangular or linear gradient parallel to the ridge direction that is easily identified in the polar coordinate representation.
Features such as steps across the horizontal and vertical meridians are preserved.
総合すれば、この情報は、これらの極座標表現が最適な刺激サイズを極座標で選ぶために使用され得るだけでなく、さらに、一般的な特徴が直線表現へ表示されることに起因して極座標領域は、このような障害を認識するように設計されるアルゴリズムのアプリケーションへ容易に適合化もされることを示唆している。実際にこれは、幾つかのサンプル格子上で取得される様々な視野計からのデータのためのより一般的な方法が、量的比較の前に標準的な極座標表現へ変換されることを示唆している。 Taken together, this information can be used not only for these polar representations to select the optimal stimulus size in polar coordinates, but also because the general features are displayed in a linear representation. Suggests that it can also be easily adapted to application of algorithms designed to recognize such obstacles. In practice this suggests that the more general method for data from various perimeters acquired on several sample grids is converted to a standard polar representation before quantitative comparison. doing.
典型的な行動から障害または他の偏りを認識するように設計される、これまでに述べたもの等の実装され得るアルゴリズムの中でも、自己相関または類似の測度は、感度が変化した領域を明らかに識別するために新しい極座標表現において計算されてもよく、様々な形式の空間フィルタリングになると思われる。これらには、1つ以上の演算子を用いる畳み込み等の線形方法、または他の類似する「エッジ保存」フィルタのメジアンフィルタ等の非線形方法が含まれる場合もある。これらの方法およびその潜在的利点の例については、後に図23〜図25および関連する表において示す。 Among algorithms that can be implemented, such as those described so far, designed to recognize obstacles or other biases from typical behavior, autocorrelation or similar measures reveal areas of altered sensitivity It may be computed in a new polar coordinate representation to identify, which would result in various forms of spatial filtering. These may include linear methods such as convolution using one or more operators, or non-linear methods such as median filters of other similar “edge-preserving” filters. Examples of these methods and their potential benefits are shown later in FIGS. 23-25 and related tables.
図19A〜図19Dは、これまでに概説した全ての特徴を組み込んだ視野検査用刺激の集合を示す。個々の刺激130は大きく、エイリアシング効果を除去するために滑らかに減退するぼやけたエッジ131を有する。刺激130は、極座標領域では面積がほぼ等しい領域サイズの放射状配置を有し、よって個々の刺激130の各々は視床または皮質視覚部位におけるほぼ同数の網膜細胞を刺激する。刺激の集合は、刺激が境界を渡って重なり合い、視覚的感度の経線ステップを曖昧にする可能性がないように、視野の水平および垂直経線132および133を顧慮する(すなわち、交差または横断しない)。より具体的には、図19Aは24個の刺激130の等高線134をその50%レベルで示している。図19Bは、同じ等高線を残りの20個の刺激130について示している。図19Cは、全44個の個々の刺激130の等高線を示し(明確を期して、刺激の半分の外形は点線で示されている)、本明細書に記述している方法に従った視野評価において使用される(同時に出現すべきものである場合の)刺激の本来の空間的重なり合いの状態を示している。図19Dは、後述する視野評価装置のディスプレイモニタに現れる刺激130のぼやけた外観を示す(明確を期して、垂直経線の両側に刺激の半分だけが提示されている)。
19A-19D show a set of visual field examination stimuli that incorporates all the features outlined so far.
空間的相関性が著しく類似する領域が自己相関関数および信号対雑音比の双方によって決定される場合、最適サイズが、部分的には信号対雑音比によって決定されてもよい点に留意することには価値がある。簡単に言えば、測定されている空間信号の真の自己相関関数は既知であるが、その特定のサンプルに雑音が多ければ、僅かに大きいエリアに及ぶ平均をとることにより、特定のサンプル内の相関される特徴を決定することができる。視野検査の場合、特に網膜の障害が進んでいておそらくはさらに雑音の多い信号を供給している事例では、これは、いっそう大きい刺激が必要とされる場合があることを含意する。最適な刺激サイズをこのようにして決定する能力には、特に例えば検査反復性の向上において重大な利点がある。 Note that if regions with very similar spatial correlation are determined by both the autocorrelation function and the signal to noise ratio, the optimal size may be determined in part by the signal to noise ratio. Is worth it. Simply put, the true autocorrelation function of the spatial signal being measured is known, but if that particular sample is noisy, it can be averaged over a slightly larger area by taking an average over a particular area. Correlated features can be determined. In the case of visual field examinations, especially in cases where the retinal disorder is advanced and possibly providing a noisy signal, this implies that even greater stimulation may be required. The ability to determine the optimal stimulus size in this way has significant advantages, particularly in improving test repeatability, for example.
これまでの論考は、対象の視野の刺激および評価に関連づけられているが、上述の方法は、任意の感覚野の評価に等しく適用可能である。これまでに概説した大きく重なり合う刺激を用いる処置に適用可能な他の感覚野の例には、皮膚上の触覚野、または音の到達時間の両耳差と音源が位置づけられる視野の水平軸上の対応する方位角とによって記述される視聴覚野が含まれる。このような多感覚野の幾つかの例は、Maddess & Jamesに付与された国際公開第WO 2005/051193号に記載されている。感覚野は、例えば観察者がその皮膚上の触覚のある刺激を見るときに生じる触覚野と視覚野とのコンビネーションを含む、2つより多い次元へ一般化されることも可能である。この場合は、重なり合う刺激の利点がこれらの他の感覚領域において有益であることが含意される。
装置
Although the previous discussion has been associated with stimulation and evaluation of the subject's visual field, the method described above is equally applicable to the evaluation of any sensory area. Examples of other sensory areas that can be applied to treatments with highly overlapping stimuli outlined so far include the tactile area on the skin or the horizontal axis of the visual field where the sound source is located and the binaural difference of sound arrival time. The audiovisual area described by the corresponding azimuth is included. Some examples of such multisensory areas are described in International Publication No. WO 2005/051193 to Maddess & James. The sensory cortex can be generalized to more than two dimensions, including a combination of the tactile and visual cortex that occurs, for example, when an observer sees a tactile stimulus on the skin. In this case, it is implied that the advantage of overlapping stimuli is beneficial in these other sensory areas.
apparatus
本発明の装置の一実施形態を形成する基本的なシステムコンポーネントを図20Aに略示している。主要コンポーネントは、対象146の一方の目または両目144へ視覚的刺激142を提示するディスプレイデバイス140(例えば、CRT、LCD、プラズマ、LED、有機LED(OLED)またはこれらに類似するディスプレイ画面)である。刺激は、任意選択として、例えば遠くのオブジェクトをシミュレートすべく画像の拡大制御を有効化するための適切な光学システム145を介して対象へ提示される。対象の頭部へは、刺激142に反応する対象からの皮質神経応答を検出するための、例えば電極149(例えば、頭皮上に置かれて喚起される電位を記録する標準的なゴールドカップ型電極)等のセンサ148が取り付けられて装備される。センサ148からの応答147は増幅器150内で増幅され、応答に対応する視覚により喚起された電気的ポテンシャルがレコーダ152に記録される。また、刺激142に対する応答147を特徴づける線形および非線形重み関数の推測される係数を計算するため、ならびに可視ディスプレイ140上への刺激142の提示を制御するためのプロセッサユニット154等の計算および制御デバイスも準備される。また任意選択として、必要であれば、例えば対象の瞳孔の広がりを監視するための1つ以上のカメラ156等の追加的なモニタおよび/または検出/記録デバイスが使用されてもよく、例えば対象の目の位置、凝視方向または瞳孔の広がりの監視をアシストするために対象の目を照らす赤外線ソース等の1つ以上の追加的な照明ソース158が準備されてもよい(例えば、後述の図20Bの装置を参照されたい)。
The basic system components that form one embodiment of the apparatus of the present invention are shown schematically in FIG. 20A. The main component is a display device 140 (eg, a CRT, LCD, plasma, LED, organic LED (OLED) or similar display screen) that presents a
対象146の視野評価への使用に際して、各対象用の検査刺激画像142を可視ディスプレイ上へ所望される平均提示速度で提示した。刺激142は可視ディスプレイ上へ提示されることから、提示されるピクチャのシーケンスを特定のフレームレート、例えば毎秒75フレームで提示されるフレームシーケンスとして言及することが一般的であるが、フレームレートは毎秒1フレームの1/20から毎秒1000フレームまで広く変わってもよい(熟練者には、重要である点は実際のフレームレートではなく、各領域/ロケーションにおける刺激の平均提示速度であることが認識されるであろう)。編成によっては、複数のフレームで持続する持続時間に渡って同じ刺激が現れたままであってもよい。後述する例では、フレームレートは一方の目で毎秒30画像であり、瞳孔サイズのビデオレコードは毎秒60フレームで記録された。他の編成では、画像は、幾つかのフレームに渡って起動される間に、時間変調される明るさ、または他の感覚次元を有してもよい。多焦点の事例では、各ロケーションにおける刺激の出現は、刺激される感覚野の各部分の応答を特徴づける線形および/または非線形重み関数が推定されることを可能にすべく統計学的に十分に独立した擬似ランダムシーケンスによって管理される。これらのシーケンスは、典型的には、フレームレートに直に関連づけられない速度、但し領域毎に毎秒約1/20から領域当たり毎秒10までの範囲内、かつ典型的には領域当たり毎秒0.2から領域当たり毎秒5までの範囲内の平均提示速度を有する速度で刺激を送達する。刺激提示の持続時間は、各領域の平均間隔より遙かに短く、刺激を時間的にまばらにするものであるべきである。しかしながら、各領域における異なる送達速度または各領域毎の速度の混合も可能であることは認識されるであろう。複数の刺激領域の配置は、図19Cに示されている。図11B、13Bならびに図14B、14Cおよび14Dは、刺激配置の他の例として考えられるものを描いている。
In use for visual field assessment of
検査中、対象は、これらの複数の刺激領域の中心に提示されたスポット(例えば、図20Bのクロスマーク161)を凝視するように指示される。当業者には、凝視を維持する、対象の目および/または凝視位置の監視等の他の技術が使用されてもよく、かつディスプレイ画面140上の検査刺激の位置は対象の凝視位置の変化に応じて変更されてもよいことが認識されるであろう。本例において、視覚神経系の応答は、照明ソース158からの目の赤外線照射により取得される対象の瞳孔の直径がカメラ156からのビデオレコードによって記録され、かつ記録デバイス152によって記録される。記録デバイスはプロセッサに組み込まれてもよく、その処理はリアルタイムで実行されてもよい。この場合、検出器センサからのデータは処理後まで記録または格納する必要がなくてもよい。あるいは、喚起される電気的ポテンシャル147はセンサ148から取得されることも可能である。ここで述べている視覚評価のための装置、特に刺激により喚起される神経応答を検出するためのセンサは置換されてもよく、限定的ではないこと、よって熟練者によって認識される様々な装置態様が代用されてもよいことは認識されるであろう。
During the examination, the subject is instructed to stare at a spot (eg,
この点に関連して、当業者には、喚起される神経応答は電気的ポテンシャルを測定すること以外に、磁気もしくは電磁放射線または音響信号、瞳孔反応もしくは目の動きを検出および/または記録すること等の代替技術によって検出されてもよいことが認識されるであろう。電磁または音響監視センサの場合、電磁または音響信号は、脳により発せられる受動信号、または脳を介してもしくは脳へ向かって伝達される電磁もしくは音響エネルギーの散乱、吸収、屈折もしくは反射の効果のいずれかであり、その採用もまた可能である。また、これらの検出技術の2つ以上を何らかの組合せで使用することも除外されない。
例
例1
In this regard, those skilled in the art will be able to detect and / or record magnetic or electromagnetic radiation or acoustic signals, pupillary responses or eye movements, in addition to measuring the electrical potential of the evoked neural response. It will be appreciated that it may be detected by alternative techniques such as. In the case of an electromagnetic or acoustic monitoring sensor, the electromagnetic or acoustic signal is either a passive signal emitted by the brain or the effect of scattering, absorption, refraction or reflection of electromagnetic or acoustic energy transmitted through or towards the brain. However, its adoption is also possible. Also, the use of any combination of two or more of these detection techniques is not excluded.
Example 1
本例は、多焦点視野アーキテクチャを用いた上述の方法による対象の視野評価について記述するものであり、エッジがぼやけて平滑な重なり合う刺激を使用する両眼分離刺激に反応する対象の2瞳孔の各々からの応答を同時に記録することによって、対象の両方の網膜の神経応答の客観的な記録を取得した。両眼分離刺激は、両目の視野の独立した刺激である。 This example describes the visual field evaluation of an object according to the method described above using a multifocal visual field architecture, each of the two pupils of the object responding to binocular separation stimuli using overlapping stimuli with blurred edges and smoothness Objective recordings of the neural responses of both subjects' retinas were obtained by simultaneously recording responses from. The binocular separation stimulus is an independent stimulus of the visual field of both eyes.
別々のO30−44刺激集合を、図20Aに描かれているような、別々の2つの液晶ディスプレイ(LCD)140aおよび140bの画像を一方のディスプレイが対象の各々の目144aおよび144bへ方向づける装置の立体配置を使用して各々の目に提示した。各瞳孔のリアルタイムの直径は、IR LED158(前出のLEDのような複数のLED)からの赤外線照明の下で別々のビデオカメラ156aおよび156bを使用して記録し、監視した。2つのディスプレイ140aおよび140b上の刺激の提示を制御し、ビデオカメラから記録されたデータを収集して格納し、記録されたデータを処理するプロセッサ154は、本事例ではコンピュータシステムとして描かれている。本事例において、装置145の光学システムは、ディスプレイ140aおよび140bからの画像を対象の目144aおよび144bへ方向づけるための2つの二色性「コールドミラー」160aおよび160bを備える。コールドミラーは、対象の目の瞳孔から反射して返されるIR光から各瞳孔のリアルタイムの直径を記録するために、ディスプレイ上へ提示される刺激の波長(色)に対して高反射性であり、同時に、IR LEDの波長において高度に透過性であるように構成される。各LCDの背景照明レベルは、10cd・m−2であった。所定の刺激領域が活性であったとき、その刺激領域の中心部は明度290cd・m−2であった。本例に使用される個々の刺激は、白色というよりはむしろ、(図19Dに描かれているように)装置のディスプレイ画面上では黄色であった。編成によっては、ディスプレイの背景も黄色であってもよい。黄色い刺激は、青色光を吸収する対象の水晶体の褐色効果の可能性を減じる。但し、褐色の度合いはほぼ長年に渡る対象の紫外線への暴露に依存し、よって、褐色の効果は対象の年齢と共に増大する。黄斑色素も青色光を吸収し、よってその光学密度は人によって変わる。したがって、青色光成分を含まない、例えば黄色い刺激の使用が効果的であることが見出されている。
For a device that directs separate O30-44 stimulus sets to images of two separate liquid crystal displays (LCDs) 140a and 140b to each eye 144a and 144b of interest, as depicted in FIG. 20A. A configuration was used to present each eye. The real-time diameter of each pupil was recorded and monitored using
また、黄色い刺激のより長い波長は、眼内の小さい媒介物混濁による反射が比較的少ない。したがって、全体として、黄色い刺激は白色照射よりも、異なる対象間の網膜照射の可変性を少なくする。しかしながら、この設計は限定的ではなく、他の色の光または色の組合せにも他の利点がある場合のあることは理解されるであろう。 Also, the longer wavelengths of yellow stimuli are relatively less reflective due to small opacity in the eye. Overall, therefore, yellow stimuli make retinal irradiation variability between different subjects less than white irradiation. However, it will be appreciated that this design is not limiting and other colors of light or color combinations may have other advantages.
88個の刺激領域の擬似ランダム変調は、刺激が時間的および空間的に疎の特性を有することを保証するために設計されている[例えば、全てMaddess & Jamesに付与された米国特許第6,315,414号、米国特許第7,006,863号および国際公開第WO 2005/051193号を参照されたい]。時間的な疎は、刺激がヌル刺激のより長い間隔の間に、好適には領域毎に毎秒0.25〜4の間の提示速度で過渡的に提示される性質である。したがって、起動されると、刺激領域は290cd・m−2で僅か33msだけ留まり、平均提示速度は領域毎に毎秒1刺激であった。空間的な疎は、所定の1つの領域が活性であると、その領域に隣接する領域は同時的に活性にはならないことを保証する性質である。時間的および空間的に疎である刺激は、記録される応答の信号対雑音比を増大させる。検査刺激集合の合計持続時間は4分であったが、これは持続時間30秒の8つの検査セグメントに分割されていた。 Pseudorandom modulation of 88 stimulus regions is designed to ensure that the stimulus has temporally and spatially sparse properties [eg, US Pat. No. 6,315,414, all granted to Maddess & James U.S. Patent No. 7,006,863 and International Publication No. WO 2005/051193]. Temporal sparseness is a property in which stimuli are presented transiently over a longer interval of null stimuli, preferably at a presentation rate of between 0.25 and 4 per second per region. Thus, when activated, the stimulation area remained at 290 cd · m −2 for only 33 ms and the average presentation speed was 1 stimulation per second per area. Spatial sparseness is a property that guarantees that if a given region is active, the regions adjacent to that region are not active simultaneously. Stimuli that are sparse in time and space increase the signal-to-noise ratio of the recorded response. The total duration of the test stimulus set was 4 minutes, which was divided into 8 test segments with a duration of 30 seconds.
本例における調査グループは、43名の正常な対象と、44名の緑内障疾患のある対象とによる174件の眼球を包含するものであった。緑内障患者の視覚障害は、軽度、中等度および重度の損傷視野に分類した。緑内障対象では、ほぼ同数がこれらの3つの視野タイプに属していた。図19Cに示すようなエッジがぼやけて重なり合う大きい刺激を用いるO30−44刺激に加えて、対象は、同じ記録セッションにおいて同じ装置を使用してT30−24多焦点検査集合を用いる検査も受けた。T30−24パターンはO30−44パターンの部分集合であり、図19Aおよび図19Dの左半分に示されている。T30−24は、重なり合う刺激が存在しないことを除けば、他はO33−44刺激と同一であった。2つの検査タイプの間には最低2分間の静止時間が与えられ、検査タイプの順序は対象間でランダムに決められた。 The study group in this example included 174 eyeballs by 43 normal subjects and 44 subjects with glaucoma disease. Visual impairment in glaucoma patients was classified into mild, moderate and severe damage fields. In glaucoma subjects, approximately the same number belonged to these three field types. In addition to the O30-44 stimulus using a large stimulus with blurry and overlapping edges as shown in FIG. 19C, the subject was also examined using the T30-24 multifocal test set using the same device in the same recording session. The T30-24 pattern is a subset of the O30-44 pattern and is shown in the left half of FIGS. 19A and 19D. T30-24 was identical to the O33-44 stimulus except that there were no overlapping stimuli. A minimum of 2 minutes of rest time was given between the two test types, and the order of test types was randomly determined between subjects.
図21Aおよび21Bは各々、多焦点視野刺激に対する対象の左右瞳孔から、よって瞳孔反応が導出される2つの網膜からの応答を示す。各瞳孔および刺激領域については、視野内のO33−44刺激のロケーションにおいて1つの応答が粗くプロットされて存在することに留意されたい。刺激システムは、2つの独立した多焦点バージョンのO33−40刺激集合を同時に、各々の目に1つの集合を示して表示した。結果は、各視野ロケーションに対する応答ペアとなり、この応答ペアは、両目の応答の独立した推定値をもたらす左右の瞳孔から発生する。 FIGS. 21A and 21B each show responses from two retinas from which the pupil response is derived from the subject's left and right pupils to a multifocal visual field stimulus. Note that for each pupil and stimulation region, there is one response roughly plotted at the location of the O33-44 stimulation in the field of view. The stimulation system displayed two independent multifocal versions of the O33-40 stimulation set simultaneously, showing one set for each eye. The result is a response pair for each field location, which arises from the left and right pupils that provide independent estimates of both eye responses.
図22は、HFA24−2検査により測定された、図21と同じ対象に関する正常機能の確率を示す。正常なパフォーマンスの確率とグレーレベルとの対応づけは、使用符号の説明に記されている。左右の目における、重なり合う刺激によるO33−40検査と重ならない刺激HFA24−2検査との応答を比較することにより、HFA結果が示唆するように、図21における左目視野下部が右目視野の対応部分よりも小さい応答を有することが分かる。 FIG. 22 shows the probability of normal function for the same subject as FIG. 21 measured by HFA 24-2 test. The correspondence between the probability of normal performance and the gray level is described in the explanation of the used codes. By comparing the responses of the O33-40 test with overlapping stimuli to the non-overlapping stimulus HFA 24-2 test in the left and right eyes, the lower left eye field in FIG. Also have a small response.
これらの2つの検査方法による視野の感度変化を特徴づける能力を定量化するために、先の受信者動作特性(ROC)プロット(不図示)を、正常な対象の視野を誤認する偽陽性率に対抗して緑内障対象の視野を認識する感度について作成した。これは、雑音の存在下で信号を測定するシステムの能力を特徴づけるものとして十分に認められた方法である。ROCプロットにおいて、完全なパフォーマンスは、プロット内の曲線下の面積1(または、正確な測定の確率100%)を有する。偶然のパフォーマンスは、ROCプロット下の面積0.5(正確な測定の確率は50%)に等しい。表1は、T30−24およびO30−44に関する視野分類毎のROCプロットの結果を示す。
In order to quantify the ability to characterize visual field sensitivity changes due to these two test methods, the previous receiver operating characteristic (ROC) plot (not shown) is converted to a false positive rate that misidentifies the visual field of normal subjects. The sensitivity to recognize the visual field of glaucoma subjects was created. This is a well accepted method for characterizing the system's ability to measure signals in the presence of noise. In the ROC plot, the full performance has an

表1の各行は視野の分類を示し、右側の2列はROCプロット下の面積比率に関する結果を示す。重なり合いがあるものおよびないものによる2方法は、重度の視野に関しては約80.3%とほぼ同レベルの性能であるが、軽度および中等度の視野ではO30−44方法の性能が明らかに高く、相対的に損傷されていない緑内障視野を識別する基本的感度が優れていることを示している。 Each row in Table 1 shows the field classification, and the two right columns show the results for the area ratio under the ROC plot. The two methods with and without overlap are about the same level of performance as about 80.3% for heavy vision, but the performance of the O30-44 method is clearly higher for mild and moderate vision, It shows that the basic sensitivity to distinguish the relatively intact glaucoma visual field is excellent.
全ての事例において、ROCプロットを、図21に示すような瞳孔反応波形による面積と、ピークまでのその時間との一次結合であるスコアを基礎として形成した。スコアは、これらの2変数を基礎として標準線形判別関数から導出した。所定の一人の対象について、これらの変数は最小から最大へソートされ、正常視野および緑内障視野のN個の最小スコアを判別およびROC分析に入力した。これは、様々なN値について繰り返され、上記表1は、最高の性能を示したNに対するROCの値を示している。これは、障害がよりびまん性に分布しているように思われる軽度の視野欠損への適用可能性が極めて高い直裁的プロセスである。重度の視野では、障害のある部位が群になる傾向があり、よって、重度の視野ではROC面積を増大させると予測される障害の群の様々な形式の二次元分析に対して敏感に反応する。 In all cases, ROC plots were formed on the basis of a score that is a linear combination of the area due to the pupil response waveform as shown in FIG. 21 and its time to peak. The score was derived from a standard linear discriminant function based on these two variables. For a given subject, these variables were sorted from minimum to maximum, and the N minimum scores for normal and glaucomatous fields were entered into discrimination and ROC analysis. This is repeated for various N values, and Table 1 above shows the ROC values for N that showed the best performance. This is a straightforward process with very high applicability to mild visual field defects where the disability appears to be more diffusely distributed. In a severe field of view, the site of disability tends to be a group, and therefore, in a severe field of view, it is sensitive to various types of two-dimensional analysis of groups of disorders that are expected to increase the ROC area. .
先に述べたように、直線極座標領域への変換の特別な利点は、図15B、16B、17Bおよび18Bに示されているもの等の極座標内の直線ブロック(例えば、図16Bのブロック102)として表すことのできる障害を強調するためにフィルタリングのようなオペレーションを実行する可能性にある。探し求めている障害の特徴が極座標領域では直線になり得ると認識することにより、特定のサイズおよびアスペクト比の演算子を用いて視野データの空間フィルタリングを実行することが可能である。空間フィルタ演算子のサイズは、例えば直線極座標領域における視野データの自己相関分析によって識別されてもよい。他の編成では、細長いフィルタ演算子も、これらが神経線維41の縫線への障害を表現する直線ブロック(例えば、図16Bのブロック102、図17Bのブロック112、図18Bのブロック117)のサイズおよび形状を模倣するという理由で適切である場合がある。
As noted above, the special advantage of converting to a linear polar coordinate region is that as a linear block in polar coordinates such as that shown in FIGS. 15B, 16B, 17B and 18B (eg, block 102 in FIG. 16B). There is the possibility of performing operations such as filtering to highlight the obstacles that can be represented. By recognizing that the characteristic of the obstacle being sought can be a straight line in the polar coordinate region, it is possible to perform spatial filtering of the visual field data using operators of a specific size and aspect ratio. The size of the spatial filter operator may be identified, for example, by autocorrelation analysis of visual field data in a linear polar coordinate region. In other arrangements, the elongated filter operators may also be the size of a linear block (eg, block 102 in FIG. 16B, block 112 in FIG. 17B, block 117 in FIG. 18B) that represents an obstacle to the raphe of the
図23B〜23Dは、様々なサイズおよびアスペクト比のメジアンフィルタの使用が、比較的少ないピクセル(図15B、16B、17Bおよび18Bに示されているもの等)を有する画像マトリクス(図23A)に与える効果の例を示している。メジアンフィルタは、窓が画像点方向へと横断的に移動される一定の大きさの小さい窓の反復適用によって動作し、窓下へ落下するピクセルのメジアン値が計算されて画像へ戻される。メジアンフィルタは一般に、画像から極値を除去するために使用される。図23Aは、原画像を示す。図23Bは、移動する窓が高さ3ピクセルおよび幅1ピクセルであったメジアンフィルタ使用の効果を示す。図23Cは、移動する窓が高さ1ピクセルおよび幅3ピクセルであったメジアンフィルタ使用の効果を示す。これらのフィルタは、画像の垂直または水平の特徴を保つ傾向があり、全体的には長手軸に沿って平滑化が行われている。図23Dは、移動する窓が高さ3ピクセルおよび幅3ピクセルであったメジアンフィルタ使用の効果を示す。 23B-23D, the use of median filters of various sizes and aspect ratios gives an image matrix (FIG. 23A) with relatively few pixels (such as those shown in FIGS. 15B, 16B, 17B and 18B). An example of the effect is shown. The median filter operates by iterative application of a small window of constant size as the window is moved across in the image point direction, and the median value of the pixels falling under the window is calculated and returned to the image. A median filter is generally used to remove extreme values from an image. FIG. 23A shows an original image. FIG. 23B shows the effect of using a median filter where the moving window was 3 pixels high and 1 pixel wide. FIG. 23C shows the effect of using a median filter where the moving window was 1 pixel high and 3 pixels wide. These filters tend to preserve the vertical or horizontal characteristics of the image and are generally smoothed along the longitudinal axis. FIG. 23D shows the effect of using a median filter where the moving window was 3 pixels high and 3 pixels wide.
線形フィルタリングの類似形式も、画像との適切な演算子の畳み込みによって行うことができる。これを行うための、メジアンフィルタに関して記述した例(図23B〜23D)に類似する簡便な方法は、感覚野データを表す画像を異なる演算子で垂直および水平方向に畳み込むというものである。視野データの極座標表現の場合、半径方向および極角度方向に沿って異なる演算子が使用される。図24は、このような演算子の2例を示している。演算子210および220は共に、一次元のガウス確率密度関数である。狭い方の関数の演算子210は、画像に垂直に畳み込まれるためのものであり、広い方の関数の演算子220は、画像に水平に畳み込まれるためのものである。演算子210および220の高さの半分は各々約1または3ピクセルに相当し、よってこれらはサイズ的に図23Bの排出用3×1ピクセルメジアンフィルタに匹敵することに留意されたい。双方のカーネルの重みの設定は、演算子210および220の各々より下の面積、ゆえにDC利得が1に設定されるように行われる。
Similar forms of linear filtering can also be performed by convolution of appropriate operators with the image. A simple method for doing this, similar to the example described for the median filter (FIGS. 23B-23D), is to convolve images representing sensory field data vertically and horizontally with different operators. For polar coordinate representations of field of view data, different operators are used along the radial and polar angle directions. FIG. 24 shows two examples of such operators. Both
図24の演算子210および220を図23Aの同じ画像で畳み込むことの効果を、図25A〜25Dに示す。図25Aは、図23Aの場合と同じ画像である原画像を示す。図25Bは、垂直方向でハーフハイトが3ピクセルの演算子220および水平方向で幅1ピクセルの演算子210による畳み込みを使用する効果を示す。図23Cは、垂直フィルタと水平フィルタとの交換の効果を示す。この場合もやはり、これらのオペレーションは画像の垂直または水平の特徴を保ち、全体的にはその長手軸に沿って平滑化が行われている。図25Dは、垂直方向および水平方向の双方で幅3ピクセルの広い演算子220を使用する効果を示す。
The effect of convolving the
これらのタイプのオペレーションの視野変化を識別する能力に対する効果を観察するために、62名の正常な対象および63名の緑内障患者から視野データを収集した。収集方法は、図19A〜19Dに関して先に記述した空間的配置によるO30−44刺激の多焦点表現であった。サンプル内の対象数が多いことから、対象の視野を障害の増大順の範疇に分類することが可能であった。これは、ハンフリー視野計(HFA)によって評価される視野内の正常な感度からの偏りの平均を決定する平均欠損分類技術を使用して行われた。障害が軽度の視野は、感度低下−6dB未満のHFA平均欠損を有するものと考えられた。障害が中程度の視野は、−12dBより多く−6dB未満の平均欠損を有していた。障害が重度の視野は、平均欠損が−12dBより多いと記録される視野として分類された。 In order to observe the effect of these types of operations on the ability to identify visual field changes, visual field data were collected from 62 normal subjects and 63 glaucoma patients. The collection method was a multifocal representation of the O30-44 stimulus with the spatial arrangement described above with respect to FIGS. Due to the large number of subjects in the sample, it was possible to classify the field of view of the subjects into a category of increasing order of disability. This was done using an average defect classification technique that determines the average of deviations from normal sensitivity within the field of view as assessed by a Humphrey perimeter (HFA). Fields with mild impairment were considered to have an HFA average deficit of less than −6 dB in sensitivity. A field of moderate obstruction had an average defect of more than -12 dB and less than -6 dB. Fields with severe impairment were classified as fields that were recorded when the average defect was greater than -12 dB.
下表2は、ROCプロット下の面積比率として表現される、緑内障診断のための結果を示す。列は、メジアンフィルタの移動する窓のサイズ、単位ピクセル、に対応する。垂直および水平ピクセルの領域サイズは、各列の上側に記述されている。領域サイズの幾つかは、図23Aのものと同じである。最左列(「フィルタなし」と記されたもの)は、フィルタリングが行われていない場合の結果を示す。 Table 2 below shows the results for glaucoma diagnosis expressed as the area ratio under the ROC plot. The columns correspond to the moving window size, unit pixel, of the median filter. The region sizes for vertical and horizontal pixels are described above each column. Some of the region sizes are the same as those in FIG. 23A. The leftmost column (labeled “no filter”) shows the result when filtering is not performed.
フィルタリングを行ったデータは、フィルタリングなしの場合より結果が僅かに悪いことが多いが、概してフィルタは、より等方性であるものよりも細長い方が性能がよいことは明らかである。ほとんど同じ結果が、図24の演算子210および220等のガウス演算子を使用する垂直および水平方向の畳み込みに関しても観察される。雑音除去は、下記の表3から分かるように、診断能力を大幅に喪失することなく、報告される視野をより再生可能なものにする場合がある。
Filtered data is often slightly worse in results than without filtering, but it is clear that in general, filters perform better in elongates than those that are more isotropic. Nearly the same results are observed for vertical and horizontal convolution using Gaussian operators such as
概して、同等のフィルタサイズの場合(表3)、メジアンフィルタは線形(ガウス)フィルタより性能がよかった(表2)。また、かなり長いフィルタ窓は、長さ方向の長さが約3ピクセルであるものより性能が悪いことも明らかである。これは、臨界スケールかつ直線形状の分析窓は視野の変化を検出する能力を高める、という先に表した考案を例示している。明らかに、ここで実証したフィルタリングオペレーションの例は、単に例示を目的として提示されたものであり、限定的なものではない。多くの多様な形式のフィルタおよび演算子は、上述の技術の範囲および精神を保ちながら、熟練者によって使用されてもよい。例えば、代替的または組合せで実行手段またはガウス窓を備えてもよい1つ以上の線形フィルタが使用されてもよい。1つ以上のフィルタは、エッジ保存フィルタであってもよい。エッジ保存フィルタは、メジアンフィルタ、前後方向メジアンフィルタ[例えば、S.H.Chung、R.A.Kennedyにより「Forward-backward non-linear filtering technique for extracting small biological signals from noise」と題する論文、J.Neuroscience Methods、第40巻、71-86ページ(1991年)、において記述されているもの]または反復的非線形フィルタ[例えば、D.Harwood、外著「A new class of edge-preserving smoothing filters」Pattern Recognition Letters、第6巻、155-162ページ(1987年)、に記述されているもの]のうちの1つ以上から選択されてもよい。
例2
In general, for comparable filter sizes (Table 3), the median filter performed better than the linear (Gaussian) filter (Table 2). It is also clear that a fairly long filter window performs worse than one with a length of about 3 pixels. This illustrates the above-described idea that a critical scale and linear shaped analysis window enhances the ability to detect changes in the field of view. Clearly, the example filtering operations demonstrated herein are presented for illustrative purposes only and are not limiting. Many different types of filters and operators may be used by the skilled person while maintaining the scope and spirit of the above-described technique. For example, one or more linear filters may be used that may comprise execution means or Gaussian windows, alternatively or in combination. The one or more filters may be edge preserving filters. Edge-preserving filters include median filters, longitudinal median filters [eg, a paper titled “Forward-backward non-linear filtering technique for extracting small biological signals from noise” by SHChung, RAKennedy, J. Neuroscience Methods, Vol. 40, 71. -86 (1991)] or iterative nonlinear filters [eg, D. Harwood, et al., “A new class of edge-preserving smoothing filters” Pattern Recognition Letters, Vol. 6, 155- 162 (1987), etc.] may be selected.
Example 2
重なり合いの方法の利点は、緑内障診断に限定されるものではない。例えば、29名の正常な対象および20名の加齢黄斑変性症(AMD)の対象に関する調査である。
The advantages of the overlapping method are not limited to glaucoma diagnosis. For example, a survey of 29 normal subjects and 20 subjects with age-related macular degeneration (AMD) .
本例の場合、調査において対象へ提示された2タイプの刺激は、先の例で使用されたものとは僅かに異なるタイプの刺激であった。 In this example, the two types of stimuli presented to the subject in the study were slightly different types of stimuli than those used in the previous examples.
患者の目の約半分はさほど重度でない萎縮型AMD、半分はより重度な滲出型AMDを患い、4つの目は外見上臨床的に正常であった。正常者および患者の各グループは、年齢および性別によく調和していた。 About half of the patient's eyes suffered from less severe atrophic AMD, half suffered from more severe wet AMD, and the four eyes were clinically normal in appearance. The normal and patient groups were well harmonized with age and gender.
上述の例の場合のように、刺激は、先の図19Aを参照して説明され、T30−24刺激と記述されている刺激の通りの重ならない24領域、または図19Cおよび19Dに示され、先にO30−44刺激と記述されている44領域の何れかを有していた。本例に使用する刺激と例1のそれとの唯一の相違は、本例では、双方の事例において双方の多焦点刺激アレイのサイズが係数2で縮小されたことである。したがって、本例の各アレイは30度ではなく15度の半径に内在し、ゆえに、これらの刺激の配置はT15−24およびO15−44刺激アレイと称される。これらの刺激は、より中心部におけるAMD性の欠損を特徴づけるように設計した。 As in the example above, the stimuli are illustrated in FIGS. 19C and 19D, or the non-overlapping 24 regions as described with reference to FIG. 19A above and described as T30-24 stimuli, It had any of the 44 regions previously described as O30-44 stimulation. The only difference between the stimulus used in this example and that of Example 1 is that in this example, the size of both multifocal stimulus arrays was reduced by a factor of 2 in both cases. Thus, each array in this example resides in a radius of 15 degrees rather than 30 degrees, and therefore the placement of these stimuli is referred to as T15-24 and O15-44 stimulus arrays. These stimuli were designed to further characterize AMD defects in the center.
上述の先例1の場合のように、刺激領域は黄色であったが、提示された際の最大輝度は10cd/m2の背景上で250cd/m2であった。個々の刺激が各々ディスプレイ上で対象へ提示される、提示に際しての各刺激の持続時間は33msであった。さらに、各ロケーションにおける多焦点刺激の擬似ランダムな順序の提示の平均間隔を1秒または4秒のいずれかであるように変更する1つの変形も包含された。ゆえに、全ての対象において観察された4つの刺激は、平均間隔1秒で提示されるより速い刺激についてはT15−24−1およびO15−44−1と指名され、より遅い4秒間隔の刺激はT15−24−4およびO15−44−4と指名された。この場合もやはり、診断能力の測度はROCプロット下の面積パーセントであった。表4は、最大で取得された面積を示す。
As in the case of the
上側の行(最悪N件、と記されている)は、一方の目の内部で最も悪い少数の領域が考察されると取得されるROCプロット下の面積の比率を示す(先の例1から、面積100%は完全な診断パフォーマンスを表し、50%は偶然のパフォーマンスを表すことを想起されたい)。下側の行(非対称)は、個々の患者の左右の目における比較可能な領域間の差を基礎として診断のついた事例の比率を記録し、よって各対象の視野内の両眼間非対称を記録する。正常な対象の視野間の非対称性は、患者における非対称と比較される。 The upper row (marked worst N cases) shows the ratio of the area under the ROC plot obtained when the worst few regions inside one eye are considered (from Example 1 above) Recall that 100% area represents complete diagnostic performance and 50% represents accidental performance). The lower row (asymmetric) records the proportion of cases diagnosed based on the difference between comparable areas in the left and right eyes of an individual patient, and thus the binocular asymmetry in each subject's field of view. Record. The asymmetry between the visual fields of normal subjects is compared with the asymmetry in the patient.
提示速度に関わらず、または両眼間の非対称性が考察されたかどうかに関わらず、O15−44−1およびO15−44−4検査の重なり合う刺激はT15−24−1およびT15−24−4検査の重ならない刺激より性能が優れていたことは明らかである。これは、刺激の特定のスケールとサンプリング格子とがタスクに調和すべきであることを実証している。
例3
Regardless of presentation speed or whether asymmetry between the eyes is considered, the overlapping stimuli of the O15-44-1 and O15-44-4 tests are the T15-24-1 and T15-24-4 tests. It is clear that the performance was superior to the non-overlapping stimulus. This demonstrates that the specific scale of the stimulus and the sampling grid should match the task.
Example 3
視野評価において重なり合う刺激を使用するさらなる例では、23名の正常な対象および23名のインスリン非依存性糖尿病(NIDDM)患者に関する調査において、先に述べた黄色のT30−44の290cd/m2が使用された。23名のNIDDM患者のうち、1名だけが糖尿病性網膜症の任意の明らかな兆候を示し、この対象からはいくつかの小血管瘤が表示された。正常者および患者の各グループは、年齢および性別によく調和していた。 In a further example of using overlapping stimuli in visual field assessment, in a study on 23 normal subjects and 23 non-insulin dependent diabetes mellitus (NIDDM) patients, the yellow T30-44 290 cd / m 2 mentioned above was Used. Of the 23 NIDDM patients, only one showed any obvious signs of diabetic retinopathy, and several small aneurysms were displayed from this subject. The normal and patient groups were well harmonized with age and gender.
本調査では、正常者およびNIDDM患者の各グループ間で平均瞳孔サイズに著しい相違はなく、また平均瞳孔サイズは診断能力を大きく担うものではなかった。これは、患者の瞳孔が糖尿病性神経障害によって影響されないことを示唆している。 In this study, there was no significant difference in the average pupil size between groups of normal subjects and NIDDM patients, and the average pupil size did not greatly contribute to the diagnostic ability. This suggests that the patient's pupil is not affected by diabetic neuropathy.
NIDDMを10年以上患っていた8名の患者からの16の目に関する、N件の最悪領域を基礎とする診断パフォーマンス(ROCプロット下の面積として表示)は、0.89%±0.06%(平均±SE)であった(非対称性は、正常なパフォーマンスとの差を基礎とする、正常な対象と患者とで比較される目における差である)。正常な対象およびAMD対象の両眼間非対称が考慮された場合のROC面積は、0.97%±0.03%であった。 Diagnostic performance based on the N worst areas (shown as the area under the ROC plot) for 16 eyes from 8 patients who have been suffering from NIDDM for more than 10 years is 0.89% ± 0.06% (Mean ± SE) (asymmetry is the difference in eyes compared between normal subjects and patients based on differences from normal performance). The ROC area when considering the asymmetry between both eyes of normal subjects and AMD subjects was 0.97% ± 0.03%.
この調査では、重ならない刺激についての観察を行わなかったために、本例は重なり合う刺激と重ならない刺激との差を実証していない。しかしながら、本例は、感覚野の変化を調査するためのこの方法の有用性を緑内障以外の状況に関して実証している。
概要
In this study, the observation of non-overlapping stimuli was not made, so this example does not demonstrate the difference between overlapping and non-overlapping stimuli. However, this example demonstrates the usefulness of this method for investigating changes in sensory cortex in situations other than glaucoma.
Overview
したがって、これまでに述べた方法および例を要約すると、視野が空間内に、従来の静的自動視野計に使用される粗いサンプリング格子では表現され得ない感度の変異を含んでいると、これは測定された視野の形状を歪ませる可能性のあることが実証されている。これらの空間周波数が存在するという事実は、図1〜4において検証されている。この問題を解決するために、同時に提示されると空間内で重なり合う検査刺激が、歪を生じさせるより高い周波数を捕捉しないほど十分に滑らかである検査刺激のエッジと共に使用される。したがって、個々の刺激はそれ自体で高い空間周波数コンテンツを低減し、よってぼやけたエッジを有する。ヒトが屈折をおそらくは数ジオプタだけ誤って矯正されても、このようなぼやけた刺激の外観が変わらない(すなわち、刺激のコントラストが復調されない)とすると、これは視野検査に適する。十分に平滑である、またはぼやけた個々の刺激には、対象が十分な屈折矯正を受けなくてもよく(すなわち、屈折矯正が誤った、不十分なものであっても、全く行われなくてもよく)、検査の結果にさほど影響がない、という重大な利点がある。 Therefore, to summarize the methods and examples described so far, if the field of view contains sensitivity variations in space that cannot be represented by the coarse sampling grid used in conventional static automatic perimeters, It has been demonstrated that the shape of the measured field of view can be distorted. The fact that these spatial frequencies exist is verified in FIGS. To solve this problem, test stimuli that overlap in space when presented simultaneously are used with test stimulus edges that are sufficiently smooth not to capture higher frequencies that cause distortion. Thus, individual stimuli themselves reduce high spatial frequency content and thus have blurred edges. If the human corrects refraction, perhaps by a few diopters, the appearance of such a blurred stimulus does not change (ie, the stimulus contrast is not demodulated), this is suitable for visual field examination. Individual stimuli that are sufficiently smooth or blurred may not require the subject to undergo sufficient refractive correction (ie, even if the refractive correction is wrong or inadequate, it is not performed at all) There is a significant advantage that the test results are not significantly affected.
さらに、高度に重なり合う刺激は、空間的に移動される刺激バージョンが変化した視野感度の部位とより正確に位置合わせされることを有効化する点が有利であることも示されている。またこれは、かなり成功しているFDT視野計の刺激により示唆されるかなり大きい刺激、およびHFAの視野データを分析するために先に実証されたプール領域のサイズの有用性も捉える。 In addition, highly overlapping stimuli have also been shown to be advantageous in that they enable spatially moved stimulus versions to be more accurately aligned with altered field-of-view areas. It also captures the usefulness of the much larger stimulation suggested by the stimulation of the FDT perimeter that has been quite successful, and the size of the pool area previously demonstrated to analyze the HFA field of view data.
またさらに、重なり合う刺激には幾つかの利点があるとしても、視野の水平および垂直経線に重ならない刺激が視野の過渡的変化または障害された領域を検出する能力を有するものとして実証されていることも見出されている。 Still further, even though overlapping stimuli have several advantages, stimuli that do not overlap the horizontal and vertical meridians of the field of view have been demonstrated as having the ability to detect transient changes or impaired areas of the field of view. Has also been found.
さらに、上述の考察は、任意数の次元の任意の感覚空間へ適用可能であることも認識される。 Furthermore, it will be appreciated that the above considerations can be applied to any sensory space of any number of dimensions.
再度またさらに、半径方向の対称性および中心窩方向への網膜細胞の中央集中によって、各視野ロケーションにとって最適サイズの刺激の探索は視野自体ではなく極空間へ変換された視野を用いることでよりよく調査されることが含意される点も見出されている。ほとんど同じ理由で、様々な視野計から取得されるデータは、このような極空間において最もよく比較される場合もある。 Again and further, due to the radial symmetry and the central concentration of retinal cells in the foveal direction, the search for the optimally sized stimulus for each visual field location is better done using the visual field converted to polar space rather than the visual field itself. Some points have also been found to be investigated. For almost the same reason, data obtained from various perimeters may be best compared in such a polar space.
最後に、標準視野計の粗いサンプリング格子によって表現できるものより高い空間周波数は、サンプリング密度を高めることのない何らかの方法でこれらの周波数を使用する見通しを高めることもまた見出されている。サンプリング格子が適切にランダムであると、スーパーナイキスト周波数の、位相とはいかないまでも、少なくとも電力を推定することができる。 Finally, it has also been found that spatial frequencies higher than those that can be represented by a standard perimeter coarse sampling grid increase the prospect of using these frequencies in some way without increasing the sampling density. If the sampling grid is appropriately random, at least the power can be estimated, even if it is out of phase with the Super Nyquist frequency.
したがって、これまでに記述した、かつ/または例示した方法、装置およびシステムがヒトおよび動物対象の1つ以上の感覚野の、具体的には目の視野の向上した評価および定量化を提供することは認識されるであろう。 Thus, the methods, devices and systems described and / or illustrated so far provide improved evaluation and quantification of one or more sensory areas of human and animal subjects, in particular the visual field of the eye. Will be recognized.
本明細書に記述しかつ/または図面に示した方法、装置およびシステムは単に例示として提示されたものであって、本発明の範囲を限定するものではない。別段の具体的な指摘のない限り、これらの方法、装置およびシステムの個々の態様およびコンポーネントは改変されてもよく、または既知の等価物または将来開発され得るもの、または将来容認可能な代替物であることが見出され得るもの等のまだ知られていない代替物で置換されていてもよい。また、潜在的アプリケーションの範囲は広く、本方法、装置およびシステムはこのような多くの変形に適用可能であることが意図されているために、これらの方法、装置およびシステムは、特許請求された発明の範囲および精神を保ちつつ様々な用途に改変されてもよい。 The methods, apparatus, and systems described herein and / or shown in the drawings are presented by way of example only and are not intended to limit the scope of the invention. Unless otherwise indicated, the individual aspects and components of these methods, devices and systems may be modified, or with known equivalents or those that may be developed in the future, or future acceptable alternatives. It may be replaced with alternatives not yet known, such as those that may be found. Also, since the scope of potential applications is wide and the method, apparatus and system are intended to be applicable to many such variations, the method, apparatus and system are claimed. It may be modified for various uses while keeping the scope and spirit of the invention.
Claims (41)
前記感覚野の選択されたロケーションへ刺激を提示する手段が作動して、前記選択されたロケーションは前記感覚野の一部にわたるサンプリング格子上の点に中心を置かれ、個々の前記刺激は、前記サンプリング格子の点において同時に提示されるとき、前記サンプリング格子上の刺激の空間エイリアシングが最小化されるように前記感覚野の感覚次元により画定される空間内で十分に重なり合い、前記刺激のプロファイルは、個々の刺激が前記サンプリング格子の密度によって表現され得、前記サンプリング格子の密度によって定義されるナイキストサンプリング周波数である最も高い空間周波数以下である空間周波数を主に含むように滑らかに変わり、
センサが作動して、前記対象の感覚野において前記刺激により喚起された応答を検出し、
プロセッサが作動して、前記検出された応答を処理し、検出した応答を前記選択されたロケーションにおいて前記対象の感覚野の機能に関連づける
ことを含む方法。 A method of operating a device for evaluating the function of at least one sensory area of a subject comprising:
The means for presenting a stimulus to a selected location of the sensory area is activated so that the selected location is centered at a point on a sampling grid that spans a portion of the sensory field, and the individual stimuli are When presented simultaneously at the points of the sampling grid, they overlap sufficiently in the space defined by the sensory dimension of the sensory field so that spatial aliasing of the stimulus on the sampling grid is minimized, and the stimulus profile is An individual stimulus can be represented by the density of the sampling grid and smoothly changes to mainly include a spatial frequency that is less than or equal to the highest spatial frequency that is the Nyquist sampling frequency defined by the density of the sampling grid,
A sensor is activated to detect a response evoked by the stimulus in the sensory area of the subject;
A method comprising: operating a processor to process the detected response and associating the detected response with a function of the subject's sensory area at the selected location.
前記感覚野の選択されたロケーションへ刺激を提示する手段であって、前記選択されたロケーションは前記感覚野の一部にわたるサンプリング格子上の点に中心を置かれ、個々の前記刺激は、前記サンプリング格子の点において同時に提示されるとき、前記サンプリング格子上の刺激の空間エイリアシングが最小化されるように前記感覚野の感覚次元により画定される空間内で十分に重なり合い、前記刺激のプロファイルは、個々の刺激が前記サンプリング格子の密度によって表現され得、前記サンプリング格子の密度によって定義されるナイキストサンプリング周波数である最も高い空間周波数以下である空間周波数を主に含むように滑らかに変わり、
前記対象の感覚野における前記刺激により喚起された応答を検出するセンサと、
前記検出された応答を処理し、検出した応答を前記選択されたロケーションにおいて前記対象の感覚野の機能に関連づけるプロセッサと
を備える装置。 A device for evaluating the function of at least one sensory area of a subject,
Means for presenting a stimulus to a selected location of the sensory field, the selected location being centered at a point on a sampling grid over a portion of the sensory field, wherein each individual stimulus is the sampling When presented simultaneously at grid points, they overlap well within the space defined by the sensory dimension of the sensory field so that spatial aliasing of the stimuli on the sampling grid is minimized, and the stimulus profiles are individually Of the sampling grid can be represented by the density of the sampling grid, and smoothly changes to mainly include a spatial frequency that is less than or equal to the highest spatial frequency that is the Nyquist sampling frequency defined by the density of the sampling grid,
A sensor for detecting a response evoked by the stimulus in the subject's sensory area;
And a processor for processing the detected response and associating the detected response with a function of the sensory area of the subject at the selected location.
Applications Claiming Priority (3)
| Application Number | Priority Date | Filing Date | Title |
|---|---|---|---|
| AU2007906174A AU2007906174A0 (en) | 2007-11-09 | Method and apparatus for sensory field assessment | |
| AU2007906174 | 2007-11-09 | ||
| PCT/AU2008/001663 WO2009059380A1 (en) | 2007-11-09 | 2008-11-07 | Method and apparatus for sensory field assessment |
Publications (3)
| Publication Number | Publication Date |
|---|---|
| JP2011502590A JP2011502590A (en) | 2011-01-27 |
| JP2011502590A5 JP2011502590A5 (en) | 2011-12-15 |
| JP5832747B2 true JP5832747B2 (en) | 2015-12-16 |
Family
ID=40625302
Family Applications (1)
| Application Number | Title | Priority Date | Filing Date |
|---|---|---|---|
| JP2010532381A Active JP5832747B2 (en) | 2007-11-09 | 2008-11-07 | Device operating method and device for evaluating sensory cortex function |
Country Status (6)
| Country | Link |
|---|---|
| US (1) | US10064548B2 (en) |
| EP (1) | EP2217133B1 (en) |
| JP (1) | JP5832747B2 (en) |
| AU (1) | AU2008324705B2 (en) |
| CA (1) | CA2704109C (en) |
| WO (1) | WO2009059380A1 (en) |
Families Citing this family (56)
| Publication number | Priority date | Publication date | Assignee | Title |
|---|---|---|---|---|
| US8594445B2 (en) | 2005-11-29 | 2013-11-26 | Adobe Systems Incorporated | Fast bilateral filtering using rectangular regions |
| US8756190B2 (en) * | 2008-03-20 | 2014-06-17 | Ebs Technologies Gmbh | Apparatus and a method for automatic treatment adjustment after nervous system dysfunction |
| US8655097B2 (en) * | 2008-08-22 | 2014-02-18 | Adobe Systems Incorporated | Adaptive bilateral blur brush tool |
| AU2009322076B2 (en) * | 2008-12-05 | 2015-08-20 | Konan Medical Usa Inc | Pupillary assessment method and apparatus |
| PL387923A1 (en) * | 2009-04-30 | 2010-11-08 | Optopol Technology Spółka Akcyjna | Method of examining the field of vision |
| EP2459051B1 (en) | 2009-08-02 | 2022-03-16 | Tel HaShomer Medical Research Infrastructure and Services Ltd. | System and method for objective chromatic perimetry analysis using pupillometer |
| US20110190657A1 (en) * | 2009-08-10 | 2011-08-04 | Carl Zeiss Meditec, Inc. | Glaucoma combinatorial analysis |
| US20110077539A1 (en) * | 2009-09-30 | 2011-03-31 | George Alfred L | Methods and Compositions for Prediction of Risk for Sudden Death in Long QT Syndrome |
| EP2361547B1 (en) * | 2010-02-25 | 2017-04-19 | Oculus Optikgeräte GmbH | Perimetric method |
| JP5462678B2 (en) * | 2010-03-23 | 2014-04-02 | 株式会社日立製作所 | Sheet material drawing machine |
| GB201007697D0 (en) | 2010-05-06 | 2010-06-23 | Ucl Business Plc | A supra-threshold test for use in detecting sensitivity loss across the field of vision |
| US8909327B1 (en) * | 2010-06-23 | 2014-12-09 | Allergan, Inc. | Instrument and method for diagnosing dry eye in a patient |
| WO2012009117A1 (en) * | 2010-06-28 | 2012-01-19 | The Regents Of The University Of California | Methods of suppresing irrelevant stimuli |
| CA2720892A1 (en) | 2010-11-12 | 2012-05-12 | The Regents Of The University Of California | Enhancing cognition in the presence of distraction and/or interruption |
| US8395656B1 (en) | 2011-01-24 | 2013-03-12 | Hewlett-Packard Development Company, L.P. | Methods and apparatus to direct attention in a video content display |
| US8684529B2 (en) * | 2011-04-28 | 2014-04-01 | Carl Zeiss Meditec, Inc. | Systems and methods for improved visual field testing |
| US9357911B2 (en) * | 2011-05-09 | 2016-06-07 | Carl Zeiss Meditec, Inc. | Integration and fusion of data from diagnostic measurements for glaucoma detection and progression analysis |
| US8687840B2 (en) * | 2011-05-10 | 2014-04-01 | Qualcomm Incorporated | Smart backlights to minimize display power consumption based on desktop configurations and user eye gaze |
| JP5999959B2 (en) * | 2012-04-05 | 2016-09-28 | 三菱電機株式会社 | Projection type projector |
| US8864310B2 (en) | 2012-05-01 | 2014-10-21 | RightEye, LLC | Systems and methods for evaluating human eye tracking |
| WO2014078909A1 (en) * | 2012-11-26 | 2014-05-30 | The Australian National University | Clustered volley method and apparatus |
| WO2014126581A1 (en) * | 2013-02-15 | 2014-08-21 | Empire Technology Development Llc | Devices for non-contact thermographic mapping of tissue for viability assessment and methods of their use |
| JP6217445B2 (en) * | 2013-03-07 | 2017-10-25 | 株式会社Jvcケンウッド | Diagnosis support apparatus and diagnosis support method |
| US8885901B1 (en) | 2013-10-22 | 2014-11-11 | Eyenuk, Inc. | Systems and methods for automated enhancement of retinal images |
| WO2015063598A1 (en) | 2013-10-30 | 2015-05-07 | Tel Hashomer Medical Research Infrastructure And Services Ltd. | Pupillometers and systems and methods for using a pupillometer |
| WO2015138963A1 (en) * | 2014-03-14 | 2015-09-17 | Lkc Technologies Inc. | System and method for retinopathy detection |
| RU2573185C2 (en) * | 2014-05-22 | 2016-01-20 | Юрий Владимирович Балабанов | Method of screening diagnostics of glaucoma and device for thereof realisation |
| US10099053B2 (en) * | 2014-07-17 | 2018-10-16 | Elwha Llc | Epidermal electronics to monitor repetitive stress injuries and arthritis |
| US20160015280A1 (en) * | 2014-07-17 | 2016-01-21 | Elwha Llc | Epidermal electronics to monitor repetitive stress injuries and arthritis |
| US10279201B2 (en) * | 2014-07-17 | 2019-05-07 | Elwha Llc | Monitoring and treating pain with epidermal electronics |
| US10279200B2 (en) * | 2014-07-17 | 2019-05-07 | Elwha Llc | Monitoring and treating pain with epidermal electronics |
| US10390755B2 (en) * | 2014-07-17 | 2019-08-27 | Elwha Llc | Monitoring body movement or condition according to motion regimen with conformal electronics |
| US10383550B2 (en) * | 2014-07-17 | 2019-08-20 | Elwha Llc | Monitoring body movement or condition according to motion regimen with conformal electronics |
| JP6518044B2 (en) * | 2014-07-18 | 2019-05-22 | 株式会社トプコン | Visual function inspection device and visual function inspection system |
| KR101648017B1 (en) * | 2015-03-23 | 2016-08-12 | 현대자동차주식회사 | Display apparatus, vehicle and display method |
| US10820824B2 (en) | 2015-05-12 | 2020-11-03 | Diagnosys LLC | Combined stimulator and bipolar electrode assembly for mouse electroretinography (ERG) |
| US11357442B2 (en) | 2015-05-12 | 2022-06-14 | Diagnosys LLC | Combined stimulator and electrode assembly for mouse electroretinography (ERG) |
| WO2017057631A1 (en) * | 2015-10-01 | 2017-04-06 | 株式会社夏目綜合研究所 | Viewer emotion determination apparatus that eliminates influence of brightness, breathing, and pulse, viewer emotion determination system, and program |
| JP6796642B2 (en) * | 2015-11-10 | 2020-12-09 | ダイアグノーシス・エルエルシー | Methods and devices for evaluating electrophysiological signals |
| EP3402388B1 (en) | 2016-01-12 | 2021-02-17 | Accutome, Inc. | System and method for performing objective perimetry and diagnosis of patients with retinitis pigmentosa and other ocular diseases |
| RU2648204C2 (en) * | 2016-04-12 | 2018-03-22 | Общество с ограниченной ответственностью "Рязанские инновационные технологии" | Method of ophthalmological research of the field of vision and of control of the sight fixation |
| RU2648202C2 (en) * | 2016-04-12 | 2018-03-22 | Общество с ограниченной ответственностью "Рязанские инновационные технологии" | Method of ophthalmological research of the field of vision |
| GB201613923D0 (en) * | 2016-08-15 | 2016-09-28 | Ucl Business Plc | Method and apparatus for performing a visual field test |
| US9968251B2 (en) | 2016-09-30 | 2018-05-15 | Carl Zeiss Meditec, Inc. | Combined structure-function guided progression analysis |
| WO2018085598A1 (en) * | 2016-11-02 | 2018-05-11 | Northeastern University | Portable brain and vision diagnostic and therapeutic system |
| US10643741B2 (en) | 2016-11-03 | 2020-05-05 | RightEye, LLC | Systems and methods for a web platform hosting multiple assessments of human visual performance |
| US11471040B2 (en) * | 2017-09-18 | 2022-10-18 | Universität Bern | Method for obtaining a visual field map of an observer |
| US11102462B2 (en) * | 2017-09-27 | 2021-08-24 | University Of Miami | Vision defect determination via a dynamic eye characteristic-based fixation point |
| WO2019178100A1 (en) * | 2018-03-12 | 2019-09-19 | The Schepens Eye Research Institute, Inc. | Predicting result reversals of glaucoma hemifield tests |
| US11497911B2 (en) | 2018-07-18 | 2022-11-15 | Diagnosys LLC | Electrically evoked response (EER) stimulator/amplifier combination |
| KR20220036368A (en) * | 2019-07-31 | 2022-03-22 | 넥스트마인드 에스에이에스 | brain-computer interface |
| WO2021034931A1 (en) * | 2019-08-20 | 2021-02-25 | Biotrillion, Inc. | Systems and methods for evaluating pupillary response |
| CN110420009B (en) * | 2019-08-30 | 2021-09-21 | 北京大学第三医院(北京大学第三临床医学院) | Visual target testing system aiming at different photoreceptor cell dynamic visual stimulation |
| SE2051412A1 (en) * | 2020-12-03 | 2022-06-04 | Heads Stockholm Ab | Device for visual field testing |
| WO2023023226A2 (en) * | 2021-08-18 | 2023-02-23 | Diagnosys LLC | System comprising integrated dichoptic flash and pupillometry monitoring, and method for using the same |
| WO2023168495A1 (en) * | 2022-03-11 | 2023-09-14 | The Australian National University | Response estimation to efficiently capture dynamic response gain changes in multifocal responses |
Family Cites Families (36)
| Publication number | Priority date | Publication date | Assignee | Title |
|---|---|---|---|---|
| GB2031607B (en) * | 1978-09-12 | 1983-05-25 | Crick J | Apparatus for detecting visual field defects of the eye |
| US4493539A (en) * | 1982-06-30 | 1985-01-15 | The United States Of America As Represented By The Secretary Of The Air Force | Method and apparatus for objective determination of visual contrast sensitivity functions |
| US4846567A (en) | 1986-08-06 | 1989-07-11 | Sutter Erich E | Retinal area response mapping using simultaneous multi-area stimulation with binary sequences and objective response analysis |
| US5065767A (en) | 1988-08-26 | 1991-11-19 | The Australian National University | Method for use in diagnosis of glaucoma |
| US5233373A (en) * | 1990-08-17 | 1993-08-03 | Peters Daniel R | System and method for projecting an image (such as an ERG pattern) significantly anterior to the posterior retina |
| US5295495A (en) | 1991-05-13 | 1994-03-22 | The Australian National University | Glaucoma testing from observations of optokinetic nystagmus |
| US5539482A (en) * | 1992-02-28 | 1996-07-23 | The Australian National University | Glaucoma testing using non-linear systems identification techniques |
| US5382987A (en) * | 1992-05-22 | 1995-01-17 | Board Of Regents, The University Of Texas System | Device for ERG spectral perimetry |
| US5295492A (en) * | 1992-10-09 | 1994-03-22 | C. R. Bard, Inc. | Device for connecting a guidewire to an extension guidewire |
| JP3379797B2 (en) * | 1992-11-12 | 2003-02-24 | オリンパス光学工業株式会社 | Image display device |
| ATE159366T1 (en) * | 1993-11-30 | 1997-11-15 | Polaroid Corp | METHOD FOR IMAGE SCALING AND FILTERING USING DISCRETE COSINE TRANSFORMATION |
| AUPM537994A0 (en) | 1994-04-29 | 1994-05-26 | Australian National University, The | Early detection of glaucoma |
| US5565949A (en) * | 1995-07-10 | 1996-10-15 | Kasha, Jr.; John R. | Visual field perimetry on a small computer screen |
| US6001065A (en) * | 1995-08-02 | 1999-12-14 | Ibva Technologies, Inc. | Method and apparatus for measuring and analyzing physiological signals for active or passive control of physical and virtual spaces and the contents therein |
| US6544193B2 (en) * | 1996-09-04 | 2003-04-08 | Marcio Marc Abreu | Noninvasive measurement of chemical substances |
| US6847737B1 (en) * | 1998-03-13 | 2005-01-25 | University Of Houston System | Methods for performing DAF data filtering and padding |
| AUPP266198A0 (en) * | 1998-03-30 | 1998-04-23 | Australian National University, The | Simultaneous binocular assessment of multiple optic nerve and cortical regions in diseases affecting nerve conduction |
| WO1999058046A1 (en) * | 1998-05-08 | 1999-11-18 | The University Of Sydney | Electrophysiological visual field measurement |
| EP1237462A4 (en) * | 1999-12-03 | 2005-05-11 | Iouri Malov | Field testing using spread spectrum technique |
| US7004912B2 (en) * | 1999-12-27 | 2006-02-28 | Neurovision, Inc. | Systems and methods for improving visual perception |
| AUPQ646500A0 (en) * | 2000-03-27 | 2000-04-20 | Australian National University, The | Method and apparatus for assessing neural function by sparse stimuli |
| EP1274339B1 (en) * | 2000-04-17 | 2011-06-08 | The University of Sydney | Method for objective electrophysiological assessment of visual function |
| US6406437B1 (en) * | 2000-10-11 | 2002-06-18 | Yeda Research And Development Co. Ltd. | Method and apparatus for efficient high-resolution visual field mapping |
| US6475162B1 (en) * | 2001-08-07 | 2002-11-05 | Diopsys, Inc. | System and method for vision examination using interrupt signals for synchronizing visual evoked potential sampling rate with visual stimulus |
| US6742894B2 (en) * | 2001-10-01 | 2004-06-01 | Visionrx, Inc. | System and method for full field oscillating stimulus perimeter |
| JP3833969B2 (en) * | 2002-06-05 | 2006-10-18 | 日本電信電話株式会社 | Visual field fluctuation amount measuring device, visual field fluctuation amount measurement program, and recording medium recording the program |
| US6966650B2 (en) * | 2003-06-27 | 2005-11-22 | Zongqi Hu | Method and apparatus for an automated procedure to detect and monitor early-stage glaucoma |
| EP1694206B1 (en) | 2003-11-28 | 2016-04-13 | The Australian National University | Assessment of neural function |
| ZA200608191B (en) * | 2004-04-01 | 2008-07-30 | William C Torch | Biosensors, communicators, and controllers monitoring eye movement and methods for using them |
| JP2008510580A (en) * | 2004-08-24 | 2008-04-10 | ザ マクレーン ホスピタル コーポレーション | Methods for assessing auditory attention and alertness |
| US7486988B2 (en) * | 2004-12-03 | 2009-02-03 | Searete Llc | Method and system for adaptive vision modification |
| EP1858586B1 (en) * | 2005-02-16 | 2016-05-11 | Second Sight Medical Products, Inc. | Fitting of brightness in a visual prosthesis |
| US7474775B2 (en) * | 2005-03-31 | 2009-01-06 | University Of Iowa Research Foundation | Automatic detection of red lesions in digital color fundus photographs |
| US7469159B2 (en) * | 2005-05-26 | 2008-12-23 | The Mcw Research Foundation, Inc. | Method for measuring neurovascular uncoupling in fMRI |
| US7384145B2 (en) * | 2006-02-16 | 2008-06-10 | The Board Of Trustees Of The University Of Illinois | Mapping retinal function using corneal electrode array |
| US7997728B2 (en) * | 2006-05-01 | 2011-08-16 | University Of Southern California | Mapping and diagnosis of macular edema by optical coherence tomography |
-
2008
- 2008-11-07 US US12/741,762 patent/US10064548B2/en active Active
- 2008-11-07 JP JP2010532381A patent/JP5832747B2/en active Active
- 2008-11-07 EP EP08847577.7A patent/EP2217133B1/en active Active
- 2008-11-07 WO PCT/AU2008/001663 patent/WO2009059380A1/en active Application Filing
- 2008-11-07 CA CA2704109A patent/CA2704109C/en active Active
- 2008-11-07 AU AU2008324705A patent/AU2008324705B2/en active Active
Also Published As
| Publication number | Publication date |
|---|---|
| CA2704109A1 (en) | 2009-05-14 |
| US20100249532A1 (en) | 2010-09-30 |
| WO2009059380A1 (en) | 2009-05-14 |
| EP2217133B1 (en) | 2017-12-20 |
| JP2011502590A (en) | 2011-01-27 |
| AU2008324705A1 (en) | 2009-05-14 |
| US10064548B2 (en) | 2018-09-04 |
| AU2008324705B2 (en) | 2014-02-13 |
| EP2217133A4 (en) | 2013-11-27 |
| EP2217133A1 (en) | 2010-08-18 |
| CA2704109C (en) | 2018-09-25 |
Similar Documents
| Publication | Publication Date | Title |
|---|---|---|
| JP5832747B2 (en) | Device operating method and device for evaluating sensory cortex function | |
| CN110801237B (en) | Cognitive ability evaluation system based on eye movement and electroencephalogram characteristics | |
| Hood et al. | ISCEV standard for clinical multifocal electroretinography (mfERG)(2011 edition) | |
| Hood et al. | ISCEV guidelines for clinical multifocal electroretinography (2007 edition) | |
| JP5498375B2 (en) | Visual field inspection system, driving method for visual field inspection apparatus, computer program, information medium or computer readable medium, and processor | |
| CA2701544C (en) | Simultaneously multi-temporal visual test and method and apparatus therefor | |
| US5539482A (en) | Glaucoma testing using non-linear systems identification techniques | |
| JP2005131393A (en) | Device and method for diagnosing ocular symptom which can optically be discriminated | |
| US11642068B2 (en) | Device and method to determine objectively visual memory of images | |
| US10368740B2 (en) | Method and system for noncontact vision-based 3D cognitive fatigue measuring by using task evoked pupillary response | |
| Zeppieri et al. | Frequency doubling technology (FDT) perimetry | |
| Sriram et al. | Reproducibility of multifocal VEP latency using different stimulus presentations | |
| Chisholm et al. | The impact of fixation on the multifocal electroretinogram | |
| Heinrich et al. | Event-related potentials allow for optotype-based objective acuity estimation | |
| CN110664402A (en) | Signal data extraction method and device | |
| Yow et al. | Automatic visual impairment detection system for age-related eye diseases through gaze analysis | |
| US20210298593A1 (en) | Systems, methods, and program products for performing on-off perimetry visual field tests | |
| Waisbourd et al. | Short-duration transient visual evoked potentials and color reflectivity discretization analysis in glaucoma patients and suspects | |
| AU667702B2 (en) | Glaucoma testing using non-linear systems identification techniques | |
| RU2357652C1 (en) | Glaucoma screening-diagnostics method | |
| Lamminpiya et al. | Study of the relationship between eye movements and the geometry of fovea | |
| Ortega Rosero | Characterization of the cerebral visual electrophysiology response of healthy subjects using portable and low-cost electroencephalography | |
| US20200390577A1 (en) | Method and system for detecting voluntary binary responses by analyzing the pupil diameter of a subject | |
| Drasdo | Patterns and contrasts in ophthalmic investigation | |
| Krupin et al. | Update: diagnostic concepts in open-angle glaucoma |
Legal Events
| Date | Code | Title | Description |
|---|---|---|---|
| RD04 | Notification of resignation of power of attorney |
Free format text: JAPANESE INTERMEDIATE CODE: A7424 Effective date: 20110927 |
|
| A521 | Request for written amendment filed |
Free format text: JAPANESE INTERMEDIATE CODE: A523 Effective date: 20111026 |
|
| A621 | Written request for application examination |
Free format text: JAPANESE INTERMEDIATE CODE: A621 Effective date: 20111026 |
|
| A601 | Written request for extension of time |
Free format text: JAPANESE INTERMEDIATE CODE: A601 Effective date: 20140218 |
|
| A602 | Written permission of extension of time |
Free format text: JAPANESE INTERMEDIATE CODE: A602 Effective date: 20140225 |
|
| A601 | Written request for extension of time |
Free format text: JAPANESE INTERMEDIATE CODE: A601 Effective date: 20140318 |
|
| A602 | Written permission of extension of time |
Free format text: JAPANESE INTERMEDIATE CODE: A602 Effective date: 20140326 |
|
| A521 | Request for written amendment filed |
Free format text: JAPANESE INTERMEDIATE CODE: A523 Effective date: 20140421 |
|
| A131 | Notification of reasons for refusal |
Free format text: JAPANESE INTERMEDIATE CODE: A131 Effective date: 20140924 |
|
| A601 | Written request for extension of time |
Free format text: JAPANESE INTERMEDIATE CODE: A601 Effective date: 20141219 |
|
| A601 | Written request for extension of time |
Free format text: JAPANESE INTERMEDIATE CODE: A601 Effective date: 20150119 |
|
| A601 | Written request for extension of time |
Free format text: JAPANESE INTERMEDIATE CODE: A601 Effective date: 20150218 |
|
| A521 | Request for written amendment filed |
Free format text: JAPANESE INTERMEDIATE CODE: A523 Effective date: 20150323 |
|
| A131 | Notification of reasons for refusal |
Free format text: JAPANESE INTERMEDIATE CODE: A131 Effective date: 20150602 |
|
| A521 | Request for written amendment filed |
Free format text: JAPANESE INTERMEDIATE CODE: A523 Effective date: 20150827 |
|
| TRDD | Decision of grant or rejection written | ||
| A01 | Written decision to grant a patent or to grant a registration (utility model) |
Free format text: JAPANESE INTERMEDIATE CODE: A01 Effective date: 20150929 |
|
| A61 | First payment of annual fees (during grant procedure) |
Free format text: JAPANESE INTERMEDIATE CODE: A61 Effective date: 20151028 |
|
| R150 | Certificate of patent or registration of utility model |
Ref document number: 5832747 Country of ref document: JP Free format text: JAPANESE INTERMEDIATE CODE: R150 |
|
| R250 | Receipt of annual fees |
Free format text: JAPANESE INTERMEDIATE CODE: R250 |
|
| S111 | Request for change of ownership or part of ownership |
Free format text: JAPANESE INTERMEDIATE CODE: R313113 |
|
| R350 | Written notification of registration of transfer |
Free format text: JAPANESE INTERMEDIATE CODE: R350 |
|
| R250 | Receipt of annual fees |
Free format text: JAPANESE INTERMEDIATE CODE: R250 |
|
| R250 | Receipt of annual fees |
Free format text: JAPANESE INTERMEDIATE CODE: R250 |
|
| R250 | Receipt of annual fees |
Free format text: JAPANESE INTERMEDIATE CODE: R250 |
|
| R250 | Receipt of annual fees |
Free format text: JAPANESE INTERMEDIATE CODE: R250 |
|
| R250 | Receipt of annual fees |
Free format text: JAPANESE INTERMEDIATE CODE: R250 |