JP4635299B2 - Exposure method - Google Patents
Exposure method Download PDFInfo
- Publication number
- JP4635299B2 JP4635299B2 JP2000180471A JP2000180471A JP4635299B2 JP 4635299 B2 JP4635299 B2 JP 4635299B2 JP 2000180471 A JP2000180471 A JP 2000180471A JP 2000180471 A JP2000180471 A JP 2000180471A JP 4635299 B2 JP4635299 B2 JP 4635299B2
- Authority
- JP
- Japan
- Prior art keywords
- density
- color
- exposure
- target
- image
- Prior art date
- Legal status (The legal status is an assumption and is not a legal conclusion. Google has not performed a legal analysis and makes no representation as to the accuracy of the status listed.)
- Expired - Fee Related
Links
Images


Landscapes
- Control Of Exposure In Printing And Copying (AREA)
Description
【0001】
【発明の属する技術分野】
本発明は、感光材料としての印画紙に焼き付けられ、現像処理液(以下、単に処理液と記載する)によって現像される画像において、用いる印画紙および処理液ごとに階調を滑らかに表現できるように印画紙を露光する露光方法に関するものである。
【0002】
【従来の技術】
従来から、写真処理の分野においては、デジタル露光による画像の焼き付けが一般的に知られている。このデジタル露光は、写真フィルム(例えばネガフィルム)に記録された画像をスキャナ等で読み取って得られる画像データや、デジタルカメラでの撮影によって得られる画像データなどに基づいて露光ヘッドの各画素を駆動し、各画素を介して得られる光を印画紙に照射することにより、上記画像データに応じた画像を印画紙に焼き付ける方式である。
【0003】
ここで、上記デジタル露光を行う写真処理装置の露光部について、本発明の方法が適用される装置の構成図である図3に基づいて簡単に説明する。この種の写真処理装置は、光源7、調光フィルタ8、回転フィルタ9、光ファイバー束10、露光ヘッド11およびレンズアレイ12を備えている。
【0004】
光源7は、例えばハロゲンランプで構成されている。調光フィルタ8は、Y(イエロー)、M(マゼンタ)、C(シアン)の各色フィルタで構成されており、光源7と光ファイバー束10との間の光路中への各色フィルタの挿入量を変えることによって光の調光が行われる。回転フィルタ9は、B(青)、G(緑)、R(赤)の各色フィルタを備えてなり、各色フィルタが順次上記光路中に位置するように回転される。これにより、各色フィルタを介してBGRの各色の光を順次、光ファイバー束10に供給することが可能となる。
【0005】
光ファイバー束10は、入射光を露光ヘッド11の各シャッタ部(後述する)に供給する複数の光ファイバーで構成されている。レンズアレイ12は、露光ヘッド11の各シャッタ部と対応する複数のレンズで構成され、上記各シャッタ部を透過した光を印画紙Pの所定画素に集光させるものである。
【0006】
露光ヘッド11は、例えばPLZT露光ヘッド(以下、単にPLZTと記載する)で構成される。このPLZTは、透明強誘電性セラミックス材料であるPLZT素子を一対の偏光板(偏光子と検光子)の間に配し、各画素ごとに光の透過を制御するためのシャッタ部を例えばライン状に構成したものである。例えば0(黒)から255(白)までの256階調の画像データを、0(白)から65535(黒)までの露光データに変換し、露光データに応じた時間だけ開状態となるように各シャッタ部をON/OFF駆動することにより、光源7からの光のうち露光データに応じた光量の光が各シャッタ部を介して印画紙Pに導かれる。
【0007】
つまり、上記構成においては、光源7から出射された光が調光フィルタ8において調光され、回転フィルタ9の所定の色フィルタを透過して光ファイバー束10に到達する。そして、光ファイバー束10を介して露光ヘッド11の各シャッタ部に供給された光は、当該シャッタ部でのシャッタタイム(シャッタが開状態となる時間)が、画像データに対応する露光データに基づいてBGRごとに調整されることによってその透過光量がBGRごとに調整され、レンズアレイ12を介して印画紙Pに照射される。
【0008】
したがって、露光ヘッド11の各シャッタ部が印画紙Pの搬送方向(以下、副走査方向と記載する)とは垂直方向(以下、主走査方向と記載する)に並ぶように上記露光ヘッド11を配置しておき、印画紙Pを副走査方向に搬送しながら印画紙PをBGRごとに露光することにより、印画紙Pには画像データに応じた2次元のカラー画像を焼き付けることが可能となる。
【0009】
このように印画紙Pに焼き付けられた画像は、その後、写真処理装置の図示しない現像部の現像処理液(以下、単に処理液と記載する)によって現像される。そして、現像済みの印画紙Pは、図示しない乾燥部にて例えば熱風が吹き付けられて乾燥され、その後、プリント画像として機外に排出される。
【0010】
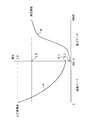
ところで、上記した256階調の画像データの露光データへの変換は、図21に示す目標濃度曲線Aと測定濃度曲線Bとを利用することで行うことができる。目標濃度曲線Aは、ある画像データで露光したプリントはどのような濃度でプリントされるべきなのかを示す曲線であり、従来では、全印画紙Pおよび全処理液の各組み合わせに共通してただ1つだけ設定されている。一方、測定濃度曲線Bは、あるシャッタタイム(露光データ)で露光したときに得られるプリント濃度を示す曲線であり、例えばデイリーセットアップごとに得られるものである。
【0011】
同図のように、目標濃度曲線Aと測定濃度曲線Bとを濃度軸のスケールを共通にとって考えれば、あるプリント濃度を得るための画像データに対応する露光データを求めることができる。一般的には、上記画像データを入力とし、当該画像データに対応する露光データを出力としたものをLUT(ルックアップテーブル)として持つことで、画像データに対応する露光データを最終的に得るようになっている。
【0012】
ただし、目標濃度曲線Aは、上記したように全印画紙Pおよび全処理液の各組み合わせに対して共通のものであり、用いる印画紙Pおよび処理液に固有の測定濃度曲線Bとは最高濃度および最低濃度が異なる場合が多い。例えば、同図の例では、目標濃度曲線Aの最高濃度3.0は、測定濃度曲線Bの最高濃度2.5よりも大きくなっており、目標濃度曲線Aの最低濃度0.7は、測定濃度曲線Bの最低濃度0.3よりも大きくなっている。したがって、このままでは、2.5〜3.0の濃度範囲に対応する画像データを使って濃度変化を出すことはできず、また、0.3〜0.7の濃度範囲を表現することもできなくなる。
【0013】
そこで、従来では、図22に示すように、BGRごとに、目標濃度曲線Aの最高濃度および最低濃度が測定濃度曲線Bの最高濃度および最低濃度に一致するように、目標濃度曲線Aの最高濃度付近および最低濃度付近を、曲線上の任意の点P1 ・P2 から強制的に変形させることにより、上記の問題を解決するようにしている。なお、最高濃度における黒バランスを考慮して変形させる場合には、目標濃度曲線Aの最高濃度と測定濃度曲線Bの最高濃度とが一致しない場合もある。以下、目標濃度曲線Aの上記変形を濃度調整と言うことにする。
【0014】
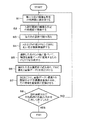
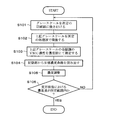
このような濃度調整を行うにあたっての大まかな流れは、例えば図23のフローチャートに示す通りである。なお、説明の理解をしやすくするため、最高濃度における黒バランスを考慮しないものとする。
【0015】
まず、S101では、BGRともに0から255までの画像データを例えば18段階に分け、各画像データに対応する露光データで露光ヘッド11を駆動することにより、所定の印画紙Pに18階調のグレースケールを焼き付ける。なお、各画像データに対応する露光データとしては、予め設定されたものを用いる。そして、S102にて、上記グレースケールを所定の処理液で現像する。
【0016】
続いて、S103では、上記グレースケールの各階調のYMC濃度を濃度計にて測定し、BGRの各露光データとYMCの濃度との関係を示す測定濃度曲線Bを作成する。なお、この測定濃度曲線Bは、18個のデータに基づいて補間演算を行うことにより得ることができる。
【0017】
次に、S104にて、予め記憶部に記憶させておいた目標濃度曲線Aを読み込む。そして、S105にて、目標濃度曲線Aと測定濃度曲線Bとの濃度軸のスケールを合わせ、目標濃度曲線Aの最高濃度および最低濃度が測定濃度曲線Bの最高濃度および最低濃度に一致するように、目標濃度曲線Aの最高濃度付近および最低濃度付近を変形させる。
【0018】
その後、S106にて、所定の画像データにおいて、曲線の変形前後における最高濃度同士の差および最低濃度同士の差が所定範囲であるか否かを判断する。S106にて、各濃度差が所定範囲に収まっていれば処理を終了し、所定範囲に収まっていなければ、S101に戻って再試行する。
【0019】
【発明が解決しようとする課題】
ところで、従来における目標濃度曲線Aは、全印画紙Pおよび全処理液の各組み合わせに共通して設定されているため、用いる印画紙Pおよび処理液によっては、変形前の目標濃度曲線Aと測定濃度曲線Bとにおける最高濃度同士の差および最低濃度同士の差が大きくなる場合がある。この場合、目標濃度曲線Aの変形後においては、図22の破線部C1・C2で示すように、変形点P1 ・P2 での折れ曲がりが顕著になる。特に破線部C2では、曲線の折れ曲がり顕著であることが分かる。その結果、このような目標濃度曲線Aを利用して印画紙Pを露光した場合には、画像データの変化に対して印画紙P上で階調変化を滑らかに表現することができず、画質が損なわれるという問題が生ずる。
【0020】
本発明は、上記の問題点を解決するためになされたもので、その目的は、用いる印画紙および処理液の各組み合わせごとに、階調を滑らかに表現することができ、これによって、焼き付け画像の画質を向上させることができる露光方法を提供することにある。
【0021】
【課題を解決するための手段】
請求項1の発明に係る露光方法は、上記の課題を解決するために、画像データとプリント濃度との関係を示す目標濃度情報と、露光データとプリント濃度との関係を示す測定濃度情報とに基づいて、所望のプリント濃度を得るための画像データに対応する露光データを求め、当該露光データに基づいて感光材料を露光する露光方法であって、特性の異なる複数の感光材料と、感光材料上に焼き付けられた画像を現像するための複数の処理液との各組み合わせに対応する目標濃度情報を記憶部に記憶させる目標濃度記憶工程と、用いる感光材料および処理液の組み合わせに対応する目標濃度情報を上記記憶部から読み出し、上記測定濃度情報における最低濃度から最高濃度までの濃度範囲をほぼ発色できるように、読み出した目標濃度情報を変更し、変更後の目標濃度情報と上記測定濃度情報とに基づいて感光材料を露光する露光工程とを有していることを特徴としている。
【0022】
上記の構成によれば、目標濃度情報が有する画像データとプリント濃度との関係と、測定濃度情報が有する露光データとプリント濃度との関係とから、所望のプリント濃度を得るための画像データに対応する露光データが得られ、この露光データに基づいて感光材料が露光される。
【0023】
上記目標濃度情報は、従来のように複数の感光材料と複数の処理液との各組み合わせに対して共通に設定されているのではなく、上記各組み合わせの個々に対応して設定されており、各目標濃度情報が記憶部に記憶されている。そして、感光材料の露光の際には、用いる感光材料および処理液の組み合わせに対応する目標濃度情報が上記記憶部から読み出され、上記測定濃度情報における最低濃度から最高濃度までの濃度範囲をほぼ発色できるように、読み出された目標濃度情報が変更される。
【0024】
例えば、目標濃度情報の最高濃度が測定濃度情報の最高濃度を上回っている場合には、目標濃度情報の最高濃度が測定濃度情報の最高濃度以下となり、かつ、最高濃度付近において、用いる感光材料および処理液に応じた黒バランスが得られるような濃度となるように目標濃度情報が変更される。また、例えば、目標濃度情報と測定濃度情報とにおける最低濃度同士が一致していない場合には、最低濃度同士が一致するように目標濃度情報が変更される。
【0025】
このような変更により、目標濃度情報における最低濃度から最高濃度までの濃度範囲が、測定濃度情報における最低濃度から最高濃度までの濃度範囲以内に確実に収まるようになる。したがって、変更後の目標濃度情報と上記測定濃度情報とに基づいて感光材料を露光し、感光材料に焼き付けられた画像を上記処理液で現像すれば、感光材料上において、測定濃度情報における最低濃度から最高濃度までの濃度範囲をほぼ発色させることが可能となる。
【0026】
ここで、上記構成では、複数の感光材料と複数の処理液との各組み合わせごとに目標濃度情報を設定しているので、上記各組み合わせごとに、測定濃度情報における最高濃度および最低濃度に近い最高濃度および最低濃度を有する目標濃度情報を得ることができる。つまり、従来では、上記各組み合わせに共通して目標濃度情報を設定していたため、用いる感光材料および処理液の組み合わせによっては、目標濃度情報と測定濃度情報とにおける最高濃度同士の差および最低濃度同士の差が大きくなる場合が生じていたが、上記構成では、各組み合わせごとに目標濃度情報を設定することにより、上記最高濃度同士の差および上記最低濃度同士の差を、各組み合わせごとに小さくすることが可能となる。
【0027】
これにより、目標濃度情報の変更量が従来に比べて小さくなるので、変更後の目標濃度情報において画像データに対応するプリント濃度の変化が急激になることはない。その結果、用いる感光材料および処理液の各組み合わせごとに、階調を滑らかに表現することができ、感光材料に焼き付けられた画像の画質を向上させることができる。
【0028】
請求項2の発明に係る露光方法は、上記の課題を解決するために、請求項1の構成において、上記目標濃度記憶工程は、所定の感光材料に異なる色の画像を焼き付け、上記各色の画像を所定の処理液で現像する第1の工程と、上記各色の画像から無彩色もしくはこれに近い色の画像を複数選択する第2の工程と、選択した画像の明度(輝度)に基づいて、画像の明度を画像データに変換するためのテーブルを作成する第3の工程と、選択した各画像の明度を上記テーブルによって画像データに変換すると共に、選択した各画像のYMC濃度を求め、選択した各画像のYMC濃度と上記画像データとに基づいて上記目標濃度情報を取得し、これを記憶部に記憶させる第4の工程と、上記第1から第4の工程を、全感光材料および全処理液の各組み合わせのそれぞれについて行う第5の工程とを有していることを特徴としている。
【0029】
上記の構成によれば、所定の感光材料に複数色の画像が焼き付けられ、これらの画像が所定の処理液によって現像される。そして、上記各色の画像から無彩色もしくはこれに近い色の画像が複数選択され、選択された画像の明度に基づいて、明度を画像データに変換するためのテーブルが作成される。これにより、選択された各画像を、個々の明度に基づいて画像データに対応付けることが可能となる。
【0030】
選択された各画像の明度が上記テーブルによって画像データに変換される一方で、選択された各画像のYMC濃度が求まると、当該YMC濃度と上記画像データとに基づいて上記目標濃度情報が得られ、これが記憶部に記憶される。以上の工程が感光材料および処理液の各組み合わせごとに行われることにより、上記各組み合わせに対応する目標濃度情報が、各組み合わせごとに上記記憶部に記憶されることになる。
【0031】
ところで、無彩色は、例えば青や赤への色の偏りのない色であり、また、無彩色でなくても、無彩色に近ければ近いほど色の偏りは少ない。したがって、上記のように、無彩色もしくはこれに近い色の画像を選択し、これらの画像をもとにして目標濃度情報を取得することにより、無彩色もしくはこれに近い色の濃度バランスと同じ濃度バランスを持つ目標濃度情報を得ることができる。これにより、上記目標濃度情報を用いて感光材料を露光したときに、全濃度域において色の偏りをなくすことができる。
【0032】
請求項3の発明に係る露光方法は、上記の課題を解決するために、請求項2の構成において、上記第2の工程では、無彩色もしくはこれに近い色であるか否かを色彩計を用いて判断することを特徴としている。
【0033】
無彩色もしくはこれに近い色は、Lab表色系で言えば、aおよびb(色度(色相および彩度))の値が0もしくは0に近い値であるような色と考えることができる。色彩計では、このようなaおよびbの値を直接得ることができるので、色彩計を用いることにより、無彩色もしくはこれに近い色の画像の選択を容易かつ適切に行うことができる。
【0034】
請求項4の発明に係る露光方法は、上記の課題を解決するために、請求項1ないし3のいずれかの構成において、特性の異なる複数の感光材料と複数の処理液との各組み合わせに対応する黒バランスを上記記憶部に記憶させる濃度バランス記憶工程をさらに有し、上記露光工程では、用いる感光材料および処理液に応じた黒バランスを読み出すと共に、上記目標濃度情報の最高濃度が測定濃度情報の最高濃度以下となり、かつ、最高濃度付近において読み出した黒バランスが得られるように、上記目標濃度情報を変更することを特徴としている。
【0035】
上記の構成によれば、最高濃度が測定濃度情報の最高濃度以下となるように目標濃度情報を変更するので、変更後の目標濃度情報における最高濃度が、測定濃度情報における濃度範囲以内に確実に収まることになり、発色できない濃度を目標にして感光材料が露光されることがなくなる。
【0036】
また、感光材料および処理液の各組み合わせに対応する黒バランスも上記記憶部に記憶されており、用いる感光材料および処理液に応じた黒バランスが最高濃度付近で得られるように目標濃度情報を変更するので、変更後の目標濃度情報と測定濃度情報とに基づいて感光材料を露光し、感光材料上に黒画像を形成した際には、当該黒画像を良好な黒で表現することが可能となる。
【0037】
【発明の実施の形態】
本発明の実施の一形態について、図面に基づいて説明すれば以下の通りである。
【0038】
本実施形態に係る写真処理装置は、本発明に係る露光方法を使用できる装置であって、図2に示すように、焼付部1、印画紙格納部2、現像部3、乾燥部4および図示しないPC(Personal Computer )を備えている。
【0039】
印画紙格納部2は、焼付部1に供給する感光材料としての印画紙P(図3参照)を格納するものであり、例えばサイズの互いに異なるロール状の印画紙Pを格納している。そして、出力画像のサイズに応じた印画紙Pが印画紙格納部2から焼付部1に供給される。
【0040】
なお、印画紙Pの焼付部1への搬送経路の途中にカッターを設けておけば、焼付部1にシート状の印画紙Pを供給することもできる。また、印画紙Pの特性は、メーカーや感度によって微妙に異なるものである。
【0041】
焼付部1は、搬送ローラR1・R2、内蔵濃度計(以下、単に濃度計と記載する)5および露光部6を備えている。搬送ローラR1・R2は、印画紙格納部2から供給された印画紙Pを、露光部6を経由して現像部3に送り込むためのものである。なお、同図では、2個の搬送ローラR1・R2を示しているが、この他にも多数の搬送ローラが所定位置に設けられている。濃度計5は、BGRの各波長の光の反射光量に基づいてYMCの各濃度値を算出する計器であり、本装置によって印画紙Pに焼き付けられ、現像された画像の濃度が、この濃度計5にて測定される。露光部6は、印画紙Pを搬送しながら走査露光を行うことにより、印画紙P上に2次元の画像を焼き付けるものであるが、その詳細については後述する。
【0042】
現像部3は、焼付部1にて焼き付け処理の施された印画紙Pを現像処理液(以下、単に処理液と記載する)、漂白定着液等に浸しながら搬送することによって、印画紙Pに焼き付けられた画像を現像するものである。上記処理液の特性はメーカーによって微妙に異なるものである。乾燥部4は、現像部3にて現像された印画紙Pを、例えば熱風の吹き付けにより乾燥させるためのものである。PCは、本写真処理装置の全動作を制御する制御部であり、原画像の画像データを保存する機能や、画像データに対してデータ処理を施す機能等を有している。
【0043】
このように、本実施形態に係る写真処理装置は、PCでの制御により、印画紙Pの露光、現像処理、乾燥処理を一元管理の下に連続して行う構成となっている。よって、使用者に操作上の負担をかけることなしに、多量の写真を連続的にプリントすることが可能となっている。なお、図中のTは、印画紙Pの搬送経路を示している。
【0044】
また、上記写真処理装置は、例えばハードディスクからなる記憶部(図示せず)をさらに備えている。この記憶部には、全印画紙Pおよび全処理液の各組み合わせに対応する、画像データと目標濃度との関係を示す目標濃度曲線(後述する)の情報、および、用いる印画紙P上に人間が目で見て黒と判断できる色を発色するYMCの濃度バランス(後述する)が記憶されるようになっている。
【0045】
本発明は、用いる印画紙Pおよび処理液に応じた目標濃度曲線を用いて印画紙Pの露光を行う点に特徴があるが、この点については後述する。
【0046】
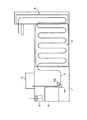
次に、上記の露光部6の構成について説明する。露光部6は、印画紙Pを副走査方向に搬送しながら走査露光を行うものであり、図3に示すように、光源7、調光フィルタ8、回転フィルタ9、光ファイバー束10、露光ヘッド11およびレンズアレイ12を備えている。
【0047】
光源7は、白色光を出射する例えばハロゲンランプで構成されている。調光フィルタ8は、Y(イエロー)、M(マゼンタ)、C(シアン)の各色フィルタで構成されており、光源7と光ファイバー束10との間の光路中への各色フィルタの挿入量を変えることによって光の調光を行うことが可能となっている。
【0048】
上記各フィルタは、図示しない駆動部によって位置制御されるが、上記各フィルタの上記光路に対する挿入量は、駆動部に与えるパルス数に応じて制御される。例えば、上記パルス数が0のときは各フィルタが上記光路から外れた状態となり、上記パルス数が720のときは各フィルタが上記光路に全部入る状態となる。そして、各フィルタは、上記した移動範囲内でパルス数に応じた位置となるように、駆動部によって位置制御される。なお、以下では、パルス数a(aは0から720までの整数)に応じた各フィルタの位置を、単にaの位置あるいは位置aと記載することにする。
【0049】
なお、上記各フィルタは、装置の工場出荷前に記憶部に記憶させるデータ(後述する目標濃度曲線に対応する情報)を取得する際にはその位置が調節されることになるが、上記目標濃度曲線を用いて印画紙Pを露光する際には、露光ヘッド11において漏れ光が生じないような位置、すなわち、露光ヘッド11の各シャッタ部(後述する)を閉状態にしたときに漏れ光が印画紙Pに到達しないような位置に固定される。
【0050】
印画紙Pの露光時における調光フィルタ8の位置設定(漏れ光のない位置の設定)は、例えば毎朝装置を立ち上げる時などにYMCの各フィルタ位置を微調整することによって行われ、デイリーセットアップと呼ばれている。
【0051】
回転フィルタ9は、円形ホイールの中心から放射状に3等分した領域にB(青)、G(緑)、R(赤)の各色フィルタを備えた円盤状のフィルタであり、各色フィルタが順次上記光路中に位置するように上記中心を回転軸として回転される。これにより、各色フィルタを介してBGRの各色の光を順次、光ファイバー束10に供給することが可能となる。
【0052】
光ファイバー束10は、回転フィルタ9を透過した光を露光ヘッド11の各シャッタ部(後述する)に供給する複数の光ファイバーで構成されている。光ファイバー束10により、スポット状に入射する光が上記各シャッタ部に対応する点光源に変換される。
【0053】
露光ヘッド11は、例えばPLZT露光ヘッド(以下、単にPLZTと記載する)で構成される。このPLZTは、透明強誘電性セラミックス材料であるPLZT素子を一対の偏光板(偏光子と検光子)の間に配し、各画素ごとに光の透過およびその阻止を制御するためのシャッタ部を、上記副走査方向とは垂直な主走査方向に1列または2列で千鳥状に構成したものである。なお、上記のPLZT素子とは、ジルコン酸鉛(PbZrO3 )とチタン酸鉛(PbTiO3 )とを適当な比率で固溶体としたもの(PZT)に、ランタンを添加してホットプレスして得られる(Pb1-x Lax )(Zry Ti1-y )1-x/4 O3 系固溶体である。
【0054】
各シャッタ部に所定の電圧を印加し、各シャッタ部に入射する光の偏光状態を変調することにより、PLZT素子の光出射側の偏光板の偏光方向に振動する光のみが各シャッタ部から出射される。このとき、例えば0(黒)から255(白)までの256階調の画像データを、例えばLUTにより0(白)から65535(黒)までの露光データに変換した後、この露光データに応じた時間だけ開状態となるように各シャッタ部をON/OFF駆動することにより、光源7からの光のうち露光データに応じた光量の光が各シャッタ部を介して印画紙Pに導かれる。
【0055】
レンズアレイ12は、露光ヘッド11の各シャッタ部を介して得られる光を印画紙Pの所定画素に集光させるものであり、複数のレンズを露光ヘッド11の各シャッタ部と対応するように主走査方向に1列もしくは2列で千鳥状に配置されて構成されている。上記のレンズは、例えば円筒状のガラスで構成され、中心部で最も屈折率が大きく、周縁部に向けて徐々に屈折率が小さくなるように構成された屈折率分布型のレンズであり、例えば日本板硝子社製のセルフォックレンズ(『セルフォック』は登録商標)で構成される。
【0056】
上記構成により、光源7から出射された光は調光フィルタ8において調光され、回転フィルタ9の所定の色フィルタを透過して光ファイバー束10に到達する。そして、光ファイバー束10を介して露光ヘッド11の各シャッタ部に供給された光は、当該シャッタ部でのシャッタタイム(シャッタを開状態としている時間)が画像データに応じてBGRごとに調整されることによってその透過光量がBGRごとに調整され、レンズアレイ12を介して印画紙Pに到達する。
【0057】
露光ヘッド11の各シャッタ部が主走査方向に形成されているので、印画紙Pを副走査方向に搬送しながら、回転フィルタ9の回転によってBGRの各色ごとに上記主走査方向の露光を行うことにより、印画紙Pには最終的に画像データに応じた2次元のカラー画像が焼き付けられることになる。
【0058】
このようにして焼付部1での露光を終えた印画紙Pは、その後、現像部3に搬送され、印画紙Pに焼き付けられた画像が処理液によって現像される。そして、印画紙Pは乾燥部4において熱風の吹き付けによって乾燥された後、機外に排出される。
【0059】
次に、本発明の露光方法について説明する。上記露光方法は、目標濃度記憶工程と、濃度バランス記憶工程と、露光工程とを有している。以下、まず、目標濃度記憶工程について説明する。
【0060】
(目標濃度記憶工程)
目標濃度記憶工程は、特性の異なる複数の印画紙Pと複数の処理液との各組み合わせに対応する目標濃度曲線を求め、当該目標濃度曲線を目標濃度情報として、装置の工場出荷前に予め記憶部に記憶させておく工程である。上記の目標濃度曲線とは、あるプリント濃度を出すための画像データと当該濃度との関係を示す曲線である。
【0061】
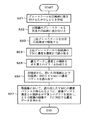
この工程は、図1のフローチャートに示すように、S1〜S8の工程からなっている。なお、この工程では、露光ヘッド11の各シャッタ部は全開状態(最も露光時間が長くなるような状態)に設定されている。
【0062】
まず、S1では、調光フィルタ8の各フィルタ位置を次のように変化させて、様々な色を所定の印画紙Pに焼き付け、S2にて、様々な色の画像を所定の処理液で現像する。
【0063】
調光フィルタ8のYMCのフィルタは、0(完全に光路外)から720(完全に光路中)までの位置に配置されることは上述の通りであるが、本工程では、そのうち、各フィルタ位置を例えば300から20ずつ増加させて600まで変化させ、その都度印画紙Pを露光するようにしている。
【0064】
つまり、例えばYおよびMのフィルタを300の位置に固定しておき、Cのフィルタを300、320、340、・・・600の位置に順に移動させて、その都度印画紙Pを露光する。そして、次に、Yのフィルタはそのままの位置で、Mのフィルタを320の位置に固定しておき、この状態でCのフィルタを上記と同様に300、320、340、・・・600の位置に順に移動させて、その都度印画紙Pを露光する。このような処理を、Mのフィルタが340、360、・・・600の位置においても同様に行う。そして、以上の処理を、Yのフィルタが320、340、・・・600の位置においても同様に行う。
【0065】
結局、上記の例では、上記YMCの各フィルタは、その組み合わせによって16×16×16=4096通りの位置に配置されることになる。各フィルタの位置ごとに各フィルタの光路中への挿入量は異なっているので、S1では、最終的に4096通りの色の画像が印画紙Pに焼き付けられ、S2では、これら4096色の画像が所定の処理液によって現像されることになる。
【0066】
なお、各フィルタの移動範囲(上記の例では300〜600)および移動のさせ方(上記の例では20ずつ)は、上記の例に限定されるわけではない。低濃度部から高濃度部までの画像を複数色形成できるように、各フィルタを移動させればよい。
【0067】
次に、S3にて、現像された印画紙P上の各色を色彩計で読み取り、L(明度)、aおよびb(色度(色相および彩度))の各値を得る。ここで、色彩計について説明すれば以下の通りである。
【0068】
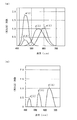
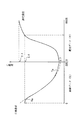
図4(a)は、人間の目に対応する分光感度特性を示している。なお、同図(a)において、x(λ)は主にRの波長域での分光感度特性を、y(λ)はGの波長域での分光感度特性を、z(λ)はBの波長域での分光感度特性をそれぞれ示している。また、縦軸の感度は、Gの波長域での最大感度を1.0とした場合に、他のBやRの波長域での感度を相対的に表している。
【0069】
一方、図4(b)は、濃度計の分光感度特性を示している。なお、同図(b)において、x’(λ)はRの波長域での分光感度特性を、y’(λ)はGの波長域での分光感度特性を、z’(λ)はBの波長域での分光感度特性をそれぞれ示している。また、縦軸の感度は、Rの波長域での最大感度を1.0とした場合に、他のBやGの波長域での感度を相対的に表している。同図(b)では、大きな感度に対応する波長域が同図(a)とは若干ずれていることが分かる。
【0070】
ここで、人間が色を知覚できるのは、BGRの光の3原色に対応した感覚(センサ)が人間の目にはある、つまり、同図(a)に示すようにBGRの各波長域に対応した大きな感度を人間の目が持っている、と考えることができるからである。したがって、人間の目に対応する分光感度とはずれた特性を有する濃度計で色を測定した場合には、人間の目に対応する分光感度の高い波長(BGR)を濃度計が感度よく認識できないために、人間が目で見て判断する結果とは若干異なる結果がYMC濃度として得られることになる。
【0071】
これに対して、色彩計は、図4(a)で示した人間の目に対応する分光感度とほぼ同一の感度を持つ3つのセンサを有しており、試料を測定した際には、BGRに対応した三刺激値を算出し、これらの値からL、a、bの各値を演算して出力するものである。
【0072】
ここで、以下の表1は、印画紙Aに焼き付けられ、処理液Aで現像された黒画像のYMC濃度およびLabの値と、印画紙Bに焼き付けられ、処理液Bで現像された黒画像のYMC濃度およびLabの値とを示している。
【0073】
【表1】
この表を見ても分かるように、印画紙Aおよび処理液Aの組み合わせAと、印画紙Bおよび処理液Bの組み合わせBとでは、YMC濃度はそれぞれほぼ同じような値となっているが、Labの値はばらついている。このことは、濃度計では組み合わせAとBとで色(濃度)の違いを判断できない場合であっても、色彩計では色の違いを確実に判断できることを意味する。したがって、人間の目と同じようなBGR感度を有する色彩計を用いることにより、人間の目とはBGR感度のずれた濃度計では得られない情報(濃度の微妙な違い)を確実に得ることができ、人間の目と同じような感覚で色の判断を適切に行うことができる。
【0075】
なお、S3では色彩計を用いているが、これ以外に例えば分光測色計(分光光度計)を用いることもできる。分光測色計は、複数(例えば40個)のセンサで試料から反射された光を分光し、各波長ごとの反射率を測定するものである。例えば、分光測色計にて得られたデータに基づいて演算部で積分計算を行い、BGRに対応した上記の三刺激値を算出すれば、これらの値から上記のL、a、bの各値を算出することができる。したがって、分光測色計を用いても、人間の目と同じような感覚で色の判断を適切に行うことができる。
【0076】
次に、S4にて、色度(aおよびbの値)が0もしくはこれに近い色を複数個選択する。以下、この理由について説明する。
【0077】
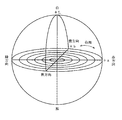
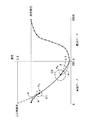
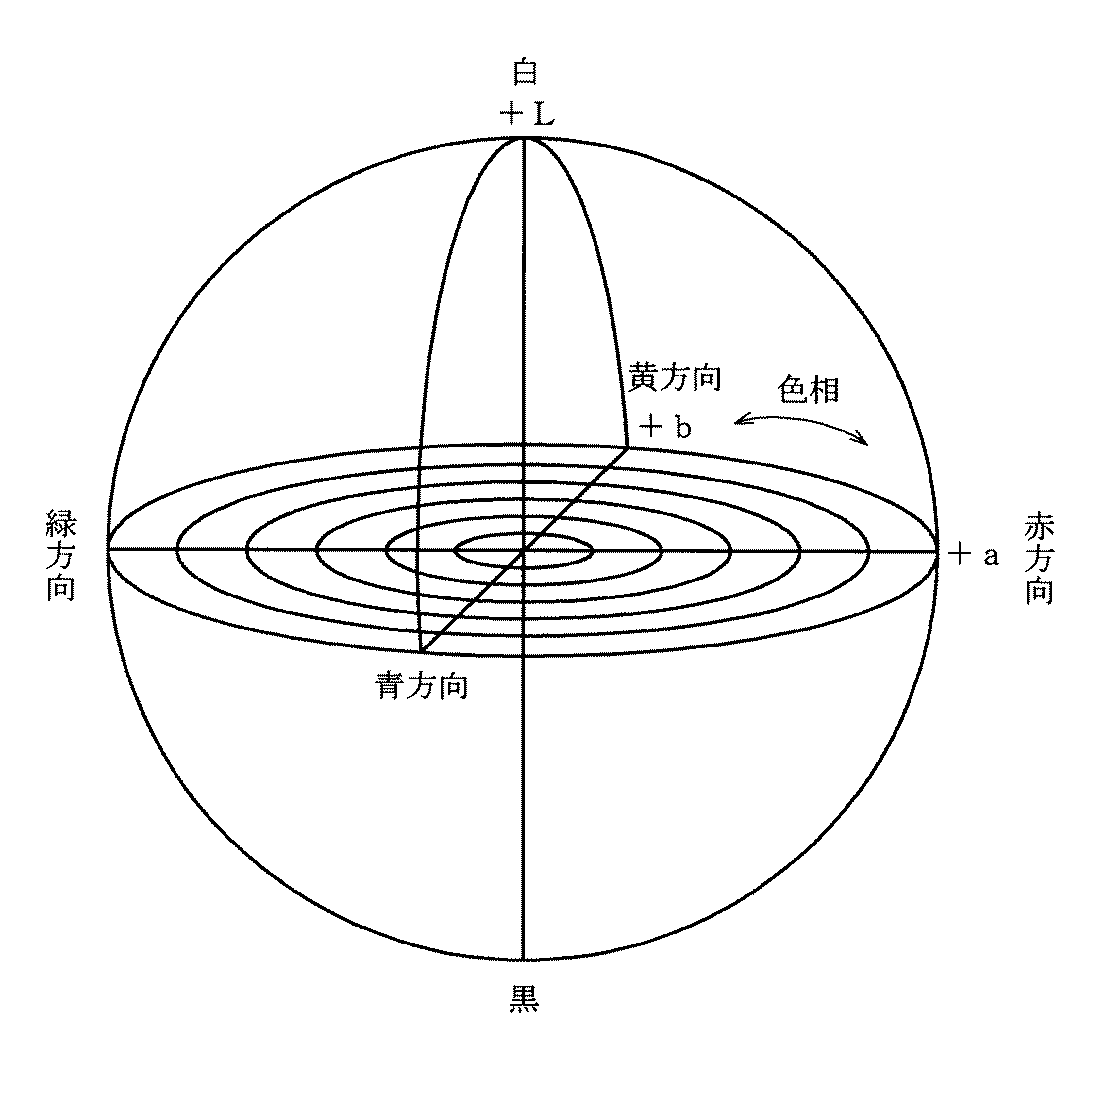
図5は、Lab表色系の色空間立体イメージを示している。同図において、a軸とb軸との交点から+aは赤方向、その反対方向は緑方向、+bは黄方向、その反対方向は青方向をそれぞれ示す。そして、ab平面において、a軸とb軸との交点からの距離が彩度を示し、上記交点を中心とする円の円周方向が色相を示す。また、L軸はab平面とは垂直方向に形成されており、a軸とb軸との交点から+Lは白方向、その反対方向は黒方向をそれぞれ示す。
【0078】
aおよびbの値が0もしくはこれに近い色を選ぶということは、図5の色空間でL軸になるべく近い色、すなわち、無彩色に近い色を選ぶということである。無彩色は、例えば青や赤への色の偏りのない色であり、また、無彩色でなくても、無彩色に近ければ近いほど色の偏りは少ない。したがって、無彩色もしくはこれに近い色のYMC濃度バランスと同じような濃度バランスを持つ目標濃度曲線がBGRごとに得られれば、この目標濃度曲線を用いて印画紙Pを露光したときに全濃度域において色の偏りをなくすことができると考えられる。したがって、このような露光に用いられる目標濃度曲線をS7で求めるようにするため、S4では、所定の印画紙Pに形成された複数色の画像から、aおよびbの値が0もしくはこれに近い色の画像を複数個選択し、次のS5につなげている。
【0079】
また、S3では、aおよびbの値を直接得ることのできる色彩計を用いていることにより、S4での無彩色もしくはこれに近い色の画像の選択を容易かつ適切に行うことができる。
【0080】
なお、S4において、aおよびbの値が完全な0のみではなく、0もしくはこれに近い色を選択するとしたのは、実際には、プリント上でaおよびbがともに完全に0となる色を得ることが難しいからであるが、aおよびbの値が0となる色があれば、勿論その色を優先的に選択するようにすればよい。
【0081】
S4では、aおよびbの最大値を60としたときに、aおよびbとして0±1以下の値を選択時の許容範囲とし、aおよびbがその範囲内にあるような色を選択するようにしている。
【0082】
続いて、S5では、S4にて選択した色のLの値に基づいて、各色の明度(輝度)を画像データに変換するためのLUTを作成する。このLUTは、図6に示すように、S4にて選択した色のうち、最高輝度(白)を画像データ255、最低輝度(黒)を画像データ0とし、その間は輝度と画像データとが線形に近い関係を有する変換テーブルである。このようなLUTを作成することにより、選択された各画像を、個々の明度に基づいて画像データに対応付けることが可能となる。
【0083】
次に、S6では、S4にて選択した色を濃度計5で読み取ってYMCの各濃度値を取得すると共に、選択した色の各濃度値と、S5にて求まる画像データとを対応付ける。
【0084】
例えば、選択したある色について色彩計にて得られたLの値が、図6に示すMであれば、それに対応する画像データはnとなるので、L=M、a≒0、b≒0となる色を濃度計5で測定した場合に得られるYMCの各濃度は、画像データnとそれぞれ対応することになる。
【0085】
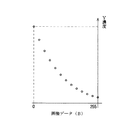
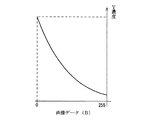
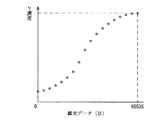
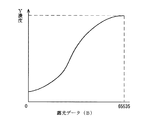
次に、S7では、図7に示すように、横軸にBの画像データを、縦軸にYの濃度値をとり、S6にて得られた画像データと濃度値との関係をプロットした後、各点の間を補間することによって図8に示す目標濃度曲線Aを求める。同様に、横軸にGの画像データを、縦軸にMの濃度を考えたときに得られる目標濃度曲線Aと、横軸にRの画像データを、縦軸にCの濃度を考えたときに得られる目標濃度曲線Aとを求める。このように、B−Y、G−M、R−Cについて曲線を考えているのは、印画紙PにBGRの各光を照射することによってYMCがそれぞれ発色するからである。そして、BGRの各目標濃度曲線の情報(0から255までの画像データと濃度との関係)を記憶部に記憶させる。
【0086】
S7の後は、S8での判断により、全印画紙および全処理液の各組み合わせのそれぞれに対して終了するまで、以上のS1からS7の工程が繰り返し行われる。これにより、上記各組み合わせのそれぞれに対応する目標濃度曲線Aの情報がBGRごとに記憶部に記憶される。
【0087】
ここで、補間により目標濃度曲線Aを求める手法について説明する。
【0088】
画像データをx、プリントを濃度計5で計った濃度値をyとし、yをxの関数として考えると、濃度計5で測定した値はその関数上にあると考えられる。そして、0〜255までの間の全ての画像データに対するプリント濃度を知るためには、測定できた点(図7の例では13個)からデータとして存在しない部分を補間しなければならない。しかし、全ての点を通る1つの近似曲線を求めることは困難なので、それぞれの点と点の間の区間を個別の曲線を使って補間する。しかも、各点の間を補間する曲線が滑らかにつながるようにする。
【0089】
例えば、図9に示すように、隣り合う4点をP1 、P2 、P3 、P4 とすると、P2 −P3 間の曲線が滑らかにつながるようにするためには、P2 −P3 間の曲線が以下の4つの条件を満たさなければならない。
【0090】
▲1▼点P2 を通る。
【0091】
▲2▼点P3 を通る。
【0092】
▲3▼点P2 での傾きが、P1 −P2 間の曲線の点P2 での傾きに一致する。
【0093】
▲4▼点P3 での傾きが、P3 −P4 間の曲線の点P3 での傾きに一致する。
【0094】
点P2 ・P3 での傾きが決まっていると、上記▲1▼〜▲4▼の条件から一意に3次関数の式を求めることができるので、P2 −P3 間の関数は3次関数として扱う。なお、点P2 ・P3 での傾きは、連続する3点から算出する。つまり、点P2 での傾きは、直線P1 P3 の傾きを使い、点P3 での傾きは、直線P2 P4 の傾きを使う。
【0095】
点P2 、P3 の座標を(x2 ,y2 )、(x3 ,y3 )とし、点P2 、P3 での傾きをm2 、m3 とする。求める関数をy=ax3 +bx2 +cx+dとすると、上記▲1▼〜▲4▼の条件より、以下の式が得られる。
【0096】
y2 =ax2 3+bx2 2+cx2 +d
y3 =ax3 3+bx3 2+cx3 +d
m2 =3ax2 2+2bx2 +c
m3 =3ax3 2+2bx3 +c
以上の式をa、b、c、dについて解くと、a、b、c、dは以下のように表される。
【0097】
【0098】
なお、両端(画像データ0および255)での傾きは、端から2つ目の点の傾きに、その点の両隣を結んだ直線の傾きの比をかけたものとする。例えば点P1 が端点の場合、P1 での傾きは、
P1 での傾き=P2 での傾き×(直線P1 P2 の傾き/直線P2 P3 の傾き)とする。
【0099】
なお、BGRのそれぞれについて同じ画像データで印画紙Pを露光しても、印画紙Pの感度等により発色する濃度が互いに異なる。したがって、図8に示す曲線としては、BGRのそれぞれについて異なる特性が得られる。
【0100】
本工程では、色彩計での測定結果に基づいて得られる目標濃度曲線Aの情報を、予め装置の出荷前に記憶部に記憶させているので、出荷する装置に色彩計を載せる必要がなく、装置のコストアップが生じることがない。つまり、装置のコストアップを生じさせることなく、出荷した装置に搭載された濃度計の測定結果のみに基づいて、後述する目標濃度曲線Aの変形を行うことが可能となる。換言すれば、装置に搭載すべき色彩計を濃度計で代用することによりコストダウンを図ることができるとも言える。
【0101】
(濃度バランス記憶工程)
濃度バランス記憶工程は、特性の異なる複数の印画紙Pと複数の処理液との各組み合わせに応じた黒バランス(YMCの濃度バランス)を装置の工場出荷前に予め記憶部に記憶させておく工程であり、図10のフローチャートに示すように、S11〜S17の工程からなっている。なお、この工程では、露光ヘッド11の各シャッタ部は全開状態(最も露光時間が長くなるような状態)に設定されている。
【0102】
まず、S11では、調光フィルタ8の各フィルタ位置を次のように変化させて、様々な色を所定の印画紙Pに焼き付け、S12にて、様々な色の画像を所定の処理液で現像する。
【0103】
S11では、そのうち、各フィルタ位置を例えば500から10ずつ増加させて600まで変化させ、その都度印画紙Pを露光するようにしている。
【0104】
つまり、例えばYおよびMのフィルタを500の位置に固定しておき、Cのフィルタを500、510、520、・・・600の位置に順に移動させて、その都度印画紙Pを露光する。そして、次に、Yのフィルタはそのままの位置で、Mのフィルタを510の位置に固定しておき、この状態でCのフィルタを上記と同様に500、510、520、・・・600の位置に順に移動させて、その都度印画紙Pを露光する。このような処理を、Mのフィルタが520、530、・・・600の位置においても同様に行う。そして、以上の処理を、Yのフィルタが510、520、・・・600の位置においても同様に行う。
【0105】
結局、上記の例では、上記YMCの各フィルタは、その組み合わせによって11×11×11=1331通りの位置に配置されることになる。各フィルタの位置ごとに各フィルタの光路中への挿入量は異なっているので、S11では、最終的に1331通りの色の画像が印画紙Pに焼き付けられ、S12では、これら1331色の画像が所定の処理液によって現像されることになる。
【0106】
なお、これら1331色の画像は、YMCの各フィルタを透過する量が比較的多いBGR光によって形成されるので、比較的高濃度の画像となっている。また、上記では各フィルタ位置を500から600まで変化させているが、この範囲に限定されるわけではなく、印画紙Pに高濃度の画像を複数色形成できるようにYMCの各フィルタを移動させればよい。
【0107】
S12では、S11にて印画紙Pに焼き付けられた様々な色の画像を所定の処理液で現像する。そして、S13にて、現像された印画紙P上の各色を色彩計(または分光測色計(分光光度計))で読み取る。
【0108】
なお、先に説明した目標濃度記憶工程のS1において、本工程のS11でのフィルタ位置を含むように 各フィルタを移動させるようにすれば、本工程では、目標濃度記憶工程でのS3の測定結果をそのまま利用することができる。つまり、その場合は、本工程におけるS11〜S13は省略可能である。
【0109】
次に、S14にて、色度(aおよびbの値)が0もしくはこれに最も近い色を1個選択する。これは、無彩色に近ければ近いほど色の偏りは少なく、無彩色もしくはこれに最も近い色の濃度バランスと同じ濃度バランスが黒画像において得られるようにすれば、当該黒画像における色の偏りをなくすことができると考えられるからである。このような濃度バランスを次のS15にて取得して、後述する露光工程につなげるため、S14では、所定の印画紙Pに形成された複数色の画像から、aおよびbの値が0もしくはこれに最も近い色の画像を選択するようにしている。
【0110】
なお、S14において、aおよびbの値が完全な0ではなく、0もしくはこれに最も近い色を選択するとしたのは、実際には、プリント上でaおよびbがともに完全に0となる色を得ることが難しいからであるが、aおよびbの値が0となる色があれば、勿論その色を選択するようにすればよい。
【0111】
なお、S14では、aおよびbの最大値を60としたときに、aおよびbとして0±1以下の値を選択時の許容範囲とし、aおよびbがその範囲内にあるような色のうち、L軸に最も近い色を1個だけ選択するようにしている。
【0112】
続いて、S15では、S14にて選択した色を濃度計5で読み取ってYMCの各濃度値を取得すると共に、読み取ったYMCの各値からYMCの濃度バランスを取得し、S16にて、これを上記記憶部に記憶させる。
【0113】
例えば、S14にて選択した色のYMCの各濃度値が、それぞれ例えば2.0、2.2、2.3である場合には、Yを基準にして、M=Y+0.2、C=Y+0.3というYMCの濃度バランスを求め、S16にて上記濃度バランスを記憶部に記憶させる。
【0114】
なお、S16では、S15にて得られたYMCの各濃度値をそのまま記憶部に記憶させてもよいが、印画紙の発色特性や処理液の状態が経時的に微妙に変化するので、そのような経時的変化を起こした後でも上記色を再現できるように、上記各濃度値そのものよりも、YMC間での相対的な濃度バランスを記憶部に記憶しておくほうがよい。
【0115】
また、記憶部にYMCの各濃度値を記憶させる構成を採るのであれば、その後、上記各値からYMCの濃度バランスを算出するようにすればよい。とにかく、S14にて選択した色についてのYMCの濃度バランスが最終的に得られるようにすればよい。
【0116】
S16の後は、S17での判断により、全印画紙および全処理液の各組み合わせのそれぞれに対して終了するまで、以上のS11からS16の工程が繰り返し行われる。これにより、上記各組み合わせのそれぞれに対応するYMCの濃度バランスが記憶部に記憶される。
【0117】
この濃度バランス記憶工程では、無彩色もしくはこれに最も近い色であるか否かを、Lab表色系で言うaおよびbの値を直接得ることができる色彩計を用いて判断しているので、無彩色もしくはこれに最も近い色の画像の選択を容易かつ適切に行うことができる。
【0118】
また、色彩計での測定結果に基づいて得られる濃度バランスを、予め装置の出荷前に記憶部に記憶させているので、出荷する装置に色彩計を載せる必要がなく、装置のコストアップが生じることがない。つまり、装置のコストアップを生じさせることなく、出荷した装置に搭載された濃度計の測定結果のみに基づいて、次の目標濃度曲線Aの変形を行うことが可能となる。換言すれば、装置に搭載すべき色彩計を濃度計で代用することによりコストダウンを図ることができるとも言える。
【0119】
(露光工程)
次に、露光工程について説明する。本工程は、工場出荷後の装置において、上記記憶部に記憶された目標濃度曲線Aおよび濃度バランスを用いて露光を行う工程であり、図11に示すS21〜S27の工程からなっている。
【0120】
なお、本工程を行う前には、露光ヘッド11からの漏れ光が印画紙Pに到達するのを防ぐことができるような位置に調光フィルタ8のYMCの各フィルタを配置するデイリーセットアップが行われているものとする。
【0121】
まず、S21にて、256階調の画像データに対応する露光データを求めるためのLUTを作成する。このLUTによって、入力される画像データに対応する露光データが得られることになり、次のS22にて、当該露光データに基づいてグレースケールを印画紙Pに焼き付けることが可能となる。このLUTは、具体的には、以下の手法により作成される。
【0122】
まず、記憶部から、用いる印画紙Pおよび処理液に応じた目標濃度曲線Aの情報をBGRの全てについて読み出す。以下、読み出した各目標濃度曲線Aの情報を第1のグラフと称することにする。なお、上記印画紙Pは、次のS22にてグレースケールを焼き付ける印画紙Pを指し、上記処理液は、その次のS23にてグレースケールの画像を現像するための処理液を指す。
【0123】
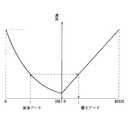
次に、第1のグラフにおける最高濃度および最低濃度が一致し、かつ、これらの間の濃度が露光データと線形な関係を有するようなグラフを作成する。以下、このグラフを第2のグラフと称することにする。図12は、上記第1のグラフ(同図中、左半分のグラフ)および上記第2のグラフ(同図中、右半分のグラフ)を示している。これらのグラフにより、所定の画像データ(例えばi)に対応する露光データ(例えばj)を求めることが可能となる。図12の各グラフから、上記画像データを入力とし、上記画像データに対応する露光データを出力とするLUTが作成される。
【0124】
なお、図12では、横軸としてBを考えている場合には縦軸としてYを、横軸としてGを考えている場合には縦軸としてMを、横軸としてRを考えている場合には縦軸としてCを考える。つまり、図12に示す逆T字の軸を持つグラフは、B−Y、G−M、R−Cについての3通りが得られる。
【0125】
次に、S22にて、例えば18階調のグレースケール(無彩色のみによる18段階のグラデーション)を上記印画紙Pに焼き付ける。より具体的には、BGRのそれぞれについて、0から255までの画像データを例えば18段階に分け、図12のグラフで示されるLUTにより、各階調の画像データに対応する露光データをBGRごとに求める。そして、各露光データでBGRの各露光を行うことにより、グレースケールを印画紙Pに焼き付ける。
【0126】
そして、S23にて、上記グレースケールを上記処理液で現像し、S24にて、上記グレースケールの各階調のYMC濃度を濃度計5にて読み取る。
【0127】
続いて、S25では、横軸に露光データを、縦軸に濃度をとって、各階調における露光データと濃度とをプロットする。このとき、横軸にBの露光データをとったときは縦軸にY濃度をとり、横軸にGの露光データをとったときは縦軸にM濃度をとり、横軸にRの露光データをとったときは縦軸にC濃度をとる。図13は、例えばBの露光データとY濃度とをプロットしたものを示している。そして、各点の間を補間して図14に示すようなグラフをBGRごとに求め、これを上記第2のグラフとしてそれぞれ更新する。なお、補間方法については、図9を用いて説明した目標濃度曲線Aの場合と全く同様である。
【0128】
ここで、図15は、用いる印画紙Pおよび処理液に応じた第1のグラフ(実線A1 )と、全印画紙Pおよび全処理液の各組み合わせに対して共通に設定されている従来の第1のグラフ(破線A2 )と、S25にて更新した後の第2のグラフ(同図中、右半分のグラフ)との関係を示している。同図からも分かるように、第1のグラフと第2のグラフとにおける最高濃度同士の差および最低濃度同士の差は、第1のグラフとして破線A2 を考えた場合よりも実線A1 を考えたほうが確実に小さくなっている。これは、実線A1 が、用いる印画紙Pおよび処理液の組み合わせに応じた発色特性を考慮して設定されることになるからにほかならない。
【0129】
次に、S26にて、上記記憶部から、用いた印画紙Pおよび処理液に対応するYMCの濃度バランスを読み出す。そして、S27にて、最高濃度(黒)の画像において、読み出したYMCの濃度バランスが得られるように、かつ、発色できない濃度を目標にしないように、BGRに対応する各第1のグラフの最高濃度付近および最低濃度付近を変形する。つまり、第1のグラフの最高濃度が第2のグラフの最高濃度以下となり、かつ、最高濃度付近において読み出した黒バランスが得られるように、そして、第1のグラフと第2のグラフとで最低濃度が一致するように、上記第1のグラフを変形する。この変形により、第1のグラフにおける濃度範囲が第2のグラフにおける濃度範囲以内に確実に収まることになる。そして、変形後の第1のグラフと、S25にて求めた第2のグラフとに基づいて、256階調の画像データに対応する露光データを求めるためのLUTをBGRごとに再作成する。
【0130】
以下、上記第1のグラフの変形について詳細に説明する。なお、以下では、例として、B−Yについてのグラフの変形を説明するが、残りのG−M、R−Cについてのグラフの変形についても同様である。
【0131】
まず、BGRの各色について、S25にて求めた第2のグラフから、最大シャッタタイムで露光したときのYMCの各濃度を求める。この結果、上記YMC濃度が、例えば、Y=2.2、M=2.3、C=2.7であったとする。
【0132】
ここで、S26にて記憶部から読み出した、用いた印画紙Pおよび処理液に対応するYMCの濃度バランスが、M=Y+0.2、C=Y+0.3であるとする。この場合、Cを基準にしてYおよびMの最高濃度を考えると、Y=C−0.3=2.4、M=Y+0.2=2.6となり、YおよびMのいずれにおいても、最大シャッタタイムでも発色できない濃度となる(Y=2.2、M=2.3を越えているため)。したがって、このような濃度を出すことは不可能であるので、Cを基準にしてYおよびMの最高濃度を考えることはできない。
【0133】
また、Yを基準にしてMおよびCの最高濃度を考えた場合でも、M=Y+0.2=2.4、C=Y+0.3=2.5となり、Mの濃度が最大シャッタタイムでも発色できない濃度となる(M=2.3を越えているため)。したがって、このような濃度を出すことはやはり不可能であるので、Yを基準にしてMおよびCの最高濃度を考えることはできない。
【0134】
一方、Mを基準にしてYおよびCの最高濃度を考えた場合は、Y=M−0.2=2.1、C=Y+0.3=2.4となり、YおよびCのいずれにおいても、最大シャッタタイムに対応する最高濃度を下回る。したがって、この例では、Mを基準にしてYおよびCの最高濃度を考え、黒画像において、すなわち、画像データ値が0の場合に、Y=2.1、M=2.3、C=2.4を発色できるように、BGRの各第1のグラフの最大濃度付近(画像データ値0付近)を変形する。上記YMC濃度は、発色の目標とされる濃度であることから、以下では、上記YMC濃度のことを目標濃度と呼ぶことにする。
【0135】
次に、第1のグラフの実際の変形の仕方について説明する。
【0136】
上記のようにしてYの目標濃度が決定されると、図16に示すように、画像データ値0における目標濃度となる点aの位置が決定される。そこで、まず、点aに対する一定の濃度範囲bを考慮して、第1のグラフにおける変形点cを決定する。上記濃度範囲bは、オペレータによって自由に設定することができる値であるが、本実施形態では、例えば、点aに対応する濃度(目標濃度)と、変形前の第1のグラフ(同図中、破線のグラフ)における最低濃度との間を100%としたときに、濃度範囲bがその5%に相当するように、変形点cが決定されている。
【0137】
なお、上記の5%は一例であり、この数値に限定されるわけではない。しかし、濃度範囲bをあまり大きくすると、本来の目標濃度からずれる範囲が広くなる。この場合、他の色とのバランスがくずれ、良好な無彩色を発色できなくなるので、そのような点を考慮して濃度範囲bを設定することが必要である。つまり、濃度範囲bとしては、点aに対応する濃度と、変形前の第1のグラフにおける最低濃度との間を100%としたときに、その5%以下の範囲に設定されることが望ましい。
【0138】
このようにして変形点cを求めると、次に、点a−c間が滑らかに結ばれ、かつ、変形前の元の第1のグラフと変形点cにおいて滑らかにつながるように、点a−c間の曲線SB を求める。この曲線SB を求めるための条件は、以下の通りである。
【0139】
▲1▼点aを通る。
【0140】
▲2▼変形点cを通る。
【0141】
▲3▼変形後の第1のグラフの変形点cでの傾きが、変形前の第1のグラフの変
形点cでの傾きと一致する。
【0142】
▲4▼単調に減少(増加)する。
【0143】
このような条件を考えることにより、点a−c間および変形点cをまたぐ区間の画像データに対応する濃度を滑らかに変化させることができ、滑らかな階調変化を出すことが可能となる。上記▲1▼〜▲4▼の条件を満たす関数としては、以下の式で表される関数を用いることができる。
【0144】
【数1】
ただし、ya;点aでの濃度(目標濃度)
yc;変形点cでの濃度
xa;点aでの画像データ値(0)
xc;変形点cでの画像データ値
ma;点aでの傾き
曲線SB が求まれば、元の第1のグラフの点a−c間の部分を、求めた曲線SB と置き換える。
【0146】
一方、低濃度部については、画像データ255に対応するY濃度と、露光データ0に対応するY濃度とが一致すると共に、変形点dにおいて第1のグラフと滑らかにつながるような曲線TB を求め、第1のグラフにおける低濃度部をこの曲線TB に置き換える。これは、印画紙Pを白から滑らかに発色させるようにするためである。この曲線TB を求める際にも、上述した曲線SB の求め方を適用することができる。図16中の左半分の座標軸における実線のグラフは、変形後(高濃度部および低濃度部を曲線SB およびTB に置き換えた後)の第1のグラフを示している。
【0147】
ここで、第1のグラフにおける低濃度部の変形範囲(変形点d以下の濃度範囲)は、点aに対応する濃度と、変形前の第1のグラフにおける最低濃度との差を100%としたときに、例えば15%を想定している。なお、この15%に限定されるわけではないが、低濃度部における変形範囲が広すぎると、本来の目標濃度からずれる範囲が広くなるので、他の色とのバランスがくずれ、良好な無彩色を発色できなくなる。また、中・低濃度部での色の違いは、高濃度部に比べて、人間の目にわかりやすいという問題もある。したがって、このような点を考慮すると、低濃度部における変形範囲は、点aに対応する濃度と、変形前の第1のグラフにおける最低濃度との差を100%としたときに、15%以下であることが望ましい。
【0148】
以上では、主にBについての第1のグラフを変形する場合について説明したが、GやRについての第1のグラフを変形する場合についても同様である。この結果、図17および図18に示すように、GやRについて変形後の第1のグラフ(実線部分)を得ることが可能である。なお、図17は、Gについての第1のグラフ(破線部分)の高濃度部および低濃度部を、曲線SG および曲線TG によって置き換えたものを示し、図18は、Rについての第1のグラフ(破線部分)の高濃度部および低濃度部を、曲線SR および曲線TR によって置き換えたものを示している。曲線SG およびSR は曲線SB と同様に求めることができ、曲線TG およびTR は曲線TB と同様に求めることができる。
【0149】
このようにして変形後の第1のグラフをBGRのそれぞれについて求めると、BGRのそれぞれについて変形後の第1のグラフおよびS25にて求めた第2のグラフ、すなわち、図16ないし図18に示す逆T字状の軸で表される実線のグラフに基づいて、0から255までの256階調の画像データに対応する露光データを求めることができる。
【0150】
最終的には、変形後の第1のグラフおよびS25にて求めた第2のグラフに基づいて、各階調の画像データを入力とし、各階調の画像データに対応する露光データを出力とするLUTがBGRごとに再作成される。図19の左下(第3象限)のグラフは、そのような出力LUTを示している。この出力LUTにおける所定の画像データに対応する露光データf1 は、第2のグラフで上記画像データと対応する露光データf2 と互いに等しいものとなっている。
【0151】
なお、図19において右下(第4象限)のグラフは、露光時のLUTを示している。この露光時のLUTとは、S22にて18階調のグレースケールを印画紙Pに焼き付けるときのみに利用されるものであり、図12の第1のグラフおよび第2のグラフに基づいて得られるものである。すなわち、露光時のLUTは、図12の第1のグラフにおける各階調の画像データを入力とし、各階調の画像データと図12の第2のグラフで対応する露光データを出力とするLUTである。この露光時のLUTを調整することにより、18段階のプロットした点の間隔は変わるが、この曲線の形は大きく変わるわけではない。
【0152】
以上のように、本発明では、複数の印画紙Pと複数の処理液との各組み合わせごとに目標濃度曲線Aを設定することによって、上記各組み合わせごとに、測定濃度曲線Bにおける最高濃度および最低濃度に近い最高濃度および最低濃度をそれぞれ有する目標濃度曲線Aを得ることができる(図15参照)。これにより、目標濃度曲線Aと測定濃度曲線Bとにおける最高濃度同士の差および最低濃度同士の差を、上記各組み合わせに対して共通に目標濃度曲線を持つ従来に比べ、上記各組み合わせごとに小さくすることが可能となる。これにより、目標濃度曲線Aの変形量(最高濃度および最低濃度を変更する量)を従来に比べて確実に小さくすることができ、結果的に、変形点付近の濃度変化を滑らかにすることができる。
【0153】
ここで、図20は、従来の変形後の目標濃度曲線A’と本発明における変形後の目標濃度曲線Aとを示している。なお、図中、破線のグラフは、従来における変形前の目標濃度曲線を示している。目標濃度曲線Aを見れば、破線部C1の変形点P1 および破線部C2の変形点P2 での曲線の折れ曲がりが確実に改善されており、特に変形点P2 ではその効果が顕著に現れている。
【0154】
このように、本発明では、変形後の目標濃度曲線Aにおいて、従来のように変形点での顕著な折れ曲がりがなくなり、変形点付近の濃度変化が滑らかなものとなる。目標濃度曲線Aは、印画紙Pおよび処理液の各組み合わせに対応して設定されているので、このような効果は、用いる印画紙Pおよび処理液の各組み合わせごとに得られることになり、結果的に、上記各組み合わせごとに、印画紙Pに焼き付けられた画像の画質を向上させることが可能となる。
【0155】
また、本発明では、目標濃度曲線Aにおける最低濃度から最高濃度までの濃度範囲が、測定濃度曲線Bにおける最低濃度から最高濃度までの濃度範囲以内に確実に収まるように目標濃度曲線Aを変更(変形)するようにしている。これにより、変更後の目標濃度曲線Aと測定濃度曲線Bとに基づいて印画紙Pを露光し、印画紙Pに焼き付けられた画像を処理液で現像すれば、印画紙P上において、測定濃度曲線Bにおける最低濃度から最高濃度までの濃度範囲をほぼ発色させることが可能となる。
【0156】
このとき、目標濃度曲線Aの最高濃度付近においては、最高濃度が測定濃度曲線Bの最高濃度以下となり、かつ、用いる印画紙Pおよび処理液に応じた黒バランスが得られるように変更されている。これにより、変更後の目標濃度曲線Aと測定濃度曲線Bとに基づいて印画紙Pを露光し、印画紙P上に黒画像を形成した際には、当該黒画像を良好な黒で表現することが可能となる。
【0157】
一方、目標濃度曲線Aの最低濃度付近では、目標濃度曲線Aと測定濃度曲線Bとにおける最低濃度同士が一致するように目標濃度曲線Aが変更されており、印画紙Pを最低輝度から滑らかに発色させることが可能となる。
【0158】
なお、上述した露光工程において、YMCの最高濃度がY=2.2、M=2.3、C=2.7で一応得られた場合でも、M=2.3が最大シャッタタイムでプリントされたものでなかった場合には、M=2.4という濃度を発色できる可能性もある。この場合は、Yを基準として、Y=2.2、M=2.4、C=2.5を発色できるように第1のグラフを変形するようにしてもよい。
【0159】
なお、本実施形態では、露光ヘッド11をPLZT露光ヘッドで構成した場合について説明したが、例えばLCD、LCS、DMD等、時間制御により光量を調節してデジタル露光を行う光変調素子で構成した場合でも、本発明の露光方法を適用することが可能である。
【0160】
なお、無彩色の濃度が特定の色に偏っていると、例えば全体的に青っぽく見える、赤っぽく見える等の問題が発生するが、本実施形態のように、画像データがBGRで同じ値であった場合に、無彩色もしくはこれに最も近い色の濃度バランスでプリントするように装置を調整することにより、そのような色の偏りをなくすことができる。このとき、中・低濃度域については、目標濃度(無彩色)に調整することで対応できるが、印画紙Pおよび処理液の各組み合わせごとに発色限界が異なるので、最高濃度を目標濃度通りに合わせることができない。また、この問題は、黒文字をプリントした時や夜景等の写真をプリントした時に顕著に現れるので、高濃度部(黒)については特に調整を行う必要がある。本発明は、このような高濃度部における黒バランスの調整にも非常に有効となるものである。
【0161】
【発明の効果】
請求項1の発明に係る露光方法は、以上のように、特性の異なる複数の感光材料と、感光材料上に焼き付けられた画像を現像するための複数の処理液との各組み合わせに対応する目標濃度情報を記憶部に記憶させる目標濃度記憶工程と、用いる感光材料および処理液の組み合わせに対応する目標濃度情報を上記記憶部から読み出し、上記測定濃度情報における最低濃度から最高濃度までの濃度範囲をほぼ発色できるように、読み出した目標濃度情報を変更し、変更後の目標濃度情報と上記測定濃度情報とに基づいて感光材料を露光する露光工程とを有している構成である。
【0162】
それゆえ、複数の感光材料と複数の処理液との各組み合わせごとに目標濃度情報を設定しているので、上記各組み合わせごとに、測定濃度情報における最高濃度および最低濃度に近い最高濃度および最低濃度を有する目標濃度情報を得ることができ、上記最高濃度同士の差および上記最低濃度同士の差を、各組み合わせごとに従来よりも小さくすることが可能となる。
【0163】
これにより、目標濃度情報の変更量が従来に比べて小さくなるので、変更後の目標濃度情報において画像データに対応するプリント濃度の変化が急激になることはない。その結果、用いる感光材料および処理液の各組み合わせごとに、階調を滑らかに表現することができ、感光材料に焼き付けられた画像の画質を向上させることができるという効果を奏する。
【0164】
請求項2の発明に係る露光方法は、以上のように、請求項1の構成において、上記目標濃度記憶工程は、所定の感光材料に異なる色の画像を焼き付け、上記各色の画像を所定の処理液で現像する第1の工程と、上記各色の画像から無彩色もしくはこれに近い色の画像を複数選択する第2の工程と、選択した画像の明度(輝度)に基づいて、画像の明度を画像データに変換するためのテーブルを作成する第3の工程と、選択した各画像の明度を上記テーブルによって画像データに変換すると共に、選択した各画像のYMC濃度を求め、選択した各画像のYMC濃度と上記画像データとに基づいて上記目標濃度情報を取得し、これを記憶部に記憶させる第4の工程と、上記第1から第4の工程を、全感光材料および全処理液の各組み合わせのそれぞれについて行う第5の工程とを有している構成である。
【0165】
それゆえ、無彩色は、例えば青や赤への色の偏りのない色であり、また、無彩色でなくても、無彩色に近ければ近いほど色の偏りは少ないので、上記のように、無彩色もしくはこれに近い色の画像を選択し、これらの画像をもとにして目標濃度情報を取得することにより、無彩色もしくはこれに近い色の濃度バランスと同じ濃度バランスを持つ目標濃度情報を得ることができる。これにより、請求項1の構成による効果に加えて、上記目標濃度情報を用いて感光材料を露光したときに、全濃度域において色の偏りをなくすことができるという効果を奏する。
【0166】
請求項3の発明に係る露光方法は、以上のように、請求項2の構成において、上記第2の工程では、無彩色もしくはこれに近い色であるか否かを色彩計を用いて判断する構成である。
【0167】
それゆえ、色彩計では、Lab表色系で言うaおよびb(色度(色相および彩度))の値を直接得ることができるので、このような色彩計を用いることにより、請求項2の構成による効果に加えて、aおよびbの値が0となる無彩色、もしくはこれに近い色の画像の選択を容易かつ適切に行うことができるという効果を奏する。
【0168】
請求項4の発明に係る露光方法は、以上のように、請求項1ないし3のいずれかの構成において、特性の異なる複数の感光材料と複数の処理液との各組み合わせに対応する黒バランスを上記記憶部に記憶させる濃度バランス記憶工程をさらに有し、上記露光工程では、用いる感光材料および処理液に応じた黒バランスを読み出すと共に、上記目標濃度情報の最高濃度が測定濃度情報の最高濃度以下となり、かつ、最高濃度付近において読み出した黒バランスが得られるように、上記目標濃度情報を変更する構成である。
【0169】
それゆえ、変更後の目標濃度情報における最高濃度が、測定濃度情報における濃度範囲以内に確実に収まるようになるので、請求項1ないし3のいずれかの構成による効果に加えて、発色できない濃度を目標にして感光材料が露光されることがなくなるという効果を奏する。
【0170】
また、感光材料および処理液の各組み合わせに対応する黒バランスも上記記憶部に記憶されており、用いる感光材料および処理液に応じた黒バランスが最高濃度付近で得られるように目標濃度情報を変更するので、変更後の目標濃度情報と測定濃度情報とに基づいて感光材料を露光し、感光材料上に黒画像を形成した際には、当該黒画像を良好な黒で表現することが可能となるという効果を併せて奏する。
【図面の簡単な説明】
【図1】本発明に係る露光方法の目標濃度記憶工程における動作の流れを示すフローチャートである。
【図2】上記露光方法が適用される写真処理装置の概略の構成を示す説明図である。
【図3】上記写真処理装置が備える露光部の概略の構成を示す斜視図である。
【図4】(a)は、人間の目に対応する分光感度特性を示すグラフである。(b)は、濃度計の分光感度特性を示すグラフである。
【図5】Lab表色系の色空間の立体的イメージを示す説明図である。
【図6】明度(輝度)を画像データに変換するためのLUTを示す説明図である。
【図7】画像データと濃度値との関係を座標軸上にプロットして示す説明図である。
【図8】上記プロットした各点を補間して得られるグラフである。
【図9】上記補間方法を説明するためのものであり、プロットした2点を滑らかに結ぶ曲線を求める手法を説明するための説明図である。
【図10】本発明に係る露光方法の濃度バランス記憶工程における動作の流れを示すフローチャートである。
【図11】本発明に係る露光方法の露光工程における動作の流れを示すフローチャートである。
【図12】用いる印画紙および処理液に対応する第1のグラフと予め設定されている第2のグラフとを示すグラフである。
【図13】18段階のBGRの画像データに対応する露光データに基づいてグレースケールを印画紙に焼き付けた後、各階調のYMC濃度を測定したときの、Bの露光データとY濃度との関係を座標軸上にプロットして示す説明図である。
【図14】上記プロットした各点を補間して得られるグラフである。
【図15】用いる印画紙および処理液に応じた第1のグラフと、全印画紙および全処理液の各組み合わせに対して共通に設定されている従来の第1のグラフとの違いを説明するための説明図である。
【図16】Bの画像データおよび露光データとY濃度との関係を示す第1のグラフの変形前後の形状を示す説明図である。
【図17】Gの画像データおよび露光データとM濃度との関係を示す第1のグラフの変形前後の形状を示す説明図である。
【図18】Rの画像データおよび露光データとC濃度との関係を示す第1のグラフの変形前後の形状を示す説明図である。
【図19】変形前後における第1のグラフと、更新した第2のグラフと、変形後の第1のグラフと上記第2のグラフとに基づいて得られる出力LUTと、グレースケールを印画紙に焼き付ける際に利用される露光時のLUTとを示す説明図である。
【図20】本発明および従来における変形後の第1のグラフの形状の違いを説明するための説明図である。
【図21】印画紙および処理液の各組み合わせに対して共通して設定されている従来の目標濃度曲線と、測定濃度曲線とを示す説明図である。
【図22】変形後の上記目標濃度曲線を示す説明図である。
【図23】従来の濃度調整を行う際の動作の流れを示すフローチャートである。
【符号の説明】
6 露光部
A 目標濃度曲線(目標濃度情報)
B 測定濃度曲線(測定濃度情報)
P 印画紙(感光材料)[0001]
BACKGROUND OF THE INVENTION
In the present invention, gradation can be smoothly expressed for each photographic paper and processing liquid used in an image which is printed on a photographic paper as a photosensitive material and developed with a developing processing solution (hereinafter simply referred to as a processing solution). The present invention relates to an exposure method for exposing photographic paper.
[0002]
[Prior art]
Conventionally, image printing by digital exposure is generally known in the field of photographic processing. In this digital exposure, each pixel of the exposure head is driven based on image data obtained by reading an image recorded on a photographic film (eg, a negative film) with a scanner or image data obtained by photographing with a digital camera. In this method, an image corresponding to the image data is printed on the photographic paper by irradiating the photographic paper with light obtained through each pixel.
[0003]
Here, the exposure unit of the photographic processing apparatus that performs the above digital exposure will be briefly described with reference to FIG. 3 which is a configuration diagram of the apparatus to which the method of the present invention is applied. This type of photographic processing apparatus includes a
[0004]
The
[0005]
The
[0006]
The
[0007]
That is, in the above configuration, the light emitted from the
[0008]
Therefore, the
[0009]
The image thus baked on the photographic paper P is then developed with a developing processing solution (hereinafter simply referred to as processing solution) in a developing unit (not shown) of the photographic processing apparatus. The developed photographic paper P is dried by blowing, for example, hot air in a drying unit (not shown), and then discharged to the outside as a print image.
[0010]
By the way, the above-described conversion of the 256 gradation image data into the exposure data can be performed by using the target density curve A and the measured density curve B shown in FIG. The target density curve A is a curve that indicates what density should be printed for a print exposed with certain image data. Conventionally, the target density curve A is common to all combinations of all photographic paper P and all processing solutions. Only one is set. On the other hand, the measured density curve B is a curve indicating the print density obtained when exposure is performed with a certain shutter time (exposure data), and is obtained for each daily setup, for example.
[0011]
As shown in the figure, if the target density curve A and the measured density curve B are considered with a common density axis scale, exposure data corresponding to image data for obtaining a certain print density can be obtained. In general, the above-described image data is input, and exposure data corresponding to the image data is output as an LUT (Look Up Table) so that the exposure data corresponding to the image data is finally obtained. It has become.
[0012]
However, the target density curve A is common to each combination of all the photographic papers P and all the processing liquids as described above, and the maximum density is the measured density curve B unique to the photographic paper P and the processing liquid to be used. And the minimum concentration is often different. For example, in the example of the figure, the maximum density 3.0 of the target density curve A is larger than the maximum density 2.5 of the measured density curve B, and the minimum density 0.7 of the target density curve A is measured. It is larger than the minimum density 0.3 of the density curve B. Therefore, with this state, it is impossible to change the density using image data corresponding to the density range of 2.5 to 3.0, and it is also possible to express the density range of 0.3 to 0.7. Disappear.
[0013]
Therefore, conventionally, as shown in FIG. 22, for each BGR, the highest density of the target density curve A so that the highest density and the lowest density of the target density curve A coincide with the highest density and the lowest density of the measured density curve B. An arbitrary point P on the curve near and near the lowest concentration1・ P2The above-mentioned problem is solved by forcibly deforming from the above. When the deformation is performed in consideration of the black balance at the highest density, the highest density of the target density curve A may not match the highest density of the measured density curve B. Hereinafter, the deformation of the target density curve A is referred to as density adjustment.
[0014]
A rough flow for performing such density adjustment is, for example, as shown in the flowchart of FIG. In order to facilitate understanding of the explanation, the black balance at the highest density is not considered.
[0015]
First, in S101, image data from 0 to 255 for both BGR is divided into, for example, 18 levels, and the
[0016]
Subsequently, in S103, the YMC density of each gray scale gradation is measured with a densitometer, and a measured density curve B indicating the relationship between each BGR exposure data and the YMC density is created. The measured density curve B can be obtained by performing an interpolation calculation based on 18 pieces of data.
[0017]
Next, in S104, the target density curve A previously stored in the storage unit is read. In S105, the scales of the density axes of the target density curve A and the measured density curve B are matched so that the highest density and the lowest density of the target density curve A coincide with the highest density and the lowest density of the measured density curve B. Then, the vicinity of the maximum density and the vicinity of the minimum density of the target density curve A are deformed.
[0018]
Thereafter, in S106, it is determined whether or not the difference between the highest densities before and after the curve deformation and the difference between the lowest densities are within a predetermined range in the predetermined image data. In S106, if each density difference is within the predetermined range, the process is terminated. If not within the predetermined range, the process returns to S101 and is retried.
[0019]
[Problems to be solved by the invention]
By the way, the conventional target density curve A is set in common for each combination of all the photographic paper P and all the processing liquids. Therefore, depending on the photographic paper P and the processing liquid to be used, the target density curve A before the deformation and the measurement are measured. The difference between the highest densities and the difference between the lowest densities in the density curve B may increase. In this case, after the deformation of the target density curve A, as shown by broken line portions C1 and C2 in FIG.1・ P2The bend at the corner becomes prominent. In particular, at the broken line portion C2, it can be seen that the bending of the curve is remarkable. As a result, when the photographic paper P is exposed using such a target density curve A, the gradation change cannot be smoothly expressed on the photographic paper P with respect to the change of the image data. The problem arises that damage is lost.
[0020]
The present invention has been made to solve the above-described problems, and an object of the present invention is to smoothly express gradation for each combination of photographic paper and processing liquid to be used. It is an object of the present invention to provide an exposure method capable of improving the image quality.
[0021]
[Means for Solving the Problems]
In order to solve the above-described problem, the exposure method according to the first aspect of the present invention includes target density information indicating a relationship between image data and print density, and measured density information indicating a relationship between exposure data and print density. An exposure method for obtaining exposure data corresponding to image data for obtaining a desired print density and exposing a photosensitive material based on the exposure data, wherein a plurality of photosensitive materials having different characteristics, and on the photosensitive material A target density storage step for storing target density information corresponding to each combination with a plurality of processing liquids for developing an image printed on the storage unit, and target density information corresponding to a combination of photosensitive material and processing liquid to be used Is read from the storage unit, and the read target density information is changed so that the density range from the lowest density to the highest density in the measured density information can be substantially developed. And it is characterized in that it has an exposure step of exposing the photosensitive material on the basis of the target density information and the measured density information after the change.
[0022]
According to the above configuration, the image data for obtaining a desired print density can be obtained from the relationship between the image data included in the target density information and the print density and the relationship between the exposure data included in the measured density information and the print density. Exposure data is obtained, and the photosensitive material is exposed based on the exposure data.
[0023]
The target density information is not set in common for each combination of a plurality of photosensitive materials and a plurality of processing solutions as in the prior art, but is set for each of the combinations. Each target density information is stored in the storage unit. When the photosensitive material is exposed, target density information corresponding to the combination of photosensitive material and processing solution to be used is read from the storage unit, and the density range from the lowest density to the highest density in the measured density information is almost equal. The read target density information is changed so that the color can be developed.
[0024]
For example, when the maximum density of the target density information is higher than the maximum density of the measured density information, the maximum density of the target density information is less than or equal to the maximum density of the measured density information, and the photosensitive material used near the maximum density and The target density information is changed so that the density is such that a black balance corresponding to the processing liquid is obtained. For example, when the minimum densities in the target density information and the measured density information do not match, the target density information is changed so that the minimum densities match.
[0025]
Such a change ensures that the density range from the lowest density to the highest density in the target density information falls within the density range from the lowest density to the highest density in the measured density information. Therefore, if the photosensitive material is exposed based on the changed target density information and the measured density information, and the image printed on the photosensitive material is developed with the processing solution, the minimum density in the measured density information on the photosensitive material. The density range from the maximum density to the maximum density can be almost developed.
[0026]
Here, in the above configuration, since target density information is set for each combination of a plurality of photosensitive materials and a plurality of processing solutions, the maximum density close to the maximum density and the minimum density in the measured density information is set for each combination. Target density information having a density and a minimum density can be obtained. That is, conventionally, since the target density information is set in common for each of the above combinations, depending on the combination of the photosensitive material and the processing solution to be used, the difference between the highest density and the lowest density between the target density information and the measured density information. However, in the above configuration, by setting target density information for each combination, the difference between the highest densities and the difference between the lowest densities are reduced for each combination. It becomes possible.
[0027]
As a result, the amount of change in the target density information is smaller than in the conventional case, so that the change in the print density corresponding to the image data in the changed target density information does not become rapid. As a result, the gradation can be expressed smoothly for each combination of the photosensitive material and processing solution used, and the image quality of the image printed on the photosensitive material can be improved.
[0028]
According to a second aspect of the present invention, there is provided an exposure method according to the first aspect of the present invention, wherein the target density storage step is configured to print an image of a different color on a predetermined photosensitive material, and the image of each color. Based on the first step of developing with a predetermined processing liquid, the second step of selecting a plurality of images of achromatic colors or similar colors from the images of the respective colors, and the brightness (luminance) of the selected image, A third step of creating a table for converting the brightness of the image into image data, and converting the brightness of each selected image into image data using the above table, obtaining the YMC density of each selected image, and selecting it The fourth step of acquiring the target density information based on the YMC density of each image and the image data and storing the target density information in the storage unit, and the first to fourth steps are performed for all photosensitive materials and all processes. Each pair of liquid It is characterized by having a fifth step of performing for each of the mating.
[0029]
According to the above configuration, images of a plurality of colors are printed on a predetermined photosensitive material, and these images are developed with a predetermined processing solution. Then, a plurality of achromatic or near-color images are selected from the images of the respective colors, and a table for converting the lightness into image data is created based on the lightness of the selected image. Thereby, each selected image can be associated with the image data based on the individual brightness.
[0030]
While the brightness of each selected image is converted into image data by the table, when the YMC density of each selected image is obtained, the target density information is obtained based on the YMC density and the image data. This is stored in the storage unit. By performing the above steps for each combination of photosensitive material and processing solution, target density information corresponding to each combination is stored in the storage unit for each combination.
[0031]
By the way, an achromatic color is, for example, a color with no color bias to blue or red, and even if it is not an achromatic color, the closer the color is to an achromatic color, the less the color bias. Therefore, as described above, an achromatic color or a color close to it is selected, and the target density information is obtained based on these images, thereby obtaining the same density as the density balance of the achromatic color or a color close thereto. Balanced target density information can be obtained. Thus, when the photosensitive material is exposed using the target density information, it is possible to eliminate color deviation in the entire density range.
[0032]
In order to solve the above problems, an exposure method according to a third aspect of the present invention is the configuration of the second aspect, wherein in the second step, a colorimeter is used to determine whether the color is an achromatic color or a color close thereto. It is characterized by using and judging.
[0033]
An achromatic color or a color close to this can be considered as a color in which the values of a and b (chromaticity (hue and saturation)) are 0 or close to 0 in the Lab color system. Since the colorimeter can directly obtain the values of a and b, the use of the colorimeter makes it possible to easily and appropriately select an image of an achromatic color or a color close thereto.
[0034]
In order to solve the above problems, an exposure method according to a fourth aspect of the invention corresponds to each combination of a plurality of photosensitive materials and a plurality of processing solutions having different characteristics in any one of the first to third aspects. A density balance storage step for storing the black balance to be stored in the storage unit. In the exposure step, the black balance corresponding to the photosensitive material and processing solution to be used is read, and the maximum density of the target density information is measured density information. The target density information is changed so that the black balance read out in the vicinity of the maximum density can be obtained.
[0035]
According to the above configuration, the target density information is changed so that the maximum density is equal to or lower than the maximum density of the measured density information, so that the maximum density in the changed target density information is surely within the density range in the measured density information. As a result, the photosensitive material is not exposed to a density that cannot be developed.
[0036]
The black balance corresponding to each combination of photosensitive material and processing solution is also stored in the storage unit, and the target density information is changed so that the black balance corresponding to the photosensitive material and processing solution used is obtained near the maximum density. Therefore, when the photosensitive material is exposed based on the changed target density information and measured density information and a black image is formed on the photosensitive material, the black image can be expressed in good black. Become.
[0037]
DETAILED DESCRIPTION OF THE INVENTION
An embodiment of the present invention will be described below with reference to the drawings.
[0038]
The photographic processing apparatus according to the present embodiment is an apparatus that can use the exposure method according to the present invention. As shown in FIG. 2, the
[0039]
The photographic
[0040]
In addition, if a cutter is provided in the middle of the conveyance path of the printing paper P to the
[0041]
The
[0042]
The developing unit 3 conveys the photographic paper P subjected to the baking process in the
[0043]
As described above, the photographic processing apparatus according to the present embodiment has a configuration in which exposure, development processing, and drying processing of the photographic paper P are continuously performed under centralized control under the control of the PC. Therefore, it is possible to print a large number of photographs continuously without imposing an operation burden on the user. Note that T in the figure indicates the conveyance path of the photographic paper P.
[0044]
The photographic processing apparatus further includes a storage unit (not shown) composed of, for example, a hard disk. This storage unit stores information on a target density curve (described later) indicating the relationship between image data and target density corresponding to each combination of all photographic papers P and all processing liquids, and humans on the photographic paper P to be used. The YMC density balance (to be described later) that develops a color that can be visually judged as black is stored.
[0045]
The present invention is characterized in that the printing paper P is exposed using a target density curve corresponding to the printing paper P to be used and the processing liquid, which will be described later.
[0046]
Next, the configuration of the
[0047]
The
[0048]
The position of each filter is controlled by a drive unit (not shown), but the amount of each filter inserted into the optical path is controlled according to the number of pulses applied to the drive unit. For example, when the number of pulses is 0, each filter is out of the optical path, and when the number of pulses is 720, all the filters are in the optical path. And each filter is position-controlled by the drive part so that it may become a position according to the number of pulses within the above-mentioned movement range. In the following, the position of each filter corresponding to the number of pulses a (a is an integer from 0 to 720) will be simply referred to as a position or position a.
[0049]
The position of each of the filters is adjusted when acquiring data (information corresponding to a target density curve described later) to be stored in the storage unit before shipment of the apparatus from the factory. When exposing the photographic paper P using a curve, the leakage light is generated when the
[0050]
The position setting of the dimming filter 8 at the time of exposure of the photographic paper P (setting of the position without leaking light) is performed by finely adjusting the position of each YMC filter, for example, when starting up the apparatus every morning. is called.
[0051]
The
[0052]
The
[0053]
The
[0054]
By applying a predetermined voltage to each shutter unit and modulating the polarization state of the light incident on each shutter unit, only light that vibrates in the polarization direction of the polarizing plate on the light output side of the PLZT element is emitted from each shutter unit. Is done. At this time, for example, image data of 256 gradations from 0 (black) to 255 (white) is converted into exposure data from 0 (white) to 65535 (black) by, for example, LUT, and the data corresponding to the exposure data By driving each shutter unit ON / OFF so as to be in the open state only for a certain period of time, light of the light amount corresponding to the exposure data out of the light from the
[0055]
The
[0056]
With the above configuration, the light emitted from the
[0057]
Since each shutter portion of the
[0058]
The photographic paper P that has been exposed in the
[0059]
Next, the exposure method of the present invention will be described. The exposure method includes a target density storage process, a density balance storage process, and an exposure process. Hereinafter, first, the target density storage step will be described.
[0060]
(Target concentration storage process)
In the target density storage step, a target density curve corresponding to each combination of a plurality of photographic papers P having different characteristics and a plurality of processing liquids is obtained, and the target density curve is stored in advance as the target density information before shipping the apparatus to the factory. This is a process of storing in the section. The target density curve is a curve indicating the relationship between image data for producing a certain print density and the density.
[0061]
As shown in the flowchart of FIG. 1, this process includes steps S1 to S8. In this step, each shutter portion of the
[0062]
First, in S1, each filter position of the light control filter 8 is changed as follows, and various colors are printed on a predetermined printing paper P. In S2, images of various colors are developed with a predetermined processing liquid. To do.
[0063]
As described above, the YMC filter of the dimming filter 8 is disposed at a position from 0 (completely outside the optical path) to 720 (completely in the optical path). Is increased from 300, for example, by 20 to 600, and the printing paper P is exposed each time.
[0064]
That is, for example, the Y and M filters are fixed at the position 300, and the C filter is sequentially moved to the positions 300, 320, 340,... 600, and the photographic paper P is exposed each time. Then, the Y filter is kept at the same position, and the M filter is fixed at the position 320. In this state, the C filter is located at positions 300, 320, 340,. The printing paper P is exposed each time. Such processing is similarly performed at the positions where the M filters are located at 340, 360,. The above processing is similarly performed even when the Y filter has positions 320, 340,.
[0065]
Eventually, in the above example, the YMC filters are arranged at 16 × 16 × 16 = 4096 positions depending on the combination. Since the amount of insertion of each filter into the optical path differs depending on the position of each filter, 4096 color images are finally printed on the photographic paper P in S1, and these 4096 color images are printed in S2. It is developed with a predetermined processing solution.
[0066]
Note that the moving range of each filter (300 to 600 in the above example) and how to move (20 in the above example) are not limited to the above example. Each filter may be moved so that a plurality of colors from the low density portion to the high density portion can be formed.
[0067]
Next, in S3, each color on the developed photographic paper P is read with a colorimeter, and each value of L (lightness), a, and b (chromaticity (hue and saturation)) is obtained. Here, the color meter will be described as follows.
[0068]
FIG. 4A shows spectral sensitivity characteristics corresponding to human eyes. In FIG. 4A, x (λ) is mainly a spectral sensitivity characteristic in the R wavelength region, y (λ) is a spectral sensitivity property in the G wavelength region, and z (λ) is B's. The spectral sensitivity characteristics in the wavelength region are shown. The sensitivity on the vertical axis relatively represents the sensitivity in other B and R wavelength ranges when the maximum sensitivity in the G wavelength range is set to 1.0.
[0069]
On the other hand, FIG. 4B shows the spectral sensitivity characteristics of the densitometer. In FIG. 4B, x ′ (λ) is the spectral sensitivity characteristic in the R wavelength range, y ′ (λ) is the spectral sensitivity characteristic in the G wavelength range, and z ′ (λ) is B The spectral sensitivity characteristics in the wavelength region are respectively shown. Further, the sensitivity on the vertical axis relatively represents the sensitivity in the other B and G wavelength ranges when the maximum sensitivity in the R wavelength range is 1.0. In FIG. 6B, it can be seen that the wavelength range corresponding to the large sensitivity is slightly different from that in FIG.
[0070]
Here, human beings can perceive colors because human eyes have senses (sensors) corresponding to the three primary colors of BGR light, that is, in each wavelength region of BGR as shown in FIG. This is because it can be considered that the human eye has a corresponding large sensitivity. Therefore, when the color is measured with a densitometer having a characteristic deviating from the spectral sensitivity corresponding to the human eye, the densitometer cannot recognize the wavelength (BGR) having a high spectral sensitivity corresponding to the human eye with high sensitivity. In addition, a result slightly different from the result visually judged by humans is obtained as the YMC concentration.
[0071]
On the other hand, the colorimeter has three sensors having almost the same sensitivity as the spectral sensitivity corresponding to the human eye shown in FIG. 4 (a). The tristimulus values corresponding to are calculated, and the values of L, a, and b are calculated from these values and output.
[0072]
Here, Table 1 below shows the YMC density and Lab values of the black image that was printed on the photographic paper A and developed with the processing liquid A, and the black image that was baked on the photographic paper B and developed with the processing liquid B. YMC concentration and Lab value.
[0073]
[Table 1]
As can be seen from this table, the YMC concentration in the combination A of the photographic paper A and the processing liquid A and the combination B of the photographic paper B and the processing liquid B are almost the same values. The value of Lab varies. This means that even if the density meter cannot determine the difference in color (density) between the combinations A and B, the color meter can reliably determine the difference in color. Therefore, by using a color meter having a BGR sensitivity similar to that of the human eye, it is possible to reliably obtain information (subtle difference in density) that cannot be obtained with a densitometer whose BGR sensitivity is different from that of the human eye. The color can be appropriately judged with the same feeling as the human eye.
[0075]
In S3, a colorimeter is used, but other than this, for example, a spectrocolorimeter (spectrophotometer) can also be used. The spectrocolorimeter measures light reflected from a sample by a plurality of (for example, 40) sensors and measures the reflectance for each wavelength. For example, if the calculation unit performs integration calculation based on the data obtained by the spectrocolorimeter and calculates the above tristimulus values corresponding to BGR, each of the above L, a, and b is calculated from these values. A value can be calculated. Therefore, even if a spectrocolorimeter is used, it is possible to appropriately determine the color with the same feeling as the human eye.
[0076]
Next, in S4, a plurality of colors having a chromaticity (a and b values) of 0 or close thereto are selected. Hereinafter, this reason will be described.
[0077]
FIG. 5 shows a color space stereoscopic image of the Lab color system. In the figure, from the intersection of the a axis and the b axis, + a indicates the red direction, the opposite direction indicates the green direction, + b indicates the yellow direction, and the opposite direction indicates the blue direction. In the ab plane, the distance from the intersection of the a-axis and the b-axis indicates the saturation, and the circumferential direction of the circle centered on the intersection indicates the hue. The L axis is formed in a direction perpendicular to the ab plane. From the intersection of the a axis and the b axis, + L indicates the white direction, and the opposite direction indicates the black direction.
[0078]
Selecting a color having a and b values of 0 or close to this means selecting a color as close as possible to the L axis in the color space of FIG. 5, that is, a color close to an achromatic color. An achromatic color is, for example, a color with no color bias to blue or red, and even if it is not an achromatic color, the closer it is to an achromatic color, the less the color bias. Therefore, if a target density curve having a density balance similar to the YMC density balance of an achromatic color or a color close to this is obtained for each BGR, the entire density range is obtained when the photographic paper P is exposed using this target density curve. It is considered that the color deviation can be eliminated. Therefore, in order to obtain the target density curve used for such exposure in S7, in S4, the values of a and b are 0 or close to 0 from a plurality of color images formed on the predetermined photographic paper P. A plurality of color images are selected and connected to the next S5.
[0079]
Further, in S3, by using a color meter that can directly obtain the values of a and b, it is possible to easily and appropriately select an achromatic color or a color close to this in S4.
[0080]
In S4, it is assumed that the value of a and b is not only completely zero but a color close to or close to 0 is actually a color in which both a and b are completely zero on the print. This is because it is difficult to obtain. If there is a color in which the values of a and b are 0, it is of course possible to preferentially select that color.
[0081]
In S4, when the maximum value of a and b is 60, a value of 0 ± 1 or less as a and b is set as an allowable range at the time of selection, and a color in which a and b are within the range is selected. I have to.
[0082]
Subsequently, in S5, an LUT for converting the brightness (luminance) of each color into image data is created based on the L value of the color selected in S4. As shown in FIG. 6, in this LUT, among the colors selected in S4, the highest luminance (white) is the
[0083]
Next, in S6, the color selected in S4 is read by the
[0084]
For example, if the value of L obtained by the colorimeter for a selected color is M shown in FIG. 6, the corresponding image data is n, so L = M, a≈0, b≈0. Each density of YMC obtained when the density color is measured with the
[0085]
Next, in S7, as shown in FIG. 7, the horizontal axis represents the B image data, the vertical axis represents the Y density value, and the relationship between the image data obtained in S6 and the density value is plotted. The target density curve A shown in FIG. 8 is obtained by interpolating between the points. Similarly, when considering the G image data on the horizontal axis, the target density curve A obtained when considering the M density on the vertical axis, the R image data on the horizontal axis, and the C density on the vertical axis. To obtain a target density curve A obtained. The reason why the curves for BY, GM, and RC are considered in this way is that YMC is colored by irradiating the photographic paper P with each light of BGR. Then, information on each target density curve of BGR (relationship between image data from 0 to 255 and density) is stored in the storage unit.
[0086]
After S7, the above-described steps S1 to S7 are repeatedly performed until the process is completed for each combination of all photographic paper and all processing liquids based on the determination in S8. Thereby, the information of the target density | concentration curve A corresponding to each of said each combination is memorize | stored in a memory | storage part for every BGR.
[0087]
Here, a method for obtaining the target density curve A by interpolation will be described.
[0088]
Assuming that the image data is x, the density value obtained by measuring the print with the
[0089]
For example, as shown in FIG.1, P2, PThree, PFourThen, P2-PThreeTo make the curve between them smoothly connect,2-PThreeThe curve in between must satisfy the following four conditions.
[0090]
▲ 1 ▼ Point P2Pass through.
[0091]
(2) Point PThreePass through.
[0092]
(3) Point P2The slope at is P1-P2Curve point P between2It matches the slope at.
[0093]
(4) Point PThreeThe slope at is PThree-PFourCurve point P betweenThreeIt matches the slope at.
[0094]
Point P2・ PThreeIf the slope at is determined, the expression of the cubic function can be uniquely obtained from the above conditions (1) to (4).2-PThreeInter-functions are treated as cubic functions. Note that point P2・ PThreeThe slope at is calculated from three consecutive points. That is, point P2The slope at is straight line P1PThreeUsing the slope of the point PThreeThe slope at is straight line P2PFourUse the slope of.
[0095]
Point P2, PThreeThe coordinates of (x2, Y2), (XThree, YThree) And point P2, PThreeThe slope at m2, MThreeAnd The function to be obtained is y = axThree+ Bx2Assuming + cx + d, the following equations are obtained from the above conditions (1) to (4).
[0096]
y2= Ax2 Three+ Bx2 2+ Cx2+ D
yThree= AxThree Three+ BxThree 2+ CxThree+ D
m2= 3ax2 2+ 2bx2 + C
mThree= 3axThree 2+ 2bxThree+ C
Solving the above equations for a, b, c, d, a, b, c, d are expressed as follows.
[0097]
[0098]
Note that the inclination at both ends (
P1Inclination at = P2Slope x (straight line P1P2Slope / straight line P2PThreeSlope).
[0099]
Even if the photographic paper P is exposed with the same image data for each of the BGRs, the color density varies depending on the sensitivity of the photographic paper P and the like. Therefore, different characteristics are obtained for each of the BGRs as the curves shown in FIG.
[0100]
In this step, information on the target density curve A obtained based on the measurement result with the colorimeter is stored in advance in the storage unit before the device is shipped, so there is no need to place a colorimeter on the device to be shipped, There is no increase in the cost of the apparatus. That is, the target density curve A, which will be described later, can be deformed based only on the measurement result of the densitometer mounted on the shipped apparatus without increasing the cost of the apparatus. In other words, it can be said that the cost can be reduced by substituting the densitometer for the color meter to be mounted on the apparatus.
[0101]
(Density balance storage process)
In the density balance storage step, a black balance (YMC density balance) corresponding to each combination of a plurality of printing papers P having different characteristics and a plurality of processing liquids is stored in the storage unit in advance before shipping the apparatus to the factory. As shown in the flowchart of FIG. 10, the process includes steps S11 to S17. In this step, each shutter portion of the
[0102]
First, in S11, each filter position of the light control filter 8 is changed as follows to print various colors on a predetermined printing paper P, and in S12, various color images are developed with a predetermined processing liquid. To do.
[0103]
In S11, the position of each filter is increased from 500, for example, by 10 to 600, and the printing paper P is exposed each time.
[0104]
That is, for example, the Y and M filters are fixed at the
[0105]
Eventually, in the above example, the YMC filters are arranged at 11 × 11 × 11 = 1331 positions depending on the combination. Since the amount of insertion of each filter into the optical path differs depending on the position of each filter, in S11, images of 1331 different colors are finally printed on the photographic paper P. In S12, these images of 1331 colors are It is developed with a predetermined processing solution.
[0106]
Note that these 1331 color images are formed by BGR light that has a relatively large amount of light transmitted through the YMC filters, and thus are relatively high-density images. In the above description, the position of each filter is changed from 500 to 600. However, the position is not limited to this range, and the YMC filters are moved so that a plurality of high-density images can be formed on the printing paper P. Just do it.
[0107]
In S12, images of various colors printed on the photographic paper P in S11 are developed with a predetermined processing liquid. In S13, each color on the developed photographic paper P is read with a colorimeter (or spectrophotometer (spectrophotometer)).
[0108]
If each filter is moved so as to include the filter position in S11 of this process in S1 of the target density storage process described above, in this process, the measurement result of S3 in the target density storage process Can be used as is. That is, in that case, S11 to S13 in this step can be omitted.
[0109]
Next, in S14, one color having a chromaticity (values of a and b) of 0 or closest thereto is selected. This is because the closer the color is to an achromatic color, the less the color deviation. This is because it is thought that it can be eliminated. In order to obtain such a density balance in the next S15 and connect it to an exposure process to be described later, in S14, the values of a and b are 0 or less from a plurality of color images formed on a predetermined photographic paper P. The image with the color closest to is selected.
[0110]
In S14, the value of a and b is not completely 0, but 0 or the closest color is selected. Actually, a color in which both a and b are completely 0 on the print is selected. This is because it is difficult to obtain. If there is a color in which the values of a and b are 0, it is of course possible to select that color.
[0111]
In S14, when the maximum value of a and b is 60, a value of 0 ± 1 or less as a and b is set as the allowable range at the time of selection, and a and b are within the range. , Only one color closest to the L axis is selected.
[0112]
Subsequently, in S15, the color selected in S14 is read with the
[0113]
For example, when the YMC density values of the color selected in S14 are 2.0, 2.2, and 2.3, for example, M = Y + 0.2 and C = Y + 0 with respect to Y. .3 YMC density balance is obtained, and in S16, the density balance is stored in the storage unit.
[0114]
In S16, the YMC density values obtained in S15 may be stored in the storage unit as they are. However, since the color development characteristics of the photographic paper and the state of the processing liquid slightly change over time, such a case. It is better to store the relative density balance between the YMCs in the storage unit than the above density values so that the above color can be reproduced even after such a change with time.
[0115]
If the storage unit is configured to store the YMC density values, then the YMC density balance may be calculated from the values. Anyway, the YMC density balance for the color selected in S14 may be finally obtained.
[0116]
After S16, the above steps S11 to S16 are repeated until the determination in S17 is completed for each combination of all photographic paper and all processing liquids. Thereby, the YMC density balance corresponding to each of the above combinations is stored in the storage unit.
[0117]
In this density balance storage step, whether or not the color is the achromatic color or the closest color is determined using a colorimeter that can directly obtain the values of a and b in the Lab color system. It is possible to easily and appropriately select an image having an achromatic color or a color closest thereto.
[0118]
In addition, since the density balance obtained based on the measurement result with the colorimeter is stored in advance in the storage unit before the shipment of the apparatus, it is not necessary to mount the colorimeter on the apparatus to be shipped, and the cost of the apparatus is increased. There is nothing. That is, the next target density curve A can be deformed based only on the measurement result of the densitometer mounted on the shipped apparatus without causing an increase in the cost of the apparatus. In other words, it can be said that the cost can be reduced by substituting the densitometer for the color meter to be mounted on the apparatus.
[0119]
(Exposure process)
Next, the exposure process will be described. This step is a step of performing exposure using the target density curve A and the density balance stored in the storage unit in the apparatus after factory shipment, and includes steps S21 to S27 shown in FIG.
[0120]
Before performing this step, a daily setup is performed in which the YMC filters of the light control filter 8 are arranged at positions where leakage light from the
[0121]
First, in S21, an LUT for obtaining exposure data corresponding to image data of 256 gradations is created. With this LUT, exposure data corresponding to the input image data can be obtained, and the gray scale can be printed on the photographic paper P based on the exposure data in the next S22. Specifically, this LUT is created by the following method.
[0122]
First, information on the target density curve A corresponding to the photographic paper P and processing liquid to be used is read from the storage unit for all of the BGR. Hereinafter, the read information of each target density curve A will be referred to as a first graph. The photographic paper P refers to the photographic paper P on which the gray scale is printed in the next S22, and the processing liquid refers to the processing liquid for developing the gray scale image in the next S23.
[0123]
Next, a graph is created in which the highest density and the lowest density in the first graph match and the density between them has a linear relationship with the exposure data. Hereinafter, this graph is referred to as a second graph. FIG. 12 shows the first graph (left half graph in the figure) and the second graph (right half graph in the figure). With these graphs, exposure data (for example, j) corresponding to predetermined image data (for example, i) can be obtained. From the graphs of FIG. 12, an LUT is created that takes the image data as input and outputs exposure data corresponding to the image data.
[0124]
In FIG. 12, when B is considered as the horizontal axis, Y is taken as the vertical axis, when G is taken as the horizontal axis, M is taken as the vertical axis, and R is considered as the horizontal axis. Consider C as the vertical axis. That is, the graph having the inverted T-shaped axis shown in FIG. 12 is obtained in three ways for BY, GM, and RC.
[0125]
Next, in S22, for example, a gray scale of 18 gradations (18-step gradation using only achromatic colors) is printed on the photographic paper P. More specifically, for each BGR, image data from 0 to 255 is divided into, for example, 18 stages, and exposure data corresponding to each gradation image data is obtained for each BGR by the LUT shown in the graph of FIG. . The gray scale is printed on the photographic paper P by performing each exposure of BGR with each exposure data.
[0126]
In S23, the gray scale is developed with the processing solution. In S24, the YMC density of each gray scale gradation is read by the
[0127]
Subsequently, in S25, exposure data and density at each gradation are plotted with exposure data on the horizontal axis and density on the vertical axis. At this time, when the horizontal axis represents B exposure data, the vertical axis represents Y density, and when the horizontal axis represents G exposure data, the vertical axis represents M density, and the horizontal axis represents R exposure data. When C is taken, the vertical axis represents C concentration. FIG. 13 shows a plot of, for example, B exposure data and Y density. Then, by interpolating between the points, a graph as shown in FIG. 14 is obtained for each BGR, and this is updated as the second graph. The interpolation method is exactly the same as in the case of the target density curve A described with reference to FIG.
[0128]
Here, FIG. 15 shows a first graph (solid line A) corresponding to the photographic paper P to be used and the processing liquid.1) And the first conventional graph (broken line A) set in common for each combination of all photographic paper P and all processing liquids.2) And the second graph (the graph on the right half in the figure) after being updated in S25. As can be seen from the figure, the difference between the highest densities and the difference between the lowest densities in the first graph and the second graph are shown as a broken line A in the first graph.2Solid line A than when considering1Is definitely smaller. This is a solid line A1However, this is nothing but the color development characteristics according to the combination of the photographic paper P and the processing liquid to be used.
[0129]
Next, in S26, the YMC density balance corresponding to the used printing paper P and processing liquid is read from the storage unit. Then, in S27, in the image of the highest density (black), the highest density of each first graph corresponding to BGR is obtained so that the read YMC density balance can be obtained and the density that cannot be developed is not targeted. Deforms near the density and near the minimum density. That is, the highest density of the first graph is equal to or lower than the highest density of the second graph, and the black balance read in the vicinity of the highest density is obtained, and the lowest in the first graph and the second graph. The first graph is deformed so that the densities match. This deformation ensures that the density range in the first graph falls within the density range in the second graph. Then, based on the first graph after deformation and the second graph obtained in S25, an LUT for obtaining exposure data corresponding to 256-gradation image data is re-created for each BGR.
[0130]
Hereinafter, the modification of the first graph will be described in detail. Hereinafter, as an example, the graph deformation for BY will be described, but the same applies to the graph deformation for the remaining GM and RC.
[0131]
First, for each color of BGR, each density of YMC when exposed at the maximum shutter time is obtained from the second graph obtained in S25. As a result, it is assumed that the YMC concentration is, for example, Y = 2.2, M = 2.3, and C = 2.7.
[0132]
Here, it is assumed that the YMC density balance corresponding to the used printing paper P and processing liquid read from the storage unit in S26 is M = Y + 0.2 and C = Y + 0.3. In this case, considering the maximum density of Y and M with reference to C, Y = C−0.3 = 2.4 and M = Y + 0.2 = 2.6. The density cannot be developed even at the shutter time (because Y = 2.2 and M = 2.3). Therefore, since it is impossible to obtain such a density, the maximum density of Y and M cannot be considered based on C.
[0133]
Further, even when the maximum densities of M and C are considered based on Y, M = Y + 0.2 = 2.4 and C = Y + 0.3 = 2.5, and color development cannot be achieved even when the density of M is the maximum shutter time. Concentration (because M = 2.3). Therefore, since it is impossible to obtain such a concentration, the maximum concentrations of M and C cannot be considered based on Y.
[0134]
On the other hand, when considering the maximum density of Y and C based on M, Y = M−0.2 = 2.1 and C = Y + 0.3 = 2.4. Below the maximum density corresponding to the maximum shutter time. Therefore, in this example, the highest densities of Y and C are considered with respect to M, and in a black image, that is, when the image data value is 0, Y = 2.1, M = 2.3, C = 2 .4 in the vicinity of the maximum density (near image data value 0) of each first graph of BGR so that .4 can be developed. Since the YMC density is a density targeted for color development, the YMC density is hereinafter referred to as a target density.
[0135]
Next, how to actually deform the first graph will be described.
[0136]
When the target density of Y is determined as described above, as shown in FIG. 16, the position of the point a that becomes the target density in the
[0137]
The above 5% is an example and is not limited to this value. However, if the density range b is too large, the range that deviates from the original target density becomes wide. In this case, the balance with other colors is lost, and good achromatic colors cannot be developed. Therefore, it is necessary to set the density range b in consideration of such points. In other words, the density range b is preferably set to a range of 5% or less when the density corresponding to the point a and the minimum density in the first graph before deformation is 100%. .
[0138]
When the deformation point c is obtained in this way, the point a-c is next smoothly connected and smoothly connected at the deformation point c with the original first graph before the deformation. Curve S between cBAsk for. This curve SBThe conditions for obtaining are as follows.
[0139]
(1) Pass through point a.
[0140]
(2) Pass through the deformation point c.
[0141]
(3) The slope at the deformation point c of the first graph after the deformation is the change of the first graph before the deformation.
It coincides with the inclination at the shape point c.
[0142]
(4) Decrease (increase) monotonously.
[0143]
By considering such a condition, it is possible to smoothly change the density corresponding to the image data in the section between the points a and c and across the deformation point c, and it is possible to produce a smooth gradation change. As a function satisfying the above conditions (1) to (4), a function represented by the following expression can be used.
[0144]
[Expression 1]
However, ya: density at point a (target density)
yc: concentration at the deformation point c
xa: image data value at point a (0)
xc: image data value at the deformation point c
ma: slope at point a
Curve SBIs obtained, the portion between the points a-c in the original first graph is obtained as the obtained curve S.BReplace with
[0146]
On the other hand, for the low density portion, a curve T that matches the Y density corresponding to the
[0147]
Here, the deformation range of the low density portion in the first graph (the density range below the deformation point d) is 100% as the difference between the density corresponding to the point a and the minimum density in the first graph before the deformation. For example, 15% is assumed. Although not limited to 15%, if the deformation range in the low density portion is too wide, the range that deviates from the original target density becomes wide, so that the balance with other colors is lost and a good achromatic color is achieved. The color cannot be developed. In addition, the difference in color between the middle and low density portions has a problem that it is easier for human eyes to understand than the high density portions. Therefore, considering such points, the deformation range in the low density portion is 15% or less when the difference between the density corresponding to the point a and the minimum density in the first graph before the deformation is 100%. It is desirable that
[0148]
Although the case where the first graph for B is mainly deformed has been described above, the same applies to the case where the first graph for G and R is deformed. As a result, as shown in FIGS. 17 and 18, it is possible to obtain a first graph (solid line portion) after deformation for G and R. Note that FIG. 17 shows a high-concentration part and a low-concentration part of the first graph (broken line part) for G with the curve SGAnd curve TGFIG. 18 shows the high density part and low density part of the first graph (the broken line part) for R with the curve S.RAnd curve TRShows the replacement. Curve SGAnd SRIs the curve SBAnd the curve TGAnd TRIs the curve TBIt can be obtained in the same way.
[0149]
When the first graph after deformation is obtained for each BGR in this way, the first graph after deformation for each BGR and the second graph obtained in S25, that is, FIGS. 16 to 18 are shown. Based on a solid line graph represented by an inverted T-shaped axis, exposure data corresponding to image data of 256 gradations from 0 to 255 can be obtained.
[0150]
Finally, based on the first graph after deformation and the second graph obtained in S25, the LUT that receives the image data of each gradation and outputs the exposure data corresponding to the image data of each gradation. Are recreated for each BGR. The graph in the lower left (third quadrant) of FIG. 19 shows such an output LUT. Exposure data f corresponding to predetermined image data in the output LUT1Is the exposure data f corresponding to the image data in the second graph.2Are equal to each other.
[0151]
In FIG. 19, the lower right (fourth quadrant) graph shows the LUT during exposure. The LUT at the time of exposure is used only when the gray scale of 18 gradations is printed on the photographic paper P in S22, and is obtained based on the first graph and the second graph of FIG. Is. That is, the LUT at the time of exposure is an LUT that receives the image data of each gradation in the first graph of FIG. 12 and outputs the exposure data corresponding to the image data of each gradation and the second graph of FIG. . By adjusting the LUT at the time of exposure, the interval between the 18 plotted points changes, but the shape of this curve does not change greatly.
[0152]
As described above, in the present invention, by setting the target density curve A for each combination of a plurality of photographic papers P and a plurality of processing liquids, the maximum density and the minimum density in the measured density curve B for each of the above combinations. A target density curve A having a maximum density and a minimum density close to the density can be obtained (see FIG. 15). As a result, the difference between the highest densities and the difference between the lowest densities in the target density curve A and the measured density curve B are smaller for each combination than in the conventional case having the target density curve in common for each combination. It becomes possible to do. As a result, the deformation amount of the target density curve A (the amount by which the maximum density and the minimum density are changed) can be reliably reduced as compared with the conventional case, and as a result, the density change near the deformation point can be smoothed. it can.
[0153]
Here, FIG. 20 shows a conventional target density curve A ′ after deformation and a target density curve A after deformation in the present invention. In the figure, the broken line graph shows a conventional target density curve before deformation. Looking at the target density curve A, the deformation point P of the broken line portion C11And the deformation point P of the broken line part C22The bend of the curve is reliably improved, especially the deformation point P2Then, the effect appears remarkably.
[0154]
Thus, in the present invention, in the target density curve A after deformation, there is no significant bending at the deformation point as in the prior art, and the density change near the deformation point becomes smooth. Since the target density curve A is set corresponding to each combination of the photographic paper P and the processing liquid, such an effect is obtained for each combination of the photographic paper P and the processing liquid to be used. Therefore, the image quality of the image printed on the photographic paper P can be improved for each combination.
[0155]
In the present invention, the target density curve A is changed so that the density range from the lowest density to the highest density in the target density curve A is surely within the density range from the lowest density to the highest density in the measured density curve B ( Deformation). As a result, if the photographic paper P is exposed based on the changed target density curve A and the measured density curve B, and the image printed on the photographic paper P is developed with the processing liquid, the measured density is measured on the photographic paper P. The density range from the lowest density to the highest density in the curve B can be almost developed.
[0156]
At this time, in the vicinity of the maximum density of the target density curve A, the maximum density is changed to be equal to or lower than the maximum density of the measured density curve B, and the black balance corresponding to the photographic paper P and the processing liquid to be used is obtained. . Thus, when the photographic paper P is exposed based on the changed target density curve A and the measured density curve B and a black image is formed on the photographic paper P, the black image is expressed in good black. It becomes possible.
[0157]
On the other hand, in the vicinity of the minimum density of the target density curve A, the target density curve A is changed so that the minimum densities in the target density curve A and the measured density curve B coincide with each other. Color development is possible.
[0158]
In the exposure process described above, even if the maximum density of YMC is obtained with Y = 2.2, M = 2.3, and C = 2.7, M = 2.3 is printed with the maximum shutter time. If not, there is a possibility that a density of M = 2.4 can be developed. In this case, the first graph may be modified so that Y = 2.2, M = 2.4, and C = 2.5 can be developed with Y as a reference.
[0159]
In the present embodiment, the case where the
[0160]
Note that if the density of the achromatic color is biased to a specific color, problems such as overall appearing bluish or reddish occur. However, as in this embodiment, the image data has the same value in BGR. In such a case, it is possible to eliminate such color deviation by adjusting the apparatus so that printing is performed with a density balance of an achromatic color or a color closest thereto. At this time, the medium / low density range can be adjusted by adjusting to the target density (achromatic color). However, since the color development limit differs for each combination of photographic paper P and processing liquid, the maximum density is set according to the target density. I can not match. In addition, since this problem appears prominently when black characters are printed or when a photograph such as a night view is printed, it is necessary to particularly adjust the high density portion (black). The present invention is very effective for adjusting the black balance in such a high density portion.
[0161]
【The invention's effect】
As described above, the exposure method according to the invention of
[0162]
Therefore, since target density information is set for each combination of a plurality of photosensitive materials and a plurality of processing solutions, the maximum density and the minimum density close to the maximum density and the minimum density in the measured density information are set for each combination. Can be obtained, and the difference between the highest densities and the difference between the lowest densities can be made smaller for each combination than in the conventional case.
[0163]
As a result, the amount of change in the target density information is smaller than in the conventional case, so that the change in the print density corresponding to the image data in the changed target density information does not become rapid. As a result, the gradation can be expressed smoothly for each combination of the photosensitive material and processing solution used, and the image quality of the image printed on the photosensitive material can be improved.
[0164]
As described above, in the exposure method according to the second aspect of the present invention, in the configuration of the first aspect, the target density storing step prints an image of a different color on a predetermined photosensitive material, and processes the image of each color for a predetermined process. Based on the first step of developing with a liquid, the second step of selecting a plurality of achromatic or near-color images from the images of the respective colors, and the brightness (luminance) of the selected image, the brightness of the image is determined. A third step of creating a table for conversion into image data, and the brightness of each selected image is converted into image data by the above table, and the YMC density of each selected image is obtained, and the YMC of each selected image is obtained. The fourth step of acquiring the target density information based on the density and the image data and storing the target density information in the storage unit, and the first to fourth steps are combined with all the photosensitive materials and all the processing solutions. It's A Configurations of and a fifth step of performing the record.
[0165]
Therefore, an achromatic color is, for example, a color with no color bias to blue or red, and even if it is not an achromatic color, the closer the color is to an achromatic color, the less the color bias is. By selecting an achromatic or near-color image and acquiring target density information based on these images, target density information having the same density balance as the density balance of the achromatic or near-color is obtained. Obtainable. Thus, in addition to the effect of the structure of
[0166]
As described above, in the exposure method according to the third aspect of the present invention, in the configuration of the second aspect, in the second step, whether or not the color is an achromatic color or a color close thereto is determined using a colorimeter. It is a configuration.
[0167]
Therefore, in the colorimeter, the values of a and b (chromaticity (hue and saturation)) in the Lab color system can be directly obtained. By using such a colorimeter, In addition to the effect of the configuration, there is an effect that it is possible to easily and appropriately select an achromatic color in which the values of a and b are 0 or a color close to this.
[0168]
As described above, the exposure method according to the invention of claim 4 has a black balance corresponding to each combination of a plurality of photosensitive materials having different characteristics and a plurality of processing liquids in the configuration of any one of
[0169]
Therefore, since the maximum density in the target density information after the change is surely within the density range in the measured density information, in addition to the effect of the structure according to any one of
[0170]
The black balance corresponding to each combination of photosensitive material and processing solution is also stored in the storage unit, and the target density information is changed so that the black balance corresponding to the photosensitive material and processing solution used is obtained near the maximum density. Therefore, when the photosensitive material is exposed based on the changed target density information and measured density information and a black image is formed on the photosensitive material, the black image can be expressed in good black. It also has the effect of becoming.
[Brief description of the drawings]
FIG. 1 is a flowchart showing an operation flow in a target density storage step of an exposure method according to the present invention.
FIG. 2 is an explanatory diagram showing a schematic configuration of a photographic processing apparatus to which the above exposure method is applied.
FIG. 3 is a perspective view showing a schematic configuration of an exposure unit provided in the photographic processing apparatus.
FIG. 4A is a graph showing spectral sensitivity characteristics corresponding to human eyes. (B) is a graph which shows the spectral sensitivity characteristic of a densitometer.
FIG. 5 is an explanatory diagram showing a three-dimensional image of a color space of the Lab color system.
FIG. 6 is an explanatory diagram showing an LUT for converting brightness (luminance) into image data.
FIG. 7 is an explanatory diagram showing the relationship between image data and density values plotted on a coordinate axis.
FIG. 8 is a graph obtained by interpolating the plotted points.
FIG. 9 is an explanatory diagram for explaining the above interpolation method and for explaining a technique for obtaining a curve smoothly connecting two plotted points.
FIG. 10 is a flowchart showing an operation flow in a density balance storing step of the exposure method according to the present invention.
FIG. 11 is a flowchart showing an operation flow in an exposure process of the exposure method according to the present invention.
FIG. 12 is a graph showing a first graph corresponding to photographic paper and processing liquid to be used and a second graph set in advance.
FIG. 13 shows the relationship between B exposure data and Y density when YMC density of each gradation is measured after printing a gray scale on photographic paper based on exposure data corresponding to 18-step BGR image data. It is explanatory drawing which plots and shows on a coordinate axis.
FIG. 14 is a graph obtained by interpolating the plotted points.
FIG. 15 illustrates a difference between a first graph corresponding to photographic paper and processing liquid to be used and a conventional first graph that is commonly set for each combination of all photographic paper and all processing liquid. It is explanatory drawing for.
FIG. 16 is an explanatory diagram showing shapes before and after deformation of the first graph showing the relationship between the image data of B and exposure data and the Y density.
FIGS. 17A and 17B are explanatory diagrams showing shapes before and after deformation of the first graph showing the relationship between G image data and exposure data and M density; FIGS.
FIG. 18 is an explanatory diagram showing shapes before and after deformation of the first graph showing the relationship between R image data and exposure data and C density;
FIG. 19 shows a first graph before and after deformation, an updated second graph, an output LUT obtained based on the first graph after deformation and the second graph, and a gray scale on photographic paper. It is explanatory drawing which shows the LUT at the time of exposure utilized when baking.
FIG. 20 is an explanatory diagram for explaining a difference in shape of the first graph after deformation in the present invention and the related art.
FIG. 21 is an explanatory diagram showing a conventional target density curve and a measured density curve that are set in common for each combination of photographic paper and processing liquid.
FIG. 22 is an explanatory diagram showing the target density curve after deformation.
FIG. 23 is a flowchart showing a flow of operations when performing conventional density adjustment.
[Explanation of symbols]
6 Exposure section
A target density curve (target density information)
B Measurement concentration curve (Measurement concentration information)
P Photographic paper (photosensitive material)
Claims (3)
特性の異なる複数の感光材料と、感光材料上に焼き付けられた画像を現像するための複数の処理液との各組み合わせに対応する目標濃度情報を記憶部に記憶させる目標濃度記憶工程と、
用いる感光材料および処理液の組み合わせに対応する目標濃度情報を上記記憶部から読み出し、上記測定濃度情報における最低濃度から最高濃度までの濃度範囲をほぼ発色できるように、読み出した目標濃度情報を変更し、変更後の目標濃度情報と上記測定濃度情報とに基づいて感光材料を露光する露光工程と有し、
上記目標濃度記憶工程は、
所定の感光材料に異なる色の画像を焼き付け、上記各色の画像を所定の処理液で現像する第1の工程と、
上記各色の画像から無彩色もしくはこれに近い色の画像を複数選択する第2の工程と、
選択した画像の明度に基づいて、画像の明度を画像データに変換するためのテーブルを作成する第3の工程と、
選択した各画像の明度を上記テーブルによって画像データに変換すると共に、選択した各画像のYMC濃度を求め、選択した各画像のYMC濃度と上記画像データとに基づいて上記目標濃度情報を取得し、これを記憶部に記憶させる第4の工程と、
上記第1から第4の工程を、全感光材料および全処理液の各組み合わせのそれぞれについて行う第5の工程を有していることを特徴とする露光方法。Based on the target density information indicating the relationship between the image data and the print density and the measured density information indicating the relationship between the exposure data and the print density, exposure data corresponding to the image data for obtaining a desired print density is obtained. , An exposure method for exposing a photosensitive material based on the exposure data,
A target density storage step of storing in a storage unit target density information corresponding to each combination of a plurality of photosensitive materials having different characteristics and a plurality of processing solutions for developing an image printed on the photosensitive material;
The target density information corresponding to the combination of photosensitive material and processing solution to be used is read from the storage unit, and the read target density information is changed so that the density range from the lowest density to the highest density in the measured density information can be substantially developed. An exposure process for exposing the photosensitive material based on the changed target density information and the measured density information,
The target concentration storage step includes
A first step of printing an image of a different color on a predetermined photosensitive material and developing the image of each color with a predetermined processing solution;
A second step of selecting a plurality of achromatic or near-color images from the images of the respective colors;
A third step of creating a table for converting the brightness of the image into image data based on the brightness of the selected image;
The brightness of each selected image is converted into image data by the table, the YMC density of each selected image is obtained, and the target density information is acquired based on the YMC density of each selected image and the image data, A fourth step of storing this in the storage unit;
An exposure method comprising: a fifth step in which the first to fourth steps are performed for each combination of all photosensitive materials and all processing solutions .
上記露光工程では、用いる感光材料および処理液に応じた黒バランスを読み出すと共に、上記目標濃度情報の最高濃度が測定濃度情報の最高濃度以下となり、かつ、最高濃度付近において読み出した黒バランスが得られるように、上記目標濃度情報を変更すること
を特徴とする請求項1又は2に記載の露光方法。A density balance storage step of storing in the storage unit black balance corresponding to each combination of a plurality of photosensitive materials having different characteristics and a plurality of processing solutions;
In the exposure step, the black balance corresponding to the photosensitive material and processing solution to be used is read out, the maximum density of the target density information is equal to or less than the maximum density of the measured density information, and the black balance read out in the vicinity of the maximum density is obtained. The exposure method according to claim 1 or 2 , wherein the target density information is changed.
Priority Applications (1)
| Application Number | Priority Date | Filing Date | Title |
|---|---|---|---|
| JP2000180471A JP4635299B2 (en) | 2000-06-15 | 2000-06-15 | Exposure method |
Applications Claiming Priority (1)
| Application Number | Priority Date | Filing Date | Title |
|---|---|---|---|
| JP2000180471A JP4635299B2 (en) | 2000-06-15 | 2000-06-15 | Exposure method |
Publications (2)
| Publication Number | Publication Date |
|---|---|
| JP2001356431A JP2001356431A (en) | 2001-12-26 |
| JP4635299B2 true JP4635299B2 (en) | 2011-02-23 |
Family
ID=18681560
Family Applications (1)
| Application Number | Title | Priority Date | Filing Date |
|---|---|---|---|
| JP2000180471A Expired - Fee Related JP4635299B2 (en) | 2000-06-15 | 2000-06-15 | Exposure method |
Country Status (1)
| Country | Link |
|---|---|
| JP (1) | JP4635299B2 (en) |
Family Cites Families (9)
| Publication number | Priority date | Publication date | Assignee | Title |
|---|---|---|---|---|
| JP2633396B2 (en) * | 1991-01-10 | 1997-07-23 | 富士写真フイルム株式会社 | Image forming apparatus and image forming condition setting method |
| JPH05341399A (en) * | 1992-06-12 | 1993-12-24 | Konica Corp | Photograph printing device |
| JPH07244365A (en) * | 1994-03-03 | 1995-09-19 | Fuji Photo Film Co Ltd | Photographic film processing system |
| JPH0887081A (en) * | 1994-07-19 | 1996-04-02 | Konica Corp | Production of printing density, production of reference function for obtaining printing density from photometry density, and production of standard reference function correction information |
| JPH09304847A (en) * | 1996-05-14 | 1997-11-28 | Fuji Photo Film Co Ltd | Copying system and copying control method |
| JPH1075377A (en) * | 1996-06-17 | 1998-03-17 | Konica Corp | Image output method, image output system, exposure image information conversion method, storage medium and production method for conversion information |
| JPH10254077A (en) * | 1997-03-07 | 1998-09-25 | Mitsubishi Paper Mills Ltd | Exposure amount control method for lithographic printing plate for scanning exposure |
| JPH1178112A (en) * | 1997-09-09 | 1999-03-23 | Konica Corp | Image forming system and image forming method |
| JP2000004361A (en) * | 1998-06-16 | 2000-01-07 | Fuji Photo Film Co Ltd | Image data correcting method and image processor |
-
2000
- 2000-06-15 JP JP2000180471A patent/JP4635299B2/en not_active Expired - Fee Related
Also Published As
| Publication number | Publication date |
|---|---|
| JP2001356431A (en) | 2001-12-26 |
Similar Documents
| Publication | Publication Date | Title |
|---|---|---|
| Balasubramanian | Device characterization | |
| EP0701362B1 (en) | Color image reproduction of scenes with color enhancement and preferential tone mapping | |
| US5267030A (en) | Method and associated apparatus for forming image data metrics which achieve media compatibility for subsequent imaging application | |
| EP0948191B1 (en) | Scanner illumination | |
| US20020131770A1 (en) | Color modeling of a photographic image | |
| WO2001045042A1 (en) | Method and system for selective enhancement of image data | |
| US5367387A (en) | Color image forming apparatus for reproducing color image with high reproducibility | |
| US6324345B1 (en) | Photographic film with recorded information, method of acquiring the information recorded on photographic film, image processing method using the acquired information, and print system using the same | |
| US6864998B2 (en) | Image reading apparatus, image recording medium and image forming apparatus | |
| JP4635299B2 (en) | Exposure method | |
| JP4635298B2 (en) | Black density judgment method | |
| JP2001356434A (en) | Exposure adjustment method | |
| US6760055B2 (en) | Photographic processing apparatus | |
| JP4986718B2 (en) | Image forming apparatus and image processing method | |
| JP2005101831A (en) | Image forming apparatus and image forming method | |
| JP4552288B2 (en) | Image recording device | |
| JP3724434B2 (en) | Exposure amount adjustment method | |
| JPH08279919A (en) | Image processing apparatus and method thereof | |
| JP2003050429A (en) | Exposure adjustment method | |
| JP3788342B2 (en) | Exposure amount adjustment method | |
| JPH0479474A (en) | Color picture reader | |
| JP2993620B2 (en) | Exposure control method | |
| JPH11231465A (en) | Information recording photographic film, recording information acquiring method for photographic film, and image processing method using recording information and printing system using the same | |
| JP2009111916A (en) | Image reading apparatus and image forming apparatus having the same | |
| JP2003066546A (en) | Film chart original plate and film chart |
Legal Events
| Date | Code | Title | Description |
|---|---|---|---|
| A621 | Written request for application examination |
Free format text: JAPANESE INTERMEDIATE CODE: A621 Effective date: 20070516 |
|
| A131 | Notification of reasons for refusal |
Free format text: JAPANESE INTERMEDIATE CODE: A131 Effective date: 20100727 |
|
| A521 | Request for written amendment filed |
Free format text: JAPANESE INTERMEDIATE CODE: A523 Effective date: 20100927 |
|
| RD02 | Notification of acceptance of power of attorney |
Free format text: JAPANESE INTERMEDIATE CODE: A7422 Effective date: 20100927 |
|
| TRDD | Decision of grant or rejection written | ||
| A01 | Written decision to grant a patent or to grant a registration (utility model) |
Free format text: JAPANESE INTERMEDIATE CODE: A01 Effective date: 20101026 |
|
| A01 | Written decision to grant a patent or to grant a registration (utility model) |
Free format text: JAPANESE INTERMEDIATE CODE: A01 |
|
| A61 | First payment of annual fees (during grant procedure) |
Free format text: JAPANESE INTERMEDIATE CODE: A61 Effective date: 20101108 |
|
| FPAY | Renewal fee payment (event date is renewal date of database) |
Free format text: PAYMENT UNTIL: 20131203 Year of fee payment: 3 |
|
| R150 | Certificate of patent or registration of utility model |
Free format text: JAPANESE INTERMEDIATE CODE: R150 |
|
| S111 | Request for change of ownership or part of ownership |
Free format text: JAPANESE INTERMEDIATE CODE: R313111 |
|
| FPAY | Renewal fee payment (event date is renewal date of database) |
Free format text: PAYMENT UNTIL: 20131203 Year of fee payment: 3 |
|
| R350 | Written notification of registration of transfer |
Free format text: JAPANESE INTERMEDIATE CODE: R350 |
|
| LAPS | Cancellation because of no payment of annual fees |