JP4635298B2 - Black density judgment method - Google Patents
Black density judgment method Download PDFInfo
- Publication number
- JP4635298B2 JP4635298B2 JP2000180455A JP2000180455A JP4635298B2 JP 4635298 B2 JP4635298 B2 JP 4635298B2 JP 2000180455 A JP2000180455 A JP 2000180455A JP 2000180455 A JP2000180455 A JP 2000180455A JP 4635298 B2 JP4635298 B2 JP 4635298B2
- Authority
- JP
- Japan
- Prior art keywords
- density
- black
- photographic paper
- exposure
- black image
- Prior art date
- Legal status (The legal status is an assumption and is not a legal conclusion. Google has not performed a legal analysis and makes no representation as to the accuracy of the status listed.)
- Expired - Fee Related
Links
Images


Landscapes
- Projection-Type Copiers In General (AREA)
- Control Of Exposure In Printing And Copying (AREA)
- Photographic Developing Apparatuses (AREA)
Description
【0001】
【発明の属する技術分野】
本発明は、感光材料としての印画紙上に形成される黒画像の画像品位の低下を回避すべく、用いる印画紙や現像処理液(以下、処理液と記載する)に応じて上記黒画像の濃度が適切か否かを判断する黒濃度判定方法に関するものである。
【0002】
【従来の技術】
従来から、写真処理の分野においては、デジタル露光による画像の焼き付けが一般的に知られている。このデジタル露光は、写真フィルム(例えばネガフィルム)に記録された画像をスキャナ等で読み取って得られる画像データや、デジタルカメラでの撮影によって得られる画像データなどに基づいて露光ヘッドの各画素を駆動し、各画素を介して得られる光を印画紙に照射することにより、上記画像データに応じた画像を印画紙に焼き付ける方式である。
【0003】
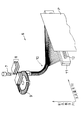
ここで、上記デジタル露光を行う写真処理装置の露光部について、本発明の方法が適用される装置の構成図である図3に基づいて簡単に説明する。この種の写真処理装置は、光源7、調光フィルタ8、回転フィルタ9、光ファイバー束10、露光ヘッド11およびレンズアレイ12を備えている。
【0004】
光源7は、例えばハロゲンランプで構成されている。調光フィルタ8は、Y(イエロー)、M(マゼンタ)、C(シアン)の各色フィルタで構成されており、光源7と光ファイバー束10との間の光路中への各色フィルタの挿入量を変えることによって光の調光が行われる。回転フィルタ9は、B(青)、G(緑)、R(赤)の各色フィルタを備えてなり、各色フィルタが順次上記光路中に位置するように回転される。これにより、各色フィルタを介してBGRの各色の光を順次、光ファイバー束10に供給することが可能となる。
【0005】
光ファイバー束10は、入射光を露光ヘッド11の各シャッタ部(後述する)に供給する複数の光ファイバーで構成されている。レンズアレイ12は、露光ヘッド11の各シャッタ部と対応する複数のレンズで構成され、上記各シャッタ部を透過した光を印画紙Pの所定画素に集光させるものである。
【0006】
露光ヘッド11は、例えばPLZT露光ヘッド(以下、単にPLZTと記載する)で構成される。このPLZTは、透明強誘電性セラミックス材料であるPLZT素子を一対の偏光板(偏光子と検光子)の間に配し、各画素ごとに光の透過を制御するためのシャッタ部を例えばライン状に構成したものである。画像データに応じた時間だけ開状態となるように各シャッタ部をON/OFF駆動することにより、光源7からの光のうち画像データに応じた光量の光が各シャッタ部を介して印画紙Pに導かれる。
【0007】
つまり、上記構成においては、光源7から出射された光が調光フィルタ8において調光され、回転フィルタ9の所定の色フィルタを透過して光ファイバー束10に到達する。そして、光ファイバー束10を介して露光ヘッド11の各シャッタ部に供給された光は、当該シャッタ部でのシャッタタイム(シャッタを開状態としている時間)が画像データに応じてBGRごとに調整されることによってその透過光量がBGRごとに調整され、レンズアレイ12を介して印画紙Pに照射される。
【0008】
したがって、露光ヘッド11の各シャッタ部が印画紙Pの搬送方向(以下、副走査方向と記載する)とは垂直方向(以下、主走査方向と記載する)に並ぶように上記露光ヘッド11を配置しておき、印画紙Pを副走査方向に搬送しながら印画紙PをBGRごとに露光することにより、印画紙Pには最終的に2次元のカラー画像を焼き付けることが可能となる。
【0009】
このように印画紙Pに焼き付けられた画像は、その後、写真処理装置の図示しない現像部の現像処理液(以下、単に処理液と記載する)によって現像される。そして、現像済みの印画紙Pは、図示しない乾燥部にて例えば熱風が吹き付けられて乾燥され、その後、プリント画像として機外に排出される。
【0010】
ところで、プリント画像の品質を左右する要素として、黒の見え方がある。これは、黒が確実に出ているプリントほど画像全体が引き締まって見えると共に、画像にめりはりが付くからである。
【0011】
そこで、従来では、用いる印画紙Pや処理液に関係なく、全印画紙Pおよび全処理液の各組み合わせに対して共通の黒バランスが得られるように、露光ヘッド11においてBGRを露光するときの各シャッタタイムを調整している。なお、上記の黒バランスとは、印画紙Pに黒の画像を焼き付け、当該黒画像におけるYMCの各濃度を濃度計にて読み取ったときの、YMCの濃度の相対的なバランスのことを言う。
【0012】
例えば、2種類の印画紙A・Bと2種類の処理液A・Bとの組み合わせで、印画紙に焼き付けて現像した黒の画像において、各黒画像におけるYおよびMの濃度から、Yに対するMの相対濃度が次の表1の範囲で得られているとする。
【0013】
【表1】
この場合、Yに対するMの相対濃度が上記各組み合わせに共通の範囲に収まるように、つまり、Mの相対濃度が、Y+0.2〜Y+0.3の範囲に収まるように、Mを発色させるG光を露光するときのシャッタタイムが調整される。また、同様にYに対するCの相対濃度が上記各組み合わせごとに分かっていれば、Cの相対濃度が、上記各組み合わせにおいて共通する範囲に収まるように、Cを発色させるR光のシャッタタイムが調整される。また、例えば、表1に示したYに対するMの相対濃度から逆に、Mに対するYの相対濃度を各組み合わせごとに求めれば、Yの相対濃度が上記各組み合わせにおいて共通する範囲に収まるように、Yを発色させるB光のシャッタタイムを調整することが可能となる。
【0015】
しかし、上記のように黒に対応するBGRの各シャッタタイムを調整しても、現像部における処理液は、時間経過とともにその酸化が進み、特性が次第に低下するため、当該処理液によって現像される画像の黒バランスは時間経過とともに崩れてしまう。また、この崩れ方は、用いる印画紙Pの種類によっても異なるものである。
【0016】
そこで、従来では、黒バランス調整後の黒画像において、濃度計でYMCの各濃度を読み取り、このうち濃度が最低となる色の当該濃度が閾値を下回った場合には、処理液の交換等を促す警告を出し、時間経過とともに黒の画像品位が低下するのを回避している。このとき、上記閾値は、全印画紙および全処理液の各組み合わせに対して共通の値となっている。
【0017】
例えば、印画紙Aおよび処理液Aの組み合わせを組み合わせAとし、印画紙Bおよび処理液Bの組み合わせを組み合わせBとする。適切な黒に対応するYMCの各濃度として、組み合わせAにおいてはそれぞれ1.9、2.0、2.1が得られ、組み合わせBにおいてはそれぞれ2.4、2.3、2.5が得られたとすると、上記閾値が、上記各組み合わせに共通して1.7に設定されていれば、組み合わせAにおいては、YMCのうち最低濃度であるYの濃度1.9と上記閾値1.7との大小関係を判断し、組み合わせBにおいては、YMCのうち最低濃度であるMの濃度2.3と上記閾値1.7との大小関係を判断する。これらの例では、閾値との比較対象がいずれも閾値を上回っているので警告を発することはないが、処理液の特性の経時変化により、上記比較対象が閾値を下回った場合には、警告を発することになる。
【0018】
【発明が解決しようとする課題】
ところで、上述したように全印画紙および全処理液の各組み合わせに対して共通の閾値を設ける場合、この閾値を用いて全組み合わせについて濃度判定を行うようにするためには、その閾値を最も発色能力の低い印画紙および処理液の組み合わせに合わせなければならないことになる。したがって、例えば発色能力の高い印画紙および処理液を使用した場合には、黒画像のYMC濃度が閾値よりも下回らない範囲で極度に低下しても、所定の警告がなされないこととなる。
【0019】
上記の例で言えば、組み合わせBにおいて、処理液Bの特性の低下により、適切な黒に対応するYMCの各濃度がそれぞれ2.1、2.0、2.2になっているとすると、最低濃度2.0は閾値1.7を上回っており、この比較においては一応上述の条件をクリアしていることになる。しかし、この場合は、最低濃度2.0が当初の最低濃度2.3に比べてかなり低い値となっているにもかかわらず警告がなされないこととなる。
【0020】
このように、全印画紙および全処理液の各組み合わせに対して共通の閾値を設け、印画紙上の黒画像の濃度の良否を判定する従来の方法では、黒濃度の判定を各組み合わせのそれぞれに対して適切に行うことができない。その結果、黒画像の濃度が不適切となってもその状態がしばらく続く結果となり、黒画像ひいては画像全体の品位が低下するという問題が生ずる。
【0021】
本発明は、上記の問題点を解決するためになされたもので、その目的は、用いる印画紙および処理液の各組み合わせのそれぞれに対して、印画紙上に形成された黒画像の濃度を適切に判定し、これによって画像品位が低下するのを確実に回避することができる黒濃度判定方法を提供することにある。
【0022】
【課題を解決するための手段】
請求項1の発明に係る黒濃度判定方法は、上記の課題を解決するために、黒濃度判定を行う際の基準となる閾値を、特性の異なる複数の感光材料と複数の処理液との各組み合わせに対応して求め、各閾値を記憶部に記憶させる第1の工程と、所定の感光材料に黒画像を焼き付け、この黒画像を所定の処理液で現像する第2の工程と、上記黒画像の濃度値を測定する第3の工程と、上記所定の感光材料と上記所定の処理液との組み合わせに対応する閾値を上記記憶部から読み出す第4の工程と、上記黒画像の濃度値と上記読み出した閾値との大小関係に基づいて、上記黒画像の濃度の良否を判定する第5の工程とを有していることを特徴としている。
【0023】
上記の構成によれば、黒画像の濃度判定を行う際の基準となる上記閾値を、特性の異なる複数の感光材料と複数の処理液との各組み合わせに対応して求めている。各組み合わせごとの閾値としては、例えば、良好な黒が出るように調整された露光量で所定の感光材料に黒画像を焼き付け、これを所定の処理液で現像して得られる上記黒画像のYMC濃度を考えた場合に、これらのうちで最低となる濃度から所定値を差し引いた値を考えることができる。上記各閾値は、記憶部に記憶される。
【0024】
そして、上記構成では、所定の感光材料に黒画像を焼き付け、これを所定の処理液で現像して得られる黒画像の濃度値(例えばYMCの濃度値)を測定すると共に、上記感光材料および上記処理液の組み合わせに対応した閾値を上記記憶部から読み出し、上記黒画像の濃度値と上記読み出した閾値との大小関係に基づいて、上記黒画像の濃度の良否を判定するようにしている。
【0025】
この濃度判定では、上記各組み合わせに対応した閾値を用いているので、用いた処理液の特性低下により、黒画像の濃度が低下した場合でも、上記各組み合わせのそれぞれに応じた濃度判定を行うことが可能となる。つまり、上記のように感光材料および処理液の各組み合わせごとに閾値を設定した場合には、黒画像の濃度の低下量を上記各組み合わせごとに管理することが可能となり、上記各組み合わせごとに適切な濃度判定を行うことが可能となる。
【0026】
したがって、濃度不良と判定した場合には、その後、例えば処理液の交換などの警告を作業者に発することにより、黒画像ひいては画像全体の品位が低下するのを上記各組み合わせごとに確実に回避することが可能となる。
【0027】
請求項2の発明に係る黒濃度判定方法は、上記の課題を解決するために、請求項1の構成において、上記第1の工程は、所定の感光材料に黒画像を焼き付け、この黒画像を所定の処理液で現像する工程(a)と、上記黒画像のYMCの各濃度値を測定する工程(b)と、上記YMCの各濃度値のうち最低となる濃度値に基づいて閾値を設定し、上記閾値を記憶部に記憶させる工程(c)と、上記工程(a)ないし(c)を、上記各組み合わせのそれぞれに対して行う工程(d)とを有していることを特徴としている。
【0028】
上記の構成によれば、所定の感光材料に焼き付けられ、所定の処理液で現像される黒画像のYMC濃度値が測定されると、上記YMCの各濃度値のうち最低となる濃度値から例えば所定値を差し引いた値が閾値として設定され、この閾値が記憶部に記憶される。そして、このような閾値の設定および記憶処理が、感光材料および処理液の全ての組み合わせについて行われる。
【0029】
このように黒画像のYMCの各濃度値のうち、濃度低下によって一番黒画像の画質を損ないやすい最低の濃度値に基づいて、上記各組み合わせごとに閾値が設定されるので、黒画像の画質低下を上記各組み合わせごとに確実に回避することができる。
【0030】
請求項3の発明に係る黒濃度判定方法は、上記の課題を解決するために、請求項2の構成において、上記工程(a)では、用いる感光材料および処理液に応じた、黒に対応するYMCの濃度バランスが上記黒画像において得られるようなBGRの露光量で感光材料を露光することにより上記黒画像を感光材料に焼き付けることを特徴としている。
【0031】
上記BGRの露光量で感光材料を露光することにより上記感光材料に焼き付けられ、処理液によって現像される黒画像は、上記感光材料および上記処理液に応じた黒に対応するYMCの濃度バランスを有するようになる。したがって、その後、この黒画像に基づいて閾値を設定し、この閾値を用いて黒濃度の判定を行うので、黒画像が適切な黒で表現されているか否かを確実に判定することができる。
【0032】
【発明の実施の形態】
本発明の実施の一形態について、図面に基づいて説明すれば以下の通りである。
【0033】
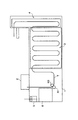
本実施形態に係る写真処理装置は、本発明に係る黒濃度判定方法を使用できる装置であって、図2に示すように、焼付部1、印画紙格納部2、現像部3、乾燥部4および図示しないPC(Personal Computer )を備えている。
【0034】
印画紙格納部2は、焼付部1に供給する感光材料としての印画紙P(図3参照)を格納するものであり、例えばサイズの互いに異なるロール状の印画紙Pを格納している。そして、出力画像のサイズに応じた印画紙Pが印画紙格納部2から焼付部1に供給される。なお、印画紙Pの焼付部1への搬送経路の途中にカッターを設けておけば、焼付部1にシート状の印画紙Pを供給することもできる。
【0035】
焼付部1は、搬送ローラR1・R2、内蔵濃度計(以下、単に濃度計と記載する)5および露光部6を備えている。搬送ローラR1・R2は、印画紙格納部2から供給された印画紙Pを、露光部6を経由して現像部3に送り込むためのものである。なお、同図では、2個の搬送ローラR1・R2を示しているが、この他にも多数の搬送ローラが所定位置に設けられている。濃度計5は、BGRの各波長の光の反射光量に基づいてYMCの各濃度値を算出する計器であり、本装置によって印画紙Pに焼き付けられ、現像された画像の濃度が、この濃度計5にて測定される。露光部6は、印画紙Pを搬送しながら走査露光を行うことにより、印画紙P上に2次元の画像を焼き付けるものであるが、その詳細については後述する。
【0036】
現像部3は、焼付部1にて焼き付け処理の施された印画紙Pを現像処理液(以下、単に処理液と記載する)、漂白定着液等に浸しながら搬送することによって、印画紙Pに焼き付けられた画像を現像するものである。上記処理液の特性はメーカーによって微妙に異なるものである。乾燥部4は、現像部3にて現像された印画紙Pを、例えば熱風の吹き付けにより乾燥させるためのものである。PCは、本写真処理装置の全動作を制御する制御部であり、原画像の画像データを保存する機能や、画像データに対してデータ処理を施す機能等を有している。
【0037】
このように、本実施形態に係る写真処理装置は、PCでの制御により、印画紙Pの露光、現像処理、乾燥処理を一元管理の下に連続して行う構成となっている。よって、使用者に操作上の負担をかけることなしに、多量の写真を連続的にプリントすることが可能となっている。なお、図中のTは、印画紙Pの搬送経路を示している。
【0038】
また、上記写真処理装置は、例えばハードディスクからなる記憶部(図示せず)をさらに備えている。この記憶部には、全印画紙Pおよび全処理液の各組み合わせのそれぞれに対して適切な黒に対応するYMCの濃度バランス(後述する)が記憶されていると共に、上記各組み合わせのそれぞれに対応する、黒濃度判定の際に用いる閾値(後述する)が記憶されるようになっている。
【0039】
本発明は、上記個々の組み合わせごとに上記閾値を持ち、個々の閾値を用いて各組み合わせに応じた黒濃度判定を行う点に特徴があるが、この点については後述する。
【0040】
次に、上記の露光部6の構成について説明する。露光部6は、印画紙Pを副走査方向に搬送しながら走査露光を行うものであり、図3に示すように、光源7、調光フィルタ8、回転フィルタ9、光ファイバー束10、露光ヘッド11およびレンズアレイ12を備えている。
【0041】
光源7は、白色光を出射する例えばハロゲンランプで構成されている。調光フィルタ8は、Y(イエロー)、M(マゼンタ)、C(シアン)の各色フィルタで構成されており、光源7と光ファイバー束10との間の光路中への各色フィルタの挿入量を変えることによって光の調光を行うことが可能となっている。
【0042】
上記各フィルタは、図示しない駆動部によって位置制御されるが、上記各フィルタの上記光路に対する挿入量は、駆動部に与えるパルス数に応じて制御される。例えば、上記パルス数が0のときは各フィルタが上記光路から外れた状態となり、上記パルス数が720のときは各フィルタが上記光路に全部入る状態となる。そして、各フィルタは、上記した移動範囲内でパルス数に応じた位置となるように、駆動部によって位置制御される。なお、以下では、パルス数a(aは0から720までの整数)に応じた各フィルタの位置を、単にaの位置あるいは位置aと記載することにする。
【0043】
なお、上記各フィルタは、装置の工場出荷前に記憶部に記憶させるデータ(後述するYMCの濃度バランス)を取得する際にはその位置が調節されることになるが、上記YMCの濃度バランスを用いて印画紙Pを露光する際には、露光ヘッド11において漏れ光が生じないような位置、すなわち、露光ヘッド11の各シャッタ部(後述する)を閉状態にしたときに漏れ光が印画紙Pに到達しないような位置に固定される。
【0044】
印画紙Pの露光時における調光フィルタ8の位置設定(漏れ光のない位置の設定)は、例えば毎朝装置を立ち上げる時などにYMCの各フィルタ位置を微調整することによって行われ、デイリーセットアップと呼ばれている。
【0045】
回転フィルタ9は、円形ホイールの中心から放射状に3等分した領域にB(青)、G(緑)、R(赤)の各色フィルタを備えた円盤状のフィルタであり、各色フィルタが順次上記光路中に位置するように上記中心を回転軸として回転される。これにより、各色フィルタを介してBGRの各色の光を順次、光ファイバー束10に供給することが可能となる。
【0046】
光ファイバー束10は、回転フィルタ9を透過した光を露光ヘッド11の各シャッタ部(後述する)に供給する複数の光ファイバーで構成されている。光ファイバー束10により、スポット状に入射する光が上記各シャッタ部に対応する点光源に変換される。
【0047】
露光ヘッド11は、例えばPLZT露光ヘッド(以下、単にPLZTと記載する)で構成される。このPLZTは、透明強誘電性セラミックス材料であるPLZT素子を一対の偏光板(偏光子と検光子)の間に配し、各画素ごとに光の透過およびその阻止を制御するためのシャッタ部を、上記副走査方向とは垂直な主走査方向に1列または2列で千鳥状に構成したものである。なお、上記のPLZT素子とは、ジルコン酸鉛(PbZrO3 )とチタン酸鉛(PbTiO3 )とを適当な比率で固溶体としたもの(PZT)に、ランタンを添加してホットプレスして得られる(Pb1-x Lax )(Zry Ti1-y )1-x/4 O3 系固溶体である。
【0048】
各シャッタ部に所定の電圧を印加し、各シャッタ部に入射する光の偏光状態を変えることにより、PLZT素子の光出射側の偏光板の偏光方向に振動する光のみが各シャッタ部から出射される。このとき、画像データに応じた時間だけ開状態となるように各シャッタ部をON/OFF駆動することにより、光源7からの光のうち画像データに応じた光量の光が各シャッタ部を介して印画紙Pに導かれる。
【0049】
上記した各シャッタ部のON/OFF駆動は、画像データに応じた露光データに基づいて行われる。この露光データは例えば0(OFF状態)から65535(ON状態)までの値となっており、シャッタタイムとも呼ばれるものである。上記画像データとして例えば0(黒)から255(白)までの256階調を考えた場合は、256階調の画像データのそれぞれが0から65535までのいずれかの露光データに対応付けられる。
【0050】
なお、画像データから露光データへの変換は、例えばLUT(ルックアップテーブル)によって行われる。このLUTは、後述する露光量調整処理において、用いる印画紙Pおよび処理液ごとに調整されることになる。
【0051】
レンズアレイ12は、露光ヘッド11の各シャッタ部を介して得られる光を印画紙Pの所定画素に集光させるものであり、複数のレンズを露光ヘッド11の各シャッタ部と対応するように主走査方向に1列もしくは2列で千鳥状に配置されて構成されている。上記のレンズは、例えば円筒状のガラスで構成され、中心部で最も屈折率が大きく、周縁部に向けて徐々に屈折率が小さくなるように構成された屈折率分布型のレンズであり、例えば日本板硝子社製のセルフォックレンズ(『セルフォック』は登録商標)で構成される。
【0052】
上記構成により、光源7から出射された光は調光フィルタ8において調光され、回転フィルタ9の所定の色フィルタを透過して光ファイバー束10に到達する。そして、光ファイバー束10を介して露光ヘッド11の各シャッタ部に供給された光は、当該シャッタ部でのシャッタタイムが画像データに応じてBGRごとに調整されることによってその透過光量がBGRごとに調整され、レンズアレイ12を介して印画紙Pに到達する。
【0053】
露光ヘッド11の各シャッタ部が主走査方向に形成されているので、印画紙Pを副走査方向に搬送しながら、回転フィルタ9の回転によってBGRの各色ごとに上記主走査方向の露光を行うことにより、印画紙Pには最終的に2次元のカラー画像が焼き付けられることになる。
【0054】
このようにして焼付部1での露光を終えた印画紙Pは、その後、現像部3に搬送され、印画紙Pに焼き付けられた画像が処理液によって現像される。そして、印画紙Pは乾燥部4において熱風の吹き付けによって乾燥された後、機外に排出される。
【0055】
次に、本発明の特徴である黒濃度判定処理について説明する前に、当該処理の前に行われる色調整処理である露光量調整処理について説明する。上記露光量調整処理は、用いる印画紙Pおよび処理液に応じた黒バランスが得られるようにBGRの各露光量(シャッタタイム)を調整する処理であり、濃度バランス記憶工程と露光量調整工程とを有している。
【0056】
濃度バランス記憶工程は、特性の異なる複数の印画紙Pと複数の処理液との各組み合わせに応じた黒バランス(YMCの濃度バランス)を装置の工場出荷前に予め記憶部に記憶させておく工程である。一方、露光量調整工程は、上記記憶部に記憶されたYMCの濃度バランスを用いて露光量を調整する工程である。
【0057】
なお、露光量調整工程は、通常であれば工場出荷後の装置において行われるものであるが、本実施形態では、印画紙Pおよび処理液の全組み合わせについて黒濃度判定に用いる閾値を予め求めておく必要があるため、工場出荷前に行われるものとなっている。以下、まず、濃度バランス記憶工程について説明する。
【0058】
(濃度バランス記憶工程)
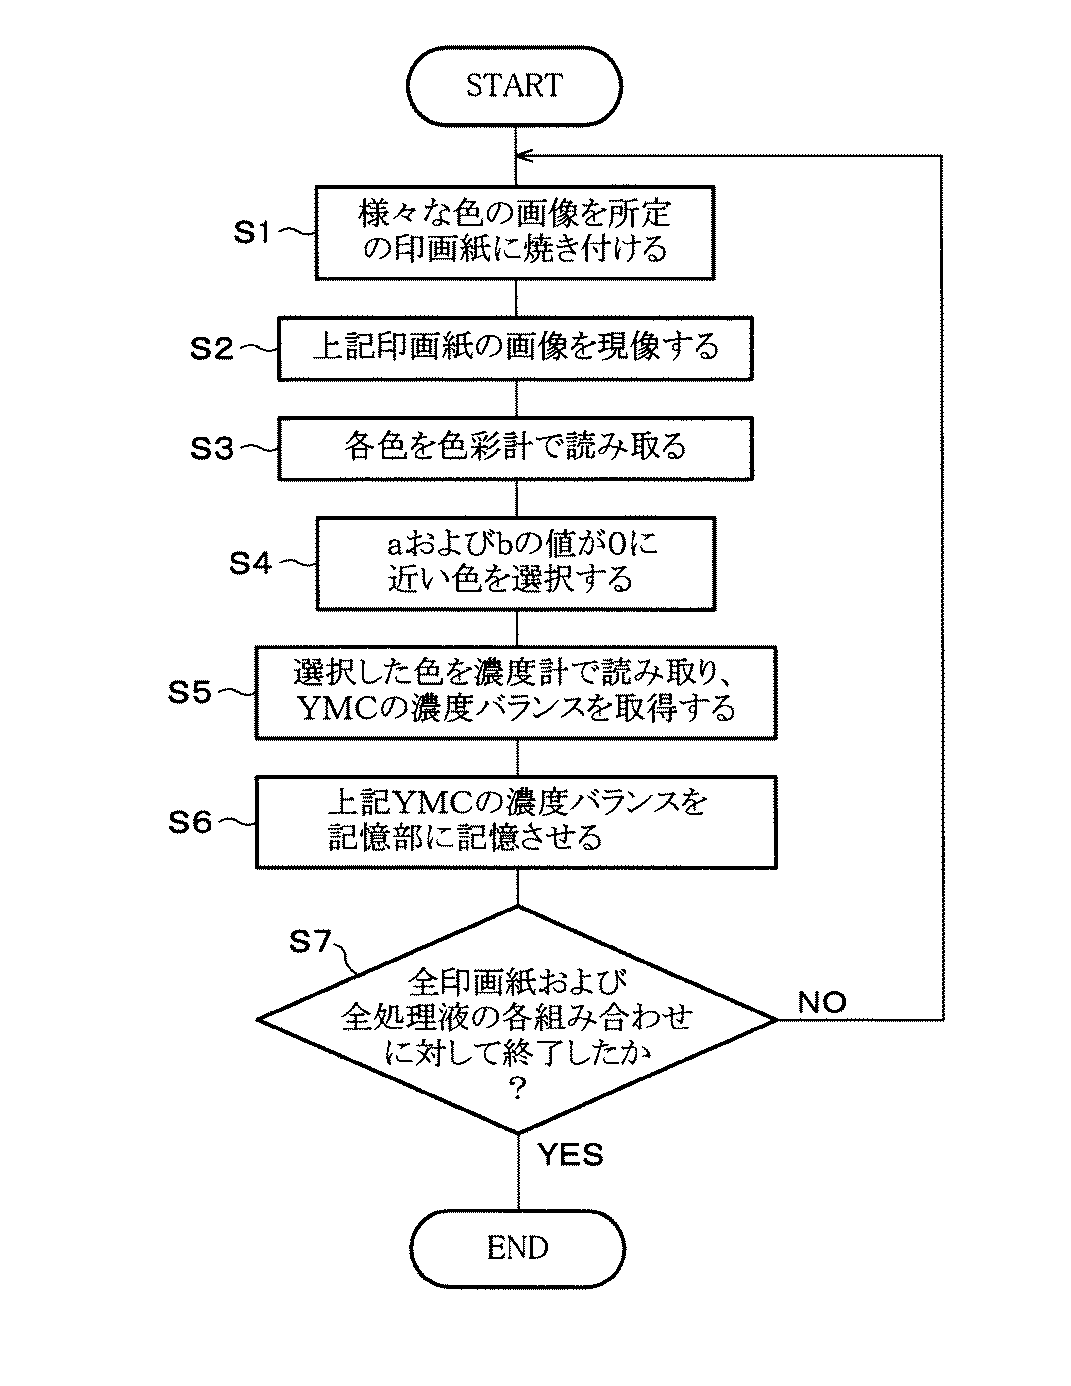
この工程は、図4のフローチャートに示すように、S1〜S7の工程からなっている。なお、この工程では、露光ヘッド11の各シャッタ部は全開状態(最も露光時間が長くなるような状態)に設定されている。
【0059】
まず、S1では、調光フィルタ8の各フィルタ位置を次のように変化させて、様々な色を所定の印画紙Pに焼き付け、S2にて、様々な色の画像を所定の処理液で現像する。
【0060】
調光フィルタ8のYMCのフィルタは、0(完全に光路外)から720(完全に光路中)までの位置に配置されることは上述の通りであるが、本工程では、そのうち、各フィルタ位置を例えば500から10ずつ増加させて600まで変化させ、その都度印画紙Pを露光するようにしている。
【0061】
つまり、例えばYおよびMのフィルタを500の位置に固定しておき、Cのフィルタを500、510、520、・・・600の位置に順に移動させて、その都度印画紙Pを露光する。そして、次に、Yのフィルタはそのままの位置で、Mのフィルタを510の位置に固定しておき、この状態でCのフィルタを上記と同様に500、510、520、・・・600の位置に順に移動させて、その都度印画紙Pを露光する。このような処理を、Mのフィルタが520、530、・・・600の位置においても同様に行う。そして、以上の処理を、Yのフィルタが510、520、・・・600の位置においても同様に行う。
【0062】
結局、上記の例では、上記YMCの各フィルタは、その組み合わせによって11×11×11=1331通りの位置に配置されることになる。各フィルタの位置ごとに各フィルタの光路中への挿入量は異なっているので、S1では、最終的に1331通りの色の画像が印画紙Pに焼き付けられ、S2では、これら1331色の画像が所定の処理液によって現像されることになる。
【0063】
なお、これら1331色の画像は、YMCの各フィルタを透過する量が比較的多いBGR光によって形成されるので、比較的高濃度の画像となっている。また、上記では各フィルタ位置を500から600まで変化させているが、この範囲に限定されるわけではなく、印画紙Pに高濃度の画像を複数色形成できるようにYMCの各フィルタを移動させればよい。
【0064】
次に、S3にて、現像された印画紙P上の各色を色彩計で読み取る。ここで、S3において色彩計を用いる理由は以下の通りである。
【0065】
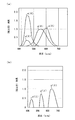
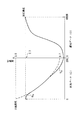
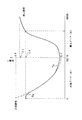
図5(a)は、人間の目に対応する分光感度特性を示している。なお、同図(a)において、x(λ)は主にRの波長域での分光感度特性を、y(λ)はGの波長域での分光感度特性を、z(λ)はBの波長域での分光感度特性をそれぞれ示している。また、縦軸の感度は、Gの波長域での最大感度を1.0とした場合に、他のBやRの波長域での感度を相対的に表している。
【0066】
一方、図5(b)は、濃度計の分光感度特性を示している。なお、同図(b)において、x’(λ)はRの波長域での分光感度特性を、y’(λ)はGの波長域での分光感度特性を、z’(λ)はBの波長域での分光感度特性をそれぞれ示している。また、縦軸の感度は、Rの波長域での最大感度を1.0とした場合に、他のBやGの波長域での感度を相対的に表している。同図(b)では、大きな感度に対応する波長域が同図(a)とは若干ずれていることが分かる。
【0067】
ここで、人間が色を知覚できるのは、BGRの光の3原色に対応した感覚(センサ)が人間の目にはある、つまり、同図(a)に示すようにBGRの各波長域に対応した大きな感度を人間の目が持っている、と考えることができるからである。したがって、人間の目に対応する分光感度とはずれた特性を有する濃度計で色を測定した場合には、人間の目に対応する分光感度の高い波長(BGR)を濃度計が感度よく認識できないために、人間が目で見て判断する結果とは若干異なる結果がYMC濃度として得られることになる。
【0068】
これに対して、色彩計は、図5(a)で示した人間の目に対応する分光感度とほぼ同一の感度を持つ3つのセンサを有しており、試料を測定した際には、BGRに対応した三刺激値を算出し、これらの値からL、a、bの各値を演算して出力するものである。なお、上記のLは明度を示し、aおよびbは色度(色相および彩度)を示す。
【0069】
ここで、以下の表2は、印画紙Aに焼き付けられ、処理液Aで現像された黒画像のYMC濃度およびLabの値と、印画紙Bに焼き付けられ、処理液Bで現像された黒画像のYMC濃度およびLabの値とを示している。
【0070】
【表2】
この表を見ても分かるように、印画紙Aおよび処理液Aの組み合わせAと、印画紙Bおよび処理液Bの組み合わせBとでは、YMC濃度はそれぞれほぼ同じような値となっているが、Labの値はばらついている。このことは、濃度計では組み合わせAとBとで色(濃度)の違いを判断できない場合であっても、色彩計では色の違いを確実に判断できることを意味する。したがって、人間の目と同じようなBGR感度を有する色彩計を用いることにより、人間の目とはBGR感度のずれた濃度計では得られない情報(濃度の微妙な違い)を確実に得ることができ、人間の目と同じような感覚で色の判断を適切に行うことができる。
【0072】
なお、S3では色彩計を用いているが、これ以外に例えば分光測色計(分光光度計)を用いることもできる。分光測色計は、複数(例えば40個)のセンサで試料から反射された光を分光し、各波長ごとの反射率を測定するものである。例えば、分光測色計にて得られたデータに基づいて演算部で積分計算を行い、BGRに対応した上記の三刺激値を算出すれば、これらの値から上記のL、a、bの各値を算出することができる。したがって、分光測色計を用いても、人間の目と同じような感覚で色の判断を適切に行うことができる。
【0073】
次に、S4にて、色度(aおよびbの値)が0もしくはこれに最も近い色を1個選択する。以下、この理由について説明する。
【0074】
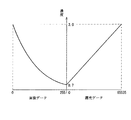
図6は、Lab表色系の色空間立体イメージを示している。同図において、a軸とb軸との交点から+aは赤方向、その反対方向は緑方向、+bは黄方向、その反対方向は青方向をそれぞれ示す。そして、ab平面において、a軸とb軸との交点からの距離が彩度を示し、上記交点を中心とする円の円周方向が色相を示す。また、L軸はab平面とは垂直方向に形成されており、a軸とb軸との交点から+Lは白方向、その反対方向は黒方向をそれぞれ示す。
【0075】
aおよびbの値が0もしくはこれに最も近い色を選ぶということは、図6の色空間でL軸になるべく近い色、すなわち、無彩色に近い色を選ぶということである。無彩色は、例えば青や赤への色の偏りのない色であり、また、無彩色でなくても、無彩色に近ければ近いほど色の偏りは少ない。したがって、無彩色もしくはこれに最も近い色の濃度バランスと同じ濃度バランスが黒画像において得られるように、後述する露光量調整工程にて露光量を調整すれば、当該黒画像における色の偏りをなくすことができると考えられる。したがって、このような濃度バランスを次のS5にて取得して、後述する露光量調整工程につなげるため、S4では、所定の印画紙Pに形成された複数色の画像から、aおよびbの値が0もしくはこれに最も近い色の画像を選択するようにしている。
【0076】
なお、S4において、aおよびbの値が完全な0ではなく、0もしくはこれに最も近い色を選択するとしたのは、実際には、プリント上でaおよびbがともに完全に0となる色を得ることが難しいからであるが、aおよびbの値が0となる色があれば、勿論その色を選択するようにすればよい。
【0077】
なお、S4では、aおよびbの最大値を60としたときに、aおよびbとして0±1以下の値を選択時の許容範囲とし、aおよびbがその範囲内にあるような色のうち、L軸に最も近い色を1個だけ選択するようにしている。
【0078】
続いて、S5では、S4にて選択した色を濃度計5で読み取ってYMCの各濃度値を取得すると共に、読み取ったYMCの各値からYMCの濃度バランスを取得し、S6にて、これを上記記憶部に記憶させる。
【0079】
例えば、S4にて選択した色のYMCの各濃度値が、それぞれ例えば2.0、2.2、2.3である場合には、Yを基準にして、M=Y+0.2、C=Y+0.3というYMCの濃度バランスを求め、S6にて上記濃度バランスを記憶部に記憶させる。
【0080】
なお、S6では、S5にて得られたYMCの各濃度値をそのまま記憶部に記憶させてもよいが、印画紙の発色特性や処理液の状態が経時的に微妙に変化するので、そのような経時的変化を起こした後でも上記色を再現できるように、上記各濃度値そのものよりも、YMC間での相対的な濃度バランスを記憶部に記憶しておくほうがよい。
【0081】
また、記憶部にYMCの各濃度値を記憶させる構成を採るのであれば、その後、上記各値からYMCの濃度バランスを算出するようにすればよい。とにかく、S4にて選択した色についてのYMCの濃度バランスが最終的に得られるようにすればよい。
【0082】
S6の後は、S7での判断により、全印画紙および全処理液の各組み合わせのそれぞれに対して終了するまで、以上のS1からS6の工程が繰り返し行われる。これにより、上記各組み合わせのそれぞれに対応するYMCの濃度バランスが記憶部に記憶される。
【0083】
(露光量調整工程)
次に、露光量調整工程について説明するが、その前に、本工程を行う際の前提となる条件について説明する。
【0084】
まず、図7に示すように、0から255までの256階調の画像データ(横軸)とそのときの濃度(縦軸)との関係を示す全装置に共通のグラフ(同図中、左半分のグラフ;以下、第1のグラフと記載する)と、0から65535までの露光データ(横軸)とそのときの濃度(縦軸)との関係を示すグラフ(同図中、右半分のグラフ;以下、第2のグラフと記載する)とが最初から得られているものとする。
【0085】
なお、図7の第1のグラフおよび第2のグラフは、横軸としてBを考えている場合には縦軸としてYを、横軸としてGを考えている場合には縦軸としてMを、横軸としてRを考えている場合には縦軸としてCを考えるものとする。YMCの各色は、印画紙PにBGRの各光を照射することによってそれぞれ発色するからである。つまり、図7に示す逆T字の軸を持つグラフは、B−Y、G−M、R−Cについての3通りが得られているものとする。また、第1のグラフおよび第2のグラフともに、最高濃度および最低濃度は、YMCとも例えば3.0および0.7であるとする。
【0086】
このような第1のグラフおよび第2のグラフが予め用意されているのは、露光ヘッド11を駆動するためには、BGRの各画像データに対応する露光データを求める必要があるからである。本実施形態の装置は、このようなグラフを、各階調の画像データに対応する露光データを求めるためのLUTとして備えている。
【0087】
また、最初に与えられる第2のグラフでは、露光データと濃度との関係が線形となっており、後述するS11にて最初にグレースケールを印画紙Pに焼き付ける場合にのみ、この第2のグラフが利用される。そして、以下に示す露光量調整処理を行うごとに、上記グラフとは形状の異なる第2のグラフがその都度得られるようになっている。
【0088】
また、露光量調整工程を行う前には、露光ヘッド11からの漏れ光が印画紙Pに到達するのを防ぐことができるような位置に調光フィルタ8のYMCの各フィルタを配置するデイリーセットアップが行われているものとする。
【0089】
次に、本実施形態の露光量調整工程について説明する。本工程は、図8のフローチャートに示すS11〜S16の各工程からなっている。
【0090】
まず、S11では、例えば18階調のグレースケール(無彩色のみによる18段階のグラデーション)を所定の印画紙Pに焼き付ける。より具体的には、BGRのそれぞれについて、0から255までの画像データを例えば18段階に分け、図7の第1のグラフおよび第2のグラフより、各階調の画像データに対応する露光データをBGRごとに求める。そして、各段階に対応する露光データでBGRの各露光を行うことにより、グレースケールを印画紙Pに焼き付ける。
【0091】
そして、S12にて、上記グレースケールを所定の処理液で現像する。その後、S13にて、上記グレースケールの各階調のYMC濃度を濃度計5にて読み取る。
【0092】
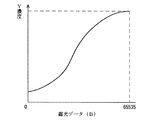
続いて、S14では、横軸に露光データを、縦軸に濃度をとって、各階調における露光データと濃度とをプロットする。このとき、横軸にBの露光データをとったときは縦軸にY濃度をとり、横軸にGの露光データをとったときは縦軸にM濃度をとり、横軸にRの露光データをとったときは縦軸にC濃度をとる。図9は、例えばBの露光データとY濃度とをプロットしたものを示している。そして、各点の間を補間して図10に示すようなグラフをBGRごとに求め、これを上記第2のグラフとしてそれぞれ更新する。以下、この第2のグラフの求め方について具体的に説明する。
【0093】
露光データをx、プリントを濃度計5で計った濃度値をyとし、yをxの関数として考えると、濃度計5で測定した値はその関数上にあると考えられる。そして、0〜65535までの間の全ての露光データに対するプリント濃度を知るためには、測定できた点(本実施形態では18個)からデータとして存在しない部分を補間しなければならない。しかし、全ての点を通る1つの近似曲線を求めることは困難なので、それぞれの点と点の間の区間を個別の曲線を使って補間する。しかも、各点の間を補間する曲線が滑らかにつながるようにする。
【0094】
例えば、図11に示すように、隣り合う4点をP1 、P2 、P3 、P4 とすると、P2 −P3 間の曲線が滑らかにつながるようにするためには、P2 −P3 間の曲線が以下の4つの条件を満たさなければならない。
【0095】
▲1▼点P2 を通る。
【0096】
▲2▼点P3 を通る。
【0097】
▲3▼点P2 での傾きが、P1 −P2 間の曲線の点P2 での傾きに一致する。
【0098】
▲4▼点P3 での傾きが、P3 −P4 間の曲線の点P3 での傾きに一致する。
【0099】
点P2 ・P3 での傾きが決まっていると、上記▲1▼〜▲4▼の条件から一意に3次関数の式を求めることができるので、P2 −P3 間の関数は3次関数として扱う。
なお、点P2 ・P3 での傾きは、連続する3点から算出する。つまり、点P2 での傾きは、直線P1 P3 の傾きを使い、点P3 での傾きは、直線P2 P4 の傾きを使う。
【0100】
点P2 、P3 の座標を(x2 ,y2 )、(x3 ,y3 )とし、点P2 、P3 での傾きをm2 、m3 とする。求める関数をy=ax3 +bx2 +cx+dとすると、上記▲1▼〜▲4▼の条件より、以下の式が得られる。
【0101】
y2 =ax2 3+bx2 2+cx2 +d
y3 =ax3 3+bx3 2+cx3 +d
m2 =3ax2 2+2bx2 +c
m3 =3ax3 2+2bx3 +c
以上の式をa、b、c、dについて解くと、a、b、c、dは以下のように表される。
【0102】
【0103】
なお、両端(露光データ0および65535)での傾きは、端から2つ目の点の傾きに、その点の両隣を結んだ直線の傾きの比をかけたものとする。例えば点P1 が端点の場合、P1 での傾きは、
P1 での傾き=P2 での傾き×(直線P1 P2 の傾き/直線P2 P3 の傾き)とする。
【0104】
なお、BGRのそれぞれについて同じ露光データで印画紙Pを露光しても、印画紙Pの感度等により発色する濃度が互いに異なる。したがって、図10に示す曲線としては、BGRのそれぞれについて異なる特性が得られる。
【0105】
次に、S15にて、上記記憶部から、用いた印画紙Pおよび処理液に対応するYMCの濃度バランスを読み出す。そして、S16にて、最高濃度(黒)の画像において、読み出したYMCの濃度バランスが得られるように、かつ、発色できない濃度を目標にしないように、BGRに対応する各第1のグラフの最高濃度付近を変形する。そして、変形後の第1のグラフと、S14にて求めた第2のグラフとに基づいて、256階調の画像データに対応する露光データを求めるためのLUTをBGRごとに再作成する。
【0106】
以下、上記第1のグラフの変形について説明する。なお、説明の理解をしやすくするため、以下では、変形前の第1のグラフ(最初から用意されている第1のグラフ)とS14にて求めた第2のグラフとの濃度スケールを統一したグラフ(図12参照)を考えて第1のグラフを変形する場合を考える。
【0107】
なお、このグラフでは、横軸にBについての画像データおよび露光データをとり、縦軸にYの濃度をとっているが、横軸にGについての画像データおよび露光データをとり、縦軸にMの濃度をとったグラフ、および、横軸にRについての画像データおよび露光データをとり、縦軸にCの濃度をとったグラフについても、以下の考え方を適用することができる。
【0108】
まず、BGRの各色について、S14にて求めた第2のグラフから、最大シャッタタイムで露光したときのYMC濃度を求める。この結果、上記YMC濃度が、例えば、Y=2.2、M=2.3、C=2.7であったとする。
【0109】
ここで、S15にて記憶部から読み出した、用いた印画紙Pおよび処理液に対応するYMCの濃度バランスが、M=Y+0.2、C=Y+0.3であるとする。この場合、Cを基準にしてYおよびMの最高濃度を考えると、Y=C−0.3=2.4、M=Y+0.2=2.6となり、YおよびMのいずれにおいても、最大シャッタタイムでも発色できない濃度となる(Y=2.2、M=2.3を越えているため)。したがって、このような濃度を出すことは不可能であるので、Cを基準にしてYおよびMの最高濃度を考えることはできない。
【0110】
また、Yを基準にしてMおよびCの最高濃度を考えた場合でも、M=Y+0.2=2.4、C=Y+0.3=2.5となり、Mの濃度が最大シャッタタイムでも発色できない濃度となる(M=2.3を越えているため)。したがって、このような濃度を出すことはやはり不可能であるので、Yを基準にしてMおよびCの最高濃度を考えることはできない。
【0111】
一方、Mを基準にしてYおよびCの最高濃度を考えた場合は、Y=M−0.2=2.1、C=Y+0.3=2.4となり、YおよびCのいずれにおいても、最大シャッタタイムに対応する最高濃度を下回る。したがって、この例では、Mを基準にしてYおよびCの最高濃度を考え、黒画像において、すなわち、画像データ値が0の場合に、Y=2.1、M=2.3、C=2.4を発色できるように、BGRの各第1のグラフの最大濃度付近(画像データ値0付近)を変形する。上記YMC濃度は、発色の目標とされる濃度であることから、以下では、上記YMC濃度のことを目標濃度と呼ぶことにする。
【0112】
次に、第1のグラフの実際の変形の仕方について説明する。
【0113】
上記のようにしてYの目標濃度が決定されると、図13に示すように、画像データ値0における目標濃度となる点aの位置が決定される。そこで、まず、点aに対する一定の濃度範囲bを考慮して、第1のグラフにおける変形点cを決定する。上記濃度範囲bは、オペレータによって自由に設定することができる値であるが、本実施形態では、例えば、点aに対応する濃度(目標濃度)と第1のグラフにおける最低濃度(0.7)との間を100%としたときに、その5%の範囲に設定されている。なお、上記の5%は一例であり、この数値に限定されるわけではない。
【0114】
このようにして変形点cを求めると、次に、点a−c間が滑らかに結ばれ、かつ、変形前の元の第1のグラフと変形点cにおいて滑らかにつながるように、点a−c間の曲線SB を求める。この曲線SB を求めるための条件は、以下の通りである。
【0115】
▲1▼点aを通る。
【0116】
▲2▼変形点cを通る。
【0117】
▲3▼変形後の第1のグラフの変形点cでの傾きが、変形前の第1のグラフの変
形点cでの傾きと一致する。
【0118】
▲4▼単調に減少(増加)する。
【0119】
このような条件を考えることにより、点a−c間および変形点cをまたぐ区間の画像データに対応する濃度を滑らかに変化させることができ、滑らかな階調変化を出すことが可能となる。上記▲1▼〜▲4▼の条件を満たす関数としては、以下の式で表される関数を用いることができる。
【0120】
【数1】
ただし、ya;点aでの濃度(目標濃度)
yc;変形点cでの濃度
xa;点aでの画像データ値(0)
xc;変形点cでの画像データ値
ma;点aでの傾き
曲線SB が求まれば、元の第1のグラフの点a−c間の部分を、求めた曲線SB と置き換えることにより、元の第1のグラフを変形した結果(同図の実線部分)を得ることが可能となる。
【0122】
なお、図13では、第1のグラフにおける点a−c間の高濃度部のみならず、低濃度部をも変形している。より詳細には、第1のグラフの低濃度部において、画像データ値255に対応するY濃度と、露光データ値0に対応するY濃度とが一致すると共に、変形点において第1のグラフと滑らかにつながるような曲線TB を求め、第1のグラフにおける低濃度部をこの曲線TB に置き換えている。これは、印画紙Pを白から滑らかに発色させるようにするためである。この曲線TB を求める際にも、上述した曲線SB の求め方を適用することができる。なお、本実施形態では、点aに対応する濃度(目標濃度)と変形前の第1のグラフにおける最低濃度との差を100%としたときに、例えば低濃度部側15%を変形するようにしているが、この数値に限定されるわけではない。
【0123】
以上では、主にBについての第1のグラフを変形する場合について説明したが、GやRについての第1のグラフを変形する場合についても同様である。この結果、図14および図15に示すように、GやRについて変形後の第1のグラフ(実線部分)を得ることが可能である。なお、図14は、Gについての第1のグラフの高濃度部および低濃度部を、曲線SG および曲線TG によって置き換えたものを示し、図15は、Rについての第1のグラフの高濃度部および低濃度部を、曲線SR および曲線TR によって置き換えたものを示している。曲線SG およびSR は曲線SB と同様に求めることができ、曲線TG およびTR は曲線TB と同様に求めることができる。
【0124】
このようにして変形後の第1のグラフをBGRのそれぞれについて求めると、BGRのそれぞれについて変形後の第1のグラフおよびS14にて求めた第2のグラフ、すなわち、図13ないし図15に示す逆T字状の軸で表される実線のグラフに基づいて、0から255までの256階調の画像データに対応する露光データを求めることができる。
【0125】
最終的には、変形後の第1のグラフおよびS14にて求めた第2のグラフに基づいて、各階調の画像データを入力とし、各階調の画像データに対応する露光データを出力とするLUTがBGRごとに再作成される。図16の左下(第3象限)のグラフは、そのような出力LUTを示している。この出力LUTにおける所定の画像データに対応する露光データf1 は、第2のグラフで上記画像データと対応する露光データf2 と互いに等しいものとなっている。
【0126】
なお、図16において右下(第4象限)のグラフは、露光時のLUTを示している。この露光時のLUTとは、S11にて18階調のグレースケールを印画紙Pに焼き付けるときのみに利用されるものであり、図7の第1のグラフおよび第2のグラフに基づいて得られるものである。すなわち、露光時のLUTは、図7の第1のグラフにおける各階調の画像データを入力とし、各階調の画像データと図7の第2のグラフで対応する露光データを出力とするLUTである。この露光時のLUTを調整することにより、18段階のプロットした点の間隔は変わるが、この曲線の形は大きく変わるわけではない。
【0127】
このように、濃度バランス記憶工程において、特性の異なる複数の印画紙Pと複数の処理液との各組み合わせごとに、黒に対応するYMCの濃度バランスを予め記憶部に格納しておき、露光量調整工程では、用いる印画紙Pおよび処理液に応じた濃度バランスを上記記憶部から読み出し、上記濃度バランスが上記印画紙P上の黒画像において得られるように印画紙Pの露光量を調整している。したがって、用いる印画紙Pおよび処理液の種類がどのようなものであっても、用いる印画紙Pおよび処理液の組み合わせに応じた濃度バランスに基づいて印画紙Pの露光量を調整することになり、印画紙Pおよび処理液の各組み合わせのそれぞれについて、印画紙P上の黒を適切に表現することが可能となる。
【0128】
次に、本発明の特徴である黒濃度判定処理について説明する。黒濃度判定処理は、上記露光量調整処理によって色調整された後のシャッタタイムで所定の印画紙Pを露光し、所定の処理液で現像した結果、許容可能な黒濃度が出ているか否かを判定する処理であり、閾値記憶工程と実判定工程とからなっている。
【0129】
閾値記憶工程は、用いる印画紙Pおよび処理液に応じた黒濃度が出ているか否かの判断基準となる閾値を予め上記記憶部に記憶させておく工程であり、装置の工場出荷前に1回行われる。一方、上記の実判定工程は、上記記憶部に記憶された閾値を用いて、実際に印画紙Pに焼き付けられ、現像された黒画像の濃度が、用いる印画紙Pおよび処理液に応じて出ているか否かを実際に判定する工程であり、装置の工場出荷後、例えばデイリーセットアップとして行われる。以下、まず、閾値記憶工程について説明する。
【0130】
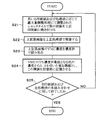
(閾値記憶工程)
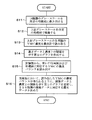
この工程は、図1のフローチャートに示すように、S21〜S25の工程からなっている。
【0131】
まず、S21では、上記した露光量調整処理にて、用いる印画紙Pおよび処理液に応じて調整されたシャッタタイムで黒の画像を上記印画紙Pに焼き付ける。そして、S22では、上記印画紙Pに焼き付けられた黒画像を上記処理液で現像する。
【0132】
続いて、S23では、上記黒画像のYMCの各濃度値を濃度計5にて読み取る。そして、S24では、YMCのうち一番低い濃度値から例えば0.1を引いた値を閾値に設定し、この閾値を上記記憶部に記憶させる。例えば、S23にて得られたYMCの各濃度値がそれぞれ、2.4、2.3、2.5であるとすると、S24では、最低濃度であるMの濃度値2.3から0.1を引いた2.2に閾値が設定され、記憶部に記憶される。
【0133】
なお、露光ヘッド11の仕様は、ある特定の印画紙Pおよび処理液を使って濃度調整された状態でプリントしたときの最高濃度(画像データ0で焼き付けられた黒の濃度)がYMCのうち最小となる色について、その濃度が例えば2.2以上となっている。黒画像における最低濃度が仕様値ぎりぎりの2.2となっている場合は、上記閾値としては2.2−0.1=2.1に設定される。
【0134】
なお、閾値を決める際に、最低濃度から引く値は、上記の0.1に限定されるわけではないが、この値が小さければ小さいほど、濃度低下を厳しく管理できることになる。
【0135】
そして、S25での判断により、以上のS21からS24の工程が、全印画紙および全処理液の各組み合わせのそれぞれに対して終了するまで、繰り返し行われる。したがって、閾値記憶処理では、全印画紙および全処理液の各組み合わせのそれぞれに対応する閾値が記憶部に記憶される。
【0136】
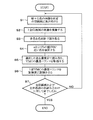
(実判定工程)
この工程は、図17のフローチャートに示すように、S31〜S36の工程からなっている。
【0137】
まず、S31では、上述の露光量調整処理にて得られる、所定の印画紙Pおよび所定の処理液に対応する黒のシャッタタイム(画像データ0に対応する露光データ)で、上記印画紙Pに黒の画像を焼き付ける。そして、S32にて、上記黒画像を上記処理液で現像する。なお、S31では、上記黒画像を含む例えば18階調のグレースケールを焼き付け、S32ではこのグレースケールを現像するようにしても構わない。
【0138】
続いて、S33では、印画紙P上の上記黒画像のYMCの各濃度値を濃度計5にて読み取る。そして、S34では、上記記憶部から、上記印画紙Pおよび上記処理液に対応する閾値を読みだす。
【0139】
S35では、S33にて得られたYMCの各濃度値のうち最低となる色の濃度が、S34にて読み出した閾値以上であるか否かを判断する。ここで、黒画像における上記最低濃度が上記閾値以上である場合には、上記黒画像の濃度は適切なものと判断して処理を終了する。
【0140】
一方、S35にて、上記最低濃度が上記閾値を下回ったと判断した場合は、S36にて、各部の調整を行うよう警告を発し(S36)、その後、S31に戻って上記した処理を繰り返す。
【0141】
ここで、各部の調整としては、▲1▼処理液のチェック、▲2▼調光フィルタ8のYMCの各フィルタの位置の再設定、▲3▼光源7および露光ヘッド11の清掃、などがある。上記処理液のチェックとは、処理液の酸性度をチェックするための試験紙を処理液に浸すことで、処理液の酸性度が適切であるか否かを判断する処理である。上記処理液が不適切であると判断した場合には、上記処理液の張り替えを行う。また、YMCフィルタ位置の再設定とは、YMCの各フィルタ位置を再度微調整して露光ヘッド11において漏れ光が生じないような位置を再度見つけ、その位置にYMCの各フィルタを再配置することを言う。
【0142】
YMCの各フィルタの位置の再設定や、光源7および露光ヘッド11の清掃を行い、その後、濃度判定を再度行っても、黒画像におけるYMCの最低濃度が上記閾値を下回る場合には、光源7および露光ヘッド11を交換することになる。
【0143】
以上のように、本発明では、用いる印画紙Pおよび処理液の組み合わせごとに、黒濃度を判定する際の基準となる閾値を予め記憶部に記憶させておき、用いる印画紙Pおよび処理液の組み合わせごとに、色調整後の黒濃度を上記閾値を用いて判断するようにしている。これにより、黒画像におけるYMC濃度の低下を、上記組み合わせごとに確実に認識し、判断することができる。したがって、黒濃度の低下が検知された場合には、上記した各部の調整を行うことにより、印画紙P上に形成される黒画像の時間経過に伴う画像品位の低下を、上記各組み合わせごとに確実に回避することができる。
【0144】
また、黒画像におけるYMCの各濃度値のうち、濃度低下によって一番黒画像の画質を損ないやすい最低の濃度値に基づいて、上記各組み合わせごとに閾値を設定しているので、黒画像の画質低下を上記各組み合わせごとに確実に回避することができる。
【0145】
さらに、閾値を決める際に用いる黒画像は、予め適切な黒が出るように調整された露光量で印画紙Pに焼き付けられ、処理液によって現像された黒画像となっているので、上記黒画像は、上記印画紙Pおよび上記処理液に応じた黒に対応するYMCの濃度バランスを有するようになる。したがって、その後、この黒画像に基づいて閾値を設定し、この閾値を用いて黒濃度の判定を行うので、黒画像が適切な黒で表現されているか否かを確実に判定することができる。
【0146】
また、本実施形態のように最低濃度−0.1という厳しい条件で閾値を設定して黒濃度の判定を行うことにより、黒濃度の低下を厳しく管理することができる。これにより、印画紙Pには、常に良好な黒画像を形成することができる。
【0147】
なお、本実施形態では、露光ヘッド11をPLZT露光ヘッドで構成した場合について説明したが、例えばLCD、LCS、DMD等、時間制御により光量を調節してデジタル露光を行う光変調素子で構成した場合でも、本発明を適用することが可能である。
【0148】
【発明の効果】
請求項1の発明に係る黒濃度判定方法は、以上のように、黒濃度判定を行う際の基準となる閾値を、特性の異なる複数の感光材料と複数の処理液との各組み合わせに対応して求め、各閾値を記憶部に記憶させる第1の工程と、所定の感光材料に黒画像を焼き付け、この黒画像を所定の処理液で現像する第2の工程と、上記黒画像の濃度値を測定する第3の工程と、上記所定の感光材料と上記所定の処理液との組み合わせに対応する閾値を上記記憶部から読み出す第4の工程と、上記黒画像の濃度値と上記読み出した閾値との大小関係に基づいて、上記黒画像の濃度の良否を判定する第5の工程とを有している構成である。
【0149】
それゆえ、感光材料および処理液の各組み合わせに対応した閾値を用いて黒濃度判定を行うので、用いた処理液の特性低下により、黒画像の濃度が低下した場合でも、上記各組み合わせのそれぞれに応じた濃度判定を行うことが可能となる。つまり、上記のように感光材料および処理液の各組み合わせごとに閾値を設定した場合には、黒画像の濃度の低下量を上記各組み合わせごとに管理することが可能となり、上記各組み合わせごとに適切な濃度判定を行うことが可能となる。
【0150】
したがって、濃度不良と判定した場合には、その後、例えば処理液の交換などの警告を作業者に発することにより、黒画像ひいては画像全体の品位が低下するのを上記各組み合わせごとに確実に回避することが可能となるという効果を奏する。
【0151】
請求項2の発明に係る黒濃度判定方法は、以上のように、請求項1の構成において、上記第1の工程は、所定の感光材料に黒画像を焼き付け、この黒画像を所定の処理液で現像する工程(a)と、上記黒画像のYMCの各濃度値を測定する工程(b)と、上記YMCの各濃度値のうち最低となる濃度値に基づいて閾値を設定し、上記閾値を記憶部に記憶させる工程(c)と、上記工程(a)ないし(c)を、上記各組み合わせのそれぞれに対して行う工程(d)とを有している構成である。
【0152】
それゆえ、黒画像のYMCの各濃度値のうち、濃度低下によって一番黒画像の画質を損ないやすい最低の濃度値に基づいて、上記各組み合わせごとに閾値が設定されるので、黒画像の画質低下を上記各組み合わせごとに確実に回避することができるという効果を奏する。
【0153】
請求項3の発明に係る黒濃度判定方法は、以上のように、請求項2の構成において、上記工程(a)では、用いる感光材料および処理液に応じた、黒に対応するYMCの濃度バランスが上記黒画像において得られるようなBGRの露光量で感光材料を露光することにより上記黒画像を感光材料に焼き付ける構成である。
【0154】
それゆえ、用いる感光材料および処理液に応じた黒に対応するYMCの濃度バランスを有する黒画像に基づいて閾値を設定し、この閾値を用いて黒濃度の判定を行うので、黒画像が適切な黒で表現されているか否かを確実に判定することができるという効果を奏する。
【図面の簡単な説明】
【図1】本発明に係る黒濃度判定方法の閾値記憶工程における動作の流れを示すフローチャートである。
【図2】本実施形態で用いた写真処理装置の概略の構成を示す説明図である。
【図3】上記写真処理装置が備える露光部の概略の構成を示す斜視図である。
【図4】黒濃度判定の前に行われる濃度バランス記憶工程における動作の流れを示すフローチャートである。
【図5】(a)は、人間の目に対応する分光感度特性を示すグラフである。(b)は、濃度計の分光感度特性を示すグラフである。
【図6】Lab表色系の色空間の立体的イメージを示す説明図である。
【図7】予め設定された画像データと濃度との関係、および、濃度と露光データとの関係を示すグラフである。
【図8】黒濃度判定の前に行われる露光量調整工程における動作の流れを示すフローチャートである。
【図9】18段階のBGRの画像データに対応する露光データに基づいてグレースケールを印画紙に焼き付けた後、各階調のYMC濃度を測定したときの、Bの露光データとY濃度との関係を座標軸上にプロットして示す説明図である。
【図10】上記プロットした各点を補間して得られるグラフである。
【図11】上記補間方法を説明するためのものであり、プロットした2点を滑らかに結ぶ曲線を求める手法を説明するための説明図である。
【図12】変形前の第1のグラフと更新された第2のグラフとを濃度スケールを統一して示すグラフである。
【図13】Bの画像データおよび露光データとY濃度との関係を示す第1のグラフの変形前後の形状を示す説明図である。
【図14】Gの画像データおよび露光データとM濃度との関係を示す第1のグラフの変形前後の形状を示す説明図である。
【図15】Rの画像データおよび露光データとC濃度との関係を示す第1のグラフの変形前後の形状を示す説明図である。
【図16】変形前後における第1のグラフと、更新した第2のグラフと、変形後の第1のグラフと上記第2のグラフとに基づいて得られる出力LUTと、グレースケールを印画紙に焼き付ける際に利用される露光時のLUTとを示す説明図である。
【図17】本発明に係る黒濃度判定方法の実判定工程における動作の流れを示すフローチャートである。
【符号の説明】
6 露光部
P 印画紙(感光材料)[0001]
BACKGROUND OF THE INVENTION
In the present invention, the density of the black image is determined according to the photographic paper and the developing processing solution (hereinafter referred to as processing solution) to be used in order to avoid deterioration of the image quality of the black image formed on the photographic paper as the photosensitive material. The present invention relates to a black density determination method for determining whether or not is appropriate.
[0002]
[Prior art]
Conventionally, image printing by digital exposure is generally known in the field of photographic processing. In this digital exposure, each pixel of the exposure head is driven based on image data obtained by reading an image recorded on a photographic film (eg, a negative film) with a scanner or image data obtained by photographing with a digital camera. In this method, an image corresponding to the image data is printed on the photographic paper by irradiating the photographic paper with light obtained through each pixel.
[0003]
Here, the exposure unit of the photographic processing apparatus that performs the above digital exposure will be briefly described with reference to FIG. 3 which is a configuration diagram of the apparatus to which the method of the present invention is applied. This type of photographic processing apparatus includes a light source 7, a
[0004]
The light source 7 is composed of, for example, a halogen lamp. The
[0005]
The
[0006]
The
[0007]
That is, in the above configuration, the light emitted from the light source 7 is dimmed by the
[0008]
Therefore, the
[0009]
The image thus baked on the photographic paper P is then developed with a developing processing solution (hereinafter simply referred to as processing solution) in a developing unit (not shown) of the photographic processing apparatus. The developed photographic paper P is dried by blowing, for example, hot air in a drying unit (not shown), and then discharged to the outside as a print image.
[0010]
By the way, as a factor that affects the quality of a printed image, there is a black appearance. This is because a print with more reliable black appears to tighten the entire image, and the image has a sharp edge.
[0011]
Therefore, conventionally, when the
[0012]
For example, in a black image which is developed by printing on photographic paper with a combination of two types of photographic papers A and B and two types of processing liquids A and B, the density of Y with respect to Y is determined from the density of Y and M in each black image. Is obtained in the range shown in Table 1 below.
[0013]
[Table 1]
In this case, the G light that causes M to develop color so that the relative density of M with respect to Y falls within the range common to the above combinations, that is, the relative density of M falls within the range of Y + 0.2 to Y + 0.3. The shutter time when exposing is adjusted. Similarly, if the relative density of C with respect to Y is known for each of the above combinations, the shutter time of the R light that develops C is adjusted so that the relative density of C falls within the common range in each of the above combinations. Is done. Further, for example, if the relative density of Y with respect to M shown in Table 1 is determined for each combination, the relative density of Y falls within a common range in each of the above combinations. It is possible to adjust the shutter time of the B light that develops Y.
[0015]
However, even if each shutter time of BGR corresponding to black is adjusted as described above, the processing liquid in the developing unit is oxidized with time, and the characteristics gradually deteriorate. Therefore, the processing liquid is developed with the processing liquid. The black balance of the image will be lost over time. Further, this breaking method differs depending on the type of photographic paper P to be used.
[0016]
Therefore, conventionally, in a black image after adjusting the black balance, each density of YMC is read with a densitometer, and if the density of the color having the lowest density falls below a threshold value, the processing liquid is replaced. A warning is issued to prevent the black image quality from deteriorating over time. At this time, the threshold value is a common value for each combination of all photographic paper and all processing liquids.
[0017]
For example, a combination of photographic paper A and processing liquid A is combination A, and a combination of photographic paper B and processing liquid B is combination B. As the YMC concentrations corresponding to appropriate black, 1.9, 2.0, and 2.1 are obtained for combination A, and 2.4, 2.3, and 2.5 are obtained for combination B, respectively. Assuming that the threshold value is set to 1.7 in common for each of the combinations, in the combination A, the Y density 1.9 which is the lowest density among the YMCs and the threshold value 1.7 are set. In the combination B, the magnitude relationship between the density M of 2.3 which is the lowest density of YMC and the threshold value 1.7 is judged. In these examples, a warning is not issued because all of the objects to be compared with the threshold value are above the threshold value, but a warning is issued if the comparison object falls below the threshold value due to a change in the characteristics of the treatment liquid over time. Will be emitted.
[0018]
[Problems to be solved by the invention]
By the way, in the case where a common threshold is provided for each combination of all photographic paper and all processing liquids as described above, in order to perform density determination for all combinations using this threshold, the threshold is set to the most colored. It will be necessary to match the combination of low-capacity photographic paper and processing liquid. Therefore, for example, when photographic paper and processing liquid having a high coloring ability are used, even if the YMC density of the black image falls extremely within a range that does not fall below the threshold value, a predetermined warning is not given.
[0019]
In the above example, assuming that in the combination B, the YMC concentrations corresponding to appropriate black are 2.1, 2.0, and 2.2, respectively, due to the deterioration of the characteristics of the processing liquid B. The minimum density 2.0 is higher than the threshold value 1.7, and in this comparison, the above condition is temporarily cleared. In this case, however, no warning is issued even though the minimum density 2.0 is considerably lower than the initial minimum density 2.3.
[0020]
As described above, in the conventional method for determining the quality of the black image density on the photographic paper by setting a common threshold value for each combination of all the photographic paper and all the processing liquids, the black density determination is performed for each combination. It cannot be done properly. As a result, even if the density of the black image becomes inadequate, the state continues for a while, and there arises a problem that the quality of the black image and thus the entire image is lowered.
[0021]
The present invention has been made to solve the above-mentioned problems, and its purpose is to appropriately set the density of the black image formed on the photographic paper for each combination of photographic paper and processing liquid to be used. An object of the present invention is to provide a black density determination method capable of making a determination and reliably avoiding a decrease in image quality due to the determination.
[0022]
[Means for Solving the Problems]
In order to solve the above-described problem, the black density determination method according to the first aspect of the present invention sets a threshold value used as a reference for performing the black density determination for each of a plurality of photosensitive materials having different characteristics and a plurality of processing solutions. A first step for obtaining a threshold value corresponding to the combination and storing each threshold value in a storage unit; a second step for printing a black image on a predetermined photosensitive material; and developing the black image with a predetermined processing solution; A third step of measuring a density value of the image, a fourth step of reading out a threshold value corresponding to a combination of the predetermined photosensitive material and the predetermined processing solution from the storage unit, and a density value of the black image And a fifth step of determining whether the density of the black image is good or not based on the magnitude relationship with the read threshold value.
[0023]
According to the above configuration, the threshold value, which is a reference for determining the density of a black image, is obtained corresponding to each combination of a plurality of photosensitive materials having different characteristics and a plurality of processing solutions. As the threshold value for each combination, for example, the YMC of the black image obtained by printing a black image on a predetermined photosensitive material with an exposure adjusted so as to produce good black and developing it with a predetermined processing solution. When the density is considered, a value obtained by subtracting a predetermined value from the lowest density among these can be considered. Each threshold value is stored in the storage unit.
[0024]
In the above configuration, a black image is printed on a predetermined photosensitive material, and the density value (for example, YMC density value) of a black image obtained by developing the black image with a predetermined processing solution is measured. A threshold value corresponding to a combination of treatment liquids is read from the storage unit, and the density of the black image is determined based on the magnitude relationship between the density value of the black image and the read threshold value.
[0025]
In this density determination, a threshold value corresponding to each of the above combinations is used. Therefore, even when the density of the black image is decreased due to a decrease in the characteristics of the processing liquid used, the density determination corresponding to each of the above combinations is performed. Is possible. In other words, when the threshold value is set for each combination of the photosensitive material and the processing solution as described above, it is possible to manage the amount of decrease in the density of the black image for each combination. It is possible to perform accurate density determination.
[0026]
Therefore, when it is determined that the density is poor, a warning such as replacement of the processing liquid is then issued to the operator, thereby reliably avoiding the deterioration of the quality of the black image and the entire image for each of the above combinations. It becomes possible.
[0027]
According to a second aspect of the invention, in order to solve the above-described problem, in the black density determination method according to the first aspect, in the first step, the first step is to print a black image on a predetermined photosensitive material. The threshold value is set based on the step (a) of developing with a predetermined processing solution, the step (b) of measuring each YMC density value of the black image, and the lowest density value among the YMC density values. And the step (c) of storing the threshold value in the storage unit and the step (d) of performing the steps (a) to (c) for each of the combinations. Yes.
[0028]
According to the above configuration, when the YMC density value of a black image printed on a predetermined photosensitive material and developed with a predetermined processing solution is measured, the lowest density value among the YMC density values is determined, for example. A value obtained by subtracting the predetermined value is set as a threshold value, and this threshold value is stored in the storage unit. Such threshold value setting and storage processing are performed for all combinations of photosensitive materials and processing solutions.
[0029]
As described above, since the threshold value is set for each combination based on the lowest density value in the YMC of the black image that is most likely to deteriorate the image quality of the black image due to the density reduction, the image quality of the black image is set. A decrease can be reliably avoided for each of the above combinations.
[0030]
In order to solve the above problems, the black density determination method according to the invention of claim 3 corresponds to black according to the photosensitive material and processing solution used in the step (a) in the configuration of claim 2. The black image is printed on the photosensitive material by exposing the photosensitive material with an exposure amount of BGR such that the YMC density balance is obtained in the black image.
[0031]
The black image that is printed on the photosensitive material by exposing the photosensitive material with the exposure amount of BGR and developed by the processing solution has a YMC density balance corresponding to black corresponding to the photosensitive material and the processing solution. It becomes like this. Therefore, after that, a threshold value is set based on this black image, and the black density is determined using this threshold value, so it can be reliably determined whether or not the black image is expressed in appropriate black.
[0032]
DETAILED DESCRIPTION OF THE INVENTION
An embodiment of the present invention will be described below with reference to the drawings.
[0033]
The photographic processing apparatus according to this embodiment is an apparatus that can use the black density determination method according to the present invention. As shown in FIG. 2, a
[0034]
The photographic paper storage unit 2 stores photographic paper P (see FIG. 3) as a photosensitive material supplied to the
[0035]
The
[0036]
The developing unit 3 conveys the photographic paper P subjected to the baking process in the
[0037]
As described above, the photographic processing apparatus according to the present embodiment has a configuration in which exposure, development processing, and drying processing of the photographic paper P are continuously performed under centralized control under the control of the PC. Therefore, it is possible to print a large number of photographs continuously without imposing an operation burden on the user. Note that T in the figure indicates the conveyance path of the photographic paper P.
[0038]
The photographic processing apparatus further includes a storage unit (not shown) composed of, for example, a hard disk. This storage unit stores YMC density balance (to be described later) corresponding to appropriate black for each combination of all photographic paper P and all processing solutions, and also corresponds to each of the above combinations. A threshold value (described later) used for black density determination is stored.
[0039]
The present invention is characterized in that each of the individual combinations has the threshold value, and the black density determination is performed according to each combination using the individual threshold value. This point will be described later.
[0040]
Next, the configuration of the
[0041]
The light source 7 is composed of, for example, a halogen lamp that emits white light. The dimming
[0042]
The position of each filter is controlled by a drive unit (not shown), but the amount of each filter inserted into the optical path is controlled according to the number of pulses applied to the drive unit. For example, when the number of pulses is 0, each filter is out of the optical path, and when the number of pulses is 720, all the filters are in the optical path. And each filter is position-controlled by the drive part so that it may become a position according to the number of pulses within the above-mentioned movement range. In the following, the position of each filter corresponding to the number of pulses a (a is an integer from 0 to 720) will be simply referred to as a position or position a.
[0043]
The position of each filter is adjusted when acquiring data (YMC density balance described later) to be stored in the storage unit before shipment of the apparatus from the factory, but the YMC density balance is adjusted. When the photographic paper P is used to expose the photographic paper, a position where no light leaks in the
[0044]
The position setting of the
[0045]
The
[0046]
The
[0047]
The
[0048]
By applying a predetermined voltage to each shutter unit and changing the polarization state of the light incident on each shutter unit, only light that vibrates in the polarization direction of the polarizing plate on the light output side of the PLZT element is emitted from each shutter unit. The At this time, each shutter unit is driven ON / OFF so as to be opened for a time corresponding to the image data, so that a light amount of light corresponding to the image data out of the light from the light source 7 passes through each shutter unit. Guided to photographic paper P.
[0049]
The above-described ON / OFF drive of each shutter unit is performed based on exposure data corresponding to image data. The exposure data has a value from 0 (OFF state) to 65535 (ON state), for example, and is also called a shutter time. For example, when 256 gradations from 0 (black) to 255 (white) are considered as the image data, each of the 256 gradation image data is associated with any exposure data from 0 to 65535.
[0050]
Note that the conversion from image data to exposure data is performed by, for example, an LUT (Look Up Table). This LUT is adjusted for each photographic paper P and processing liquid to be used in an exposure adjustment process described later.
[0051]
The
[0052]
With the above configuration, the light emitted from the light source 7 is dimmed by the dimming
[0053]
Since each shutter portion of the
[0054]
The photographic paper P that has been exposed in the
[0055]
Next, before describing the black density determination process that is a feature of the present invention, an exposure adjustment process that is a color adjustment process performed before the process will be described. The exposure amount adjustment process is a process for adjusting each exposure amount (shutter time) of the BGR so that a black balance corresponding to the photographic paper P to be used and the processing liquid is obtained, and includes a density balance storage step, an exposure amount adjustment step, have.
[0056]
In the density balance storage step, a black balance (YMC density balance) corresponding to each combination of a plurality of printing papers P having different characteristics and a plurality of processing liquids is stored in the storage unit in advance before shipping the apparatus to the factory. It is. On the other hand, the exposure adjustment step is a step of adjusting the exposure using the YMC density balance stored in the storage unit.
[0057]
Note that the exposure adjustment process is normally performed in an apparatus after factory shipment, but in this embodiment, a threshold value used for black density determination is obtained in advance for all combinations of the photographic paper P and the processing liquid. Because it is necessary to keep it, it is done before factory shipment. Hereinafter, first, the density balance storage step will be described.
[0058]
(Density balance storage process)
As shown in the flowchart of FIG. 4, this process includes steps S1 to S7. In this step, each shutter portion of the
[0059]
First, in S1, each filter position of the
[0060]
As described above, the YMC filter of the
[0061]
That is, for example, the Y and M filters are fixed at the
[0062]
Eventually, in the above example, the YMC filters are arranged at 11 × 11 × 11 = 1331 positions depending on the combination. Since the amount of insertion of each filter into the optical path differs depending on the position of each filter, in S1, images of 1331 different colors are finally printed on the photographic paper P, and in S2, these images of 1331 colors are displayed. It is developed with a predetermined processing solution.
[0063]
Note that these 1331 color images are formed by BGR light that has a relatively large amount of light transmitted through the YMC filters, and thus are relatively high-density images. In the above description, the position of each filter is changed from 500 to 600. However, the position is not limited to this range, and the YMC filters are moved so that a plurality of high-density images can be formed on the printing paper P. Just do it.
[0064]
Next, in S3, each color on the developed photographic paper P is read with a colorimeter. Here, the reason for using the colorimeter in S3 is as follows.
[0065]
FIG. 5A shows spectral sensitivity characteristics corresponding to human eyes. In FIG. 4A, x (λ) is mainly a spectral sensitivity characteristic in the R wavelength region, y (λ) is a spectral sensitivity property in the G wavelength region, and z (λ) is B's. The spectral sensitivity characteristics in the wavelength region are shown. The sensitivity on the vertical axis relatively represents the sensitivity in other B and R wavelength ranges when the maximum sensitivity in the G wavelength range is set to 1.0.
[0066]
On the other hand, FIG. 5B shows the spectral sensitivity characteristics of the densitometer. In FIG. 4B, x ′ (λ) is the spectral sensitivity characteristic in the R wavelength range, y ′ (λ) is the spectral sensitivity characteristic in the G wavelength range, and z ′ (λ) is B The spectral sensitivity characteristics in the wavelength region are respectively shown. Further, the sensitivity on the vertical axis relatively represents the sensitivity in the other B and G wavelength ranges when the maximum sensitivity in the R wavelength range is 1.0. In FIG. 6B, it can be seen that the wavelength range corresponding to the large sensitivity is slightly different from that in FIG.
[0067]
Here, human beings can perceive colors because human eyes have senses (sensors) corresponding to the three primary colors of BGR light, that is, in each wavelength region of BGR as shown in FIG. This is because it can be considered that the human eye has a corresponding large sensitivity. Therefore, when the color is measured with a densitometer having a characteristic deviating from the spectral sensitivity corresponding to the human eye, the densitometer cannot recognize the wavelength (BGR) having a high spectral sensitivity corresponding to the human eye with high sensitivity. In addition, a result slightly different from the result visually judged by humans is obtained as the YMC concentration.
[0068]
On the other hand, the colorimeter has three sensors having almost the same sensitivity as the spectral sensitivity corresponding to the human eye shown in FIG. 5 (a). The tristimulus values corresponding to are calculated, and the values of L, a, and b are calculated from these values and output. Note that L indicates lightness, and a and b indicate chromaticity (hue and saturation).
[0069]
Here, Table 2 below shows the YMC density and Lab values of the black image that was printed on the photographic paper A and developed with the processing liquid A, and the black image that was baked on the photographic paper B and developed with the processing liquid B. YMC concentration and Lab value.
[0070]
[Table 2]
As can be seen from this table, the YMC concentration in the combination A of the photographic paper A and the processing liquid A and the combination B of the photographic paper B and the processing liquid B are almost the same values. The value of Lab varies. This means that even if the density meter cannot determine the difference in color (density) between the combinations A and B, the color meter can reliably determine the difference in color. Therefore, by using a color meter having a BGR sensitivity similar to that of the human eye, it is possible to reliably obtain information (subtle difference in density) that cannot be obtained with a densitometer whose BGR sensitivity is different from that of the human eye. The color can be appropriately judged with the same feeling as the human eye.
[0072]
In S3, a colorimeter is used, but other than this, for example, a spectrocolorimeter (spectrophotometer) can also be used. The spectrocolorimeter measures light reflected from a sample by a plurality of (for example, 40) sensors and measures the reflectance for each wavelength. For example, if the calculation unit performs integration calculation based on the data obtained by the spectrocolorimeter and calculates the above tristimulus values corresponding to BGR, each of the above L, a, and b is calculated from these values. A value can be calculated. Therefore, even if a spectrocolorimeter is used, it is possible to appropriately determine the color with the same feeling as the human eye.
[0073]
Next, in S4, one color having a chromaticity (a and b values) of 0 or closest thereto is selected. Hereinafter, this reason will be described.
[0074]
FIG. 6 shows a color space stereoscopic image of the Lab color system. In the figure, from the intersection of the a axis and the b axis, + a indicates the red direction, the opposite direction indicates the green direction, + b indicates the yellow direction, and the opposite direction indicates the blue direction. In the ab plane, the distance from the intersection of the a-axis and the b-axis indicates the saturation, and the circumferential direction of the circle centered on the intersection indicates the hue. The L axis is formed in a direction perpendicular to the ab plane. From the intersection of the a axis and the b axis, + L indicates the white direction, and the opposite direction indicates the black direction.
[0075]
Selecting a color having values of a and b of 0 or closest thereto means selecting a color as close as possible to the L axis in the color space of FIG. 6, that is, a color close to an achromatic color. An achromatic color is, for example, a color with no color bias to blue or red, and even if it is not an achromatic color, the closer it is to an achromatic color, the less the color bias. Therefore, if the exposure amount is adjusted in the exposure amount adjustment step described later so that the same density balance as that of the achromatic color or the color closest thereto is obtained in the black image, the color bias in the black image is eliminated. It is considered possible. Therefore, in order to obtain such a density balance in the next S5 and connect it to an exposure adjustment process described later, in S4, values of a and b are obtained from a plurality of color images formed on a predetermined printing paper P. Is selected to select an image having a color of 0 or the closest color.
[0076]
In S4, the value of a and b is not completely 0, but 0 or the closest color is selected. In practice, a color in which both a and b are completely 0 on the print is selected. This is because it is difficult to obtain. If there is a color in which the values of a and b are 0, it is of course possible to select that color.
[0077]
In S4, when the maximum value of a and b is 60, a value of 0 ± 1 or less as a and b is set as an allowable range at the time of selection, and a and b are within the range. , Only one color closest to the L axis is selected.
[0078]
Subsequently, in S5, the color selected in S4 is read by the
[0079]
For example, when the density values of YMC of the color selected in S4 are 2.0, 2.2, and 2.3, for example, M = Y + 0.2 and C = Y + 0 on the basis of Y. .3 is obtained, and the above-mentioned density balance is stored in the storage unit in S6.
[0080]
In S6, the YMC density values obtained in S5 may be stored in the storage unit as they are. However, the color development characteristics of the photographic paper and the state of the processing liquid slightly change over time. It is better to store the relative density balance between the YMCs in the storage unit than the above density values so that the above color can be reproduced even after such a change with time.
[0081]
If the storage unit is configured to store the YMC density values, then the YMC density balance may be calculated from the values. Anyway, the YMC density balance for the color selected in S4 may be finally obtained.
[0082]
After S6, the above steps S1 to S6 are repeated until the determination in S7 is completed for each combination of all photographic paper and all processing liquids. Thereby, the YMC density balance corresponding to each of the above combinations is stored in the storage unit.
[0083]
(Exposure amount adjustment process)
Next, the exposure adjustment process will be described, but before that, conditions that are preconditions for performing this process will be described.
[0084]
First, as shown in FIG. 7, a graph common to all apparatuses showing the relationship between 256 gradation image data (horizontal axis) from 0 to 255 and the density (vertical axis) at that time (in the figure, left Half graph (hereinafter referred to as the first graph), and a graph showing the relationship between the exposure data (horizontal axis) from 0 to 65535 and the density (vertical axis) at that time (the right half in the figure) Graph; hereinafter referred to as a second graph) is obtained from the beginning.
[0085]
In the first graph and the second graph of FIG. 7, when B is considered as the horizontal axis, Y is the vertical axis, and when G is considered as the horizontal axis, M is the vertical axis. When R is considered as the horizontal axis, C is assumed as the vertical axis. This is because each color of YMC is colored by irradiating the photographic paper P with each light of BGR. That is, in the graph having an inverted T-shaped axis shown in FIG. 7, it is assumed that three types of BY, GM, and RC are obtained. Further, in both the first graph and the second graph, the maximum density and the minimum density are assumed to be 3.0 and 0.7 for both YMC, for example.
[0086]
The reason why the first graph and the second graph are prepared in advance is that it is necessary to obtain exposure data corresponding to each image data of BGR in order to drive the
[0087]
In the second graph given first, the relationship between the exposure data and the density is linear, and this second graph is used only when the gray scale is first printed on the photographic paper P in S11 described later. Is used. Each time an exposure amount adjustment process described below is performed, a second graph having a different shape from the above graph is obtained each time.
[0088]
Further, before performing the exposure adjustment process, a daily setup in which the YMC filters of the
[0089]
Next, the exposure amount adjustment process of this embodiment will be described. This process consists of each process of S11-S16 shown in the flowchart of FIG.
[0090]
First, in S11, for example, a gray scale of 18 gradations (18-step gradation using only achromatic colors) is printed on a predetermined printing paper P. More specifically, for each BGR, the image data from 0 to 255 is divided into, for example, 18 stages, and exposure data corresponding to the image data of each gradation is obtained from the first graph and the second graph of FIG. Obtained for each BGR. Then, the gray scale is printed on the photographic paper P by performing each exposure of BGR with the exposure data corresponding to each stage.
[0091]
In S12, the gray scale is developed with a predetermined processing solution. Thereafter, the YMC density of each gray scale gradation is read by the
[0092]
Subsequently, in S14, the exposure data and density at each gradation are plotted with the exposure data on the horizontal axis and the density on the vertical axis. At this time, when the horizontal axis represents B exposure data, the vertical axis represents Y density, and when the horizontal axis represents G exposure data, the vertical axis represents M density, and the horizontal axis represents R exposure data. When C is taken, the vertical axis represents C concentration. FIG. 9 shows, for example, a plot of B exposure data and Y density. Then, by interpolating between the points, a graph as shown in FIG. 10 is obtained for each BGR, and this is updated as the second graph. Hereinafter, a method for obtaining the second graph will be specifically described.
[0093]
If the exposure data is x, the density value obtained by measuring the print with the
[0094]
For example, as shown in FIG.1, P2, PThree, PFourThen, P2-PThreeTo make the curve between them smoothly connect,2-PThreeThe curve in between must satisfy the following four conditions.
[0095]
▲ 1 ▼ Point P2Pass through.
[0096]
(2) Point PThreePass through.
[0097]
(3) Point P2The slope at is P1-P2Curve point P between2It matches the slope at.
[0098]
(4) Point PThreeThe slope at is PThree-PFourCurve point P betweenThreeIt matches the slope at.
[0099]
Point P2・ PThreeIf the slope at is determined, the expression of the cubic function can be uniquely obtained from the above conditions (1) to (4).2-PThreeInter-functions are treated as cubic functions.
Note that point P2・ PThreeThe slope at is calculated from three consecutive points. That is, point P2The slope at is straight line P1PThreeUsing the slope of the point PThreeThe slope at is straight line P2PFourUse the slope of.
[0100]
Point P2, PThreeThe coordinates of (x2, Y2), (XThree, YThree) And point P2, PThreeThe slope at m2, MThreeAnd The function to be obtained is y = axThree+ Bx2Assuming + cx + d, the following equations are obtained from the above conditions (1) to (4).
[0101]
y2= Ax2 Three+ Bx2 2+ Cx2+ D
yThree= AxThree Three+ BxThree 2+ CxThree+ D
m2= 3ax2 2+ 2bx2 + C
mThree= 3axThree 2+ 2bxThree+ C
Solving the above equations for a, b, c, d, a, b, c, d are expressed as follows.
[0102]
[0103]
Note that the inclination at both ends (
P1Inclination at = P2Slope x (straight line P1P2Slope / straight line P2PThreeSlope).
[0104]
Even if the photographic paper P is exposed with the same exposure data for each of the BGRs, the color density varies depending on the sensitivity of the photographic paper P and the like. Therefore, different characteristics are obtained for each of the BGRs as the curves shown in FIG.
[0105]
Next, in S15, the YMC density balance corresponding to the used printing paper P and processing liquid is read from the storage unit. Then, in S16, in the image with the highest density (black), the highest density of each first graph corresponding to BGR is obtained so that the read YMC density balance can be obtained and the density that cannot be developed is not targeted. Deform near density. Then, based on the deformed first graph and the second graph obtained in S14, an LUT for obtaining exposure data corresponding to 256-gradation image data is re-created for each BGR.
[0106]
Hereinafter, a modification of the first graph will be described. In order to facilitate understanding of the description, the concentration scales of the first graph before deformation (the first graph prepared from the beginning) and the second graph obtained in S14 are unified in the following. Consider a case in which the first graph is modified in consideration of the graph (see FIG. 12).
[0107]
In this graph, the horizontal axis represents image data and exposure data for B, and the vertical axis represents Y density. However, the horizontal axis represents image data and exposure data for G, and the vertical axis represents M. The following concept can also be applied to a graph in which the density of A is taken, and a graph in which image data and exposure data for R are taken on the horizontal axis and C density is taken on the vertical axis.
[0108]
First, for each color of BGR, the YMC density when exposed at the maximum shutter time is obtained from the second graph obtained in S14. As a result, it is assumed that the YMC concentration is, for example, Y = 2.2, M = 2.3, and C = 2.7.
[0109]
Here, it is assumed that the YMC density balance corresponding to the used printing paper P and processing liquid read from the storage unit in S15 is M = Y + 0.2 and C = Y + 0.3. In this case, considering the maximum density of Y and M with reference to C, Y = C−0.3 = 2.4 and M = Y + 0.2 = 2.6. The density cannot be developed even at the shutter time (because Y = 2.2 and M = 2.3). Therefore, since it is impossible to obtain such a density, the maximum density of Y and M cannot be considered based on C.
[0110]
Further, even when the maximum densities of M and C are considered based on Y, M = Y + 0.2 = 2.4 and C = Y + 0.3 = 2.5, and color development cannot be achieved even when the density of M is the maximum shutter time. Concentration (because M = 2.3). Therefore, since it is impossible to obtain such a concentration, the maximum concentrations of M and C cannot be considered based on Y.
[0111]
On the other hand, when considering the maximum density of Y and C based on M, Y = M−0.2 = 2.1 and C = Y + 0.3 = 2.4. Below the maximum density corresponding to the maximum shutter time. Therefore, in this example, the highest densities of Y and C are considered with respect to M, and in a black image, that is, when the image data value is 0, Y = 2.1, M = 2.3, C = 2 .4 in the vicinity of the maximum density (near image data value 0) of each first graph of BGR so that .4 can be developed. Since the YMC density is a density targeted for color development, the YMC density is hereinafter referred to as a target density.
[0112]
Next, how to actually deform the first graph will be described.
[0113]
When the target density of Y is determined as described above, as shown in FIG. 13, the position of the point a that becomes the target density in the
[0114]
When the deformation point c is obtained in this way, the point a-c is next smoothly connected and smoothly connected at the deformation point c with the original first graph before the deformation. Curve S between cBAsk for. This curve SBThe conditions for obtaining are as follows.
[0115]
(1) Pass through point a.
[0116]
(2) Pass through the deformation point c.
[0117]
(3) The slope at the deformation point c of the first graph after the deformation is the change of the first graph before the deformation.
It coincides with the inclination at the shape point c.
[0118]
(4) Decrease (increase) monotonously.
[0119]
By considering such a condition, it is possible to smoothly change the density corresponding to the image data in the section between the points a and c and across the deformation point c, and it is possible to produce a smooth gradation change. As a function satisfying the above conditions (1) to (4), a function represented by the following expression can be used.
[0120]
[Expression 1]
However, ya: density at point a (target density)
yc: concentration at the deformation point c
xa: image data value at point a (0)
xc: image data value at the deformation point c
ma: slope at point a
Curve SBIs obtained, the portion between the points a-c in the original first graph is obtained as the obtained curve S.BBy substituting, it is possible to obtain the result of transforming the original first graph (solid line portion in the figure).
[0122]
In FIG. 13, not only the high density portion between the points ac in the first graph but also the low density portion is deformed. More specifically, in the low density portion of the first graph, the Y density corresponding to the
[0123]
Although the case where the first graph for B is mainly deformed has been described above, the same applies to the case where the first graph for G and R is deformed. As a result, as shown in FIGS. 14 and 15, it is possible to obtain a first graph (solid line portion) after deformation for G and R. Note that FIG. 14 shows the high density part and low density part of the first graph for G with the curve SGAnd curve TGFIG. 15 shows the high and low concentration portions of the first graph for R with the curve SRAnd curve TRShows the replacement. Curve SGAnd SRIs the curve SBAnd the curve TGAnd TRIs the curve TBIt can be obtained in the same way.
[0124]
When the first graph after deformation is obtained for each BGR in this way, the first graph after deformation for each BGR and the second graph obtained in S14, that is, FIGS. 13 to 15 are shown. Based on a solid line graph represented by an inverted T-shaped axis, exposure data corresponding to image data of 256 gradations from 0 to 255 can be obtained.
[0125]
Finally, on the basis of the first graph after deformation and the second graph obtained in S14, the LUT which receives the image data of each gradation and outputs the exposure data corresponding to the image data of each gradation. Are recreated for each BGR. The graph in the lower left (third quadrant) of FIG. 16 shows such an output LUT. Exposure data f corresponding to predetermined image data in the output LUT1Is the exposure data f corresponding to the image data in the second graph.2Are equal to each other.
[0126]
In FIG. 16, the lower right (fourth quadrant) graph shows the LUT during exposure. The LUT at the time of exposure is used only when the gray scale of 18 gradations is printed on the photographic paper P in S11, and is obtained based on the first graph and the second graph of FIG. Is. That is, the LUT at the time of exposure is an LUT that receives the image data of each gradation in the first graph of FIG. 7 and outputs the image data of each gradation and the exposure data corresponding to the second graph of FIG. . By adjusting the LUT at the time of exposure, the interval between the 18 plotted points changes, but the shape of this curve does not change greatly.
[0127]
In this way, in the density balance storage step, the YMC density balance corresponding to black is stored in advance in the storage unit for each combination of the plurality of photographic papers P having different characteristics and the plurality of processing liquids, and the exposure amount is stored. In the adjustment step, the density balance corresponding to the photographic paper P to be used and the processing liquid is read from the storage unit, and the exposure amount of the photographic paper P is adjusted so that the density balance is obtained in the black image on the photographic paper P. Yes. Therefore, regardless of the type of photographic paper P and processing liquid used, the exposure amount of the photographic paper P is adjusted based on the density balance according to the combination of the photographic paper P and processing liquid used. The black on the photographic paper P can be appropriately expressed for each combination of the photographic paper P and the processing liquid.
[0128]
Next, the black density determination process that is a feature of the present invention will be described. In the black density determination process, whether or not an allowable black density is obtained as a result of exposing a predetermined printing paper P with a shutter time after color adjustment by the exposure adjustment process and developing with a predetermined processing liquid. And includes a threshold storage process and an actual determination process.
[0129]
The threshold storage step is a step in which a threshold serving as a criterion for determining whether or not the black density corresponding to the photographic paper P and the processing liquid to be used is stored in the storage unit in advance. Performed once. On the other hand, in the actual determination step, the density of the black image that is actually baked and developed on the photographic paper P using the threshold value stored in the storage unit depends on the photographic paper P and the processing liquid to be used. It is a step of actually determining whether or not the device is installed, and is performed, for example, as a daily setup after the device is shipped from the factory. Hereinafter, first, the threshold value storing step will be described.
[0130]
(Threshold storage process)
As shown in the flowchart of FIG. 1, this process includes steps S21 to S25.
[0131]
First, in S21, a black image is printed on the photographic paper P with the shutter time adjusted according to the photographic paper P to be used and the processing liquid in the above-described exposure amount adjustment processing. In S22, the black image printed on the photographic paper P is developed with the processing liquid.
[0132]
Subsequently, in S23, each density value of YMC of the black image is read by the
[0133]
The specification of the
[0134]
In determining the threshold value, the value to be subtracted from the minimum density is not limited to the above 0.1, but the smaller the value, the more severely the density drop can be managed.
[0135]
Then, as a result of the determination in S25, the above steps S21 to S24 are repeated until completion for each combination of all photographic paper and all processing liquids. Therefore, in the threshold value storage process, threshold values corresponding to each combination of all photographic paper and all processing liquids are stored in the storage unit.
[0136]
(Actual judgment process)
As shown in the flowchart of FIG. 17, this step includes steps S31 to S36.
[0137]
First, in S31, the photographic paper P is obtained by the black shutter time (exposure data corresponding to image data 0) corresponding to the predetermined photographic paper P and the predetermined processing liquid obtained by the above-described exposure amount adjustment processing. Burn a black image. In step S32, the black image is developed with the processing solution. In S31, for example, a gray scale of 18 gradations including the black image may be printed, and in S32, this gray scale may be developed.
[0138]
Subsequently, in S33, the YMC density values of the black image on the photographic paper P are read by the
[0139]
In S35, it is determined whether the density of the lowest color among the YMC density values obtained in S33 is equal to or higher than the threshold value read in S34. Here, when the minimum density in the black image is equal to or higher than the threshold value, it is determined that the density of the black image is appropriate, and the process ends.
[0140]
On the other hand, if it is determined in S35 that the minimum density has fallen below the threshold value, a warning is issued to adjust each part in S36 (S36), and then the process returns to S31 and the above processing is repeated.
[0141]
Here, the adjustment of each part includes (1) check of the processing liquid, (2) resetting the position of each YMC filter of the
[0142]
Even if the position of each YMC filter is reset, the light source 7 and the
[0143]
As described above, in the present invention, for each combination of the photographic paper P and the processing liquid to be used, a threshold value that is a reference for determining the black density is stored in the storage unit in advance, and the photographic paper P and the processing liquid to be used are stored. For each combination, the black density after color adjustment is determined using the threshold value. As a result, a decrease in YMC density in the black image can be reliably recognized and determined for each combination. Therefore, when a decrease in black density is detected, the above-described adjustment of each unit reduces the image quality deterioration with time of the black image formed on the photographic paper P for each combination. It can be avoided reliably.
[0144]
Further, among the YMC density values in the black image, the threshold value is set for each of the combinations based on the lowest density value that is most likely to deteriorate the image quality of the black image due to the density reduction. A decrease can be reliably avoided for each of the above combinations.
[0145]
Further, the black image used for determining the threshold value is a black image that is baked on the photographic paper P with an exposure amount adjusted in advance so that appropriate black is produced and developed with the processing liquid. Has a YMC density balance corresponding to black according to the photographic paper P and the processing liquid. Therefore, after that, a threshold value is set based on this black image, and the black density is determined using this threshold value, so it can be reliably determined whether or not the black image is expressed in appropriate black.
[0146]
In addition, the black density can be strictly controlled by setting the threshold value under the strict condition of the minimum density of −0.1 and determining the black density as in the present embodiment. As a result, a good black image can always be formed on the photographic paper P.
[0147]
In the present embodiment, the case where the
[0148]
【The invention's effect】
In the black density determination method according to the first aspect of the present invention, as described above, the threshold value used as the reference for black density determination corresponds to each combination of a plurality of photosensitive materials having different characteristics and a plurality of processing solutions. A first step of storing each threshold value in the storage unit, a second step of printing a black image on a predetermined photosensitive material, and developing the black image with a predetermined processing solution, and a density value of the black image A fourth step of reading a threshold value corresponding to a combination of the predetermined photosensitive material and the predetermined processing solution from the storage unit, a density value of the black image, and the read threshold value And a fifth step of determining whether or not the density of the black image is good.
[0149]
Therefore, since the black density determination is performed using a threshold corresponding to each combination of the photosensitive material and the processing solution, even when the density of the black image is reduced due to the deterioration of the characteristics of the processing solution used, each of the above combinations is used. It is possible to perform a density determination according to this. In other words, when the threshold value is set for each combination of the photosensitive material and the processing solution as described above, it is possible to manage the amount of decrease in the density of the black image for each combination. It is possible to perform accurate density determination.
[0150]
Therefore, when it is determined that the density is poor, a warning such as replacement of the processing liquid is then issued to the operator, thereby reliably avoiding the deterioration of the quality of the black image and the entire image for each of the above combinations. There is an effect that it becomes possible.
[0151]
As described above, in the black density determination method according to the second aspect of the present invention, in the configuration of the first aspect, the first step is to print a black image on a predetermined photosensitive material, The threshold value is set based on the lowest density value among the YMC density values, the developing step (a), the black image YMC density value measurement step (b), and the YMC density value. Is stored in the storage unit, and the steps (a) to (c) are performed on each of the combinations.
[0152]
Therefore, the threshold value is set for each of the above combinations based on the lowest density value in the YMC of the black image that is most likely to deteriorate the image quality of the black image due to the density reduction. There is an effect that the reduction can be surely avoided for each combination.
[0153]
As described above, the black density determination method according to the invention of claim 3 is the YMC density balance corresponding to black according to the photosensitive material and processing solution used in the step (a) in the configuration of claim 2 as described above. Is a structure in which the black image is printed on the photosensitive material by exposing the photosensitive material with an exposure amount of BGR as obtained in the black image.
[0154]
Therefore, a threshold value is set based on a black image having a YMC density balance corresponding to black according to the photosensitive material and processing solution used, and the black density is determined using this threshold value. There is an effect that it can be reliably determined whether or not it is expressed in black.
[Brief description of the drawings]
FIG. 1 is a flowchart showing a flow of operations in a threshold value storing step of a black density determination method according to the present invention.
FIG. 2 is an explanatory diagram showing a schematic configuration of a photographic processing apparatus used in the present embodiment.
FIG. 3 is a perspective view showing a schematic configuration of an exposure unit provided in the photographic processing apparatus.
FIG. 4 is a flowchart showing an operation flow in a density balance storing step performed before black density determination.
FIG. 5A is a graph showing spectral sensitivity characteristics corresponding to human eyes. (B) is a graph which shows the spectral sensitivity characteristic of a densitometer.
FIG. 6 is an explanatory diagram showing a three-dimensional image of a color space of the Lab color system.
FIG. 7 is a graph showing a relationship between preset image data and density, and a relationship between density and exposure data.
FIG. 8 is a flowchart showing an operation flow in an exposure adjustment process performed before black density determination.
FIG. 9 shows the relationship between the B exposure data and the Y density when the YMC density of each gradation is measured after printing the gray scale on the photographic paper based on the exposure data corresponding to the 18-step BGR image data. It is explanatory drawing which plots and shows on a coordinate axis.
FIG. 10 is a graph obtained by interpolating the plotted points.
FIG. 11 is an explanatory diagram for explaining a method of obtaining a curve smoothly connecting two plotted points, for explaining the interpolation method.
FIG. 12 is a graph showing a first graph before deformation and an updated second graph in a unified density scale.
FIG. 13 is an explanatory diagram showing shapes before and after deformation of the first graph showing the relationship between B image data and exposure data and Y density;
FIG. 14 is an explanatory diagram showing shapes before and after deformation of the first graph showing the relationship between image data of G and exposure data and M density.
FIG. 15 is an explanatory diagram showing shapes before and after deformation of the first graph showing the relationship between R image data and exposure data and C density;
FIG. 16 shows an output LUT obtained based on the first graph before and after the deformation, the updated second graph, the first graph after the deformation, and the second graph, and the gray scale on the photographic paper. It is explanatory drawing which shows the LUT at the time of exposure utilized when baking.
FIG. 17 is a flowchart showing an operation flow in an actual determination step of the black density determination method according to the present invention.
[Explanation of symbols]
6 Exposure section
P Photographic paper (photosensitive material)
Claims (2)
所定の感光材料に黒画像を焼き付け、この黒画像を所定の処理液で現像する第2の工程と、
上記黒画像の濃度値を測定する第3の工程と、
上記所定の感光材料と上記所定の処理液との組み合わせに対応する閾値を上記記憶部から読み出す第4の工程と、
上記黒画像の濃度値と上記読み出した閾値との大小関係に基づいて、上記黒画像の濃度の良否を判定する第5の工程とを有している黒濃度判定方法であって、
上記第1の工程は、所定の感光材料に黒画像を焼き付け、この黒画像を所定の処理液で現像する工程(a)と、
上記黒画像のYMCの各濃度値を測定する工程(b)と、
上記YMCの各濃度値のうち最低となる濃度値に基づいて閾値を設定し、上記閾値を記憶部に記憶させる工程(c)と、
上記工程(a)ないし(c)を、上記各組み合わせのそれぞれに対して行う工程(d)とを有していることを特徴とする黒濃度判定方法。A first step of obtaining a threshold value serving as a reference when performing black density determination corresponding to each combination of a plurality of photosensitive materials having different characteristics and a plurality of processing solutions, and storing each threshold value in a storage unit;
A second step of printing a black image on a predetermined photosensitive material and developing the black image with a predetermined processing solution;
A third step of measuring the density value of the black image;
A fourth step of reading from the storage unit a threshold value corresponding to a combination of the predetermined photosensitive material and the predetermined processing solution;
A black density determination method including a fifth step of determining whether the density of the black image is good or not based on a magnitude relationship between the density value of the black image and the read threshold value ,
The first step includes a step (a) of printing a black image on a predetermined photosensitive material and developing the black image with a predetermined processing solution;
A step (b) of measuring each YMC density value of the black image;
Setting a threshold based on the lowest density value among the YMC density values, and storing the threshold in the storage unit (c);
And (d) performing the steps (a) to (c) for each of the combinations .
Priority Applications (1)
| Application Number | Priority Date | Filing Date | Title |
|---|---|---|---|
| JP2000180455A JP4635298B2 (en) | 2000-06-15 | 2000-06-15 | Black density judgment method |
Applications Claiming Priority (1)
| Application Number | Priority Date | Filing Date | Title |
|---|---|---|---|
| JP2000180455A JP4635298B2 (en) | 2000-06-15 | 2000-06-15 | Black density judgment method |
Publications (2)
| Publication Number | Publication Date |
|---|---|
| JP2001356435A JP2001356435A (en) | 2001-12-26 |
| JP4635298B2 true JP4635298B2 (en) | 2011-02-23 |
Family
ID=18681545
Family Applications (1)
| Application Number | Title | Priority Date | Filing Date |
|---|---|---|---|
| JP2000180455A Expired - Fee Related JP4635298B2 (en) | 2000-06-15 | 2000-06-15 | Black density judgment method |
Country Status (1)
| Country | Link |
|---|---|
| JP (1) | JP4635298B2 (en) |
Family Cites Families (5)
| Publication number | Priority date | Publication date | Assignee | Title |
|---|---|---|---|---|
| JP2633396B2 (en) * | 1991-01-10 | 1997-07-23 | 富士写真フイルム株式会社 | Image forming apparatus and image forming condition setting method |
| JPH1075377A (en) * | 1996-06-17 | 1998-03-17 | Konica Corp | Image output method, image output system, exposure image information conversion method, storage medium and production method for conversion information |
| JPH10254077A (en) * | 1997-03-07 | 1998-09-25 | Mitsubishi Paper Mills Ltd | Exposure amount control method for lithographic printing plate for scanning exposure |
| JPH1178112A (en) * | 1997-09-09 | 1999-03-23 | Konica Corp | Image forming system and image forming method |
| JP3788127B2 (en) * | 1999-08-31 | 2006-06-21 | コニカミノルタホールディングス株式会社 | Image forming apparatus |
-
2000
- 2000-06-15 JP JP2000180455A patent/JP4635298B2/en not_active Expired - Fee Related
Also Published As
| Publication number | Publication date |
|---|---|
| JP2001356435A (en) | 2001-12-26 |
Similar Documents
| Publication | Publication Date | Title |
|---|---|---|
| EP0948191B1 (en) | Scanner illumination | |
| Balasubramanian | Device characterization | |
| EP0701362B1 (en) | Color image reproduction of scenes with color enhancement and preferential tone mapping | |
| US5447811A (en) | Color image reproduction of scenes with preferential tone mapping | |
| US20020131770A1 (en) | Color modeling of a photographic image | |
| JP2001285889A (en) | Reproduction of color image for scene attended with preferred color mapping | |
| JPH01134353A (en) | Color photographic printer and exposure control | |
| JPH0640194B2 (en) | How to set and manage photo printing conditions | |
| EP1343308B1 (en) | Use of spectral sensors for automatic media identification and improved scanner correction | |
| US5367387A (en) | Color image forming apparatus for reproducing color image with high reproducibility | |
| US6324345B1 (en) | Photographic film with recorded information, method of acquiring the information recorded on photographic film, image processing method using the acquired information, and print system using the same | |
| JP2000069229A (en) | Device and method for reproducing article | |
| US6864998B2 (en) | Image reading apparatus, image recording medium and image forming apparatus | |
| JP4635298B2 (en) | Black density judgment method | |
| US6222578B1 (en) | Image recording apparatus for correcting nonuniformities in the exposure light amount | |
| JP4635299B2 (en) | Exposure method | |
| JP2001356434A (en) | Exposure adjustment method | |
| US20060017944A1 (en) | Image forming apparatus | |
| JP4552288B2 (en) | Image recording device | |
| JPH08279919A (en) | Image processing apparatus and method thereof | |
| JP3724434B2 (en) | Exposure amount adjustment method | |
| JP4986718B2 (en) | Image forming apparatus and image processing method | |
| JP3788342B2 (en) | Exposure amount adjustment method | |
| JP2993620B2 (en) | Exposure control method | |
| JP2003050429A (en) | Exposure adjustment method |
Legal Events
| Date | Code | Title | Description |
|---|---|---|---|
| A621 | Written request for application examination |
Free format text: JAPANESE INTERMEDIATE CODE: A621 Effective date: 20070516 |
|
| A131 | Notification of reasons for refusal |
Free format text: JAPANESE INTERMEDIATE CODE: A131 Effective date: 20100727 |
|
| A521 | Request for written amendment filed |
Free format text: JAPANESE INTERMEDIATE CODE: A523 Effective date: 20100927 |
|
| RD02 | Notification of acceptance of power of attorney |
Free format text: JAPANESE INTERMEDIATE CODE: A7422 Effective date: 20100927 |
|
| TRDD | Decision of grant or rejection written | ||
| A01 | Written decision to grant a patent or to grant a registration (utility model) |
Free format text: JAPANESE INTERMEDIATE CODE: A01 Effective date: 20101026 |
|
| A01 | Written decision to grant a patent or to grant a registration (utility model) |
Free format text: JAPANESE INTERMEDIATE CODE: A01 |
|
| A61 | First payment of annual fees (during grant procedure) |
Free format text: JAPANESE INTERMEDIATE CODE: A61 Effective date: 20101108 |
|
| FPAY | Renewal fee payment (event date is renewal date of database) |
Free format text: PAYMENT UNTIL: 20131203 Year of fee payment: 3 |
|
| R150 | Certificate of patent or registration of utility model |
Free format text: JAPANESE INTERMEDIATE CODE: R150 |
|
| S111 | Request for change of ownership or part of ownership |
Free format text: JAPANESE INTERMEDIATE CODE: R313111 |
|
| FPAY | Renewal fee payment (event date is renewal date of database) |
Free format text: PAYMENT UNTIL: 20131203 Year of fee payment: 3 |
|
| R350 | Written notification of registration of transfer |
Free format text: JAPANESE INTERMEDIATE CODE: R350 |
|
| LAPS | Cancellation because of no payment of annual fees |