JP4279900B2 - Simultaneous analysis of cell viability, nucleated red blood cells, and white blood cell classification - Google Patents
Simultaneous analysis of cell viability, nucleated red blood cells, and white blood cell classification Download PDFInfo
- Publication number
- JP4279900B2 JP4279900B2 JP52228797A JP52228797A JP4279900B2 JP 4279900 B2 JP4279900 B2 JP 4279900B2 JP 52228797 A JP52228797 A JP 52228797A JP 52228797 A JP52228797 A JP 52228797A JP 4279900 B2 JP4279900 B2 JP 4279900B2
- Authority
- JP
- Japan
- Prior art keywords
- wbc
- nrbc
- signal
- cells
- damaged
- Prior art date
- Legal status (The legal status is an assumption and is not a legal conclusion. Google has not performed a legal analysis and makes no representation as to the accuracy of the status listed.)
- Expired - Lifetime
Links
- 210000000265 leukocyte Anatomy 0.000 title claims abstract description 160
- 210000003743 erythrocyte Anatomy 0.000 title claims abstract description 40
- 238000004458 analytical method Methods 0.000 title description 25
- 230000003833 cell viability Effects 0.000 title description 2
- 238000000034 method Methods 0.000 claims abstract description 60
- 238000000684 flow cytometry Methods 0.000 claims abstract description 5
- 210000004027 cell Anatomy 0.000 claims description 84
- 210000004369 blood Anatomy 0.000 claims description 78
- 239000008280 blood Substances 0.000 claims description 78
- 239000003153 chemical reaction reagent Substances 0.000 claims description 33
- 210000000170 cell membrane Anatomy 0.000 claims description 13
- XJMOSONTPMZWPB-UHFFFAOYSA-M propidium iodide Chemical compound [I-].[I-].C12=CC(N)=CC=C2C2=CC=C(N)C=C2[N+](CCC[N+](C)(CC)CC)=C1C1=CC=CC=C1 XJMOSONTPMZWPB-UHFFFAOYSA-M 0.000 claims description 13
- 230000009089 cytolysis Effects 0.000 claims description 11
- 230000006378 damage Effects 0.000 claims description 10
- 239000000203 mixture Substances 0.000 claims description 9
- 238000012360 testing method Methods 0.000 claims description 9
- BGWLYQZDNFIFRX-UHFFFAOYSA-N 5-[3-[2-[3-(3,8-diamino-6-phenylphenanthridin-5-ium-5-yl)propylamino]ethylamino]propyl]-6-phenylphenanthridin-5-ium-3,8-diamine;dichloride Chemical compound [Cl-].[Cl-].C=1C(N)=CC=C(C2=CC=C(N)C=C2[N+]=2CCCNCCNCCC[N+]=3C4=CC(N)=CC=C4C4=CC=C(N)C=C4C=3C=3C=CC=CC=3)C=1C=2C1=CC=CC=C1 BGWLYQZDNFIFRX-UHFFFAOYSA-N 0.000 claims description 5
- 238000002156 mixing Methods 0.000 claims description 4
- RPNUMPOLZDHAAY-UHFFFAOYSA-N Diethylenetriamine Chemical compound NCCNCCN RPNUMPOLZDHAAY-UHFFFAOYSA-N 0.000 claims description 3
- 239000000427 antigen Substances 0.000 claims description 3
- 102000036639 antigens Human genes 0.000 claims description 3
- 108091007433 antigens Proteins 0.000 claims description 3
- ZMMJGEGLRURXTF-UHFFFAOYSA-N ethidium bromide Chemical compound [Br-].C12=CC(N)=CC=C2C2=CC=C(N)C=C2[N+](CC)=C1C1=CC=CC=C1 ZMMJGEGLRURXTF-UHFFFAOYSA-N 0.000 claims description 3
- 229960005542 ethidium bromide Drugs 0.000 claims description 3
- 210000003855 cell nucleus Anatomy 0.000 claims description 2
- 239000000446 fuel Substances 0.000 claims 1
- 239000000523 sample Substances 0.000 description 51
- 239000000975 dye Substances 0.000 description 23
- 210000004698 lymphocyte Anatomy 0.000 description 22
- 210000004940 nucleus Anatomy 0.000 description 20
- 239000012128 staining reagent Substances 0.000 description 20
- 238000005259 measurement Methods 0.000 description 17
- 238000001514 detection method Methods 0.000 description 16
- 238000000149 argon plasma sintering Methods 0.000 description 14
- 239000000243 solution Substances 0.000 description 14
- 102000039446 nucleic acids Human genes 0.000 description 12
- 108020004707 nucleic acids Proteins 0.000 description 12
- 150000007523 nucleic acids Chemical class 0.000 description 12
- 238000009826 distribution Methods 0.000 description 11
- 238000010186 staining Methods 0.000 description 10
- 210000001772 blood platelet Anatomy 0.000 description 9
- NLXLAEXVIDQMFP-UHFFFAOYSA-N Ammonia chloride Chemical compound [NH4+].[Cl-] NLXLAEXVIDQMFP-UHFFFAOYSA-N 0.000 description 8
- 230000002159 abnormal effect Effects 0.000 description 7
- 230000006907 apoptotic process Effects 0.000 description 7
- WSFSSNUMVMOOMR-UHFFFAOYSA-N Formaldehyde Chemical compound O=C WSFSSNUMVMOOMR-UHFFFAOYSA-N 0.000 description 6
- 210000000805 cytoplasm Anatomy 0.000 description 6
- 238000010586 diagram Methods 0.000 description 6
- CHADEQDQBURGHL-UHFFFAOYSA-N (6'-acetyloxy-3-oxospiro[2-benzofuran-1,9'-xanthene]-3'-yl) acetate Chemical compound O1C(=O)C2=CC=CC=C2C21C1=CC=C(OC(C)=O)C=C1OC1=CC(OC(=O)C)=CC=C21 CHADEQDQBURGHL-UHFFFAOYSA-N 0.000 description 5
- 239000000980 acid dye Substances 0.000 description 5
- 230000030833 cell death Effects 0.000 description 5
- 230000001413 cellular effect Effects 0.000 description 5
- 238000009792 diffusion process Methods 0.000 description 5
- LOKCTEFSRHRXRJ-UHFFFAOYSA-I dipotassium trisodium dihydrogen phosphate hydrogen phosphate dichloride Chemical compound P(=O)(O)(O)[O-].[K+].P(=O)(O)([O-])[O-].[Na+].[Na+].[Cl-].[K+].[Cl-].[Na+] LOKCTEFSRHRXRJ-UHFFFAOYSA-I 0.000 description 5
- 239000012528 membrane Substances 0.000 description 5
- 230000003287 optical effect Effects 0.000 description 5
- 239000002953 phosphate buffered saline Substances 0.000 description 5
- XKRFYHLGVUSROY-UHFFFAOYSA-N Argon Chemical compound [Ar] XKRFYHLGVUSROY-UHFFFAOYSA-N 0.000 description 4
- 235000019270 ammonium chloride Nutrition 0.000 description 4
- 238000010224 classification analysis Methods 0.000 description 4
- 210000003979 eosinophil Anatomy 0.000 description 4
- 239000012634 fragment Substances 0.000 description 4
- 210000003714 granulocyte Anatomy 0.000 description 4
- 239000013642 negative control Substances 0.000 description 4
- 210000000440 neutrophil Anatomy 0.000 description 4
- 238000002360 preparation method Methods 0.000 description 4
- 230000008569 process Effects 0.000 description 4
- 239000011550 stock solution Substances 0.000 description 4
- IAZDPXIOMUYVGZ-UHFFFAOYSA-N Dimethylsulphoxide Chemical compound CS(C)=O IAZDPXIOMUYVGZ-UHFFFAOYSA-N 0.000 description 3
- OKKJLVBELUTLKV-UHFFFAOYSA-N Methanol Chemical compound OC OKKJLVBELUTLKV-UHFFFAOYSA-N 0.000 description 3
- 108010004729 Phycoerythrin Proteins 0.000 description 3
- 210000003651 basophil Anatomy 0.000 description 3
- 230000008901 benefit Effects 0.000 description 3
- 239000006285 cell suspension Substances 0.000 description 3
- 238000000295 emission spectrum Methods 0.000 description 3
- 210000002109 erythrocyte inclusion Anatomy 0.000 description 3
- 238000013394 immunophenotyping Methods 0.000 description 3
- 210000001616 monocyte Anatomy 0.000 description 3
- 239000003960 organic solvent Substances 0.000 description 3
- 238000012545 processing Methods 0.000 description 3
- 238000004445 quantitative analysis Methods 0.000 description 3
- 108091003079 Bovine Serum Albumin Proteins 0.000 description 2
- KCXVZYZYPLLWCC-UHFFFAOYSA-N EDTA Chemical compound OC(=O)CN(CC(O)=O)CCN(CC(O)=O)CC(O)=O KCXVZYZYPLLWCC-UHFFFAOYSA-N 0.000 description 2
- 241000287828 Gallus gallus Species 0.000 description 2
- OWLJDBBFRJXPGM-VBIGTWTASA-N [(1S,2S,4S,5S,7S,8R,9R,11S,13S)-1-methyl-17-oxo-7-propan-2-yl-3,6,10,16-tetraoxaheptacyclo[11.7.0.02,4.02,9.05,7.09,11.014,18]icos-14(18)-en-8-yl] (2R)-2-amino-3-methylbutanoate Chemical compound [H][C@@]12C[C@@H]3O[C@@]33[C@H](OC(=O)[C@H](N)C(C)C)[C@]4(O[C@H]4[C@@H]4O[C@]34[C@@]1(C)CCC1=C2COC1=O)C(C)C OWLJDBBFRJXPGM-VBIGTWTASA-N 0.000 description 2
- 238000010521 absorption reaction Methods 0.000 description 2
- 239000008351 acetate buffer Substances 0.000 description 2
- DPKHZNPWBDQZCN-UHFFFAOYSA-N acridine orange free base Chemical compound C1=CC(N(C)C)=CC2=NC3=CC(N(C)C)=CC=C3C=C21 DPKHZNPWBDQZCN-UHFFFAOYSA-N 0.000 description 2
- 229910052786 argon Inorganic materials 0.000 description 2
- DZBUGLKDJFMEHC-UHFFFAOYSA-N benzoquinolinylidene Natural products C1=CC=CC2=CC3=CC=CC=C3N=C21 DZBUGLKDJFMEHC-UHFFFAOYSA-N 0.000 description 2
- 210000000601 blood cell Anatomy 0.000 description 2
- 229940098773 bovine serum albumin Drugs 0.000 description 2
- 239000000872 buffer Substances 0.000 description 2
- 239000003795 chemical substances by application Substances 0.000 description 2
- 238000012790 confirmation Methods 0.000 description 2
- 238000010276 construction Methods 0.000 description 2
- 230000000875 corresponding effect Effects 0.000 description 2
- 231100000433 cytotoxic Toxicity 0.000 description 2
- 230000001472 cytotoxic effect Effects 0.000 description 2
- 239000003085 diluting agent Substances 0.000 description 2
- 239000003814 drug Substances 0.000 description 2
- 229940079593 drug Drugs 0.000 description 2
- 238000005516 engineering process Methods 0.000 description 2
- 238000002474 experimental method Methods 0.000 description 2
- MHMNJMPURVTYEJ-UHFFFAOYSA-N fluorescein-5-isothiocyanate Chemical compound O1C(=O)C2=CC(N=C=S)=CC=C2C21C1=CC=C(O)C=C1OC1=CC(O)=CC=C21 MHMNJMPURVTYEJ-UHFFFAOYSA-N 0.000 description 2
- 230000003834 intracellular effect Effects 0.000 description 2
- 238000000691 measurement method Methods 0.000 description 2
- 210000003593 megakaryocyte Anatomy 0.000 description 2
- 229960000901 mepacrine Drugs 0.000 description 2
- 230000017074 necrotic cell death Effects 0.000 description 2
- 238000012758 nuclear staining Methods 0.000 description 2
- 239000012466 permeate Substances 0.000 description 2
- 235000015497 potassium bicarbonate Nutrition 0.000 description 2
- 229910000028 potassium bicarbonate Inorganic materials 0.000 description 2
- 239000011736 potassium bicarbonate Substances 0.000 description 2
- TYJJADVDDVDEDZ-UHFFFAOYSA-M potassium hydrogencarbonate Chemical compound [K+].OC([O-])=O TYJJADVDDVDEDZ-UHFFFAOYSA-M 0.000 description 2
- INCIMLINXXICKS-UHFFFAOYSA-M pyronin Y Chemical compound [Cl-].C1=CC(=[N+](C)C)C=C2OC3=CC(N(C)C)=CC=C3C=C21 INCIMLINXXICKS-UHFFFAOYSA-M 0.000 description 2
- 238000011002 quantification Methods 0.000 description 2
- GPKJTRJOBQGKQK-UHFFFAOYSA-N quinacrine Chemical compound C1=C(OC)C=C2C(NC(C)CCCN(CC)CC)=C(C=CC(Cl)=C3)C3=NC2=C1 GPKJTRJOBQGKQK-UHFFFAOYSA-N 0.000 description 2
- 210000001995 reticulocyte Anatomy 0.000 description 2
- 230000003595 spectral effect Effects 0.000 description 2
- 239000012224 working solution Substances 0.000 description 2
- YXHLJMWYDTXDHS-IRFLANFNSA-N 7-aminoactinomycin D Chemical compound C[C@H]1OC(=O)[C@H](C(C)C)N(C)C(=O)CN(C)C(=O)[C@@H]2CCCN2C(=O)[C@@H](C(C)C)NC(=O)[C@H]1NC(=O)C1=C(N)C(=O)C(C)=C2OC(C(C)=C(N)C=C3C(=O)N[C@@H]4C(=O)N[C@@H](C(N5CCC[C@H]5C(=O)N(C)CC(=O)N(C)[C@@H](C(C)C)C(=O)O[C@@H]4C)=O)C(C)C)=C3N=C21 YXHLJMWYDTXDHS-IRFLANFNSA-N 0.000 description 1
- 108700012813 7-aminoactinomycin D Proteins 0.000 description 1
- 208000018380 Chemical injury Diseases 0.000 description 1
- 108090000790 Enzymes Proteins 0.000 description 1
- 102000004190 Enzymes Human genes 0.000 description 1
- 108090000371 Esterases Proteins 0.000 description 1
- QTANTQQOYSUMLC-UHFFFAOYSA-O Ethidium cation Chemical compound C12=CC(N)=CC=C2C2=CC=C(N)C=C2[N+](CC)=C1C1=CC=CC=C1 QTANTQQOYSUMLC-UHFFFAOYSA-O 0.000 description 1
- 206010020843 Hyperthermia Diseases 0.000 description 1
- 206010021143 Hypoxia Diseases 0.000 description 1
- 206010061218 Inflammation Diseases 0.000 description 1
- FGBAVQUHSKYMTC-UHFFFAOYSA-M LDS 751 dye Chemical compound [O-]Cl(=O)(=O)=O.C1=CC2=CC(N(C)C)=CC=C2[N+](CC)=C1C=CC=CC1=CC=C(N(C)C)C=C1 FGBAVQUHSKYMTC-UHFFFAOYSA-M 0.000 description 1
- 206010025323 Lymphomas Diseases 0.000 description 1
- 229930040373 Paraformaldehyde Natural products 0.000 description 1
- 208000020584 Polyploidy Diseases 0.000 description 1
- 239000012980 RPMI-1640 medium Substances 0.000 description 1
- 239000006146 Roswell Park Memorial Institute medium Substances 0.000 description 1
- FAPWRFPIFSIZLT-UHFFFAOYSA-M Sodium chloride Chemical compound [Na+].[Cl-] FAPWRFPIFSIZLT-UHFFFAOYSA-M 0.000 description 1
- DPXHITFUCHFTKR-UHFFFAOYSA-L To-Pro-1 Chemical compound [I-].[I-].S1C2=CC=CC=C2[N+](C)=C1C=C1C2=CC=CC=C2N(CCC[N+](C)(C)C)C=C1 DPXHITFUCHFTKR-UHFFFAOYSA-L 0.000 description 1
- MZZINWWGSYUHGU-UHFFFAOYSA-J ToTo-1 Chemical compound [I-].[I-].[I-].[I-].C12=CC=CC=C2C(C=C2N(C3=CC=CC=C3S2)C)=CC=[N+]1CCC[N+](C)(C)CCC[N+](C)(C)CCC[N+](C1=CC=CC=C11)=CC=C1C=C1N(C)C2=CC=CC=C2S1 MZZINWWGSYUHGU-UHFFFAOYSA-J 0.000 description 1
- 208000027418 Wounds and injury Diseases 0.000 description 1
- ULHRKLSNHXXJLO-UHFFFAOYSA-L Yo-Pro-1 Chemical compound [I-].[I-].C1=CC=C2C(C=C3N(C4=CC=CC=C4O3)C)=CC=[N+](CCC[N+](C)(C)C)C2=C1 ULHRKLSNHXXJLO-UHFFFAOYSA-L 0.000 description 1
- GRRMZXFOOGQMFA-UHFFFAOYSA-J YoYo-1 Chemical compound [I-].[I-].[I-].[I-].C12=CC=CC=C2C(C=C2N(C3=CC=CC=C3O2)C)=CC=[N+]1CCC[N+](C)(C)CCC[N+](C)(C)CCC[N+](C1=CC=CC=C11)=CC=C1C=C1N(C)C2=CC=CC=C2O1 GRRMZXFOOGQMFA-UHFFFAOYSA-J 0.000 description 1
- JSBNEYNPYQFYNM-UHFFFAOYSA-J YoYo-3 Chemical compound [I-].[I-].[I-].[I-].C12=CC=CC=C2C(C=CC=C2N(C3=CC=CC=C3O2)C)=CC=[N+]1CCC(=[N+](C)C)CCCC(=[N+](C)C)CC[N+](C1=CC=CC=C11)=CC=C1C=CC=C1N(C)C2=CC=CC=C2O1 JSBNEYNPYQFYNM-UHFFFAOYSA-J 0.000 description 1
- 238000002835 absorbance Methods 0.000 description 1
- 230000002378 acidificating effect Effects 0.000 description 1
- 238000004873 anchoring Methods 0.000 description 1
- 239000002246 antineoplastic agent Substances 0.000 description 1
- 230000001640 apoptogenic effect Effects 0.000 description 1
- 238000003782 apoptosis assay Methods 0.000 description 1
- 238000013459 approach Methods 0.000 description 1
- 238000003556 assay Methods 0.000 description 1
- 230000008033 biological extinction Effects 0.000 description 1
- 239000003535 biological staining Substances 0.000 description 1
- 230000008859 change Effects 0.000 description 1
- 238000002512 chemotherapy Methods 0.000 description 1
- 230000000295 complement effect Effects 0.000 description 1
- 239000002131 composite material Substances 0.000 description 1
- 150000001875 compounds Chemical class 0.000 description 1
- 238000001816 cooling Methods 0.000 description 1
- 230000002596 correlated effect Effects 0.000 description 1
- 239000003431 cross linking reagent Substances 0.000 description 1
- 231100000135 cytotoxicity Toxicity 0.000 description 1
- 230000003013 cytotoxicity Effects 0.000 description 1
- 230000007423 decrease Effects 0.000 description 1
- 238000007865 diluting Methods 0.000 description 1
- 239000012895 dilution Substances 0.000 description 1
- 238000010790 dilution Methods 0.000 description 1
- XVLXYDXJEKLXHN-UHFFFAOYSA-M dioc6 Chemical compound [I-].O1C2=CC=CC=C2[N+](CCCCCC)=C1C=CC=C1N(CCCCCC)C2=CC=CC=C2O1 XVLXYDXJEKLXHN-UHFFFAOYSA-M 0.000 description 1
- 238000012850 discrimination method Methods 0.000 description 1
- BFMYDTVEBKDAKJ-UHFFFAOYSA-L disodium;(2',7'-dibromo-3',6'-dioxido-3-oxospiro[2-benzofuran-1,9'-xanthene]-4'-yl)mercury;hydrate Chemical compound O.[Na+].[Na+].O1C(=O)C2=CC=CC=C2C21C1=CC(Br)=C([O-])C([Hg])=C1OC1=C2C=C(Br)C([O-])=C1 BFMYDTVEBKDAKJ-UHFFFAOYSA-L 0.000 description 1
- 238000004090 dissolution Methods 0.000 description 1
- 230000013020 embryo development Effects 0.000 description 1
- 230000007717 exclusion Effects 0.000 description 1
- 239000000834 fixative Substances 0.000 description 1
- GNBHRKFJIUUOQI-UHFFFAOYSA-N fluorescein Chemical compound O1C(=O)C2=CC=CC=C2C21C1=CC=C(O)C=C1OC1=CC(O)=CC=C21 GNBHRKFJIUUOQI-UHFFFAOYSA-N 0.000 description 1
- 238000012921 fluorescence analysis Methods 0.000 description 1
- 239000007850 fluorescent dye Substances 0.000 description 1
- 238000009472 formulation Methods 0.000 description 1
- 238000013467 fragmentation Methods 0.000 description 1
- 238000006062 fragmentation reaction Methods 0.000 description 1
- 159000000011 group IA salts Chemical class 0.000 description 1
- 235000003642 hunger Nutrition 0.000 description 1
- 230000036031 hyperthermia Effects 0.000 description 1
- 239000000819 hypertonic solution Substances 0.000 description 1
- 229940021223 hypertonic solution Drugs 0.000 description 1
- 239000000815 hypotonic solution Substances 0.000 description 1
- 230000007954 hypoxia Effects 0.000 description 1
- 210000000987 immune system Anatomy 0.000 description 1
- 238000002847 impedance measurement Methods 0.000 description 1
- 238000000338 in vitro Methods 0.000 description 1
- 238000001727 in vivo Methods 0.000 description 1
- 238000011534 incubation Methods 0.000 description 1
- 230000004054 inflammatory process Effects 0.000 description 1
- 208000014674 injury Diseases 0.000 description 1
- 238000002372 labelling Methods 0.000 description 1
- 150000002632 lipids Chemical class 0.000 description 1
- 238000011068 loading method Methods 0.000 description 1
- 230000002934 lysing effect Effects 0.000 description 1
- 239000000463 material Substances 0.000 description 1
- QSHDDOUJBYECFT-UHFFFAOYSA-N mercury Chemical compound [Hg] QSHDDOUJBYECFT-UHFFFAOYSA-N 0.000 description 1
- 229910052753 mercury Inorganic materials 0.000 description 1
- 230000029052 metamorphosis Effects 0.000 description 1
- 239000011259 mixed solution Substances 0.000 description 1
- 238000000569 multi-angle light scattering Methods 0.000 description 1
- 239000011824 nuclear material Substances 0.000 description 1
- 230000003204 osmotic effect Effects 0.000 description 1
- 229920002866 paraformaldehyde Polymers 0.000 description 1
- 239000002245 particle Substances 0.000 description 1
- 210000005259 peripheral blood Anatomy 0.000 description 1
- 239000011886 peripheral blood Substances 0.000 description 1
- 230000035699 permeability Effects 0.000 description 1
- 238000005375 photometry Methods 0.000 description 1
- 231100000614 poison Toxicity 0.000 description 1
- 238000002203 pretreatment Methods 0.000 description 1
- 108090000623 proteins and genes Proteins 0.000 description 1
- 102000004169 proteins and genes Human genes 0.000 description 1
- 150000003242 quaternary ammonium salts Chemical class 0.000 description 1
- 239000001397 quillaja saponaria molina bark Substances 0.000 description 1
- 230000005855 radiation Effects 0.000 description 1
- 230000004044 response Effects 0.000 description 1
- 229930182490 saponin Natural products 0.000 description 1
- 150000007949 saponins Chemical class 0.000 description 1
- 239000013049 sediment Substances 0.000 description 1
- 230000035945 sensitivity Effects 0.000 description 1
- 238000000926 separation method Methods 0.000 description 1
- 239000002904 solvent Substances 0.000 description 1
- 230000037351 starvation Effects 0.000 description 1
- 239000004094 surface-active agent Substances 0.000 description 1
- 210000001519 tissue Anatomy 0.000 description 1
- 239000003440 toxic substance Substances 0.000 description 1
- 230000001960 triggered effect Effects 0.000 description 1
- XJCQPMRCZSJDPA-UHFFFAOYSA-L trimethyl-[3-[4-[(e)-(3-methyl-1,3-benzothiazol-2-ylidene)methyl]pyridin-1-ium-1-yl]propyl]azanium;diiodide Chemical compound [I-].[I-].S1C2=CC=CC=C2N(C)\C1=C\C1=CC=[N+](CCC[N+](C)(C)C)C=C1 XJCQPMRCZSJDPA-UHFFFAOYSA-L 0.000 description 1
- 210000004881 tumor cell Anatomy 0.000 description 1
- 230000000007 visual effect Effects 0.000 description 1
- 229910052724 xenon Inorganic materials 0.000 description 1
- FHNFHKCVQCLJFQ-UHFFFAOYSA-N xenon atom Chemical compound [Xe] FHNFHKCVQCLJFQ-UHFFFAOYSA-N 0.000 description 1
Images
Classifications
-
- G—PHYSICS
- G01—MEASURING; TESTING
- G01N—INVESTIGATING OR ANALYSING MATERIALS BY DETERMINING THEIR CHEMICAL OR PHYSICAL PROPERTIES
- G01N15/00—Investigating characteristics of particles; Investigating permeability, pore-volume or surface-area of porous materials
- G01N15/10—Investigating individual particles
- G01N15/14—Optical investigation techniques, e.g. flow cytometry
- G01N15/1456—Optical investigation techniques, e.g. flow cytometry without spatial resolution of the texture or inner structure of the particle, e.g. processing of pulse signals
Landscapes
- Chemical & Material Sciences (AREA)
- Dispersion Chemistry (AREA)
- Physics & Mathematics (AREA)
- Health & Medical Sciences (AREA)
- Life Sciences & Earth Sciences (AREA)
- Analytical Chemistry (AREA)
- Biochemistry (AREA)
- General Health & Medical Sciences (AREA)
- General Physics & Mathematics (AREA)
- Immunology (AREA)
- Pathology (AREA)
- Investigating Or Analysing Biological Materials (AREA)
Abstract
Description
発明の背景
本発明は、損傷白血球(WBC)、有核赤血球(NRBC)および白血球のサブポピュレーション(WBC/Diff)の同時および定量分析の方法に関する。より詳細には、本発明は、多次元光散乱、蛍光分析および白血球細胞膜を傷害することなく赤血球(RBC)を溶解するすることができる溶解試薬を用いることにより、全血サンプル中のWBC、NRBC、損傷WBC、およびWBCサブクラスの分類(WBC/Diff)に関する。
NRBC数は従来血液塗沫形態法により測定する。染色した血液塗沫は顕微鏡下で検査され、NRBCは人によって計数される。一般的には、NRBCの濃度は、白血球(“WBC”)100に対するNRBC数で報告される。標準的には、患者血液塗沫上の同一範囲内に存在する200個のWBCとNRBCを計数し、100個のWBCあたりのNRBC数としてNRBC濃度を表わすために、測定数を2で割る。このタイプの人による顕微鏡を用いた測定方法の大きな問題点は、この方法が非常に骨の折れる集約的で、時間がかかり、しかも統計性に乏しいため主観的で不正確なことである。そのため、長年、正確で自動的なNRBC測定法が、病理医および実験技術者に求められてきた。
臨床用フローサイトメーターで用いるためにNRBC分類法を自動化するにあたり大きな問題点は、NRBCがまれなイベントであり、一方RBC数が非常に多いため、細胞の電気抵抗性の差(インピーダンス測定)あるいは光散乱特性(光学測定)のいずれによっても、赤血球(“RBC”)集団中のNRBC群は容易には検出できないことである。RBC集団の代わりに、WBC群中のNRBC数を測定するような多くの試みがなされたが、これらの努力は一般には成功していない。
フローサイトメーターで利用されている通常の二次元空間区別法では、NRBCがWBC中で十分に境界が限定されたクラスターを形成しないため、NRBC群はWBC群から容易には識別されない。検出された信号を一般的に受け入れられている二次元光散乱(前方対側方)あるいは光散乱対吸収ドットプロットで調べる場合には、通常リンパ球群からNRBC群を識別することができない。NRBC群の大半による信号は通常RBCストロマおよび血小板(“PLT”)の信号と混ざり、さらにNRBCクラスターの上限はしばしばリンパ球群によって占められている領域にまではりだす。
自動化臨床用血液学器機、例えばテクニコンH*1▲R▼,コールターSTK▲R▼Sおよびアボット セル-ダイン▲R▼ 3000および3500器機は、サンプルドットプロットがリンパ球クラスターの下方において、ノイズシグナルが増加したことを示す場合には、NRBCの可能性のある存在に対して、サンプルに“フラッグ”するのみである。上昇したノイズレベルがPLTクランプ、巨大血小板あるいは不完全に溶解されたRBCによるものであり得ることから、本タイプのフラッグは頻繁に偽陽性の結果を生む。さらに、その干渉によりNRBCを含むサンプルの正確な総WBC数およびWBC分類(“WBC/Diff”)を得ることは非常に困難である。さらに、フラッグされたサンプルの血液塗沫は、正確なWBC分類およびNRBC数を得るために、熟練した技術者が試験し、顕微鏡下で計測しなければならない。これは非常に骨のおれる集約的な、主観的な工程である。
これらの困難性にもかかわらず、自然細胞死を示している細胞群、あるいは細胞毒性のある薬剤あるいは抗癌剤などによって傷害されている細胞を正確に特徴付けるためには、サンプル中の無損傷細胞に占める傷害をうけた細胞を同定し、計測することが重要である。生存不可能な細胞は抗体やその他の細胞マーカーと非特異的に結合し、従って、血液学解析によるのと同様に、免疫表現型分類によっても同定、計数すべきである。
生体内では、二種類の異なった細胞死の形態、アポトーシスとネクローシスがある。アポトーシス(本用語はKerrらによって導入された)は、遺伝子によりプログラムされた細胞死であり、変態、胚形成および形態形成中に起きる。好中球は炎症反応中にアポトシスに陥り、リンパ球は免疫系の制御においてアポトーシスに陥る。化学療法で用いる細胞毒性のある傷害物質を含む様々な薬物による細胞傷害が基となってアポトーシスが起る。アポトーシスは前癌状態あるいは癌化した組織中においても示される。アポトーシスの過程において細胞膜は完全な状態のままで、細胞は壊れてアポトーシス小体になり貧食される。一方、ネクローシスあるいは不測の細胞死は、身体的損害、低酸素症、高熱、飢餓、補体による攻撃および化学的傷害などの、有害な傷害に応答して起きる。これらの細胞は細胞外物質を選択的に浸透させる、あるいは漏出させることができなくなり、最終的に原形質膜を失う。原形質膜が本来の状態でなくなった細胞は、正常時には無損傷細胞膜を透過しないような染料などの外部の化合物に対して透過性を有するようになり、“生存不可能”あるいは傷害されたとみなされる。原形質膜が本来の状態でなくなった損傷細胞は代謝的にも機能しない。
血液サンプルが老化する、あるいは、フローサイトメトリー解析に先立って行う細胞を傷害するような細胞調製処理において同様な現象、細胞死が生体外で起る。最近の細胞の調製処理では、モノクローナル抗体(Mab)での標識、赤血球(RBC)の溶解およびさらに破壊されることを防ぐための白血球(WBC)の固定などの長い工程に細胞をさらす。
90°および前方光散乱技術の組み合せが当業界において、無損傷細胞から損傷細胞を区別するために使用されている。しかし、光散乱のみでは、損傷細胞あるいは生存不可能な細胞を生存可能な、あるいは無損傷細胞から明確に分離し、計数するほどは感度が高くないことが知られている。この事は、たとえば血液サンプルなどのようにサンプルが異なった細胞群を含んでいる場合特に該当する。多角光散乱に加え、蛍光核酸染色試薬を用いることで、死細胞の検出感度が劇的に向上する。最近では、サンプル中の細胞が無損傷であるか傷害を受けているかを確認するために光散乱と蛍光技術を用いた様々な方法がある。この技術によって生存可能な、無損傷細胞はフルオレセインジアセテート(FDA)やヨウ化プロピジウム(PI)を用いて、死細胞と識別することができる。これらの方法において、サンプルはFDAあるいはPIのいずれかと処理する。FDAで染色される細胞は生存可能な細胞であると認識され、PIで染色される細胞は“死んでいる”と認識される。しかし、固定した細胞は自家蛍光を発するため、細胞を固定することができず、これらの方法は制限される。さらに、細胞内のエステラーゼによるFDAの加水分解産物であるフルオレセインは非常に明るいため、FITCやフィコエリスリン(PE)などのその他の染色試薬の免疫蛍光シグナルを埋没させてしまう。
米国特許第4,661,913および4,284,412号明細書においてフローサイトメーターでの光散乱分析によるWBCサブポピュレーション分類法が記述されている。米国特許第4,520,110号明細書において光散乱および蛍光を組み合わせて使用する免疫表現型分類による異種白血球群分類法が記述されている。上記の明細書はともに人によるサンプルの調製、および今日の高速多パラメーター血液学分析器に組み込むには時間が長過ぎるインキュベーションが必要な方法について記述している。さらに、これら参考文献は無損傷細胞から損傷細胞を識別する方法を明らかには教示していない。
Valetによる米国特許第4,751、188号明細書は、細胞成分を染料で染色することができ、これは例えばフローサイトメーターで細胞容積と同時に、測定できるとの原理に基づいた方法を記述している。この特許によれば、数分以内に無損傷な血球の計数が可能である。この方法において、血液サンプルは、緩衝化された等張生理的食塩水でサンプルを1:250に希釈する;予め濃度が決められている蛍光RNA/DNA染色試薬、蛍光膜電位感受性染色試薬、蛍光性単分散校正粒子および染色試薬が溶解している有機性溶媒から成る保存溶液の5μlを加える;および混和物を室温で3から5分間保温するステップから成る手順で人により調製される。染料はDMSOやDMFのような有機溶媒中に貯蔵溶液として保存し、細胞を染色するためにこれら貯蔵染料溶液を、ほんの微量のみ細胞懸濁液に直接加える。調製された細胞懸濁液は測定のために、フローサイトメーターのフローセルを通って吸入される。この方法において、DNA/RNA染色試薬が用いられる。このDNA/RNA染色試薬はアクリジンオレンジ(AO)、キナクリン(QA)あるいはピロニンY(PY)のいずれかであり、膜感受性染色試薬は3,3-ジヘキシル-オキサカルボシアニン(DiOC6)である。さらに細胞蛋白質染色試薬;脂質染色試薬;酵素染色試薬;細胞内pH染色試薬およびSH基染色試薬の群から選択した少なくとも一つの染色試薬を使用する。この発明において記述されているように、Valetの方法論は1)有機溶媒に溶解されている染料を、極少量人の手により添加するステップを必要とすることから完全に自動化できず、2)血液細胞計数を完了するのに必要な総時間として、比較的に長時間を要し、3)血液細胞の特性を明らかにするために、少なくとも2種類の染料を必要とするが、このことはクエンチングの問題を生む、4)血液サンプルを250倍希釈する必要があることから、計数時間をより長くしないかぎり統計学的に満足な結果を得るために十分なWBCが提供されない、5)単球、好酸球および好塩基球の分離が可能であると明示していないことは、Valetの教示では不完全なWBC分類結果のみが得られることを示唆している(ただ二つのWBCサブポピュレーション、顆粒球およびリンパ球が図および実施例に示されている)。
Terstappenによる米国特許第5,057,413号明細書は、無損傷および損傷細胞を区別するフローサイトメーターを用いた方法を開示している。この方法においてサンプル中の無損傷および損傷細胞はともに染色される。Terstappenの教示は染色された無損傷細胞と損傷細胞の蛍光強度には十分な違いがあるとの原理に基いている。更に述べられている本開示の目的は、細胞抗原、無損傷細胞および損傷細胞を同時に同定するために、FITCあるいはPEで蛍光標識したモノクローナル抗体と組み合わせた技術による分類法の使用である。ここで、各蛍光標識のピーク発光スペクトルはたがい同士並びに、核酸染料とも異なっていなければならない。この方法において、RBCを塩化アンモニウムで3から5分間溶解し、200gで5分間遠心分離する。沈渣をRPMI 1640培地で二回洗浄し、毎回、200gで5分間遠心分離する。その後、1%牛血清アルブミン(BSA)を含んだリン酸緩衝生理的食塩水(PBS)に細胞を再懸濁させる。サンプルにモノクローナル抗体を添加させる場合には、氷上で20間インキュベートし、細胞をPBS溶液で二回洗浄し、1%パラホルムアルデヒドを含んだ1mlのPBSに再懸濁する。LDS−751の貯蔵溶液は、メタノール中に作製し、作用溶液は貯蔵溶液をPBSに希釈して調製する。本作用溶液の10μlを調製した細胞懸濁液に添加する。他の実験では、RBCを塩化アンモニウムで溶解した後、細胞の最適な光散乱特性が得られるように、分析前に未固定のWBCをRPMI溶液に再懸濁し、1時間放置した。
Terstappenの方法は、固定の過程で温度、固定剤の濃度および固定時間などの変数が細胞膜の透過性を変化させ、その結果、染色強度を変化させ得ることにおいていくつかの問題がある。同じ一群の全ての細胞のDNA含有量は等しい(増殖中の高倍数体腫瘍細胞あるいはリンパ腫細胞を除く)ことから、強く固定された最初は無損傷であった細胞は、強く固定された損傷細胞と同じ染色強度を有する。更に、細胞死の後段階でDNAの断片化が起きた場合には、損傷細胞は少ないDNAを含有し、染色強度は低下する。Terstappenの方法はまた、時間がかかり扱いにくいことから、もし今日の全自動血液学器機に組み込むことが可能でなければ実施は困難である。この特許に報告されている結果は損傷細胞の大部分が、必要な長く、苛むようなサンプル調製過程において発生していることをも示している。
最近、NRBCの検出に関しInamiらの米国特許第5,298,426号明細書が、1994年3月29日に刊行された。本発明は特異的核染色試薬によるWBCおよびNRBCの染色から成る2−段階の方法を教示している。この発明の方法では、血液サンプルを始めに蛍光核染料を含む酸性低張溶液と混和する。その後、pHおよび浸透圧を調節するためにアルカリ塩緩衝液を含んだ溶液をサンプル/最初の試薬溶液と混和する。この最終的な溶液をフローサイトメーターに装填し、その他の有核細胞とともにNRBCを検出、計数する。
Inamiらのアプローチが特に自動化可能な方法において受け入れられないいくつかの理由がある。第一に、酸性−低張溶液は全ての細胞膜を傷害し、WBCに漏孔をあけ、このことにより核染色試薬によるNRBC核の選択的な染色が不可能となる。核物質(DNA)が共通であることから、WBC核を染色せず、NRBC核のみを染色する染料は知られていない。Inamiらによって特許請求されている核染料は一般に用いられる核酸染色試薬、ヨウ化プロピジウムである。
更に、Inamiらの方法は、NRBC核の蛍光シグナルをハウエルジョリー小体、好塩基性斑点、溶解された網状赤血球および網状血小板からのRNA、および,WBCおよび巨核球断片からのDNAなどの他の核残存物の蛍光シグナルと分離あるいは識別することができない。第三に、Inamiらの方法は、準備されたサンプル/試薬溶液を器機に装填する前に、数種類の試薬を用いて、サンプルを“準備”するためにオフラインで予め処理することを必要とする。現在の技術における上記の問題点は本発明において解決されている。
よって、本発明の目的は全血サンプル中の無損傷なWBCから損傷WBCを識別する、およびWBC分類(WBC/Diff)、NRBC、損傷WBCを速く定量する正確な方法を提供することである。
本発明のその他の目的は全血サンプル中の無損傷なWBCから損傷WBCを識別する、およびWBC/Diff,NRBCおよび損傷WBCを高速で定量する全自動化可能な方法を提供することである。
さらに本発明のその他の目的は全血サンプル中の無損傷なWBCから損傷WBCを識別する、WBC/Diff,NRBCおよび損傷WBCを高速で定量する、および免疫表現型分類する全自動化された方法を提供することである。
発明の要約
全血サンプル中の有核赤血球(NBRC)、白血球(WBC),損傷あるいは生存不可能なWBCおよび白血球のサブポピュレーション(WBC/Diff)を同時に定量するフローサイトメーターを用いた分析方法を提供する。本法は、無損傷な細胞膜は透過しない(生体染色試薬)とともにWBCへの生体染色試薬の透過を最小化あるい除去した核酸染色試薬にNRBCの核および生存不可能な細胞の核を曝露させるために、全血サンプルのアリコートからのRBCおよびNRBC細胞質を破壊すること、染色したアリコートをフローサイトメトリーを用いた光測定にかけること、パラメーターとして第一および第二レンジの散乱角の散乱光および蛍光(FL)を含む少なくとも一つのシグナルを得ること、検定されたシグナルは第二の散乱光シグナル閾値よりも大きく、同時に第一散乱シグナルの閾値あるいはFLの閾値{[(第一散乱角シグナルあるいはFLシグナル)および第二散乱角シグナル]}のいずれかよりも大きくなくてはならないとの組合わせ論理による得られたシグナルの検定、検出されたシグナルより検定された蛍光および散乱光の強度シグナルの三次元プロット構築、構築された三次元プロットからの、NRBCとWBCあるいは損傷WBCの区別、およびそれぞれの細胞数の測定から成る。
本発明の他の具体例では、全血サンプル中のNRBC、WBC、WBC/Diffおよび生存不可能な細胞を同時にかつ定量的に分析するための装置を提供する。装置はパラメーターとして第一および第二レンジの散乱角の散乱光および蛍光(FLあるいはFl)を含む少なくとも一つのシグナルを得るためのフローサイトメーターおよび、検定されたシグナルは第二散乱光シグナル閾値よりも大きく、同時に第一散乱シグナルの閾値あるいはFLの閾値のどちらかよりも大きくなくてはならない{[(第一散乱角シグナルあるいは(OR)FLシグナル)および(AND)第二散乱角シグナル]}とのアンド/オアAND/OR論理によってデジタル化するために、フローサイトメーターによって得られたシグナルを検定する三重トリガー回路から構成される。
本発明のその他の具体例には、全血サンプル中のNRBC、WBCおよびWBC/Diffを同時にかつ定量的に解析する方法が提供されている。本方法は血液サンプルのアリコートから、赤血球(“RBC”)を除き、またNRBCの核を露出させるためにNRBCの細胞質を除くこと、生存可能なWBCの染色は最小限としながらの、NRBCの核および生存不可能なWBCの染色、アリコートをフローサイトメトリーを用いた光測定法にかけること、パラメーターとして約0°から約1°での散乱光減衰(ALL)、約3°から10°の散乱光(IAS)および蛍光(F1)含む少なくとも一つのシグナルを得ること、論理が[(全(ALL)シグナル)あるいは(OR)(F1シグナル)および(AND)(3°〜10°の散乱シグナル)]から成るアンドオア論理を用いて得られたシグナルの検定、検出したシグナルから検定された蛍光および散乱光の強度シグナルによる三次元プロットの構築、構築された3次元プロットおよびそれぞれの細胞数の測定による、生存可能な細胞からの生存不可能な細胞の識別、NRBC、WBCおよびWBC/Diffの区別から成る。
本発明のその他の具体例では、全血サンプル中の生存不可能な細胞、NRBC、WBCおよびWBC/Diffの定量的分析のためにフローサイトリー装置が提供されている。本装置はパラメーターとして、約0°から約1°および約3°〜10°の散乱光および蛍光(F1)を含む、少なくとも一つのシグナルを得るためのフローサイトメーター、次の処理を行うようシグナルを確認するために、[(0°から約1°散乱シグナル)あるいは(OR)(F1シグナル)および(AND)(3°〜10°散乱シグナル)]から成るアンドオア論理によってフローサイトメーターから得られたシグナルがデジタル化に適しているかを検定する三重トリガー回路から成る。
本発明のこれら、およびその他の特徴、優位性をその好ましい具体例についての以下の記述において明示する。
【図面の簡単な説明】
図1は本発明の方法を実行するうえで採用される臨床用フローサイトメーターの光学系の概略的な図である。
図2は“確認的”三重トリガー回路を描写した概略図である。
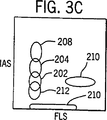
図3A、3Bおよび3Cは、標準あるいは規格通りの検出トリガーを用いた、実施例1で記述したように処理した全血サンプルのWBC、NRBC、赤血球ストロマおよびその他背景ノイズの分布図である。
図4A、4Bおよび4Cは、0°から約1°の散乱軸方向光損失(ALL)トリガーのみを用いた、実施例1で記述したように処理した全血サンプルのWBC、NRBC、赤血球ストロマおよびその他の背景ノイズの分布図である。
図5A、5Bおよび5Cは、3°から約10°の中間角散乱(IAS)トリガーのみを用いた、実施例1で記述したように処理した全血サンプルのWBC、NRBC、赤血球ストロマおよびその他の背景ノイズの分布図である。
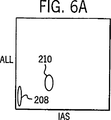
図6A、6Bおよび6Cは、蛍光(FL3)トリガーのみを用いた、実施例1で記述したように処理した全血サンプルのWBC、NRBC、赤血球ストロマおよびその他の背景ノイズの分布図である。
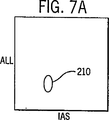
図7A、7Bおよび7Cは、ノイズシグナルを除くために図6で用いられたトリガーのレベルよりも高いFL3のトリガーレベルを用いた、実施例1で記述したように処理した全血サンプルのWBC、NRBC、赤血球ストロマおよびその他の背景ノイズ分布図である。
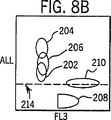
図8は、電子工学的にともに“ORされた”ALLおよびFL3の2つのトリガーを用いた、実施例1で記述したように処理した全血サンプルのWBC、NRBCおよびその他の背景ノイズ分布図である。
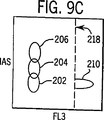
図9A,9Bおよび9Cは、FL3トリガーのレベルが図8の値よりも高く設定されている、ともに電子工学的に“ORされた”ALLおよびFL3の2つのトリガーを用いた、実施例1で記述したように処理した全血サンプル中のWBCおよびNRBCの分布図である。
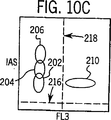
図10A、10Bおよび10CはALL,IASおよびFL3に対するトリガーを用いた、実施例1で記述したように処理した全血サンプル中のWBCおよびNRBC分布図である。
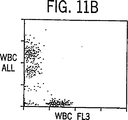
図11Aから11Cは正常あるいは標準検出トリガーを用いた、実施例1で記述したように処理した正常な血液サンプルのドットプロットディスプレーを示している。
図12Aおよび12Bは、標準あるいは正常な検出トリガーを用いた、実施例2に記述したように処理したNRBCを含む異常な血液のサイトグラムを示す。
図13Aおよび13Bは、規格通りの検出トリガーを用いた、実施例3に記述したように処理したNRBCを含む異常な血液のサイトグラムを示す。
図14Aから図14Cは本発明の三重トリガー(ALL,FL3およびIAS)検出方法を利用した、WBC100個あたりNRBC56個を含む全血サンプルの分布を描写する。
図15Aおよび15Bは同様に本発明の三重トリガー(ALL,FL3およびIAS)検出方法を用いた、WBC100個あたりNRBC140個を含む他の全血サンプルの分布を描写する。
図16Aおよび16Bは、本発明の方法を用いて実施例6で記述したように調製および処理した線形性サンプルの結果を示す。
図17は本発明の方法を用いた自動血液学分析器によるNRBCの計測(縦座標)および人による顕微鏡でのNRBCの計測(横座標)との相関プロットである。データは実施例7に記述したように処理した。
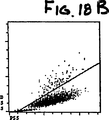
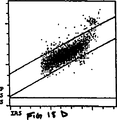
図18Aから18Fは実施例8で記述した正常血サンプルのサイトグラムを示す。
図19Aから19Fは実施例9で記述したNRBCを含む(4.99k/μlあるいはWBC100個あたりNRBC46.6個)異常血液のサイトグラムを示す。
図20Aから20Fは実施例10で記述した損傷リンパ球を含むサンプルのサイトグラムを示す。
図21Aから21Fは実施例11で記述した冷却状態において35時間老化させた正常血のサイトグラムを示す。
図22Aから22Fは実施例12で記述した強く固定したヒトWBCおよび血小板をヒトRBCフラクションと混合し、ヒト血漿中に再懸濁して処理したサンプルのサイトグラムを示す。
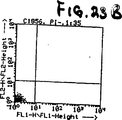
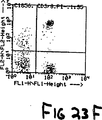
図23Aから23Fは実施例13で記述したように処理した血液サンプルの市販されているフローサイトメーターのディスプレーである。
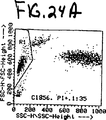
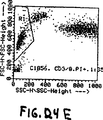
図24Aから24Fは実施例14で記述したように処理した血液サンプルの市販されているフローサイトメーターのディスプレーである。
発明の詳細な説明
広くは、本発明は全血サンプル中のWBC分類(Diff),NRBCおよび細胞生存率を同時に分析する自動化方法に関する。
本発明の一つの側面は、測定法が溶解試薬/染料系を利用していることであり、この方法はWBCの細胞膜、好ましくはWBC表面抗原の傷害を最小限に抑えながらもRBCおよびNRBCの細胞質を溶解し、さらに無損傷細胞の膜には浸透しない(生体染色試薬)核酸染料により、露出されたNRBCの核およびあらゆる損傷WBCの核を染色する。無損傷WBC核は排除によって染色されない。
開示された方法はまた、WBC/Diff分析を行う前に総WBCシグナルからNRBCと同定されるシグナルを差し引くことによって、NRBCを含む血液サンプル中の正確なWBC/Diff分析を行えるようにする。NRBCおよび損傷WBCの染色には一種類の染料のみが必要である。これにより、WBCサブクラスの光散乱特性の差によるWBC/Diff分析が可能になる。FL3+シグナルによって傷害されていると同定されたWBCサブクラスは、それらが属するサブクラスに戻して加えられ、このことにより、損傷WBCを含んだサンプル中の正確なWBC/Diffの結果が得られる。
開示された系において、WBC/Diff、NRBCおよび損傷WBCを1ステップで同時に分析するために、生体染色試薬を、約10から20mM緩衝液、非四級アンモニウム塩、界面活性剤および、ごく低濃度のWBC固定剤を含む、pH約6.0から7.5、浸透圧モル濃度が約230から310mOsm/Lの多目的試薬系と組み合わせる。
本発明で用いることができる生体核酸染色試薬は無損傷細胞の膜に浸透せず、これらが核酸と結合していない場合には、比較的高い吸光率と低蛍光強度を有する。生体染料のスペクトル特性[吸光(EX)最大値(nm)/放射(EM)最大値(nm)]は、本システムで用いられるレーザー光源と両立でき、それらの放射スペクトルは免疫表現型分類において用いるMabと結合させたフルオロクロムの放射スペクトルとオーバーラップしてはならない。
本開示システムへの生体染料には以下の特性が望まれる;
高吸光率;
高量子発生;
核酸への高結合親和性;
核酸に結合していない時の低蛍光;および
スペクトル特性が、検出システムで使用される光源と両立できなければならない。例えばアルゴンレーザー光源に対しては、EX最大値は488nm近辺、EM最大値は630nm近辺である。
これは、開示された方法での使用に、EX最大値のレンジが488近辺の生体染料を限定するものではない。HeNe,キセノンあるは水銀灯などの適当な光源によってこれらの染料を異なったEX最大値で励起させ得るは当業者においてよく知られている。
開示された系において、適当な光源と使用するのに適した多くの核染料がある。開示されている系において使用が可能な市販されている染料には7-アミノアクチノマイシンD、YOYO−1、YOYO−3、TOTO−1、TOTO−3、BO−PRO−1、YO−PRO−1、TO−PRO−1その他多くのものがある。
本発明の好ましい具体例の中で、アルゴンレーザーとともに使用できる市販されている適した染料は、ヨウ化プロピジウム(PI)、エチジウムブロマイド(Ebr)、エチジウムホモダイマー−1(EthD-1)、エチジウムホモダイマー−2(EthD-2)、ジエチレントリアミン(DTA)である。
本発明の好ましい具体例の中で、生体染料はPIであり、多目的試薬系は、塩化アンモニウム約5.0g/L,重炭酸カリウム約2g/L、サポニン約100mgs/Lから約150mgs/Lおよびホルムアルデヒド約0.07%を含むpH約6.5から7.0、浸透圧モル濃度が約260の約15mMの酢酸緩衝液、およびアンド/オア論理を用いてシグナルをデジタル化に適格化させる三重閾値シグナルルーチンを有する。このような試薬が本明細書で参照として取込まれているPCT出願第94/18828号“全血サンプルの急速溶解のための多目的試薬系”において開示、記述されている。しかし、試薬がWBCの細胞膜を傷害し、予め(溶解前)生存可能なWBCの核が染色されはじめたりしない限り、いずれの溶解試薬も使用することが可能である。
試薬/染料/サンプル混合物は本質的に一時に一細胞ずつ、照射された光学フローセルを通過させる。このことにより、細胞は照射光を散乱し、いずれの染色された核もが蛍光を示す。散乱光および蛍光シグナルを既知の方法および検出したシグナルの処理と連結した三重トリガー法を用いて検出し、これによりWBC、WBC/Diff,損傷WBCおよびNRBCの同定および定量が可能となる。1995年7月7日に出願され、ここで参照として取込まれている米国特許出願第08/283,379号“自動分析の実行の方法および器機”において、本発明の三重トリガー法と特に両立できることが知られている血液学分析器が開示、記述されている。以下の記述はこの血液学分析器に限定されている。この記述は単に便宜上のためであり、本発明は決してただ一つの器機に限定されるわけではない。
全血サンプルの一部、約25μlがサンプル吸入プローブによって約850μlの等張溶解試薬を含んだWBCカップの中に入れられる。溶解試薬は血液サンプルの赤血球フラクションを溶解するとともに、存在するいずれのNRBCの核をも露出するようにNRBCの細胞質を溶解する。血液の赤血球フラクションを溶解すると同時に、本試薬はWBCフラクションを保護する、あるいは傷害しないよう十分に作用の穏やかなものでなければならない。三重トリガー法においてたとえどのような溶解剤の調剤が使用されているとしても、末梢血中に存在するいかなるNRBCをも効果的に標識する程度の低濃度の生体染料をさらに試薬に含ませる、あるいは組み合せる。好ましくは、先に参照されている分析器とともに使用するため、溶解剤の化学的性質は屈折率がシース溶液と実質的に0.1%以下の差で一致するように適応させる。
溶解試薬およびサンプルの混和物は標準的には先に参照されたWBCカップの中に11秒間だけとどまる。そこで、42±3℃で溶解され混和される。この時点で、WBCカップの中身は検出のために、直接管の中を光学フローセル100に移動する。図1参照。
細胞がレーザー照射された容積を一列縦隊で通過するように、溶解液を加えて希釈し、希釈剤/シース溶液によって囲まれた層流のサンプル流中の細胞流がフローセル100を通過した時点で測定工程が開始される。照射された容積は、流体力学的に焦点をあわせられた細胞の流れにより、フロー軸の方向に垂直な二次元に、また、約17ミクロンのレーザー光線の水平な光線のくびれにより、フロー軸方向に平行な方向にはじかれる。本試験施行中に、サンプル流速は一秒あたり約2.5マイクロリッターであり、WBCおよびNRBCの対応している照射された検出容積は約80x5x17ミクロンの楕円柱の容積と近似している。17ミクロンの長さは、円柱の軸に沿って測定される。
この点においてまた図1で示したように、細胞の存在は軸方向光線損失(ALL)および中間角散乱(IAS)を検出する合成フォトダイオード102、赤色蛍光を検出する増倍型光電管104および図2に示す、ALL,IASおよびFL3(赤色蛍光)の三次元フィーチャー間隔の中の独特な三重トリガー回路によって検出される。三重トリガー回路はアンド/オア論理を用いてシグナルをデジタル化するために検定する。検定されたシグナルはIASトリガーよりも大きく、同時にALLトリガーあるいはFL3トリガーのいずれかよりも大きくなければならない。この独特なトリガー回路を、均衡がとれた固着剤を含む溶解特性と組み合せることにより、露出したNRBCおよび損傷WBCの核が急速に染色され、DNA断片、RBCストロマおよび血小板のような、蛍光性および非蛍光性バックグラウンドの一般的な干渉を受けることなく、はっきりと明確に計数され、WBC分類細胞計数から除かれる。
好ましくは、前方中間角散乱(IAS)および小角前方拡散(SAS)あるいは軸方向光損失(ALL;前方向減衰としても知られている)を測定するために、一つあるいはそれ以上の検出器を前方光路中に設置する。ALLは一般的に、細胞がレーザー光線の前を通過することによる光エネルギーの減衰であり、フォトダイオードによって検出される。光損失は一般に散乱によるものであり、光線中を細胞が通過することによる、レーザー光線の通路中に設置された検出器に到達する光エネルギーの減衰として検出される(一般にALLは約0°から約1°の角で検出される)。これに対して、小角前方拡散(SAS)は、入射レーザー光線の外部(しかし、約1°から3°の狭い角度内にある)の検出器に達した光エネルギーであり、これは光線中を通過している細胞からの散乱による。通常、光線を止めれば検出器にレーザー光線が到達するのを抑えられる。ALL検出システムは、レーザー照射の入射錘中の光を収集し、一方、小角前方拡散システムはこの錘の外部の光を収集する。ALL測定システムにおいて、問題とするシグナルは安定した状態のレーザーシグナルから除かれたマイナスシグナルであり、一方小角前方拡散測定では、ごく低いバックグラウンドの光レベルに付加されたわずかなプラスシグナルである。光が入射レーザー光線からより大きな角度で散乱される事を除いて、前方中間角散乱(IAS)は、小角前方拡散と類似している。より本質的には、IASはレーザー光線の入射あるいは中心線から約3°から10°離れた輪の中の光散乱に関する。好ましい具体例では、ALLはレーザー軸から水平に約0.3°以下、垂直に1.2°以下の角度の中で収集され、IASはレーザー軸から約3°から10°の間の角度で収集される。
このようにトリガーされた細胞が前述の照射された容積を通過する際、検出器102、104、106および108においてパルスが発生する。これらパルスの振幅はフィルターにかけられ、増幅され、デジタル化され、ALL,IAS,FL3,PSS(偏光側方散乱)およびDSS(偏光解消側方散乱)の対応する5次元フィーチャー間隔中のリストモードに保存される。フローセル100を通過する標準的な計測時間は10秒である。先に記述した流速および希釈比率では、血液1μlあたり7000個の正常な患者WBC数では、得られるイベント計測速度は5000である。少計測数サンプルでは、測定値の統計を向上させるために、この計測時間は自動的に延長される。測定時間が終了すると、サンプル流は管を通って廃棄され、プローブが洗浄され、乾燥され、次のサンプルを分析するために準備される。
前記ALL,IAS,FL3,PSSおよびDSSの5次元フィーチャー間隔のリストモードデータに、アルゴリズムが応用され、以下のタイプの細胞が計数され、および/あるいは処理時間の30秒以内にフラッグされる。
以下に記述するように、ALLおよびIASシグナルはWBC/Diff分析のために検出、収集され、染色されたNRBCの核からのFL3シグナルはNRBC分析のために収集される。図2に示す三重トリガー回路はアンド/オア論理を用いてこれらのシグナルをデジタル化するために検定する。検定させるためには、シグナルはIASトリガーよりも大きく、同時に、ALLトリガーあるいはFL3トリガーのいずれかよりも大きくなければならない。
図2において同定された、いくつかの成分および生成されたあるいは利用されたシグナルは、以下の標識に対応する:
300−ALL電圧コンパレーター
302−ALLシグナル
304−ALL閾値電圧(Vth1)
306−ALL電圧コンパレーター出力
310−FL3シグナル
312−FL3閾値電圧(Vth2)
314−FL3電圧コンパレーター
316−FL3電圧コンパレーター出力
318−IASシグナル
320−IAS閾値電圧(Vth3)
322−IAS電圧コンパレーター
324−IAS電圧コンパレーター出力
326−ORゲート
328−ORゲート出力
330−ANDゲート
332−確認(Valid)トリガー出力
それぞれのチャンネルからのリアルタイムシグナルは電圧コンパレーターの入力にある。電圧コンパレーター300、314および322は“+入力”(302、310および318)を“−入力”(304、312および320)と比較することによって、結果として出力(306、316、324)が生ずるように機能する。もし、“+入力”の電圧が“−入力”より高ければ、出力は高くなる。もし、“+入力”の電圧が“−入力”よりも低ければ出力は低くなる。
閾値電圧はシステムパラメーターによって決められる独立した電圧である。
コンパレーター300および314の出力はORゲート326への入力であり、結果としてORゲート出力328を生じる。ORゲートはその入力を比較することで機能する。どちらか入力の一方あるいは両方が高ければ、出力も高くなる。
ORゲート328の出力およびコンパレーター322および324の出力はANDゲート330の入力である。ANDゲートはその入力を比較することで確認トリガー出力でもある出力332を生ずるよう機能する。両入力が高い場合のみ出力は高くなる。
IASシグナル318がその閾値電圧320より大きく、ALLシグナル302がその閾値電圧304より大きいあるいは/およびFL3シグナル310がその閾値電圧312より大きい場合のみ確認トリガー出力332は高くなる。
ALLおよびIASはWBC/Diff分析のため収集され蛍光(FL3)シグナルはNRBCおよび損傷WBC分析のため収集される。三重閾値回路あるいは検定ルーチンがアンド/オア論理を用いてシグナルをデジタル化のために検定する。この独特なルーチンあるいは回路によって検定されるためにはシグナルはIAS閾値よりも大きく、同時に、ALL閾値あるいはFL3閾値のいずれかよりも大きくなければならない。このトリガー回路を用いて、NRBCは前述の3次元間隔中において独特のクラスターを形成し、(図14および図15参照)、これは光学的WBC分類分析において容易に計数され、明確にWBC数から除かれる。例えば、WBC100個あたりのNRBC数および患者の血液1μlあたりの総NRBC数が報告される。結果的にNRBCは総WBC数から除かれ、血液サンプルにNRBCが存在しても正確なWBC数および分類分析が可能となる。ALLおよびFL3トリガーの両方の上に位置するシグナルは損傷WBCとして同定される。損傷WBCサブポピュレーションは無損傷なWBC分類分析と同様の方法で同定される。DNA断片、RBCストロマ、血小板、ハウエル−ジョリー小体、好塩基性斑点、溶解されたRBCのRNA、WBCおよび巨核球断片のDNAなどからの、蛍光性および非蛍光性バックグランドノイズは実質的に除かれる。染色されたNRBCの核は開示された三重トリガー処理(ALL,IASおよびFL3による)を介して様々なバックグランドノイズシグナルから分離され、ALL対FL3ドットプロットに関しFL3閾値の上にあるNRBCの核からのFL3+シグナルのみがNRBCとして計数される。
図3から10において以下に列挙した番号で同定されている細胞群エリアは以下の細胞のタイプに対応する:
202=リンパ球 208=オリジンノイズ
204=単球 210=NRBC
206=顆粒球 212=ストロマ
開示されたシステムのその他の技術的な優位性は、NRBCの細胞質が完全に溶解されることから、それらの核が染色試薬を受入れ易くなっており、有効かつ正確にNRBCを染色するためにより低濃度の染色試薬を必要とすることである。この条件ではNRBC検出において、100を超える高いシグナル対ノイズ(S/N)比率を得ることができる。このシステムにおいて、WBC/Diff/NRBC/損傷WBCを迅速に分析するために必要な生体染料の濃度はわずか1から2μg/mlであり、これは現在の技術において必要な濃度の少なくとも50分の1である。
開示された方法は、その他の細胞破壊物からの干渉なしに自動的に、正確かつ迅速にWBC/Diff/NRBC/損傷WBCの同時分析が可能である点において独特である。本発明の更なる優位性は、WBC、RBCおよび血小板計数用ルーチンにキャリブレートされている臨床用血液学分析器に本方法を組み入れることが可能である点において非常に高い医療価値を有することである。このシステムは正確な臨床血液サンプル中のWBC/Diff/NRBC/損傷WBCデータ(%および絶対数)を得ることができる。この事は現在まで可能ではなかった。
実施例1
EDTA−抗凝固処理した新鮮な正常血液を、先に記述した1995年7月7日に出願され、本明細書中に参考として引用されている米国特許出願第08/283,379号明細書“自動化分析実施のための方法と器機”において開示、記述されている自動化臨床血液学分析器の試験ユニットにて試験した。本発明が前記の分析器に組み入れられているが、以下の実施例すべてにおいて常に利用されるわけではない。25μlの血液サンプルが、本明細書中に参照として引用されている、PCT出願第94/18828号明細書“全血サンプルの高速溶解のための多目的試薬系”において開示されている等張多目的試薬(pH6.5,260mOsm/L)675μlとオンラインで混和された。
これらの実験のために多目的試薬系は約95mM塩化アンモニウム(5g/l)、容積で約0.075%のホルムアルデヒド、約10mMから約20mMの酢酸緩衝液、約10mMの重炭酸カリウムおよび重量/容積で約0.01%(例えば、100mlあたりのg)のサポニンを含んで構成された。本試薬システムのpHは約6.2から約7.0の範囲に調整され、本試薬システムの浸透圧モル濃度は約215から約270mOsm/Lであった。
試薬は器機の加熱された混和チャンバー中で、予め42±3°に温められ、ここでサンプルおよび試薬が混和され、11秒間保温された。この混和物はWBC/Diff/NRBC分析を行うために、フローセルに移された(8.5秒かかる)。本システムの視覚的構成を図1に表示する。本分析は三重トリガー回路を用いることなく、当業界で一般的なALLおよびFL3のみの二重トリガーを用い実施した。図3Aから10Cまでのすべての図を参照のこと。
図11Aの上方のドットプロットはサンプルから得られた光散乱シグナル(ALL対IAS)を描写し、3つの異なったWBC群を示している。正常な血液は多くの好塩基球を含んでいないため、ここでは好塩基球のクラスターは認められない。好酸球はDSS対PSSドットプロット(図示さず)により分離されるため、ここでは好酸球のクラスターは示されておらず、図11Bの中段のサイトグラムは表示されているようにALLおよびFL3シグナルのドットプロットを示している。正常血液はNRBCを含んでいない。図11Bおよび11Cのより低い位置にあるFL3+クラスターは明らかに、先に記述したRNAあるいはDNAを含んだ細胞破壊物である。
実施例2
それぞれ上段および下段にあるサイトグラム12Aおよび12Bは標準検出法を利用し実施例1において記述したように分析したNRBCを含んだ(WBC100あたりNRBC47)異常な血液のドットプロットディスプレーである。上のサイトグラム中においてリンパ球群の右下にあるクラスターはNRBCに属し、左角の底辺にある小さなクラスターはRBCストロマ(網状赤血球、ハウエルジョリー小体など)、血小板およびWBC破壊物を含むオリジンノイズに属する。図12Bはこのサンプルのオリジンノイズクラスターが、核染料によって明るく染色され、FL3チャンネルにおいて染色されたNRBCクラスターの非常に近傍につづいていることから、NRBCを正確に計数するようFL3トリガーを設定することは不可能であることを示している。
実施例3
図13Aおよび13Bのサイトグラムは標準検出法を利用し、実施例1で記述したように分析したNRBCを含む(WBC100あたりNRBC51)異常な血液のドットプロットディスプレーである。一番上のディスプレー、図13A中で、リンパ球群の右下のクラスターはNRBCに属する。本サンプルのFL3+オリジンノイズが増加しているのが認められる。ノイズクラスターはFL3チャンネルにおいてNRBCクラスターの非常に近傍に位置する。このため、FL3のノイズはFL3トリガーの位置と干渉している。FL3トリガーをすべてのオリジンノイズを除去するほど高く設定した場合、同時にNRBC群の一部も図13Bに示すようにFL3トリガーの下で失われる。
実施例4
図2の本発明の開示された三重トリガー回路(ALL/IAS/FL3)を、実施例1から3で使用されたのと同じ器機に組み入れ、本手順を通して利用した。
WBC100個あたりNRBC56個を含む、EDTA抗凝固処理した臨床サンプルを実施例1に記述したように分析した。結果を図14Aから14Cに示す。FL3+ノイズクラスターが消失している。ノイズジグナルは加えられたIASトリガーにより遮断される。トリガーは全てのNRBC群を回収するほど低く設定されているが、この異常な血液からの蛍光性オリジンノイズはもはやFL3トリガーの上には認められない。(NRBCの環状形に注意。)
実施例5
図15Aおよび15Bは、同様に三重トリガー(ALL,FL3およびIAS)を実施した後の、WBC100個あたりNRBC140個を含む別の臨床全血サンプルのNRBC分布のドットプロットを示す。オリジンノイズは認められず、総NRBC群はFL3トリガー上に回収されている。このサンプル中でのNRBCの濃度が非常に高いため、NRBCクラスターの密度が高い。
実施例6
EDTA抗凝固処理した正常ヒト血液に様々な濃度の未固定ニワトリ赤血球を加えることにより直線性サンプルを作製した。サンプルは本発明の三次元検出法を利用して実施例1において記述したように分析した。ニワトリ赤血球の細胞質は、本発明の方法により溶解され裸の核(CEN)のみが残る。CENは希釈剤中の生体核染料(PI)で速やかに染色され、蛍光性(FL3)になる。FL3+CENは本発明の方法においてNRBCとして計数され、WBC100個あたりのNRBC数および全血サンプル1μlあたりの実数として報告される。結果を図16Aおよび16Bに表示する。図中のWBC100あたりのNRBC数およびNRBCの実数による直線性プロットは本発明の方法が直線的NRBC計数を生じることを示している。
実施例7
図17は本発明の方法によって得られた85臨床サンプルのNRBC数(縦座標)の相関プロットを示す。結果は参照したヒトによる顕微鏡での測定数(横座標)と相関した。ヒトによるNRBC計測には、ライトギムザ染色された各患者の血液塗沫において200個のWBC分類を行い、同じ範囲内に存在するNRBC数を二で割り、WBC100個あたりのNRBC数を報告した。相関係数(R)は0.973(R2=0.946)、勾配は0.86、Y切片は1.32であった。
実施例8
1995年7月7日に出願された米国特許出願第08/283、379号明細書“自動分析実施の方法および器機”において開示、記述されている血液学分析器の加熱したボルテックスミキサーの中に、血液サンプルの25μlを入れて、実施例1の多目的試薬(pH7.0,260mOsm/L)675μlと混和し、オンラインで42℃で11秒間保温した。本混和物はその後自動的にフローセルに移送され分析された(WBC分類、NRBC分析におよそ8.5秒)。図18Aから18Fは血液のサイトグラムである。最上段左の光散乱シグナル(ALL対IAS)のサイトグラム、図18A、はWBCの3つの異なった群(好中球、単球およびリンパ球)を示す。正常な血液は約1%かそれ以下の好中球しか含有しないためここでは好中球クラスターは認められない。好酸球は最上段右のDSS対PSSサイトグラム、図18Bにおいて分離されている。中段左のサイトグラム、図18CはALL対FL3のシグナルディスプレーである。正常血液はNRBCを含ず、図18Cの垂直線の右(FL3+シグナル)には損傷細胞がほとんどない。
実施例9
NRBCを含む異常血液(4.99k/μlあるいはWBC100個あたりNRBC46.6個)を実施例8で記述したように分析し結果を図19Aから19Fに示す。最上段左のサイトグラム(ALL対IAS)中のリンパ球群の右下に位置するクラスターはNRBCに属する。最下段右のサイトグラム(ALL対FL3+),図19Fは、裸にされたNRBC核が鮮明に染色され、FL3+トリガーの上に引きあげられ計数されていることを示す。NRBC数はWBC分類分析の前に、このようにして総WBC数から除かれ、正確なWBC分類結果が得られる。
実施例10
損傷リンパ球を含んだ臨床サンプル(CLL)を実施例8で記述したように分析し、結果を図20Aから20Fに示す。最上段のサイトグラム(ALL対IAS),図20Aのリンパ球群の右下すぐ近傍に位置するクラスターは損傷リンパ球に属する。図20C(ALL対FL3+)は、リンパ球群のほとんど1/2が核酸染料(PI)で染色されたことを示す。サンプルの顕微鏡による塗沫検査ではリンパ球群の約50%がよごれ細胞あるいは細胞膜を失った細胞(裸核リンパ球)であることが示された。損傷リンパ球はその光散乱シグナルが裸のNRBCの核のシグナルよりも高いことからALL軸方向に沿ってNRBCから識別される。
実施例11
冷蔵条件下で35時間保存し、老化した正常な血液サンプルを実施例8に記述したように分析し、結果を図21Aから21Fに示す。サンプルは実施例8に記述したように処理した。ALL対FL3サイトグラム、図19Fにおいて顆粒球とリンパ球の右に示されたFL3+シグナルはそれぞれ損傷顆粒球およびリンパ球を示す。
実施例12
強く固定されたヒトWBCおよび血小板をヒト赤血球フラクションと混和し、ヒト血漿中に再懸濁することで、処理したサンプルを作製した。この混和物は実施例8のように分析し、結果を図22Aから22Fに示す。本明細書で開示された多目的試薬系によって保護されたWBCとは異なり、強く固定した細胞のALL対FL3サイトグラム、図22Cは全てのWBCが非常に濃く染色されていることを示している。交差結合試薬は細胞膜を非常に多孔性にし、核酸染料を細胞に浸透させる。WBCのサブポピュレーションは、1995年7月7日に出願された米国特許出願第08/283、379号明細書“自動分析実施のための方法および器機”において記載されている多次元光散乱分析により同定される。
実施例13
2種類の正常血液サンプルそれぞれ50μlを別々のテストチューブ中で抗CD3-FITCおよび抗CD4-PEを含んだ10μlのMab溶液と混和した。
二本の新たな別々のチューブ中で再び正常血液サンプルのアリコート50μlを抗CD3-FITCおよび抗CD8-PEを含んだ10μlのMab溶液と混和した。ネガティブコントロールはテストチューブにMab溶液を加えずに調製した。混液は室温で15分間保温し、それぞれのチューブに予め42℃に温めた核酸染料を含まない実施例1の多目的試薬1.7mlを加えた。サンプルをファックスキャン▲R▼器機(ベクトン、ディッキンソン社)に送り、多目的試薬を加えてから正確に11秒後にシグナル捕捉を始める。結果を図23Aから23Fおよび表1に示す。最上段のサイトグラム、図23AおよびBは正常血液のネガティブコントロールを示し、左のサイトグラム、図23Aはリンパ球にゲートをかけていることを示す前方散乱(FCS)対90°側方散乱を示し、右のサイトグラム、図23BはFL1対FL2の二次元ディスプレーを示し、中央のサイトグラム、図23CおよびDは抗CD4 Mabと反応させた同じサンプル、最下段のサイトグラム、図23EおよびFは抗CD8Mabと反応させた同じ血液を示す。
実施例14
2種類の正常血液サンプルの50μlを、抗CD3-FITCおよび抗CD4-PEを含む10μlのMab溶液とテストチューブの中で混和した。別のテストチューブで正常血液サンプル50μlを抗CD3-FITCおよび抗CD8-PEを含む10μlのMab溶液と混和した。ネガティブコントロールはMabを加えずに調製した。混液は室温で15分間保温し、予め42°に温めたPI(0.2μg/ml)を含む先に記述した多目的試薬1.7mlを加えた。サンプルをファックスキャン▲R▼器機(ベクトン、ディッキンソン社)に送り、多目的試薬を加えてから正確に11秒後にシグナル捕捉を始める。結果を図24Aから24Fおよび表1に示す。最上段のサイトグラム、図24AおよびBは正常血液のネガティブコントロールを示し、左のサイトグラム、図24Aはリンパ球にゲートをかけていることを示す前方散乱(FCS)対90°側方散乱を示し、右のサイトグラム、図24BはFL1対FL2の二次元ディスプレーを示し、中央のサイトグラム、図24CおよびDは抗CD4 Mabと反応させた同じサンプル、最下段のサイトグラム、図24EおよびFは抗CD8Mabと反応させた同じ血液を示す。
Background of the Invention
The present invention relates to a method for simultaneous and quantitative analysis of damaged leukocytes (WBC), nucleated red blood cells (NRBC) and leukocyte subpopulations (WBC / Diff). More particularly, the present invention relates to WBC, NRBC in whole blood samples by using multidimensional light scattering, fluorescence analysis and a lysis reagent that can lyse red blood cells (RBC) without damaging white blood cell membranes. , Damage WBC, and WBC subclass classification (WBC / Diff).
The NRBC number is measured by the conventional blood smear form method. Stained blood smears are examined under a microscope and NRBC is counted by a person. In general, the concentration of NRBC is reported as the NRBC count for 100 white blood cells (“WBC”). Typically, 200 WBCs and NRBCs present in the same range on the patient blood smear are counted and the number of measurements is divided by 2 to represent the NRBC concentration as the number of NRBCs per 100 WBCs. A major problem with this type of human measurement method using a microscope is that it is subjective and inaccurate because it is very laborious, intensive, time consuming and poorly statistical. For this reason, pathologists and laboratory technicians have been required for many years for accurate and automatic NRBC measurement methods.
A major problem in automating NRBC taxonomy for use in clinical flow cytometers is that NRBC is a rare event, while the number of RBCs is so high that the difference in cellular electrical resistance (impedance measurement) or The NRBC group in the red blood cell (“RBC”) population cannot be easily detected by any of the light scattering properties (optical measurements). Many attempts have been made to measure the number of NRBC in the WBC group instead of the RBC population, but these efforts have generally not been successful.
In the usual two-dimensional spatial discrimination method used in flow cytometers, NRBCs do not form well-bounded clusters in WBC, so NRBCs are not easily distinguished from WBCs. When the detected signal is examined by generally accepted two-dimensional light scattering (forward vs. side) or light scattering vs. absorption dot plot, the NRBC group cannot usually be distinguished from the lymphocyte group. Signals from the majority of NRBC groups usually mix with RBC stroma and platelet (“PLT”) signals, and the upper limit of NRBC clusters often extends to areas occupied by lymphocyte groups.
Automated clinical hematology machine, eg Technicon H * 1▲ R ▼, Coulter STK▲ R ▼S and Abbott Cell-Dyne▲ R ▼ The 3000 and 3500 instruments only “flag” the sample for the possible presence of NRBC if the sample dot plot shows an increased noise signal below the lymphocyte cluster. This type of flag frequently produces false positive results because the elevated noise level can be due to PLT clamps, giant platelets or incompletely lysed RBCs. Furthermore, it is very difficult to obtain an accurate total WBC number and WBC classification (“WBC / Diff”) for samples containing NRBC due to the interference. In addition, blood smears of flagged samples must be tested and measured under a microscope by a skilled technician in order to obtain an accurate WBC classification and NRBC count. This is a very intensive and subjective process.
Despite these difficulties, to accurately characterize cells that exhibit natural cell death, or cells that are damaged by cytotoxic drugs or anticancer agents, occupy the intact cells in the sample. It is important to identify and measure the damaged cells. Non-viable cells bind non-specifically to antibodies and other cellular markers and should therefore be identified and counted by immunophenotyping as well as by hematology analysis.
In vivo, there are two different forms of cell death, apoptosis and necrosis. Apoptosis (the term was introduced by Kerr et al.) Is a gene-programmed cell death that occurs during metamorphosis, embryogenesis and morphogenesis. Neutrophils fall into apoptosis during the inflammatory reaction, and lymphocytes fall into apoptosis in the control of the immune system. Apoptosis occurs based on cytotoxicity caused by various drugs including cytotoxic toxic substances used in chemotherapy. Apoptosis is also shown in precancerous or cancerous tissues. In the process of apoptosis, the cell membrane remains intact, and the cells are broken into apoptotic bodies and phagocytosed. On the other hand, necrosis or unexpected cell death occurs in response to harmful injuries such as physical damage, hypoxia, hyperthermia, starvation, complement attack and chemical injury. These cells cannot selectively permeate or leak extracellular material and eventually lose the plasma membrane. Cells whose plasma membrane is no longer in its original state become permeable to external compounds such as dyes that normally do not permeate intact cell membranes and are considered “non-viable” or damaged. It is. Damaged cells whose plasma membrane is no longer intact will not function metabolically.
A similar phenomenon, cell death, occurs in vitro in a cell preparation process in which a blood sample ages or cells are damaged prior to flow cytometry analysis. Recent cell preparation processes expose cells to long steps such as labeling with monoclonal antibodies (Mab), lysis of red blood cells (RBC) and fixation of white blood cells (WBC) to prevent further destruction.
A combination of 90 ° and forward light scattering techniques is used in the art to distinguish damaged cells from intact cells. However, it is known that light scattering alone is not so sensitive as to clearly separate and count damaged or non-viable cells from viable or undamaged cells. This is especially true when the sample contains different cell groups, such as a blood sample. By using a fluorescent nucleic acid staining reagent in addition to the multi-angle light scattering, the sensitivity for detecting dead cells is dramatically improved. Recently, there are a variety of methods using light scattering and fluorescence techniques to confirm whether cells in a sample are intact or damaged. Viable intact cells can be distinguished from dead cells using fluorescein diacetate (FDA) or propidium iodide (PI). In these methods, samples are treated with either FDA or PI. Cells stained with FDA are recognized as viable cells, and cells stained with PI are recognized as “dead”. However, since fixed cells emit autofluorescence, they cannot be fixed, and these methods are limited. In addition, fluorescein, a hydrolyzate of FDA by intracellular esterases, is so bright that it embeds the immunofluorescent signal of other staining reagents such as FITC and phycoerythrin (PE).
U.S. Pat. Nos. 4,661,913 and 4,284,412 describe a WBC subpopulation classification method by light scattering analysis on a flow cytometer. U.S. Pat. No. 4,520,110 describes a heterogeneous leukocyte grouping method by immunophenotyping that uses a combination of light scattering and fluorescence. Both the above specifications describe human sample preparation and methods that require incubation that is too long to be incorporated into today's high speed multi-parameter hematology analyzers. Furthermore, these references do not explicitly teach how to distinguish damaged cells from intact cells.
US Pat. No. 4,751,188 by Valet describes a method based on the principle that cellular components can be stained with a dye, which can be measured simultaneously with, for example, a cell volume on a flow cytometer. . According to this patent, undamaged blood cells can be counted within a few minutes. In this method, a blood sample is diluted 1: 250 with buffered isotonic saline; a pre-concentrated fluorescent RNA / DNA staining reagent, fluorescent membrane potential sensitive staining reagent, fluorescent 5 μl of a stock solution consisting of an organic solvent in which the soluble monodisperse calibration particles and the staining reagent are dissolved; and prepared by man with a procedure consisting of incubating the mixture at room temperature for 3 to 5 minutes. The dyes are stored as stock solutions in organic solvents such as DMSO and DMF, and only a very small amount of these stock dye solutions are added directly to the cell suspension to stain the cells. The prepared cell suspension is aspirated through the flow cell of the flow cytometer for measurement. In this method, a DNA / RNA staining reagent is used. This DNA / RNA staining reagent is either acridine orange (AO), quinacrine (QA) or pyronin Y (PY), and the membrane sensitive staining reagent is 3,3-dihexyl-oxacarbocyanine (DiOC6). Furthermore, at least one staining reagent selected from the group of cellular protein staining reagent; lipid staining reagent; enzyme staining reagent; intracellular pH staining reagent and SH group staining reagent is used. As described in this invention, Valet's methodology cannot be fully automated because it requires the steps of 1) adding a dye dissolved in an organic solvent by a very small amount of human hands. 2) Blood The total time required to complete a cell count takes a relatively long time, and 3) at least two dyes are required to characterize blood cells, which is Creates a ching problem 4) The blood sample needs to be diluted 250-fold, so it will not provide enough WBC to obtain statistically satisfactory results unless the counting time is increased 5) monocytes The lack of explicit separation of eosinophils and basophils suggests that Valet teaches only incomplete WBC classification results (only two WBC subpopulations). Granulocytes and Lymphocytes are shown in the figures and examples).
US Pat. No. 5,057,413 by Terstappen discloses a method using a flow cytometer to distinguish intact and damaged cells. In this method, both intact and damaged cells in the sample are stained. Terstappen's teachings are based on the principle that there is a sufficient difference in the fluorescence intensity between stained intact and damaged cells. A further stated objective of the present disclosure is the use of a classification method by techniques in combination with monoclonal antibodies fluorescently labeled with FITC or PE to simultaneously identify cellular antigens, intact cells and damaged cells. Here, the peak emission spectrum of each fluorescent label must be different from each other and from the nucleic acid dye. In this method, RBCs are dissolved with ammonium chloride for 3 to 5 minutes and centrifuged at 200 g for 5 minutes. The sediment is washed twice with RPMI 1640 medium and centrifuged at 200 g for 5 minutes each time. The cells are then resuspended in phosphate buffered saline (PBS) containing 1% bovine serum albumin (BSA). When adding monoclonal antibody to the sample, incubate for 20 minutes on ice, wash the cells twice with PBS solution, and resuspend in 1 ml PBS containing 1% paraformaldehyde. A stock solution of LDS-751 is made in methanol and a working solution is prepared by diluting the stock solution in PBS. Add 10 μl of this working solution to the prepared cell suspension. In other experiments, after dissolving RBCs with ammonium chloride, unfixed WBCs were resuspended in RPMI solution and allowed to stand for 1 hour prior to analysis to obtain optimal light scattering properties of the cells.
Terstappen's method has several problems in that variables such as temperature, fixative concentration and fixation time change the permeability of the cell membrane during the fixation process, and as a result, the staining intensity can be changed. All cells in the same group have the same DNA content (except for growing polyploid tumor cells or lymphoma cells), so strongly fixed initially intact cells are strongly fixed damaged cells Have the same staining intensity. Furthermore, if DNA fragmentation occurs at a later stage of cell death, damaged cells contain less DNA and the staining intensity decreases. Terstappen's method is also time consuming and cumbersome and difficult to implement unless it can be incorporated into today's fully automated hematology instruments. The results reported in this patent also show that the majority of damaged cells are generated during the required long and biting sample preparation process.
Recently, Inami et al., US Pat. No. 5,298,426, published March 29, 1994, for detection of NRBC. The present invention teaches a two-step method consisting of staining of WBC and NRBC with specific nuclear staining reagents. In the method of the present invention, a blood sample is first mixed with an acidic hypotonic solution containing a fluorescent nuclear dye. The solution containing alkaline salt buffer is then mixed with the sample / initial reagent solution to adjust pH and osmotic pressure. This final solution is loaded into a flow cytometer and NRBC is detected and counted along with other nucleated cells.
There are several reasons why the Inami et al. Approach is particularly unacceptable in an automatable way. First, the acidic-hypertonic solution damages all cell membranes and makes WBC leaky, which makes selective staining of NRBC nuclei with nuclear staining reagents impossible. Due to the common nuclear material (DNA), no dye is known that stains only NRBC nuclei without staining WBC nuclei. The nuclear dye claimed by Inami et al. Is a commonly used nucleic acid staining reagent, propidium iodide.
In addition, the method of Inami et al. Used other signals, such as RNA from Howell-Jolly bodies, basophilic spots, lysed reticulocytes and reticulated platelets, and DNA from WBC and megakaryocyte fragments. It cannot be separated or distinguished from the fluorescence signal of nuclear residues. Third, the Inami et al. Method requires offline pre-treatment to “prepare” the sample with several reagents before loading the prepared sample / reagent solution into the instrument. . The above problems in the current technology have been solved in the present invention.
Accordingly, it is an object of the present invention to provide an accurate method for identifying damaged WBC from intact WBC in whole blood samples and for rapid quantification of WBC classification (WBC / Diff), NRBC, damaged WBC.
Another object of the present invention is to provide a fully automatable method for distinguishing damaged WBC from intact WBC in whole blood samples and quantifying WBC / Diff, NRBC and damaged WBC at high speed.
Yet another object of the present invention is a fully automated method for identifying damaged WBC from intact WBC in whole blood samples, quantifying WBC / Diff, NRBC and damaged WBC at high speed, and classifying immunophenotypes. Is to provide.
Summary of invention
Providing an analysis method using a flow cytometer that simultaneously quantifies nucleated red blood cells (NBRC), white blood cells (WBC), damaged or non-viable WBC and white blood subpopulation (WBC / Diff) in whole blood samples . This method exposes NRBC nuclei and non-viable cell nuclei to nucleic acid stains that do not penetrate intact cell membranes (biological stains) and minimize or eliminate permeation of vital stains into WBCs. To destroy RBC and NRBC cytoplasm from aliquots of whole blood samples, subject the stained aliquots to light measurements using flow cytometry, and scattered light of the first and second ranges of scattering angles as parameters and Obtaining at least one signal comprising fluorescence (FL), the assayed signal is greater than the second scattered light signal threshold, and simultaneously the first scattered signal threshold or FL threshold {[(first scattering angle signal or Signal obtained by combinational logic that must be greater than either of (FL signal) and second scattering angle signal]} From the detection of the detected signal, the construction of a three-dimensional plot of the intensity signal of the fluorescence and scattered light assayed from the detected signal, the distinction between NRBC and WBC or damaged WBC from the constructed three-dimensional plot, and the measurement of the respective cell number Become.
In another embodiment of the invention, an apparatus is provided for simultaneous and quantitative analysis of NRBC, WBC, WBC / Diff and non-viable cells in a whole blood sample. The instrument is a flow cytometer to obtain at least one signal including the scattered light and fluorescence (FL or Fl) in the first and second ranges of scattering angles as parameters, and the assayed signal is less than the second scattered light signal threshold Must be larger and at the same time greater than either the first scatter signal threshold or the FL threshold {[(first scatter angle signal or (OR) FL signal) and (AND) second scatter angle signal]} It consists of a triple trigger circuit that calibrates the signal obtained by the flow cytometer for digitization with AND / OR AND / OR logic.
Another embodiment of the invention provides a method for simultaneously and quantitatively analyzing NRBC, WBC and WBC / Diff in a whole blood sample. The method removes erythrocytes (“RBC”) from an aliquot of a blood sample, removes the NRBC cytoplasm to expose the NRBC nucleus, and minimizes viable WBC staining, with minimal viable WBC staining. And staining of non-viable WBC, subjecting aliquots to photometry using flow cytometry, scattering light attenuation (ALL) from about 0 ° to about 1 ° as parameters, scattering from about 3 ° to 10 ° Obtain at least one signal including light (IAS) and fluorescence (F1), logic [[ALL (ALL) signal) or (OR) (F1 signal) and (AND) (3 ° -10 ° scattered signal) ] Of signal obtained by using AND-OR logic, and construction of three-dimensional plots by fluorescence and scattered light intensity signals assayed from detected signals, constructed three-dimensional plots and respective cells It consists of distinguishing non-viable cells from viable cells by measuring the number, distinguishing NRBC, WBC and WBC / Diff.
In other embodiments of the present invention, a flow cytoly device is provided for quantitative analysis of non-viable cells, NRBC, WBC and WBC / Diff in whole blood samples. The instrument has as parameters a flow cytometer to obtain at least one signal, including scattered light and fluorescence (F1) of about 0 ° to about 1 ° and about 3 ° to 10 °, and a signal to perform the following processing. Is obtained from the flow cytometer by AND-OR logic consisting of [(0 ° to about 1 ° scatter signal) or (OR) (F1 signal) and (AND) (3 ° to 10 ° scatter signal)]. It consists of a triple trigger circuit that tests whether the signal is suitable for digitization.
These and other features and advantages of the present invention will be demonstrated in the following description of preferred embodiments thereof.
[Brief description of the drawings]
FIG. 1 is a schematic diagram of the optical system of a clinical flow cytometer employed in carrying out the method of the present invention.
FIG. 2 is a schematic diagram depicting a “confirm” triple trigger circuit.
3A, 3B and 3C are distribution diagrams of WBC, NRBC, erythrocyte stroma and other background noise of whole blood samples processed as described in Example 1 using standard or standard detection triggers.
4A, 4B and 4C show WBC, NRBC, erythrocyte stroma and WBC of whole blood samples processed as described in Example 1, using only a 0 to about 1 degree scattering axial light loss (ALL) trigger. It is a distribution map of other background noise.
FIGS. 5A, 5B and 5C show WBC, NRBC, erythrocyte stroma and other samples of whole blood samples processed as described in Example 1, using only 3 ° to about 10 ° intermediate angle scatter (IAS) triggers. It is a distribution map of background noise.
6A, 6B and 6C are distributions of WBC, NRBC, erythrocyte stroma and other background noise of whole blood samples processed as described in Example 1, using only a fluorescent (FL3) trigger.
FIGS. 7A, 7B and 7C show WBC of a whole blood sample processed as described in Example 1, using a trigger level of FL3 higher than the trigger level used in FIG. It is NRBC, erythrocyte stroma, and other background noise distribution maps.
FIG. 8 is a WBC, NRBC and other background noise distribution diagram of a whole blood sample processed as described in Example 1, using two electronically “ORed” ALL and FL3 triggers. is there.
FIGS. 9A, 9B and 9C show Example 1 with two triggers, ALL and FL3, both electronically “ORed” with the FL3 trigger level set higher than the value in FIG. FIG. 6 is a distribution diagram of WBC and NRBC in whole blood samples processed as described.
FIGS. 10A, 10B and 10C are WBC and NRBC distribution maps in whole blood samples processed as described in Example 1 using triggers for ALL, IAS and FL3.
FIGS. 11A through 11C show dot plot displays of normal blood samples processed as described in Example 1 using normal or standard detection triggers.
FIGS. 12A and 12B show abnormal blood cytograms containing NRBC processed as described in Example 2, using standard or normal detection triggers.
FIGS. 13A and 13B show abnormal blood cytograms containing NRBC processed as described in Example 3, using standard detection triggers.
FIGS. 14A-14C depict the distribution of a whole blood sample containing 56 NRBCs per 100 WBCs utilizing the triple trigger (ALL, FL3 and IAS) detection method of the present invention.
FIGS. 15A and 15B similarly depict the distribution of other whole blood samples containing 140 NRBCs per 100 WBCs using the triple trigger (ALL, FL3 and IAS) detection method of the present invention.
FIGS. 16A and 16B show the results of linearity samples prepared and processed as described in Example 6 using the method of the present invention.
FIG. 17 is a correlation plot between NRBC measurement (ordinate) with an automated hematology analyzer using the method of the present invention and NRBC measurement (abscissa) with a microscope by a human. The data was processed as described in Example 7.
18A to 18F show cytograms of normal blood samples as described in Example 8.
FIGS. 19A to 19F show abnormal blood cytograms containing NRBC as described in Example 9 (4.99 k / μl or 46.6 NRBC per 100 WBC).
20A to 20F show cytograms of samples containing damaged lymphocytes as described in Example 10.
21A to 21F show normal blood cytograms aged 35 hours in the cooling state described in Example 11. FIG.
FIGS. 22A through 22F show cytograms of samples processed by mixing strongly fixed human WBC and platelets described in Example 12 with human RBC fraction, resuspended in human plasma.
FIGS. 23A through 23F are commercially available flow cytometer displays of blood samples processed as described in Example 13. FIG.
24A-24F are commercially available flow cytometer displays of blood samples processed as described in Example 14. FIG.
Detailed Description of the Invention
In general, the present invention relates to an automated method for simultaneously analyzing WBC classification (Diff), NRBC and cell viability in whole blood samples.
One aspect of the present invention is that the assay utilizes a lysis reagent / dye system, which minimizes damage to the WBC cell membrane, preferably the WBC surface antigen, while minimizing damage to the RBC and NRBC. The exposed NRBC nuclei and any damaged WBC nuclei are stained with a nucleic acid dye that lyses the cytoplasm and does not penetrate the membrane of intact cells (biological staining reagent). Intact WBC nuclei are not stained by exclusion.
The disclosed method also allows accurate WBC / Diff analysis in blood samples containing NRBC by subtracting the signal identified as NRBC from the total WBC signal before performing WBC / Diff analysis. Only one type of dye is required for staining NRBC and damaged WBC. This enables WBC / Diff analysis based on the difference in light scattering characteristics of the WBC subclass. WBC subclasses identified as being damaged by the FL3 + signal are added back to the subclass to which they belong, which gives accurate WBC / Diff results in samples containing damaged WBCs.
In the disclosed system, vital stain reagents are analyzed at approximately 10-20 mM buffer, non-quaternary ammonium salts, surfactants and very low concentrations for simultaneous analysis of WBC / Diff, NRBC and damaged WBC in one step. In combination with a multipurpose reagent system having a pH of about 6.0 to 7.5 and an osmolarity of about 230 to 310 mOsm / L.
The biological nucleic acid staining reagent that can be used in the present invention does not penetrate the membrane of intact cells, and has a relatively high absorbance and low fluorescence intensity when they are not bound to nucleic acids. Spectral characteristics [absorption (EX) maximum value (nm) / radiation (EM) maximum value (nm)] of biological dyes are compatible with the laser light source used in this system, and their emission spectrum is used in immunophenotyping classification Do not overlap with the emission spectrum of fluorochrome bound to Mab.
The following properties are desired for biological dyes to the disclosed system:
High extinction rate;
High quantum generation;
High binding affinity for nucleic acids;
Low fluorescence when not bound to nucleic acid; and
Spectral characteristics must be compatible with the light source used in the detection system. For example, for an argon laser light source, the EX maximum value is around 488 nm and the EM maximum value is around 630 nm.
This does not limit biological dyes having an EX maximum range of around 488 for use in the disclosed method. It is well known in the art that these dyes can be excited at different EX maxima by a suitable light source such as HeNe, xenon or mercury lamp.
There are many nuclear dyes suitable for use with a suitable light source in the disclosed system. Commercially available dyes that can be used in the disclosed systems include 7-aminoactinomycin D, YOYO-1, YOYO-3, TOTO-1, TOTO-3, BO-PRO-1, YO-PRO- 1, TO-PRO-1, and many others.
Among the preferred embodiments of the present invention, suitable commercially available dyes that can be used with an argon laser are propidium iodide (PI), ethidium bromide (Ebr), ethidium homodimer-1 (EthD-1), ethidium homodimer— 2 (EthD-2), diethylenetriamine (DTA).
In a preferred embodiment of the present invention, the biodye is PI and the multipurpose reagent system comprises about 5.0 g / L ammonium chloride, about 2 g / L potassium bicarbonate, about 100 mgs / L to about 150 mgs / L saponin and formaldehyde It has a pH of about 6.5 to 7.0 containing about 0.07%, an osmolarity of about 260, about 15 mM acetate buffer, and a triple threshold signal routine that qualifies the signal for digitization using AND / OR logic. Such reagents are disclosed and described in PCT Application No. 94/18828 “Multipurpose Reagent System for Rapid Lysis of Whole Blood Samples”, incorporated herein by reference. However, any lysis reagent can be used as long as the reagent does not damage the WBC cell membrane and the viable WBC nuclei begin to be stained (before lysis).
The reagent / dye / sample mixture is essentially passed one cell at a time through the irradiated optical flow cell. This causes the cells to scatter the irradiated light and any stained nuclei will fluoresce. Scattered light and fluorescence signals are detected using a triple trigger method coupled with known methods and processing of the detected signal, which allows identification and quantification of WBC, WBC / Diff, damaged WBC and NRBC. In US patent application Ser. No. 08 / 283,379 “Method and Instrument for Performing Automatic Analysis” filed on July 7, 1995 and incorporated herein by reference, it is particularly compatible with the triple trigger method of the present invention. Known hematology analyzers are disclosed and described. The following description is limited to this hematology analyzer. This description is for convenience only and the invention is by no means limited to a single instrument.
A portion of the whole blood sample, approximately 25 μl, is placed by the sample inhalation probe into a WBC cup containing approximately 850 μl of isotonic lysis reagent. The lysis reagent lyses the erythrocyte fraction of the blood sample and lyses the NRBC cytoplasm so that any NRBC nuclei present are exposed. At the same time that the erythrocyte fraction of blood is lysed, the reagent must be sufficiently gentle to protect or not damage the WBC fraction. No matter what lysing agent formulation is used in the triple trigger method, the reagent may further contain a low concentration of vital dye that effectively labels any NRBC present in the peripheral blood, or Combine. Preferably, for use with the previously referenced analyzer, the chemistry of the solubilizer is adapted so that the refractive index matches the sheath solution with a difference of substantially less than 0.1%.
The lysis reagent and sample mix typically stays in the previously referenced WBC cup for only 11 seconds. Therefore, it is dissolved and mixed at 42 ± 3 ° C. At this point, the contents of the WBC cup move directly through the tube to the
When cells pass through the
In this respect, and as shown in FIG. 1, the presence of cells is a
Preferably, one or more detectors are used to measure forward intermediate angle scattering (IAS) and small angle forward diffusion (SAS) or axial light loss (ALL; also known as forward attenuation). Install in the front light path. ALL is generally an attenuation of light energy as cells pass in front of a laser beam and is detected by a photodiode. Light loss is generally due to scattering and is detected as an attenuation of light energy that reaches a detector placed in the path of the laser beam due to the passage of cells through the beam (generally ALL is about 0 ° to about Detected at 1 ° angle). In contrast, small-angle forward diffusion (SAS) is light energy that reaches the detector outside the incident laser beam (but within a narrow angle of about 1 ° to 3 °), which passes through the beam. By scattering from living cells. Normally, stopping the light beam can prevent the laser beam from reaching the detector. The ALL detection system collects light in the laser-irradiated entrance weight, while the small-angle forward diffusion system collects light outside this weight. In the ALL measurement system, the signal of interest is a negative signal removed from the steady state laser signal, while the small-angle forward diffusion measurement is a slight positive signal added to a very low background light level. Forward intermediate angle scattering (IAS) is similar to small angle forward diffusion, except that light is scattered from the incident laser beam at a larger angle. More essentially, IAS relates to laser light incidence or light scattering in a ring about 3 ° to 10 ° away from the centerline. In a preferred embodiment, ALL is collected at an angle of about 0.3 ° or less horizontally from the laser axis and vertically of 1.2 ° or less, and IAS is collected at an angle between about 3 ° and 10 ° from the laser axis.
Pulses are generated in
The algorithm is applied to the ALL, IAS, FL3, PSS, and DSS five-dimensional feature interval list mode data, and the following types of cells are counted and / or flagged within 30 seconds of processing time.
As described below, ALL and IAS signals are detected and collected for WBC / Diff analysis, and FL3 signals from stained NRBC nuclei are collected for NRBC analysis. The triple trigger circuit shown in FIG. 2 is calibrated to digitize these signals using AND / OR logic. In order to be tested, the signal must be greater than the IAS trigger and at the same time greater than either the ALL trigger or the FL3 trigger.
Several components and signals generated or utilized identified in FIG. 2 correspond to the following labels:
300-ALL voltage comparator
302-ALL signal
304-ALL threshold voltage (Vth1)
306-ALL voltage comparator output
310-FL3 signal
312−FL3 threshold voltage (Vth2)
314-FL3 voltage comparator
316-FL3 voltage comparator output
318-IAS signal
320−IAS threshold voltage (Vth3)
322-IAS voltage comparator
324-IAS voltage comparator output
326-OR gate
328-OR gate output
330-AND gate
332-Valid trigger output
The real-time signal from each channel is at the input of the voltage comparator.
The threshold voltage is an independent voltage determined by system parameters.
The outputs of
The output of the
The
ALL and IAS are collected for WBC / Diff analysis and fluorescence (FL3) signals are collected for NRBC and damaged WBC analysis. A triple threshold circuit or test routine uses AND / OR logic to test the signal for digitization. To be tested by this unique routine or circuit, the signal must be greater than the IAS threshold and at the same time greater than either the ALL threshold or the FL3 threshold. Using this trigger circuit, NRBC forms a unique cluster during the aforementioned three-dimensional interval (see Figure 14 and Figure 15), which is easily counted in the optical WBC classification analysis, clearly from the WBC number. Excluded. For example, the number of NRBC per 100 WBC and the total number of NRBC per μl of patient blood are reported. As a result, NRBC is removed from the total WBC count, and accurate WBC count and classification analysis is possible even if NRBC is present in the blood sample. Signals located on both the ALL and FL3 triggers are identified as damaged WBCs. Damaged WBC subpopulations are identified in a manner similar to the intact WBC classification analysis. Fluorescent and non-fluorescent background noise from DNA fragments, RBC stroma, platelets, Howell-Jolly bodies, basophilic spots, lysed RBC RNA, WBC and megakaryocyte fragment DNA, etc. is substantially Excluded. Stained NRBC nuclei are separated from various background noise signals via the disclosed triple triggering (by ALL, IAS and FL3) and from NRBC nuclei above the FL3 threshold for ALL vs. FL3 dot plots Only the FL3 + signal is counted as NRBC.
The cell population areas identified by the numbers listed below in FIGS. 3 to 10 correspond to the following cell types:
202 =
204 =
206 =
Another technical advantage of the disclosed system is that the NRBC cytoplasm is completely lysed, making their nuclei more susceptible to the staining reagent and lower to effectively and accurately stain NRBC. Concentration of staining reagent is required. Under this condition, a high signal-to-noise (S / N) ratio exceeding 100 can be obtained in NRBC detection. In this system, the concentration of vital dyes required for rapid analysis of WBC / Diff / NRBC / damaged WBC is only 1 to 2 μg / ml, which is at least 50 times lower than the concentration required in the current technology. It is.
The disclosed method is unique in that it allows automatic, accurate and rapid simultaneous WBC / Diff / NRBC / damaged WBC analysis without interference from other cell disruptions. A further advantage of the present invention is that it has very high medical value in that the method can be incorporated into clinical hematology analyzers calibrated to routines for WBC, RBC and platelet counting. . This system can obtain accurate WBC / Diff / NRBC / damaged WBC data (% and absolute numbers) in clinical blood samples. This has not been possible until now.
Example 1
EDTA-anticoagulated fresh normal blood was filed on July 7, 1995, previously described, US patent application Ser. No. 08 / 283,379, “Automated Analysis,” incorporated herein by reference. Tested in the automated clinical hematology analyzer test unit disclosed and described in “Methods and Instruments for Implementation”. Although the present invention is incorporated into the analyzer described above, it is not always utilized in all of the following examples. An isotonic multipurpose reagent disclosed in PCT Application No. 94/18828 “Multipurpose Reagent System for Fast Lysis of Whole Blood Samples”, 25 μl of blood sample, which is incorporated herein by reference. It was mixed online with 675 μl (pH 6.5, 260 mOsm / L).
For these experiments, the multipurpose reagent system is about 95 mM ammonium chloride (5 g / l), about 0.075% formaldehyde by volume, about 10 mM to about 20 mM acetate buffer, about 10 mM potassium bicarbonate, and weight / volume. At about 0.01% (eg, g per 100 ml). The pH of the reagent system was adjusted to a range of about 6.2 to about 7.0, and the osmolarity of the reagent system was about 215 to about 270 mOsm / L.
The reagent was pre-warmed to 42 ± 3 ° in the heated mixing chamber of the instrument, where the sample and reagent were mixed and incubated for 11 seconds. This blend was transferred to the flow cell (takes 8.5 seconds) for WBC / Diff / NRBC analysis. The visual configuration of the system is displayed in FIG. This analysis was performed without using a triple trigger circuit and using a double trigger of only ALL and FL3, which is common in the industry. See all figures from Figures 3A to 10C.
The upper dot plot in FIG. 11A depicts the light scattering signal (ALL vs. IAS) obtained from the sample, showing three different WBC groups. Since normal blood does not contain many basophils, no basophil clusters are observed here. Since eosinophils are separated by a DSS vs. PSS dot plot (not shown), the cluster of eosinophils is not shown here, and the cytogram in the middle of Figure 11B is shown as ALL and A dot plot of the FL3 signal is shown. Normal blood does not contain NRBC. The lower FL3 + cluster in FIGS. 11B and 11C is clearly a cell disruption containing the RNA or DNA described above.
Example 2
Cytograms 12A and 12B at the top and bottom, respectively, are dot plot displays of abnormal blood containing NRBC (NRBC47 per WBC100) analyzed as described in Example 1 using standard detection methods. In the upper cytogram, the cluster at the lower right of the lymphocyte population belongs to NRBC, and the small cluster at the base of the left corner is the origin containing RBC stroma (reticulocytes, Howell Jolly bodies, etc.), platelets and WBC disruptions Belongs to noise. Figure 12B shows that the origin noise cluster in this sample is brightly stained with nuclear dye and continues very close to the NRBC cluster stained in the FL3 channel, so set the FL3 trigger to accurately count NRBC. Indicates that it is impossible.
Example 3
The cytograms of FIGS. 13A and 13B are dot plot displays of abnormal blood containing NRBC (NRBC51 per WBC100) analyzed as described in Example 1 using standard detection methods. In the top display, FIG. 13A, the lower right cluster of the lymphocyte population belongs to NRBC. It can be seen that the FL3 + origin noise of this sample has increased. The noise cluster is located very close to the NRBC cluster in the FL3 channel. For this reason, the FL3 noise interferes with the position of the FL3 trigger. If the FL3 trigger is set high enough to remove all origin noise, at the same time, part of the NRBC group is lost under the FL3 trigger as shown in FIG. 13B.
Example 4
The disclosed triple trigger circuit (ALL / IAS / FL3) of the present invention of FIG. 2 was incorporated into the same instrument used in Examples 1-3 and utilized throughout the procedure.
EDTA anticoagulated clinical samples containing 56 NRBC per 100 WBC were analyzed as described in Example 1. The results are shown in FIGS. 14A to 14C. The FL3 + noise cluster has disappeared. The noise signal is blocked by the applied IAS trigger. Although the trigger is set low enough to collect all NRBC groups, this abnormal blood origin noise from the blood is no longer visible on the FL3 trigger. (Note the annular shape of NRBC.)
Example 5
FIGS. 15A and 15B show dot plots of the NRBC distribution of another clinical whole blood sample containing 140 NRBCs per 100 WBCs after similarly performing a triple trigger (ALL, FL3 and IAS). No origin noise was observed and the total NRBC group was collected on the FL3 trigger. Since the concentration of NRBC in this sample is very high, the density of NRBC clusters is high.
Example 6
Linear samples were prepared by adding various concentrations of unfixed chicken erythrocytes to EDTA anticoagulated normal human blood. Samples were analyzed as described in Example 1 utilizing the three-dimensional detection method of the present invention. The cytoplasm of chicken erythrocytes is lysed by the method of the present invention, leaving only the naked nucleus (CEN). CEN is quickly stained with bionuclear dye (PI) in diluent and becomes fluorescent (FL3). FL3 + CEN is counted as NRBC in the method of the present invention and is reported as the number of NRBC per 100 WBC and the real number per μl of whole blood sample. Results are displayed in FIGS. 16A and 16B. The linearity plot of the number of NRBCs per
Example 7
FIG. 17 shows a correlation plot of the NRBC number (ordinate) of 85 clinical samples obtained by the method of the present invention. The results correlated with the number of microscopic measurements (abscissa) by the referenced human. For human NRBC measurement, 200 WBC classifications were performed in the blood smears of each patient stained with Light Giemsa, and the number of NRBCs present in the same range was divided by two to report the number of NRBCs per 100 WBCs. The correlation coefficient (R) was 0.973 (R2 = 0.946), the slope was 0.86, and the Y intercept was 1.32.
Example 8
In the heated vortex mixer of the hematology analyzer disclosed and described in US patent application Ser. No. 08 / 283,379, filed Jul. 7, 1995, “Method and Instrument for Performing Automatic Analysis” Then, 25 μl of a blood sample was added, mixed with 675 μl of the multipurpose reagent of Example 1 (pH 7.0, 260 mOsm / L), and incubated online at 42 ° C. for 11 seconds. The admixture was then automatically transferred to the flow cell for analysis (WBC classification, approximately 8.5 seconds for NRBC analysis). 18A to 18F are blood cytograms. The top left light scatter signal (ALL vs. IAS) cytogram, FIG. 18A, shows three different groups of WBCs (neutrophils, monocytes and lymphocytes). Since normal blood contains only about 1% or less of neutrophils, no neutrophil clusters are observed here. Eosinophils are separated in the top right DSS vs. PSS cytogram, FIG. 18B. The middle left cytogram, FIG. Normal blood does not contain NRBC and there are few damaged cells to the right of the vertical line (FL3 + signal) in FIG. 18C.
Example 9
Abnormal blood containing NRBC (4.99 k / μl or 46.6 NRBC per 100 WBC) was analyzed as described in Example 8 and the results are shown in FIGS. 19A to 19F. The cluster located in the lower right of the lymphocyte group in the top left cytogram (ALL vs. IAS) belongs to NRBC. Bottom right cytogram (ALL vs. FL3 +), FIG. 19F shows that naked NRBC nuclei are clearly stained and pulled up and counted over the FL3 + trigger. The NRBC number is removed from the total WBC number in this way before the WBC classification analysis, and an accurate WBC classification result is obtained.
Example 10
A clinical sample (CLL) containing damaged lymphocytes was analyzed as described in Example 8, and the results are shown in FIGS. 20A-20F. The top cytogram (ALL vs. IAS), the cluster located in the immediate lower right of the lymphocyte population in FIG. 20A belongs to the damaged lymphocyte. FIG. 20C (ALL vs. FL3 +) shows that almost 1/2 of the lymphocyte population was stained with nucleic acid dye (PI). A microscopic smear examination of the sample showed that about 50% of the lymphocyte population was dirty cells or cells that had lost their cell membrane (naked nucleus lymphocytes). Damaged lymphocytes are identified from NRBC along the ALL axis because their light scatter signal is higher than that of naked NRBC nuclei.
Example 11
Normal blood samples that were stored for 35 hours under refrigerated conditions and aged were analyzed as described in Example 8, and the results are shown in FIGS. 21A to 21F. Samples were processed as described in Example 8. The FL3 + signal shown to the right of granulocytes and lymphocytes in ALL vs. FL3 cytogram, FIG. 19F, indicates damaged granulocytes and lymphocytes, respectively.
Example 12
Processed samples were made by mixing strongly fixed human WBC and platelets with the human erythrocyte fraction and resuspending in human plasma. This blend was analyzed as in Example 8, and the results are shown in FIGS. 22A to 22F. Unlike the WBC protected by the multipurpose reagent system disclosed herein, the ALL vs. FL3 cytogram of strongly fixed cells, FIG. 22C, shows that all WBCs are very intensely stained. The cross-linking reagent makes the cell membrane very porous and allows the nucleic acid dye to penetrate the cells. The WBC sub-population is a multidimensional light scattering analysis described in US patent application Ser. No. 08 / 283,379, filed Jul. 7, 1995, “Methods and Instruments for Performing Automated Analysis”. Identified by
Example 13
50 μl of each of the two normal blood samples were mixed with 10 μl of Mab solution containing anti-CD3-FITC and anti-CD4-PE in separate test tubes.
Again, 50 μl aliquots of normal blood samples were mixed with 10 μl Mab solution containing anti-CD3-FITC and anti-CD8-PE in two new separate tubes. Negative controls were prepared without adding Mab solution to the test tubes. The mixed solution was kept at room temperature for 15 minutes, and 1.7 ml of the multipurpose reagent of Example 1 not containing the nucleic acid dye previously heated to 42 ° C. was added to each tube. Scan scan sample▲ R ▼Send signal to instrument (Becton, Dickinson) and start signal capture exactly 11 seconds after adding multipurpose reagent. The results are shown in FIGS. 23A to 23F and Table 1. The top cytogram, FIGS. 23A and B, show a negative control of normal blood, the left cytogram, FIG. 23A shows forward scatter (FCS) vs. 90 ° side scatter showing that lymphocytes are gated. Shown, right cytogram, Figure 23B shows a 2D display of FL1 vs. FL2, middle cytogram, Figures 23C and D are the same sample reacted with anti-CD4 Mab, bottom cytogram, Figures 23E and F Indicates the same blood reacted with anti-CD8 Mab.
Example 14
50 μl of two normal blood samples were mixed in a test tube with 10 μl of Mab solution containing anti-CD3-FITC and anti-CD4-PE. In a separate test tube, 50 μl of normal blood sample was mixed with 10 μl of Mab solution containing anti-CD3-FITC and anti-CD8-PE. Negative controls were prepared without adding Mab. The mixture was incubated at room temperature for 15 minutes, and 1.7 ml of the multipurpose reagent described above containing PI (0.2 μg / ml) pre-warmed to 42 ° was added. Scan scan sample▲ R ▼Send signal to instrument (Becton, Dickinson) and start signal capture exactly 11 seconds after adding multipurpose reagent. The results are shown in FIGS. 24A to 24F and Table 1. The top cytogram, FIGS. 24A and B, show a negative control of normal blood, the left cytogram, FIG. 24A shows forward scatter (FCS) vs. 90 ° side scatter showing that lymphocytes are gated. Shown, right cytogram, Figure 24B shows a two-dimensional display of FL1 vs. FL2, middle cytogram, Figures 24C and D are the same sample reacted with anti-CD4 Mab, bottom cytogram, Figures 24E and F Indicates the same blood reacted with anti-CD8 Mab.
Claims (2)
(b)白血球(WBC)細胞膜への傷害を最小限に抑えながらも赤血球(RBC)を溶解するRBC溶解成分と、有核赤血球(NRBC)および損傷WBCの細胞核を染色する生体核染料成分を含む試薬系をさらに血液サンプルのアリコートと混和する、
(c)混和したアリコートを、実質的に一時に一細胞ずつ、光学的に励起されている領域を通過させる、
(d)パラメーターとして蛍光(FL)並びに第一および第二レンジ散乱角度の両方における散乱光のそれぞれについて少なくとも一つのシグナルを得る、
(e)検定されるシグナルは第二散乱シグナル閾値よりも大きく、同時に該シグナルは第一散乱シグナル閾値あるいはFL閾値のいずれかよりも大きくなければならず、ここで閾値は得られたシグナル中の見かけのFLノイズシグナルを除き、NRBC群シグナルは含むように設定されているロジックにシグナルを適合させることにより、得られたシグナルを検定する、
(f)得られ、検定されたシグナルからのFLおよび散乱光から強度シグナルの三次元プロットを構築する、及び
(g)構築した三次元プロットおよび検定されたシグナルから得られるWBCサブクラスの分類(WBC/Diff)により、WBC、NRBC及び損傷WBCを分類し、および各クラスおよびサブクラスの細胞数を測定し、該WBC/Diffを分類する前に、測定されたWBC数から測定されたNRBC数を差し引く、
ことを含むフローサイトメトリーによるサンプル中のNRBC,損傷WBCおよびWBCを分類する方法。(A) adding a fluorescently labeled antibody to an aliquot of a blood sample, incubating the sample with the antibody, and mixing for a time sufficient for the antibody to bind to a binding surface antigen.
(B) and RBC lysis component which dissolves the white blood cells (WBC) erythrocytes while minimizing damage to cell membranes (RBC), a biological Kakusome fuel components to stain nucleated red blood cells (NRBC) and damaged WBC cell nucleus Further mix the reagent system comprising with an aliquot of the blood sample;
(C) passing the mixed aliquot through the optically excited region, substantially one cell at a time;
(D) obtaining at least one signal for each of the fluorescence (FL) as parameters and the scattered light at both the first and second range scattering angles;
(E) The signal to be assayed is greater than the second scatter signal threshold, while the signal must be greater than either the first scatter signal threshold or the FL threshold, where the threshold is Except for the apparent FL noise signal, test the resulting signal by adapting the signal to the logic set to include the NRBC group signal;
(F) construct a three-dimensional plot of the intensity signal from the FL and scattered light from the obtained and calibrated signal, and (g) classification of the WBC subclass obtained from the constructed three-dimensional plot and the calibrated signal (WBC / Diff) classify WBC, NRBC and damaged WBC and measure the number of cells in each class and subclass and subtract the measured NRBC number from the measured WBC number before classifying the WBC / Diff ,
A method of classifying NRBC, damaged WBC and WBC in a sample by flow cytometry.
Applications Claiming Priority (3)
| Application Number | Priority Date | Filing Date | Title |
|---|---|---|---|
| US57442495A | 1995-12-15 | 1995-12-15 | |
| US08/574,424 | 1995-12-15 | ||
| PCT/US1996/020466 WO1997021994A1 (en) | 1995-12-15 | 1996-12-13 | Method for simultaneous analysis of cell viability, nucleated red blood cells and white blood cell differential |
Publications (3)
| Publication Number | Publication Date |
|---|---|
| JP2000501838A JP2000501838A (en) | 2000-02-15 |
| JP2000501838A5 JP2000501838A5 (en) | 2004-10-21 |
| JP4279900B2 true JP4279900B2 (en) | 2009-06-17 |
Family
ID=24296069
Family Applications (1)
| Application Number | Title | Priority Date | Filing Date |
|---|---|---|---|
| JP52228797A Expired - Lifetime JP4279900B2 (en) | 1995-12-15 | 1996-12-13 | Simultaneous analysis of cell viability, nucleated red blood cells, and white blood cell classification |
Country Status (7)
| Country | Link |
|---|---|
| EP (1) | EP0866960B1 (en) |
| JP (1) | JP4279900B2 (en) |
| AT (1) | ATE472725T1 (en) |
| CA (1) | CA2240158C (en) |
| DE (1) | DE69638209D1 (en) |
| ES (1) | ES2347110T3 (en) |
| WO (1) | WO1997021994A1 (en) |
Families Citing this family (10)
| Publication number | Priority date | Publication date | Assignee | Title |
|---|---|---|---|---|
| US5917584A (en) * | 1997-11-21 | 1999-06-29 | Coulter International Corp. | Method for differentiation of nucleated red blood cells |
| JP4564566B2 (en) | 2009-02-13 | 2010-10-20 | 三井造船株式会社 | Fluorescence detection apparatus and fluorescence detection method |
| JP4564567B2 (en) | 2009-02-13 | 2010-10-20 | 三井造船株式会社 | Fluorescence detection apparatus and fluorescence detection method |
| WO2010126838A1 (en) * | 2009-04-27 | 2010-11-04 | Abbott Laboratories | Method for discriminating red blood cells from white blood cells by using forward scattering from a laser in an automated hematology analyzer |
| EP2705134B1 (en) | 2011-05-04 | 2022-08-24 | Abbott Laboratories | White blood cell analysis system and method |
| CN103975054B (en) | 2011-05-04 | 2017-07-07 | 雅培制药有限公司 | Erythroblast analysis system and method |
| EP2705135B1 (en) | 2011-05-04 | 2019-10-30 | Abbott Laboratories | Basophil analysis method |
| WO2014099629A1 (en) * | 2012-12-21 | 2014-06-26 | The Regents Of The University Of California | Rapid blood testing platform for use with mobile electronic devices |
| CN105699635A (en) * | 2016-01-28 | 2016-06-22 | 深圳市帝迈生物技术有限公司 | Simple and reliable hemocyte five-class analysis method, system and device |
| WO2019206297A1 (en) * | 2018-04-28 | 2019-10-31 | 深圳迈瑞生物医疗电子股份有限公司 | Blood analyzer and analysis method |
Family Cites Families (5)
| Publication number | Priority date | Publication date | Assignee | Title |
|---|---|---|---|---|
| US5057413A (en) * | 1988-06-13 | 1991-10-15 | Becton, Dickinson And Company | Method for discriminating between intact and damaged cells in a sample |
| US5047321A (en) * | 1988-06-15 | 1991-09-10 | Becton Dickinson & Co. | Method for analysis of cellular components of a fluid |
| ES2151494T3 (en) | 1992-03-05 | 2001-01-01 | Becton Dickinson Co | METHOD FOR THE PREPARATION AND ANALYSIS OF LEUKOCYTES IN COMPLETE BLOOD THROUGH THE USE OF FLOW CYTOMETRY. |
| DE69434942T2 (en) * | 1993-02-25 | 2007-11-29 | Abbott Laboratories, Abbott Park | MULTIPURPOSE REAGENT SYSTEM FOR THE FAST LYSING OF FULL BLOOD SAMPLES |
| US5559037A (en) * | 1994-12-15 | 1996-09-24 | Abbott Laboratories | Method for rapid and simultaneous analysis of nucleated red blood cells |
-
1996
- 1996-12-13 CA CA002240158A patent/CA2240158C/en not_active Expired - Fee Related
- 1996-12-13 ES ES96945254T patent/ES2347110T3/en not_active Expired - Lifetime
- 1996-12-13 DE DE69638209T patent/DE69638209D1/en not_active Expired - Lifetime
- 1996-12-13 WO PCT/US1996/020466 patent/WO1997021994A1/en active Application Filing
- 1996-12-13 JP JP52228797A patent/JP4279900B2/en not_active Expired - Lifetime
- 1996-12-13 AT AT96945254T patent/ATE472725T1/en not_active IP Right Cessation
- 1996-12-13 EP EP96945254A patent/EP0866960B1/en not_active Expired - Lifetime
Also Published As
| Publication number | Publication date |
|---|---|
| EP0866960B1 (en) | 2010-06-30 |
| EP0866960A1 (en) | 1998-09-30 |
| ES2347110T3 (en) | 2010-10-25 |
| CA2240158C (en) | 2004-11-30 |
| CA2240158A1 (en) | 1997-06-19 |
| JP2000501838A (en) | 2000-02-15 |
| WO1997021994A1 (en) | 1997-06-19 |
| DE69638209D1 (en) | 2010-08-12 |
| ATE472725T1 (en) | 2010-07-15 |
Similar Documents
| Publication | Publication Date | Title |
|---|---|---|
| US5879900A (en) | Method for simultaneous analysis of cell viability, nucleated red blood cells and white blood cell differentials | |
| CA2207396C (en) | Method for rapid and simultaneous analysis of nucleated red blood cells | |
| CA1309328C (en) | Method of classifying leukocytes by flow cytometry and reagents used in the method | |
| US4727020A (en) | Method for analysis of subpopulations of blood cells | |
| EP1250585B1 (en) | Method and apparatus for analyzing cells in a whole blood sample | |
| US7625712B2 (en) | Method for a fully automated monoclonal antibody-based extended differential | |
| EP0022670B1 (en) | Method and apparatus for automated identification and enumeration of specified blood cell subclasses | |
| JP4433611B2 (en) | Identification method for nucleated red blood cells | |
| US5776709A (en) | Method for preparation and analysis of leukocytes in whole blood | |
| US5179026A (en) | Method of classifying leukocytes by flow cytometry and reagents used in the method | |
| US5840515A (en) | Erythrocyte lysis reagent, and its use in methods for isolating and differentiating leucocytes | |
| JP4279900B2 (en) | Simultaneous analysis of cell viability, nucleated red blood cells, and white blood cell classification | |
| WO1997021994A9 (en) | Method for simultaneous analysis of cell viability, nucleated red blood cells and white blood cell differential | |
| EP0559208A1 (en) | Method for preparation and analysis of leukocytes in whole blood utilizing flow cytometry | |
| Ronot et al. | Assessment of cell viability in mammalian cell lines |
Legal Events
| Date | Code | Title | Description |
|---|---|---|---|
| A131 | Notification of reasons for refusal |
Free format text: JAPANESE INTERMEDIATE CODE: A131 Effective date: 20060627 |
|
| A601 | Written request for extension of time |
Free format text: JAPANESE INTERMEDIATE CODE: A601 Effective date: 20060920 |
|
| A602 | Written permission of extension of time |
Free format text: JAPANESE INTERMEDIATE CODE: A602 Effective date: 20061106 |
|
| A521 | Request for written amendment filed |
Free format text: JAPANESE INTERMEDIATE CODE: A523 Effective date: 20061226 |
|
| A131 | Notification of reasons for refusal |
Free format text: JAPANESE INTERMEDIATE CODE: A132 Effective date: 20070605 |
|
| A601 | Written request for extension of time |
Free format text: JAPANESE INTERMEDIATE CODE: A601 Effective date: 20070829 |
|
| A602 | Written permission of extension of time |
Free format text: JAPANESE INTERMEDIATE CODE: A602 Effective date: 20071005 |
|
| A521 | Request for written amendment filed |
Free format text: JAPANESE INTERMEDIATE CODE: A523 Effective date: 20071205 |
|
| A131 | Notification of reasons for refusal |
Free format text: JAPANESE INTERMEDIATE CODE: A131 Effective date: 20080812 |
|
| RD02 | Notification of acceptance of power of attorney |
Free format text: JAPANESE INTERMEDIATE CODE: A7422 Effective date: 20080728 |
|
| RD13 | Notification of appointment of power of sub attorney |
Free format text: JAPANESE INTERMEDIATE CODE: A7433 Effective date: 20080728 |
|
| A521 | Request for written amendment filed |
Free format text: JAPANESE INTERMEDIATE CODE: A523 Effective date: 20080829 |
|
| TRDD | Decision of grant or rejection written | ||
| A01 | Written decision to grant a patent or to grant a registration (utility model) |
Free format text: JAPANESE INTERMEDIATE CODE: A01 Effective date: 20090224 |
|
| A01 | Written decision to grant a patent or to grant a registration (utility model) |
Free format text: JAPANESE INTERMEDIATE CODE: A01 |
|
| A61 | First payment of annual fees (during grant procedure) |
Free format text: JAPANESE INTERMEDIATE CODE: A61 Effective date: 20090313 |
|
| FPAY | Renewal fee payment (event date is renewal date of database) |
Free format text: PAYMENT UNTIL: 20120319 Year of fee payment: 3 |
|
| R150 | Certificate of patent or registration of utility model |
Free format text: JAPANESE INTERMEDIATE CODE: R150 |
|
| FPAY | Renewal fee payment (event date is renewal date of database) |
Free format text: PAYMENT UNTIL: 20130319 Year of fee payment: 4 |
|
| FPAY | Renewal fee payment (event date is renewal date of database) |
Free format text: PAYMENT UNTIL: 20140319 Year of fee payment: 5 |
|
| R250 | Receipt of annual fees |
Free format text: JAPANESE INTERMEDIATE CODE: R250 |
|
| R250 | Receipt of annual fees |
Free format text: JAPANESE INTERMEDIATE CODE: R250 |
|
| R250 | Receipt of annual fees |
Free format text: JAPANESE INTERMEDIATE CODE: R250 |
|
| EXPY | Cancellation because of completion of term |


