EP0866960B1 - Method for simultaneous analysis of cell viability, nucleated red blood cells and white blood cell differential - Google Patents
Method for simultaneous analysis of cell viability, nucleated red blood cells and white blood cell differential Download PDFInfo
- Publication number
- EP0866960B1 EP0866960B1 EP96945254A EP96945254A EP0866960B1 EP 0866960 B1 EP0866960 B1 EP 0866960B1 EP 96945254 A EP96945254 A EP 96945254A EP 96945254 A EP96945254 A EP 96945254A EP 0866960 B1 EP0866960 B1 EP 0866960B1
- Authority
- EP
- European Patent Office
- Prior art keywords
- wbc
- nrbc
- signals
- scatter
- sample
- Prior art date
- Legal status (The legal status is an assumption and is not a legal conclusion. Google has not performed a legal analysis and makes no representation as to the accuracy of the status listed.)
- Expired - Lifetime
Links
Images


Classifications
-
- G—PHYSICS
- G01—MEASURING; TESTING
- G01N—INVESTIGATING OR ANALYSING MATERIALS BY DETERMINING THEIR CHEMICAL OR PHYSICAL PROPERTIES
- G01N15/00—Investigating characteristics of particles; Investigating permeability, pore-volume, or surface-area of porous materials
- G01N15/10—Investigating individual particles
- G01N15/14—Electro-optical investigation, e.g. flow cytometers
- G01N15/1456—Electro-optical investigation, e.g. flow cytometers without spatial resolution of the texture or inner structure of the particle, e.g. processing of pulse signals
Definitions
- This invention relates to a method for the simultaneous and quantitative analysis of damaged white blood cells (WBC), nucleated red blood cells (NRBC) and white blood cell subpopulations (WBC/Diff). More particularly this invention relates to differentiating WBC, NRBC, damaged WBC and a MBC subclass differential (WBC/Diff) in a whole blood sample by the use of multi-dimensional light scatter and fluorescence analysis and a lysing reagent capable of lysing red blood cells (RBC) without damaging WBC cellular membranes.
- WBC white blood cells
- NRBC nucleated red blood cells
- WBC/Diff white blood cell subpopulations
- NRBC counts are conventionally determined by means of blood smear morphology. A stained blood smear is examined under the microscope and the NRBC are manually counted. In general, an NRBC concentration is reported as number of NRBC per 100 white blood cells ("WBC"). Normally, 200 WBC and the number of NRBC present in the same region on a patient blood smear are counted and the numbers are divided by 2 to express the NRBC concentration as the number of NRBC/100 WBC.
- WBC white blood cells
- NRBC red blood cell
- NRBC populations are not easily distinguished from WBC populations since NRBC do not form a well defined cluster among the WBC in the usual two dimensional space differentiation methods utilized on flow cytometers.
- One is usually not able to separate NRBC populations from the lymphocyte populations when the detected signals are viewed on the generally accepted, two-dimensional light scatter (forward vs. side) or light scatter vs. absorption, dot plots.
- the signals from the majority of the NRBC population is usually mixed in with the signals for RBC stroma and platelets ("PLT”), and the upper-end of NRBC cluster most often will extend into the space occupied by the lymphocyte population.
- PLT RBC stroma and platelets
- Nonviable cells may bind antibodies or other cellular markers non-specifically, and therefore should be identified and quantified in immuno-phenotyping as well as from hematology analysis.
- Apoptosis the term introduced by Kerr et al ., is a genetically programmed cell death which takes place during metamorphosis, embryogenesis, and morphogenesis. neutrophils undergo apoptosis during the inflammatory reaction, lymphocytes in the regulation of the immune system. Cell injury due to a variety of agents including chemotherapeutic cytotoxic insults may also lead to apoptosis. Apoptosis has also been demonstrated in premalignant and malignant tissues. During the process of apoptosis, the cell membrane remains intact and the cell breaks into apoptotic bodies which are then phagocytosed.
- Necrosis or accidental cell death, on the other hand, occurs in response to harmful insults such as physical damage, hypoxia, hyperthermia, starvation, complement attack and chemical injury. These cells lose ability to selectively permeate extracellular materials and leak, finally losing their plasma membrane. Cells that have lost plasma membrane integrity become permeable to external compounds such dyes that normally will not penetrate the intact cell membrane are considered to be "nonviable" or damaged. Damaged cells which have lost their plasma membrane integrity also do not function metabolically.
- the sample is treated with either FDA or PI.
- the cells which stain with FDA are considered viable and the cells which stain with PI are considered "dead".
- these methods are limited in that the cells cannot be fixed since fixed cells generate autofluorescence.
- fluorescein which is a product of FDA post hydrolysis by intracellular esterase, is so bright that it overwhelms the immunofluorescence signals from other stains such as FITC or phycoerythrin (PE).
- U.S. Patent Nos. 4,661,913 and 4,284,412 describe methods of differentiating WBC subpopulations by light scatter analysis on a flow cytometer.
- U.S. Patent No. 4,520,110 describes a method of differentiating heterogenous leukocyte populations by immuno-phenotyping using a combination of light scatter and fluorescence.
- Each of the above described methods require manual sample preparation and incubation time much too long to be incorporated on a rapid multi-parameter hematology analyzer of today. Additionally, these references do not appear to teach how to discriminate damaged cells from intact cells.
- a blood sample is manually prepared by a procedure that comprises the steps of: making a 1:250 dilution of the sample with buffered isotonic saline; adding 5 microliters of a predetermined concentration of a stock solution which contains a fluorescent RNA/DNA stain, a fluorescent membrane-potential-sensitive stain, fluorescing monodisperse calibration particles and an organic solvent in which the dyes dissolve; and incubating the mixture at room temperature for 3 to 5 minutes.
- the dyes are stored in an organic solvent such as DMSO or DMF as a stock solution and only a very small amount of these stock dye solutions are added directly to the cell suspension to stain the cells.
- the prepared cell suspension is then aspirated through flow cytometer flow cell for measurement.
- a DNA/RNA stain is used.
- This DNA/RNA stain is either acridine orange (AO), quinacrine (QA), or pyonine Y (PY) and the membrane-sensitive stain is 3,3-dehexyl-oxacarbocyanine (DiOC6).
- at least one additional stain is used, being selected from the group of: cell protein stains; lipid stains; enzyme stains; intracellular pH stains; and SH group stains.
- Valet as described in this patent: 1) is not fully automatable because of the step required for manual addition of a very small volume of dye dissolved in organic solvents; 2) is relatively long, as the amount of time necessary to complete the blood cell counts; 3) requires at least two dyes to characterize the blood cell this may produce a problem of quenching; 4) the requirement of making a 250 fold dilution of a blood sample does not provide enough WBC's to produce statistically satisfactory results unless the counting time is much prolonged; 5) does not demonstrate that it is possible to separate monocytes, eosinophils and basophils, suggesting that the teachings of Valet can only produce an incomplete WBC differential results (only two WBC subpopulations, granulocytes and lymphocytes, are shown in the figures and examples).
- U.S. Patent 5,057,413, to Terstappen discloses a flow cytometric method for discriminating between intact and damaged cells. In this method both intact and damaged cells in a sample are stained. The teachings of Terstappen are based upon the principle that there is a sufficient difference in the fluorescent intensity of the stained intact cells and that of damaged cells. A further stated objective of the disclosure is to use the differentiation methods of the art in conjunction with monoclonal antibodies (Mabs) fluorescently labelled with FITC or PE to simultaneously identify cellular antigens, intact cell and damaged cells, wherein the peak emission spectra of each fluorescent label must be distinguishable from each other and from a nucleic acid dye.
- Mabs monoclonal antibodies
- RBC's are lysed with ammonium chloride for 3 to 5 minutes, and centrifuged at 200g for 5 minutes. The pellet was washed twice with RPMI 1640 culture medium, each time centrifuging at 200g for 5 minutes. And then the cells were resuspended in phosphate buffered saline (PBS) with 1 % bovine serum albumin (BSA). When Mabs are added to the sample, incubated 20 minutes on ice, the cells were washed twice with the PBS solution and the cells were resuspended in 1 ml of 1 % paraformaldehyde in PBS.
- PBS phosphate buffered saline
- BSA bovine serum albumin
- a stock solution of LDS-751 was made in methanol and the working solution was prepared by diluting the stock solution in PBS. Ten microliters of this working solution is added to the prepared cell suspension.
- unfixed WBC's, post ammonium chloride lyse of RBC's, were resuspended and kept in RPMI solution for 1 hour before analysis in order to obtain optimal light scattering properties of the cells.
- the Terstappen method has several problems in that may variable in the fixation process, such as temperature, concentration of the fixative(s) and the duration of the fixation, can change the permeability of the cell membrane and thus the intensity of the staining.
- the hard fixed, originally intact cells may have the same staining intensity as that of the hard fixed, damaged cells since the DNA content of all cells of the same individual is the same (proliferating hyperploidy tumor or leukemic cells are exceptions).
- any DNA fragmentation occurs at the late stage of cell death, then the damaged cells will contain less DNA and the staining intensity will decrease.
- the Terstappen method is also long and cumbersome making it an difficult, if not impossible to incorporate onto a fully automated hematology instrument of today.
- the results reported in the patent also indicate that a large portion of the damaged cells may have occurred during the required long and torturous sample preparation procedure.
- the Inami et al. method does not separate or distinguish the fluorescent signals of the NRBC nuclei from that of other nuclear remnants such as Howell-Jolly Bodies, Basophilic Stippling, RNA from lysed reticulocytes and reticulated platelets, and DNA from WBC and Megakaryocytic fragments.
- the Inami et al. method requires that the sample be pretreated, off-line, using several reagents to "prep" the sample before the prepped sample/reagent solution can be loaded into the instrument.
- EP 0 559 208 discloses a method using flow cytometry for identifying and enumerating cells representing subpopulations of leukocytes in a biological sample containing leukocytes mixed with other blood cell types (e.g., blood or bone marrow samples).
- the method utilizes a fluorescence trigger to exclude selected subpopulations of blood particles prior to gating, and a gate established by analysis of acquired data parameters to exclude selected subpopulations of leukocytes from data analyses.
- a 2-parameter gate may be established based on analysis of a single light scattering parameter and a single fluorescence parameter (e.g., SSC and fluorescence).
- a 3-parameter gate may be established based on a combined analysis of SSC, FSC and fluorescence parameters.
- a fluorochrome-labeled antibody which recognizes an antigen or marker associated with all leukocyte subpopulations is used to stain the cells of the sample.
- a lysing reagent is added to the labeled sample.
- an object of the present invention is to provide an accurate method of distinguishing damaged WBC's from intact WBC's, and for rapidly quantitating the WBC differential (WBC/Diff), NRBC's, and damaged WBC's in a whole blood sample.
- Another objective of the present invention is to provide a fully automatable method for distinguishing damaged WBC's from intact WBC's, and for rapidly quantitating the WBC/Diff, NRBC's, and damaged WBC's in a whole blood sample.
- Yet another object of the present invention is to provide an automated method for distinguishing damaged WBC's from intact WBC's, and for rapidly quantitating the WBC/Diff, NRBC's, and damaged WBC's in a whole blood sample and for immuno-phenotyping.
- a method according to claim 1 for the simultaneous and quantitative, flow cytometric analysis of nucleated red blood cells (NRBC) and white blood cells (WBC), damaged or nonviable WBC and subpopulations of white blood cells (WBC/Diff) in a whole blood sample is provided.
- a device for the simultaneous and quantitative analysis of NRBC, WBC, WBC/Diff and nonviable cells in a whole blood sample.
- the device comprises a flow cytometer for obtaining at least one signal for parameters including scattered light at a first and a second range of scatter angles and fluorescence (FL or F1), and a triple triggering circuit that qualifies signals obtained by the flow cytometer for digitation by means of AND/OR logic wherein a qualified signal must be greater than the second scatter signal threshold, while at the same time it must be greater than either the first scatter signal threshold or the FL threshold ⁇ [(first scatter angle signal OR FL signals) AND second scatter angle signal] ⁇ .
- a method for the simultaneous and quantitative analysis of NRBC, WBC and WBC/Diff in a whole blood sample comprises the elimination of the red blood cells ("RBC") and the cytoplasm of NRBC from an aliquot of a blood sample to expose the NRBC nuclei, staining of the NRBC nuclei and nonviable WBC with a vital stain while minimizing the staining of viable WBC, subjecting the aliquot to flow cytometric light measurements, obtaining at least one signal for parameters including scattered light extinction at from about 0° to about 1° (ALL), scattered light from about 3°-10° (IAS) and fluorescence (F1), qualifying the signals obtained by using AND/OR logic wherein the logic comprises [(ALL signals OR F1 signals) AND (30-10° scatter signals)], constructing a three-dimensional plot of qualified intensity signals of fluorescence and scattered light from the detected signals, and differentiating nonviable from viable cells and the NRBC, WBC and WBC/D
- a flow cytometric device for the quantitative analysis of nonviable cells, NRBC, WBC and WBC/Diff in a whole blood sample.
- the device comprises a flow cytometer for obtaining at least one signal for parameters including scattered light at from about 0° to about 1° and from about 3°-10° and fluorescence (F1) and a triple triggering circuit that qualifies signals obtained by the flow cytometer for digitation by means of AND/OR logic wherein the logic comprises [(0° to about 1° scatter signals) OR (F1 signals) AND (3°-10° scatter signals)] to validate signals for further processing.
- the present invention relates to an automated method for simultaneous analysis of WBC differential (Diff), NRBC and cell viability in a whole blood sample.
- Diff WBC differential
- NRBC NRBC
- the method utilizes a lysing reagent/dye system in which RBCs and the cytoplasm of NRBC are lysed while minimizing the damage to WBC cellular membranes, and preferably WBC surface antigens, the exposed NRBC nuclei and any damaged WBC nuclei are stained with a nucleic acid stain that does not permeate intact cell membrane (vital stain). Intact WBC nuclei are not stained by exclusion.
- the disclosed method also permits accurate WBC/Diff analysis in a blood sample that contains NRBC by subtracting signals identified as NRBC from the total WBC signals before WBC/Diff analysis is performed. Only one dye is needed for NRBC and damaged WBC staining. This enables the WBC/Diff analysis to be performed by the difference of light scattering characteristics of the WBC subclasses. WBC subclasses identified as damaged by FL3+ signals are added back to the subclass to they belong and thus producing an accurate WBC/Diff results in a sample containing damaged WBC's.
- a vital stain is combined with a multipurpose reagent system which contains about 10 to 20 mM buffer, non-quaternary ammonium salt, a surfactant and a very low concentration of a WBC fixative, pH of about 6.0 to 7.5, osmolarity of about 230 to 310 mOsm/L, to carry out one step simultaneous analysis of WBC/Diff, NRBC, and damaged WBC.
- a multipurpose reagent system which contains about 10 to 20 mM buffer, non-quaternary ammonium salt, a surfactant and a very low concentration of a WBC fixative, pH of about 6.0 to 7.5, osmolarity of about 230 to 310 mOsm/L, to carry out one step simultaneous analysis of WBC/Diff, NRBC, and damaged WBC.
- Vital nucleic acid stains that can be used in the present invention must not permeate intact cell membrane and with relatively high extinction coefficient and low fluorescence intensity when they are not bound to nucleic acid.
- the spectral characteristics [Extinction (EX) max (nm)/Emission (EM) max (nm)] of the vital dyes must be compatible with the laser light source used in the system and their emission spectrum must not overlap that of the fluorochrome conjugated to the Mab used in immunophenotyping.
- nuclear dyes There number of nuclear dyes qualified for use in the disclosed system with appropriate light source. Some of the commercially available dyes that can be used in the disclosed system are 7-Aminoactinomycin D, YOYO-1, YOYO-3, TOTO-1, TOTO-3. BO-PRO-1, YO-PRO-1, TO-PRO-1, and many more.
- the qualified dyes which can be used with Argon laser which are also commercially available are Propidium iodide (PI), ethidium bromide (EBr), ethidium homodimer-1 (Ethn-1), ethidium homodimer-2 (EthD-2), diethylene triamine (DTA).
- PI Propidium iodide
- EBr ethidium bromide
- Ethn-1 ethidium homodimer-1
- EtD-2 ethidium homodimer-2
- DTA diethylene triamine
- the vital stain is PI
- the multipurpose reagent system has a pH of about 6.5 to 7.0, osmolarity of about 260, acetate buffer about 15 mM, ammonium chloride about 5.0 g/L, potassium bicarbonate about 2 g/L, saponin from about 100 mgs/L to about 150 mgs/L and formaldehyde about 0.07 %, and a triple threshold signal qualification routine that qualifies signals for digitization using an AND/OR logic.
- a reagent is disclosed and described in PCT Application Serial Number WO94/18828 , entitled "MULTIPURPOSE REAGENT SYSTEM FOR RAPID LYSIS OF WHOLE BLOOD SAMPLES.”
- any lysing reagent can be utilized as long as the reagent does not damage the WBC cellular membranes so as to allow previously (pre-lysing) viable WBC nuclei to become stained.
- the reagent/dye/sample mixture is then passed, essentially a cell at a time through an illuminated optical flow cell. This causes the cells to scatter the illuminating light and any stained nuclei present to fluoresce.
- the scattered and fluorescent light signals are detected by known means and, by using the triple triggering method in conjunction with the processing of the detected signals it is possible to identify and quantify WBC, WBC/Diff, damaged WBC and NRBC.
- a hematology analyzer which has been found to be particularly compatible with the triple trigger method of this invention is disclosed and described in U.S. Application Serial No. 08/283,379 , entitled “METHOD AND APPARATUS FOR PERFORMING AUTOMATED ANALYSIS", filed on June 7, 1995. Published as US 5939326 .
- a portion of a whole blood sample, about 25 microliters, is deposited by means of a sample aspiration probe into the WBC cup which contains about 850 microliters of an isotonic lysing reagent.
- a lysing reagent is used to lyse the erythrocyte fraction of the blood sample and to lyse the cytoplasm of NRBC to expose the nuclei of any NRBC present.
- the reagent In addition to lysing the erythrocyte fraction of the blood, the reagent must be gentle enough to protect or not damage the WBC fraction.
- the reagent will additionally contain, or be combined with, a small concentration of a vital nuclear stain which effectively labels any NRBC which might be present in the peripheral blood.
- the lysis chemistry will be configured such that the refractive index matches that of a sheath solution to substantially less than 0.1%.
- the mixture of lyse reagent and sample will normally remain in the above referenced WBC cup only for 11 seconds. There it is lysed and mixed at 42°C ⁇ 3°C. At this point, the contents of the WBC cup are piped directly to an optical flowcell 100 for detection, see Figure 1 .
- the measurement process begins as the cells stream passes through the flowcell 100, having been diluted with the addition of lyse so that the cells pass through the laser illuminated volume single file, in a laminar flowing sample stream surrounded by diluent/sheath solution.
- the illuminated volume is bounded in the two dimensions normal to the flow axis by the hydrodynamically focused cell stream, and in the dimension parallel to the flow axis by the vertical beam waist of the laser beam which is about 17 microns.
- the sample flow rate is about 2.5 microliters per second, and the corresponding illuminated sensing volume of the WBC and NRBC cells approximates an elliptical cylinder with dimension of about 80 x 5 x 17 microns.
- the 17 micron dimension is measured along the axis of the cylinder.
- the presence of a cell is detected by a compound photodiode 102 detecting axial light loss (ALL) and intermediate angle scatter (IAS), photomultiplier tube 104 which detects red fluorescence, and a unique triple trigger circuit, shown in Figure 2 , in the three dimensional feature space of ALL, IAS, and FL3 (red fluorescence).
- the triple trigger circuit qualifies signals for digitization using AND/OR logic. A qualified signal must be greater than the IAS trigger, while at the same time it must be greater than either the ALL trigger or the FL3 trigger.
- this unique triggering circuit and the lysing properties which include a balanced fixative, allow the exposed NRBC and damaged WBC nuclei to be rapidly stained, and clearly and non ambiguously counted and excluded from the WBC differential cell count without the usual interference from background, both fluorescent and non-fluorescent, such as DNA fragments, RBC stroma, and platelets.
- One or more detectors are preferably placed in the forward light path for measuring forward intermediate angle scattering (IAS) and either small angle forward scattering (SAS) or axial light loss (ALL; also known as forward extinction).
- IAS forward intermediate angle scattering
- SAS small angle forward scattering
- ALL axial light loss
- ALL is generally the decrease in light energy due to a cell passing in front of a laser beam and being detected by a photodiode.
- the light loss is generally due to scattering and defined as the decrease in light energy reaching a detector in the path of a laser beam due to the passage of a cell through that beam (generally ALL is detected at an angle of from about 0° to about 1°.)
- Small angle forward scatter (SAS) is light energy that reaches a detector outside the incident laser beam (but within a narrow angle of from about 1° to 3°) due to scattering from a cell passing through the beam.
- a beam stop is generally provided to keep the laser beam from getting into the detector. ALL measuring systems collect light within the incident cone of laser illumination, while small angle scatter systems collect light outside this cone.
- IAS Intermediate angle forward scattering
- ALL is collected in the angles less than about 0.3° horizontally and less than about 1.2° vertically from the laser axis, and IAS is collected at angles between about 3° and 10° from the laser axis.
- pulses are generated at detectors 102, 104, 106 and 108.
- the amplitudes of these pulses are then filtered, amplified, digitized, and stored in list mode in the corresponding five dimensional feature space of ALL, IAS, FL3, PSS (polarized side scatter), and DSS (depolarized side scatter).
- the normal counting time through flowcell 100 is 10 seconds. At the flow rate and dilution ratio described above, with a normal patient WBC count of 7000 cells per microliter of blood volume, the resulting event count rate would be 5000. In low count samples, this counting time can be automatically extended in order to improve the statistics of the measurement.
- the sample stream is piped to waste, and probe is cleaned and dried and prepared to process a subsequent sample.
- Algorithms are then applied to the list mode data of the aforementioned feature space of ALL, IAS, FL3, PSS, and DSS, and the following cell types are enumerated and/or flagged within less than 30 seconds of processing time: CELL TYPES ENUMERATED PERCENTAGES FLAGGED OR ENUMERATED White Cell concentration (WBC) Neutrophil concentration %N of WBC Lymphocyte concentration %LYMPH of WBC Monocyte concentration %MONO of WBC Eosinophil concentration % EOS of WBC Basophil concentration %BASO of WBC NRBC %NRBC of WBC Band concentration (BAND) Blast concentration (BLST) Immature gran. conc. (IG) Variant-lymph conc. (VARL) Damaged WBC %WBC Damaged/Count
- ALL and IAS signals are detected and collected for the WBC/Diff analysis and FL3 signals from stained NRBC nuclei are collected for NRBC analysis, as will be described below.
- the triple trigger circuit shown in Figure 2 , qualifies these signals for digitization using an AND/OR logic. To be qualified a signal must be greater than the IAS trigger, while at the same time it must be greater than either the ALL trigger or the FL3 trigger.
- Voltage comparators 300, 314 and 322 function by comparing the "+ inputs" (302, 310 and 318) to the "- inputs" (304, 312 and 320) to resultant outputs (306, 316, 324). If the "+ input” is of a higher voltage than the "- input” the output will be high. If the "+ input” is of a lower voltage than the "- input” the output will be low.
- the threshold voltages are independent voltages which are determined by system parameters.
- comparators 300 and 314 are inputs to OR gate 326 to give resultant OR gate output 328.
- the OR gate functions by comparing its inputs. The output will be high if either, or both, inputs are high.
- the output of the OR gate 328 and the output of comparators 322 and 324 are inputs to AND gate 330.
- the AND gate functions by comparing its inputs to derive its output 332 which is also the valid trigger output. The output will be high only if both inputs are high.
- the valid trigger output 332) will only be high if the IAS signal 318 is greater than its threshold voltage 320, and either or both, the ALL signal 302 is greater than its threshold voltage 304 or the FL3 signal 310 is greater than its threshold voltage 312.
- ALL and IAS are collected for WBC/Diff analysis and Fluorescence (FL3) signals are collected for NRBC and damaged WBC analysis.
- a triple threshold circuit or qualification routine qualifies signals for digitization using AND/OR logic. According to this unique routine or circuit, to be qualified a signal must be greater than the IAS threshold, while at the same time it must be greater than either the ALL threshold or the FL3 threshold. Using this triggering circuit, the NRBC's form a unique cluster in the aforementioned three dimensional space, see Figures 14 and 15 , which can be easily counted during the Optical WBC Differential analysis, and exclude non ambiguously from the WBC count.
- Stained NRBC nuclei are separated from the various background noise signals via the disclosed triple-triggering process (on ALL, IAS and FL3) and only the FL3+ signals from NRBC nuclei above the FL3 threshold on the ALL vs FL3 dot plot are counted as NRBC.
- Another technical advantage of the disclosed system is that it requires much lower concentration of the dye to effectively and rapidly stain NRBC for accurate detection and counting because of complete lysis of the cytoplasm of NRBC making their nuclei more accessible to the stain. This condition permits high signal to noise (S/N) ratio, greater than 100, in NRBC detection.
- S/N signal to noise
- the concentration of a vital dye required this system to rapidly perform the simultaneous analysis of WBC/Diff/NRBC/Damaged WBC is only 1 to 2 ⁇ g/ml which is at least 50 fold less than that in the previous art.
- the disclosed method is unique in that simultaneous analysis of WBC/Diff/NRBC/Damaged WBC can be carried out automatically, accurately, and rapidly without interference from other cellular debris.
- Further advantage of the present invention is that it has a very high clinical value in that the method can be incorporated into a clinical hematology analyzer which routinely calibrate for WBC, RBC, and Platelet counts.
- Such a system is capable of producing an accurate WBC/Diff/NRBC/Damaged WBC data (% as well as absolute counts) in clinical blood samples. This has not previously been possible.
- the multipurpose reagent system is comprised of about 95 mM ammonium chloride (5g/l), about 0.075% by volume of formaldehyde, from about 10 mM to about 20 mM acetate buffer, about 10 mM potassium bicarbonate, and about 0.01% by weight volume (i.e., grams per 100 ml) of saponin.
- the pH of the reagent system is adjusted to a range of from about 6.2 to about 7.0 and the osmolality of the reagent system is from about 215 to about 270 mOsm/L.
- the reagent is pre-warmed at 42° C ⁇ 3° in the instrument's heated mixing chamber, where the sample and reagent are mixed and incubated for 11 seconds. This mixture was then transported to the flow cell (which takes 8 and 1/2 seconds) for the WBC/Diff/NRHC analysis.
- the optical configuration of the system is presented in Figure 1 . The analysis was performed without implementing the triple triggering circuit; using only ALL and FL3 dual triggers as is common in the art. See all Figures from Figure 3A through 10C .
- the upper dot plot display of Figure 11A maps the light scatter signals (ALL vs. IAS) obtained from the sample and shows 3 distinct populations of WBC.
- the Basophil cluster is not apparent here because normal bloods do not contain many Basophils.
- the Eosinophil cluster is not shown here since Eosinophils are separated via a DSS vs, PSS dot plot (not shown) and the middle cytogram of Figure 11B shows a dot plot display of ALL and FL3 signals as labeled. Note that normal blood does not contain any NRBCs.
- the lower bottom FL3+ clusters, Figures 11B and 11C are apparently cell debris containing RNA or DNA, as described earlier.
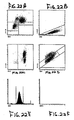
- Figures 12A and 12B are dot plot displays of an abnormal blood with NRBC (47 NRBC/100 WBC) analyzed as described in Example 1 utilizing a standard detection method.
- the cluster right below the lymphocyte population in the top cytogram belongs to NRBC and the small cluster at the bottom, left corner belongs to the origin noise which include RBC stroma (reticula, Howell Jolly Bodies and etc.), platelets and WBC debris.
- Figure 12B shows that the origin noise cluster of this sample stained with the nuclear dye brightly, follows the stained NRBC cluster very closely in FL3 channel, thereby making it impossible to set the FL3 trigger to count NRBC accurately.
- the cytograms for Figures 13A and 13B are dot plot displays of an abnormal blood with NRBC (51 NRBC/100 WBC) analyzed as described in Example 1 utilizing a standard detection method.
- the cluster right below the lymphocyte population in the top display, Figure 13A belongs to NRBC.
- An increased FL3+ origin noise of this sample can be seen.
- the noise cluster is located very close to the NRBC cluster in the FL3 channel.
- the FL3 noise is interfering with the position of the FL3 trigger.
- the FL3 trigger was set high enough to eliminate all the origin noise, a part of the NRBC population was also lost below the FL3 trigger as shown in Figure 13B .
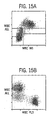
- Figures 15A and 15B show the dot plot displays of the NRBC distribution of another clinical whole blood sample which contained 140 NRBC/100 WBC, also post triple trigger (ALL, FL3 and IAS) implementation.
- ALL, FL3 and IAS post triple trigger
- the origin noise is not visible and the total NRBC population is recovered above the FL3 trigger.
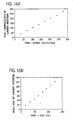
- Linearity samples were prepared by adding various concentrations of unfixed chicken erythrocytes to a EDTA, anti-coagulated normal human blood. The samples were processed as described in Example 1 utilizing the triple trigger detection method of the present invention.
- the cytoplasm of chicken erythrocytes lyse in the method of present invention leaving only naked nuclei (CEN).
- CEN stained very rapidly with the vital nuclear stain (PI) in the diluent and become fluorescent (FL3).
- the FL3+ CEN are counted as NRBC and reported as number of NRBC/100 WBC and as absolute counts per ⁇ L of the whole blood sample in the method of the present invention.
- the results are presented in Figures 16A and 16B .
- the linearity plots of NRBC/100 WBC and NRBC in absolute numbers in the figure demonstrate that the method of the current invention generate a linear NRBC counts.
- the top left cytogram, Figure 18A of the light scatter signals (ALL vs IAS) shows 3 distinct populations of WBC (neutrophils, monocytes and lymphocytes. Basophil cluster is not apparent here because a normal blood contains only about 1% or less basophils. Eosinophils are separated on the top right DSS vs PSS cytogram, Figure 18B .
- the middle left cytogram, Figure 18C is a display of ALL and FL3 signals. Note that normal blood does not contain any NRBC and that there are only few damaged cells to the right of the vertical line in Figure 18C (FL3+ signals).
- FIG. 19A - 19F An abnormal blood with NRBC ( 4.99 k/ ⁇ L or 46.6 NRBC/100 WBC) was analyzed as described in Example 8 and the results are presented in Figures 19A - 19F .
- the cluster right below the lymphocyte population in the top left cytogram (ALL vs IAS), Figure 19A belongs to NRBC.
- the bottom right cytogram (ALL vs FL3+), Figure 19F reveals that the stripped NRBC nuclei are stained brightly and pulled above the FL3+ trigger and counted.
- the NRBC counts are then subtracted from the total WBC counts before WBC differential analysis, producing an accurate WBC/Diff results.
- FIG. 20A A clinical sample (CLL) which contains damaged lymphocytes was analyzed as described in Example 8 and the results are presented in Figures 20A - 20F .
- Figure 20C (ALL vs FL3+) shows that almost one-half of the lymphocyte population stained with the nucleic acid dye (PI). Microscopic smear review of the sample revealed that about 50% of the lymphocyte population was either smudged or had lost their cytoplasmic membrane (naked nuclei).
- the damaged lymphocytes are distinguished from NRBC's along the ALL axis since their light scatter signals are higher than that of the stripped NRBC nuclei.
- Example 8 A normal blood sample aged for 35 hours under refrigeration was analyzed as described in Example 8 and the results are presented in Figures 21A - 21F .
- the sample was processed as described in Example 8.
- the FL3+ signals shown on the ALL vs FL3 cytogram to the right of granulocytes and lymphocytes, Figure 19F represent damaged granulocytes and lymphocytes respectively.
- the top cytograms, Figure 23A & B represent the negative control of the normal blood, the left cytogram, Figure 23A shows forward scatter (FCS) vs 90° side scatter showing the lymphocyte gating; the right cytogram, Figure 23B shows the two dimensional display of FL1 vs FL2; the middle cytograms, Figure 23C & D represent the same sample but reacted with anti-CD4 Mab; the bottom cytograms, Figures 23E & F represent the same blood but reacted with anti-CD8 Mab.
- FCS forward scatter
- Figure 23B shows the two dimensional display of FL1 vs FL2
- the middle cytograms, Figure 23C & D represent the same sample but reacted with anti-CD4 Mab
- the bottom cytograms, Figures 23E & F represent the same blood but reacted with anti-CD8 Mab.
- FIGS 24A - 24F The results are presented in Figures 24A - 24F and Table 1.
- the top cytograms, Figure 24A & B represent a negative control of a normal blood
- the left cytogram, Figure 24A shows forward scatter (FCS) vs 90° side scatter showing the lymphocyte gating
- the right cytogram, Figure 24B is the two dimensional display of FL1 vs FL2
- the middle cytograms, Figures 24 C & D represent the same sample but reacted with anti-CD4 Mab
- the bottom cytograms, Figures 24E & F represent the same blood but reacted with anti-CD8 Mab.
Abstract
Description
- This invention relates to a method for the simultaneous and quantitative analysis of damaged white blood cells (WBC), nucleated red blood cells (NRBC) and white blood cell subpopulations (WBC/Diff). More particularly this invention relates to differentiating WBC, NRBC, damaged WBC and a MBC subclass differential (WBC/Diff) in a whole blood sample by the use of multi-dimensional light scatter and fluorescence analysis and a lysing reagent capable of lysing red blood cells (RBC) without damaging WBC cellular membranes.
- NRBC counts are conventionally determined by means of blood smear morphology. A stained blood smear is examined under the microscope and the NRBC are manually counted. In general, an NRBC concentration is reported as number of NRBC per 100 white blood cells ("WBC"). Normally, 200 WBC and the number of NRBC present in the same region on a patient blood smear are counted and the numbers are divided by 2 to express the NRBC concentration as the number of NRBC/100 WBC. The major drawback to this type of manual microscopic method is that it is very labor intensive, time-consuming, subjective and inaccurate due to poor statistics. Therefore, an accurate automated NRBC method has long been sought after by pathologists and laboratory technicians.
- A major problem in automating a NRBC method for use on a clinical flow cytometer has been that since NRBC are rare events and RBC populations are so numerous, NRBC populations are not easily detected among the red blood cell ("RBC") population by either the differences in the cell's electrical resistivity (impedance measurements) or its light scattering characteristics (optical measurements). Although many attempts have been made to count NRBC among WBC populations, instead of among RBC population, these efforts have not generally been successful.
- NRBC populations are not easily distinguished from WBC populations since NRBC do not form a well defined cluster among the WBC in the usual two dimensional space differentiation methods utilized on flow cytometers. One is usually not able to separate NRBC populations from the lymphocyte populations when the detected signals are viewed on the generally accepted, two-dimensional light scatter (forward vs. side) or light scatter vs. absorption, dot plots. The signals from the majority of the NRBC population is usually mixed in with the signals for RBC stroma and platelets ("PLT"), and the upper-end of NRBC cluster most often will extend into the space occupied by the lymphocyte population.
- Automated clinical hematology instruments, such as the Technicon H*1®, Coulter STK® S and Abbott Cell-Dyn® 3000 and 3500 instruments only "flag" samples for the possible presence of NRBC if the sample dot plot shows increased noise signals below the lymphocyte cluster. This type of flagging very often produces false positive results since the elevated noise level could be due to PLT clumps, giant PLT or incompletely lysed RBC. In addition, it is extremely difficult to obtain an accurate Total WBC count and WBC Differential ("WBC/Diff") on samples containing NRBC because of the interference. Additionally, blood smears of'the flagged samples must be examined and counted under the microscope by a skilled technician to obtain accurate WBC differential and NRBC counts. This is a very labor-intensive and subjective process.
- Notwithstanding these difficulties, the identification and quantitation of damaged cells among intact cells in a sample may be of importance for accurate characterization of cell populations exhibiting spontaneous cell death or cells affected by cytotoxic agents or cancer drugs. Nonviable cells may bind antibodies or other cellular markers non-specifically, and therefore should be identified and quantified in immuno-phenotyping as well as from hematology analysis.
- In vivo, there are two different forms of cell death: apoptosis and necrosis. Apoptosis, the term introduced by Kerr et al., is a genetically programmed cell death which takes place during metamorphosis, embryogenesis, and morphogenesis. neutrophils undergo apoptosis during the inflammatory reaction, lymphocytes in the regulation of the immune system. Cell injury due to a variety of agents including chemotherapeutic cytotoxic insults may also lead to apoptosis. Apoptosis has also been demonstrated in premalignant and malignant tissues. During the process of apoptosis, the cell membrane remains intact and the cell breaks into apoptotic bodies which are then phagocytosed. Necrosis, or accidental cell death, on the other hand, occurs in response to harmful insults such as physical damage, hypoxia, hyperthermia, starvation, complement attack and chemical injury. These cells lose ability to selectively permeate extracellular materials and leak, finally losing their plasma membrane. Cells that have lost plasma membrane integrity become permeable to external compounds such dyes that normally will not penetrate the intact cell membrane are considered to be "nonviable" or damaged. Damaged cells which have lost their plasma membrane integrity also do not function metabolically.
- In vitro, a similar phenomenon, cell death, occurs as a blood sample ages or during cell preparation procedures that damage the cell prior to flow cytometric analysis. Current cell preparation procedures subject the cells to a long process including labelling cells with monoclonal antibodies (Mab), lysing of red blood cells (RBC) and fixing of the white blood cells (WBC) to prevent further destruction.
- The combination of 90° and forward light scatter techniques have been used in the art to discriminate damaged cells from intact cells. It has been found however, that light scatter alone is not sensitive enough to clearly separate and quantitate the damaged or nonviable cells from the viable or intact cells. This is particularly true if a sample contains heterogenous cell populations such as a blood sample. Use of a fluorescent nucleic acid stain in addition to multi-angle light scatter dramatically increases the sensitivity of the detection for dead cells. Currently a variety of techniques exist utilizing light scatter and fluorescence techniques for determining whether a cell in a sample is intact or damaged. According to the art viable, intact cells can be distinguished from dead cells by using either fluorescein diacetate (FDA) or propidium iodide (PI). In these methods, the sample is treated with either FDA or PI. The cells which stain with FDA are considered viable and the cells which stain with PI are considered "dead". However, these methods are limited in that the cells cannot be fixed since fixed cells generate autofluorescence. In addition, fluorescein, which is a product of FDA post hydrolysis by intracellular esterase, is so bright that it overwhelms the immunofluorescence signals from other stains such as FITC or phycoerythrin (PE).
-
U.S. Patent Nos. 4,661,913 and4,284,412 describe methods of differentiating WBC subpopulations by light scatter analysis on a flow cytometer.U.S. Patent No. 4,520,110 describes a method of differentiating heterogenous leukocyte populations by immuno-phenotyping using a combination of light scatter and fluorescence. Each of the above described methods require manual sample preparation and incubation time much too long to be incorporated on a rapid multi-parameter hematology analyzer of today. Additionally, these references do not appear to teach how to discriminate damaged cells from intact cells. -
U.S. Patent No. 4,751,188, to Valet , describes a method which is based on the principle that cellular components can be stained by dyes and measured simultaneously with cell volume, for example in a flow cytometer. According to the patent a complete blood count can be produced within a few minutes. In this method, a blood sample is manually prepared by a procedure that comprises the steps of: making a 1:250 dilution of the sample with buffered isotonic saline; adding 5 microliters of a predetermined concentration of a stock solution which contains a fluorescent RNA/DNA stain, a fluorescent membrane-potential-sensitive stain, fluorescing monodisperse calibration particles and an organic solvent in which the dyes dissolve; and incubating the mixture at room temperature for 3 to 5 minutes. The dyes are stored in an organic solvent such as DMSO or DMF as a stock solution and only a very small amount of these stock dye solutions are added directly to the cell suspension to stain the cells. The prepared cell suspension is then aspirated through flow cytometer flow cell for measurement. In this method, a DNA/RNA stain is used. This DNA/RNA stain is either acridine orange (AO), quinacrine (QA), or pyonine Y (PY) and the membrane-sensitive stain is 3,3-dehexyl-oxacarbocyanine (DiOC6). Additionally, at least one additional stain is used, being selected from the group of: cell protein stains; lipid stains; enzyme stains; intracellular pH stains; and SH group stains. The methodology of Valet, as described in this patent: 1) is not fully automatable because of the step required for manual addition of a very small volume of dye dissolved in organic solvents; 2) is relatively long, as the amount of time necessary to complete the blood cell counts; 3) requires at least two dyes to characterize the blood cell this may produce a problem of quenching; 4) the requirement of making a 250 fold dilution of a blood sample does not provide enough WBC's to produce statistically satisfactory results unless the counting time is much prolonged; 5) does not demonstrate that it is possible to separate monocytes, eosinophils and basophils, suggesting that the teachings of Valet can only produce an incomplete WBC differential results (only two WBC subpopulations, granulocytes and lymphocytes, are shown in the figures and examples). -
U.S. Patent 5,057,413, to Terstappen , discloses a flow cytometric method for discriminating between intact and damaged cells. In this method both intact and damaged cells in a sample are stained. The teachings of Terstappen are based upon the principle that there is a sufficient difference in the fluorescent intensity of the stained intact cells and that of damaged cells. A further stated objective of the disclosure is to use the differentiation methods of the art in conjunction with monoclonal antibodies (Mabs) fluorescently labelled with FITC or PE to simultaneously identify cellular antigens, intact cell and damaged cells, wherein the peak emission spectra of each fluorescent label must be distinguishable from each other and from a nucleic acid dye. In this method, RBC's are lysed with ammonium chloride for 3 to 5 minutes, and centrifuged at 200g for 5 minutes. The pellet was washed twice with RPMI 1640 culture medium, each time centrifuging at 200g for 5 minutes. And then the cells were resuspended in phosphate buffered saline (PBS) with 1 % bovine serum albumin (BSA). When Mabs are added to the sample, incubated 20 minutes on ice, the cells were washed twice with the PBS solution and the cells were resuspended in 1 ml of 1 % paraformaldehyde in PBS. A stock solution of LDS-751 was made in methanol and the working solution was prepared by diluting the stock solution in PBS. Ten microliters of this working solution is added to the prepared cell suspension. In another experiment, unfixed WBC's, post ammonium chloride lyse of RBC's, were resuspended and kept in RPMI solution for 1 hour before analysis in order to obtain optimal light scattering properties of the cells. - The Terstappen method has several problems in that may variable in the fixation process, such as temperature, concentration of the fixative(s) and the duration of the fixation, can change the permeability of the cell membrane and thus the intensity of the staining. The hard fixed, originally intact cells may have the same staining intensity as that of the hard fixed, damaged cells since the DNA content of all cells of the same individual is the same (proliferating hyperploidy tumor or leukemic cells are exceptions). In addition, if any DNA fragmentation occurs at the late stage of cell death, then the damaged cells will contain less DNA and the staining intensity will decrease. The Terstappen method is also long and cumbersome making it an difficult, if not impossible to incorporate onto a fully automated hematology instrument of today. The results reported in the patent also indicate that a large portion of the damaged cells may have occurred during the required long and torturous sample preparation procedure.
- Recently,
U.S. Patent # 5,298,426, issued on March 29, 1994, to Inami et al. for the detection of NRBC. This patent teaches a two-step method comprising the staining of WBC and NRBC by specific nuclear stains. In this patented method, a blood sample is first mixed with an acid hypotonic solution containing a fluorescent nuclear dye. Then, a solution comprising an alkaline salt buffer, to adjust pH and Osmolarity, is mixed with the sample/first reagent solution. This final solution is then loaded into a flow cytometer to detect and count NRBC along with other nucleated cells. - There are several reasons why the Inami et al. approach is not acceptable, especially for an automatable method. First, an acidic-hypotonic solution damages all cell membranes making the WBC leaky and therefore selective staining of NRBC nuclei by a nuclear stain is not possible. There are no known dyes which stain only NRBC nuclei and not WBC nuclei since the nuclear material (DNA) is the same. The nuclear stain claimed by Inami et al., is Propidium Iodide, a commonly used nucleic acid stain.
- Additionally, the Inami et al. method does not separate or distinguish the fluorescent signals of the NRBC nuclei from that of other nuclear remnants such as Howell-Jolly Bodies, Basophilic Stippling, RNA from lysed reticulocytes and reticulated platelets, and DNA from WBC and Megakaryocytic fragments. Third, the Inami et al. method requires that the sample be pretreated, off-line, using several reagents to "prep" the sample before the prepped sample/reagent solution can be loaded into the instrument.
-
EP 0 559 208 - For this purpose, a fluorochrome-labeled antibody which recognizes an antigen or marker associated with all leukocyte subpopulations is used to stain the cells of the sample.
- If erythrocytes in the labeled sample are to be lysed prior to flow cytometric analysis, a lysing reagent is added to the labeled sample.
- The problems in the existing art described above have been resolved in the present invention.
- Accordingly, an object of the present invention is to provide an accurate method of distinguishing damaged WBC's from intact WBC's, and for rapidly quantitating the WBC differential (WBC/Diff), NRBC's, and damaged WBC's in a whole blood sample.
- Another objective of the present invention is to provide a fully automatable method for distinguishing damaged WBC's from intact WBC's, and for rapidly quantitating the WBC/Diff, NRBC's, and damaged WBC's in a whole blood sample.
- Yet another object of the present invention is to provide an automated method for distinguishing damaged WBC's from intact WBC's, and for rapidly quantitating the WBC/Diff, NRBC's, and damaged WBC's in a whole blood sample and for immuno-phenotyping.
- A method according to
claim 1 for the simultaneous and quantitative, flow cytometric analysis of nucleated red blood cells (NRBC) and white blood cells (WBC), damaged or nonviable WBC and subpopulations of white blood cells (WBC/Diff) in a whole blood sample is provided. - A device is provided for the simultaneous and quantitative analysis of NRBC, WBC, WBC/Diff and nonviable cells in a whole blood sample. The device comprises a flow cytometer for obtaining at least one signal for parameters including scattered light at a first and a second range of scatter angles and fluorescence (FL or F1), and a triple triggering circuit that qualifies signals obtained by the flow cytometer for digitation by means of AND/OR logic wherein a qualified signal must be greater than the second scatter signal threshold, while at the same time it must be greater than either the first scatter signal threshold or the FL threshold {[(first scatter angle signal OR FL signals) AND second scatter angle signal]}.
- In an embodiment of the invention, a method for the simultaneous and quantitative analysis of NRBC, WBC and WBC/Diff in a whole blood sample is provided. The method comprises the elimination of the red blood cells ("RBC") and the cytoplasm of NRBC from an aliquot of a blood sample to expose the NRBC nuclei, staining of the NRBC nuclei and nonviable WBC with a vital stain while minimizing the staining of viable WBC, subjecting the aliquot to flow cytometric light measurements, obtaining at least one signal for parameters including scattered light extinction at from about 0° to about 1° (ALL), scattered light from about 3°-10° (IAS) and fluorescence (F1), qualifying the signals obtained by using AND/OR logic wherein the logic comprises [(ALL signals OR F1 signals) AND (30-10° scatter signals)], constructing a three-dimensional plot of qualified intensity signals of fluorescence and scattered light from the detected signals, and differentiating nonviable from viable cells and the NRBC, WBC and WBC/Diff, all from the constructed three-dimensional plot and determining the number of cells of each.
- A flow cytometric device is provided for the quantitative analysis of nonviable cells, NRBC, WBC and WBC/Diff in a whole blood sample. The device comprises a flow cytometer for obtaining at least one signal for parameters including scattered light at from about 0° to about 1° and from about 3°-10° and fluorescence (F1) and a triple triggering circuit that qualifies signals obtained by the flow cytometer for digitation by means of AND/OR logic wherein the logic comprises [(0° to about 1° scatter signals) OR (F1 signals) AND (3°-10° scatter signals)] to validate signals for further processing.
- These and further features and advantages of the invention will be apparent from the following description of the preferred embodiments thereof.
-
-
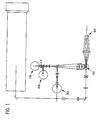
Figure 1 is a schematic diagram of the optics of a clinical flow cytometer that may be employed in implementing the method of the present invention. -
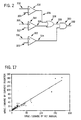
Figure 2 is a diagram depicting a "Valid" triple trigger circuit. -
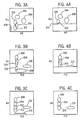
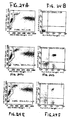
Figures 3A, 3B and 3C are drawings of the WBC, NRBC, RBC stroma and other background noise distribution of a whole blood sample processed as described in Example 1, utilizing standard or normal detection triggers. -
Figures 4A, 4B and 4C are drawings of the RBC, NRBC, RBC stroma and other background noise distribution of a whole blood sample processed as described in Example 1 utilizing only an 0° to about 1° scatter axial light loss (ALL) trigger. -
Figures 5A, 5B, and 5C are drawings of the WBC, NRBC, RBC stroma and other background noise distribution of a whole blood sample processed as described in Example 1 utilizing only a 30-10° intermediate angle scatter (IAS) trigger. -
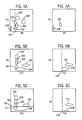
Figures 6A, 6B and 6C are drawings of the NRBC, RBC stroma and other background noise distribution of a whole blood sample processed as described in Example 1 utilizing only a fluorescence (FL3) trigger. -
Figures 7A, 7B and 7C are drawings of the NRBC distribution of a whole blood sample processed as described in Example 1 utilizing a trigger level for FL3 higher than for the trigger utilized inFigure 6 to eliminate the noise signals. -
Figure 8 is a drawing of the WBC, NRBC and other background noise distribution of a whole blood sample processed as described in Example 1 utilizing two triggers, ALL and FL3, electronically "OR'ed" together. -
Figures 9A, 9B and 9C are drawings of the WBC and NRBC distribution of a whole blood sample processed as described in Example 1, utilizing two triggers ALL and FL3 electronically "OR'ed" together with the level of FL3 trigger set at a higher value than inFigure 8 . -
Figures 10A, 10B and 10C are drawings of the WBC and NRBC distribution of a whole blood sample processed as described in Example 1, with triggers for ALL, IAS and FL3. -
Figures 11A - 11C show the dot plot displays of a normal blood sample processed as described in Example 1, utilizing normal or standard detection triggers. -
Figures 12A and 12B show the cytograms of an abnormal blood with NRBC, processed as described in Example 2, utilizing standard or normal detection triggers. -
Figure 13A and 13B show the cytograms of an abnormal blood with NRBC, processed as described in Example 3, utilizing normal detection triggers. -
Figures 14A - 14C depict the distributions of a whole blood sample which contained 56 NRBC/100 WBC utilizing the triple trigger (ALL, FL3 and IAS) detection method of the present invention. -
Figures 15A and 15B depict the distributions of another whole blood sample which contained 140 NRBC/100 WBC, also utilizing the triple trigger (ALL, FL3 and IAS) detection method of the present invention. -
Figures 16A and 16B show the results of linearity samples that were prepared and processed as described in Example 6 by utilizing a method of the present invention. -
Figure 17 is the correlation plot of an automated hematology analyzer's NRBC counts (ordinate) utilizing a method of the present invention and manual microscopic NRBC counts (abscissa). The data were processed as described in Example 7. -
Figures 18A - 18F show the cytograms of a normal blood sample as described in Example 8. -
Figures 19A - 19F show the cytograms of an abnormal blood sample with NRBC (4.99 k/µL or 46.6 NRBC/100 WBC) and as described in Example 9. -
Figures 20A - 20F show cytograms of a sample containing damaged lymphocytes as described in Example 10 -
Figure 21A - 21F show cytograms of a normal blood aged 35 hrs under refrigeration as described in Example 11. -
Figures 22A - 22F show cytograms of a manipulated sample in which hard-fixed human WBC's and platelets are mixed with human RBC fraction and re-suspended in a human plasma as described in Example 12. -
Figure 23A - 23F are commercial flow cytometer displays of a blood sample processed as described in Example 13. -
Figure 24A - 24F are commercial flow cytometer displays of a blood sample processed as described in Example 14. - Broadly, the present invention relates to an automated method for simultaneous analysis of WBC differential (Diff), NRBC and cell viability in a whole blood sample.
- One aspect of the present invention is that the method utilizes a lysing reagent/dye system in which RBCs and the cytoplasm of NRBC are lysed while minimizing the damage to WBC cellular membranes, and preferably WBC surface antigens, the exposed NRBC nuclei and any damaged WBC nuclei are stained with a nucleic acid stain that does not permeate intact cell membrane (vital stain). Intact WBC nuclei are not stained by exclusion.
- The disclosed method also permits accurate WBC/Diff analysis in a blood sample that contains NRBC by subtracting signals identified as NRBC from the total WBC signals before WBC/Diff analysis is performed. Only one dye is needed for NRBC and damaged WBC staining. This enables the WBC/Diff analysis to be performed by the difference of light scattering characteristics of the WBC subclasses. WBC subclasses identified as damaged by FL3+ signals are added back to the subclass to they belong and thus producing an accurate WBC/Diff results in a sample containing damaged WBC's.
- In the disclosed system, a vital stain is combined with a multipurpose reagent system which contains about 10 to 20 mM buffer, non-quaternary ammonium salt, a surfactant and a very low concentration of a WBC fixative, pH of about 6.0 to 7.5, osmolarity of about 230 to 310 mOsm/L, to carry out one step simultaneous analysis of WBC/Diff, NRBC, and damaged WBC.
- Vital nucleic acid stains that can be used in the present invention must not permeate intact cell membrane and with relatively high extinction coefficient and low fluorescence intensity when they are not bound to nucleic acid. The spectral characteristics [Extinction (EX) max (nm)/Emission (EM) max (nm)] of the vital dyes must be compatible with the laser light source used in the system and their emission spectrum must not overlap that of the fluorochrome conjugated to the Mab used in immunophenotyping.
- The following characteristics are desired for the vital stains for the disclosed system:
- High extinction coefficient;
- High quantum yield;
- High binding affinity to nucleic acid;
- Low fluorescence when it is not bound to nucleic acid; and
- Spectral Characteristics must be compatible with the light source used in the detection system. e.g. For Argon laser light source, EX max around 488 nm and EM max around 630 nm.
- This is not to limit the vital dyes with EX max range around 488 nm to be used with the disclosed methods. It will be obvious to those who are familiar in the art that the dyes with different EX max can be excited with appropriate light source such as HeNe, Xenon or Mercury lamps.
- There number of nuclear dyes qualified for use in the disclosed system with appropriate light source. Some of the commercially available dyes that can be used in the disclosed system are 7-Aminoactinomycin D, YOYO-1, YOYO-3, TOTO-1, TOTO-3. BO-PRO-1, YO-PRO-1, TO-PRO-1, and many more.
- In a preferred embodiment of the present invention, the qualified dyes which can be used with Argon laser which are also commercially available are Propidium iodide (PI), ethidium bromide (EBr), ethidium homodimer-1 (Ethn-1), ethidium homodimer-2 (EthD-2), diethylene triamine (DTA).
- In a preferred embodiment of the present invention, the vital stain is PI, the multipurpose reagent system has a pH of about 6.5 to 7.0, osmolarity of about 260, acetate buffer about 15 mM, ammonium chloride about 5.0 g/L, potassium bicarbonate about 2 g/L, saponin from about 100 mgs/L to about 150 mgs/L and formaldehyde about 0.07 %, and a triple threshold signal qualification routine that qualifies signals for digitization using an AND/OR logic. Such a reagent is disclosed and described in
PCT Application Serial Number WO94/18828
However, any lysing reagent can be utilized as long as the reagent does not damage the WBC cellular membranes so as to allow previously (pre-lysing) viable WBC nuclei to become stained. - The reagent/dye/sample mixture is then passed, essentially a cell at a time through an illuminated optical flow cell. This causes the cells to scatter the illuminating light and any stained nuclei present to fluoresce. The scattered and fluorescent light signals are detected by known means and, by using the triple triggering method in conjunction with the processing of the detected signals it is possible to identify and quantify WBC, WBC/Diff, damaged WBC and NRBC. A hematology analyzer which has been found to be particularly compatible with the triple trigger method of this invention is disclosed and described in
U.S. Application Serial No. 08/283,379 US 5939326 . - The following description is defined by this hematology analyzer. Such a description is merely for convenience and by no means is the present invention limited to only one instrument.
- A portion of a whole blood sample, about 25 microliters, is deposited by means of a sample aspiration probe into the WBC cup which contains about 850 microliters of an isotonic lysing reagent. A lysing reagent is used to lyse the erythrocyte fraction of the blood sample and to lyse the cytoplasm of NRBC to expose the nuclei of any NRBC present. In addition to lysing the erythrocyte fraction of the blood, the reagent must be gentle enough to protect or not damage the WBC fraction. No matter what the formulation of the lyse utilized with the triple trigger method; the reagent will additionally contain, or be combined with, a small concentration of a vital nuclear stain which effectively labels any NRBC which might be present in the peripheral blood. Preferably, for use with the above referenced analyzer, the lysis chemistry will be configured such that the refractive index matches that of a sheath solution to substantially less than 0.1%.
- The mixture of lyse reagent and sample will normally remain in the above referenced WBC cup only for 11 seconds. There it is lysed and mixed at 42°C ± 3°C. At this point, the contents of the WBC cup are piped directly to an
optical flowcell 100 for detection, seeFigure 1 . - The measurement process begins as the cells stream passes through the
flowcell 100, having been diluted with the addition of lyse so that the cells pass through the laser illuminated volume single file, in a laminar flowing sample stream surrounded by diluent/sheath solution. The illuminated volume is bounded in the two dimensions normal to the flow axis by the hydrodynamically focused cell stream, and in the dimension parallel to the flow axis by the vertical beam waist of the laser beam which is about 17 microns. When doing this test, the sample flow rate is about 2.5 microliters per second, and the corresponding illuminated sensing volume of the WBC and NRBC cells approximates an elliptical cylinder with dimension of about 80 x 5 x 17 microns. The 17 micron dimension is measured along the axis of the cylinder. - At this point and as shown in
Figure 1 , the presence of a cell is detected by acompound photodiode 102 detecting axial light loss (ALL) and intermediate angle scatter (IAS),photomultiplier tube 104 which detects red fluorescence, and a unique triple trigger circuit, shown inFigure 2 , in the three dimensional feature space of ALL, IAS, and FL3 (red fluorescence). The triple trigger circuit qualifies signals for digitization using AND/OR logic. A qualified signal must be greater than the IAS trigger, while at the same time it must be greater than either the ALL trigger or the FL3 trigger. The combination of this unique triggering circuit, and the lysing properties which include a balanced fixative, allow the exposed NRBC and damaged WBC nuclei to be rapidly stained, and clearly and non ambiguously counted and excluded from the WBC differential cell count without the usual interference from background, both fluorescent and non-fluorescent, such as DNA fragments, RBC stroma, and platelets. - One or more detectors are preferably placed in the forward light path for measuring forward intermediate angle scattering (IAS) and either small angle forward scattering (SAS) or axial light loss (ALL; also known as forward extinction). ALL is generally the decrease in light energy due to a cell passing in front of a laser beam and being detected by a photodiode. The light loss is generally due to scattering and defined as the decrease in light energy reaching a detector in the path of a laser beam due to the passage of a cell through that beam (generally ALL is detected at an angle of from about 0° to about 1°.) Small angle forward scatter (SAS), in contrast, is light energy that reaches a detector outside the incident laser beam (but within a narrow angle of from about 1° to 3°) due to scattering from a cell passing through the beam. A beam stop is generally provided to keep the laser beam from getting into the detector. ALL measuring systems collect light within the incident cone of laser illumination, while small angle scatter systems collect light outside this cone. In ALL measuring systems, the signal of interest is a negative signal subtracted from the steady state laser signal, whereas in small angle forward scatter measurement the signal is a small positive signal imposed on a very low background light level. Intermediate angle forward scattering (IAS) is similar to small angle forward scattering, except the light is scattered at a larger angle from the incident laser beam. More specifically, IAS relates to light scattered in a ring between about 3° and 10° away from the incident or center line of a laser beam. In a preferred embodiment, ALL is collected in the angles less than about 0.3° horizontally and less than about 1.2° vertically from the laser axis, and IAS is collected at angles between about 3° and 10° from the laser axis.
- When cells, thus triggered, pass through the aforementioned illuminated volume, pulses are generated at
detectors flowcell 100 is 10 seconds. At the flow rate and dilution ratio described above, with a normal patient WBC count of 7000 cells per microliter of blood volume, the resulting event count rate would be 5000. In low count samples, this counting time can be automatically extended in order to improve the statistics of the measurement. At the conclusion of the measurement time, the sample stream is piped to waste, and probe is cleaned and dried and prepared to process a subsequent sample. - Algorithms are then applied to the list mode data of the aforementioned feature space of ALL, IAS, FL3, PSS, and DSS, and the following cell types are enumerated and/or flagged within less than 30 seconds of processing time:
CELL TYPES ENUMERATED PERCENTAGES FLAGGED OR ENUMERATED White Cell concentration (WBC) Neutrophil concentration %N of WBC Lymphocyte concentration %LYMPH of WBC Monocyte concentration %MONO of WBC Eosinophil concentration % EOS of WBC Basophil concentration %BASO of WBC NRBC %NRBC of WBC Band concentration (BAND) Blast concentration (BLST) Immature gran. conc. (IG) Variant-lymph conc. (VARL) Damaged WBC %WBC Damaged/Count - ALL and IAS signals are detected and collected for the WBC/Diff analysis and FL3 signals from stained NRBC nuclei are collected for NRBC analysis, as will be described below. The triple trigger circuit, shown in
Figure 2 , qualifies these signals for digitization using an AND/OR logic. To be qualified a signal must be greater than the IAS trigger, while at the same time it must be greater than either the ALL trigger or the FL3 trigger. - The various components and generated or utilized signals identified in
Figure 2 correspond to the following labels: - 300 - ALL Voltage Comparator
- 302 - ALL Signal
- 304 - ALL Threshold Voltage (Vth1)
- 306 - ALL Voltage Comparator Output
- 310 - FL3 Signal
- 312 - FL3 Threshold Voltage (Vth2)
- 314 - FL3 Voltage Comparator
- 316 - FL3 Voltage Comparator Output
- 318 - IAS Signal
- 320 - IAS Threshold Voltage (Vth3)
- 322 - IAS Voltage Comparator
- 324 - IAS Voltage Comparator Output
- 326 - OR Gate
- 328 - OR Gate Output
- 330 - AND Gate
- 332 - Valid Trigger Output
- Real time signals from their respective channels are present at the inputs of the voltage comparators.
Voltage comparators - The threshold voltages are independent voltages which are determined by system parameters.
- The outputs of
comparators gate 326 to give resultant ORgate output 328. The OR gate functions by comparing its inputs. The output will be high if either, or both, inputs are high. - The output of the
OR gate 328 and the output ofcomparators gate 330. The AND gate functions by comparing its inputs to derive itsoutput 332 which is also the valid trigger output. The output will be high only if both inputs are high. - The valid trigger output 332) will only be high if the
IAS signal 318 is greater than itsthreshold voltage 320, and either or both, the ALLsignal 302 is greater than itsthreshold voltage 304 or the FL3 signal 310 is greater than itsthreshold voltage 312. - ALL and IAS are collected for WBC/Diff analysis and Fluorescence (FL3) signals are collected for NRBC and damaged WBC analysis. A triple threshold circuit or qualification routine qualifies signals for digitization using AND/OR logic. According to this unique routine or circuit, to be qualified a signal must be greater than the IAS threshold, while at the same time it must be greater than either the ALL threshold or the FL3 threshold. Using this triggering circuit, the NRBC's form a unique cluster in the aforementioned three dimensional space, see
Figures 14 and15 , which can be easily counted during the Optical WBC Differential analysis, and exclude non ambiguously from the WBC count. Thus, a count of NRBC per 100 WBC, and a total NRBC per µL of patient blood is reported. Consequently, NRBC are subtracted from total WBC counts permitting accurate total WBC and Differential analysis in the presence of NRBC in a blood sample. The signals that are above both the ALL and FL3 triggers are identified as damaged WBC's. The damaged WBC subpopulation is identified in the same manner as in the intact WBC differential analysis. Background noise, both fluorescent and non-fluorescent, from DNA fragments, RBC stroma, platelets, Howell-Jolly Bodies, Basophilic Stippling, RNA from lysed reticulocytes and DNA from WBC and Megakaryocytic fragments are substantially eliminated. Stained NRBC nuclei are separated from the various background noise signals via the disclosed triple-triggering process (on ALL, IAS and FL3) and only the FL3+ signals from NRBC nuclei above the FL3 threshold on the ALL vs FL3 dot plot are counted as NRBC. - In
Figures 3 through 10 the cell population areas identified by the below listed numbers, correspond to the following cell types:202 = Lymphocytes 208 = Origin Noise 204 = Monocytes 210 = NRBC 206 = Granulocytes 212 = Stroma - Another technical advantage of the disclosed system is that it requires much lower concentration of the dye to effectively and rapidly stain NRBC for accurate detection and counting because of complete lysis of the cytoplasm of NRBC making their nuclei more accessible to the stain. This condition permits high signal to noise (S/N) ratio, greater than 100, in NRBC detection. The concentration of a vital dye required this system to rapidly perform the simultaneous analysis of WBC/Diff/NRBC/Damaged WBC is only 1 to 2 µg/ml which is at least 50 fold less than that in the previous art.
- The disclosed method is unique in that simultaneous analysis of WBC/Diff/NRBC/Damaged WBC can be carried out automatically, accurately, and rapidly without interference from other cellular debris. Further advantage of the present invention is that it has a very high clinical value in that the method can be incorporated into a clinical hematology analyzer which routinely calibrate for WBC, RBC, and Platelet counts. Such a system is capable of producing an accurate WBC/Diff/NRBC/Damaged WBC data (% as well as absolute counts) in clinical blood samples. This has not previously been possible.
- An EDTA-anti-coagulated fresh normal blood was run on an experimental unit of the automated clinical hematology analyzer described above and disclosed and described in
U.S. Application Serial No. 08/283,379 US 5939326 . While the present invention was incorporated into the aforementioned analyzer it was not always utilized in all of the following examples. Twenty five (25) micro-liters of the blood sample were mixed on-line with 675 micro-liters of the isotonic multipurpose reagent (pH 6.5, 260 mOsm/L) disclosed inPCT Application Serial Number WO94/18828 - For the purposes of these experiments the multipurpose reagent system is comprised of about 95 mM ammonium chloride (5g/l), about 0.075% by volume of formaldehyde, from about 10 mM to about 20 mM acetate buffer, about 10 mM potassium bicarbonate, and about 0.01% by weight volume (i.e., grams per 100 ml) of saponin. The pH of the reagent system is adjusted to a range of from about 6.2 to about 7.0 and the osmolality of the reagent system is from about 215 to about 270 mOsm/L.
- The reagent is pre-warmed at 42° C ± 3° in the instrument's heated mixing chamber, where the sample and reagent are mixed and incubated for 11 seconds. This mixture was then transported to the flow cell (which takes 8 and 1/2 seconds) for the WBC/Diff/NRHC analysis. The optical configuration of the system is presented in
Figure 1 . The analysis was performed without implementing the triple triggering circuit; using only ALL and FL3 dual triggers as is common in the art. See all Figures fromFigure 3A through 10C . - The upper dot plot display of
Figure 11A maps the light scatter signals (ALL vs. IAS) obtained from the sample and shows 3 distinct populations of WBC. The Basophil cluster is not apparent here because normal bloods do not contain many Basophils. The Eosinophil cluster is not shown here since Eosinophils are separated via a DSS vs, PSS dot plot (not shown) and the middle cytogram ofFigure 11B shows a dot plot display of ALL and FL3 signals as labeled. Note that normal blood does not contain any NRBCs. The lower bottom FL3+ clusters,Figures 11B and 11C , are apparently cell debris containing RNA or DNA, as described earlier. -
Figures 12A and 12B , top and bottom cytograms respectively, are dot plot displays of an abnormal blood with NRBC (47 NRBC/100 WBC) analyzed as described in Example 1 utilizing a standard detection method. The cluster right below the lymphocyte population in the top cytogram belongs to NRBC and the small cluster at the bottom, left corner belongs to the origin noise which include RBC stroma (reticula, Howell Jolly Bodies and etc.), platelets and WBC debris.Figure 12B shows that the origin noise cluster of this sample stained with the nuclear dye brightly, follows the stained NRBC cluster very closely in FL3 channel, thereby making it impossible to set the FL3 trigger to count NRBC accurately. - The cytograms for
Figures 13A and 13B are dot plot displays of an abnormal blood with NRBC (51 NRBC/100 WBC) analyzed as described in Example 1 utilizing a standard detection method. The cluster right below the lymphocyte population in the top display,Figure 13A belongs to NRBC. An increased FL3+ origin noise of this sample can be seen. The noise cluster is located very close to the NRBC cluster in the FL3 channel. Thus, the FL3 noise is interfering with the position of the FL3 trigger. When the FL3 trigger was set high enough to eliminate all the origin noise, a part of the NRBC population was also lost below the FL3 trigger as shown inFigure 13B . - The disclosed triple trigger circuit (ALL/IAS/FL3),
Figure 2 , of the present invention was incorporated into the same instrument used in EXAMPLES 1 through 3 and utilized during this procedure. - A EDTA, anti-coagulated clinical sample which contained 56 NRBC/100 WBC was processed as described in Example 1. The results are presented in
Figures 14A through 14C . Note the disappearance of the FL3+ noise cluster. The noise signals are blocked by the added IAS trigger. The fluorescent origin noise from this abnormal blood is no longer visible above the FL3 trigger, although the trigger is set low enough to recover the total NRBC population. (Note the circular shape of the NRBC cluster.) -
Figures 15A and 15B show the dot plot displays of the NRBC distribution of another clinical whole blood sample which contained 140 NRBC/100 WBC, also post triple trigger (ALL, FL3 and IAS) implementation. The origin noise is not visible and the total NRBC population is recovered above the FL3 trigger. Note the heavy density of the NRBC cluster due to the very high concentration of NRBC in this sample. - Linearity samples were prepared by adding various concentrations of unfixed chicken erythrocytes to a EDTA, anti-coagulated normal human blood. The samples were processed as described in Example 1 utilizing the triple trigger detection method of the present invention. The cytoplasm of chicken erythrocytes lyse in the method of present invention leaving only naked nuclei (CEN). The CEN stained very rapidly with the vital nuclear stain (PI) in the diluent and become fluorescent (FL3). The FL3+ CEN are counted as NRBC and reported as number of NRBC/100 WBC and as absolute counts per µL of the whole blood sample in the method of the present invention. The results are presented in
Figures 16A and 16B . The linearity plots of NRBC/100 WBC and NRBC in absolute numbers in the figure demonstrate that the method of the current invention generate a linear NRBC counts. -
Figure 17 shows the correlation plot of NRBC counts (ordinate) of 85 clinical samples obtained by the method of the current invention. The results were correlated to that of reference manual microscopic counts (abscissa). For manual NRBC counts, 200 cell WBC differential was performed on each patients' blood smears stained with Wright-Giemsa and NRBC counts present in the same region were divided by 2 to report NRBC/100 WBC. Correlation coefficient (R) is 0.973 (R2 = 0.946), the slope is 0.86 and Y-intercept is 1.32. - Twenty five (25) micro-liters of the blood sample was mixed and incubated on-line at 42° C for 11 seconds with 675 micro-liters of the multipurpose reagent of Example 1 (pH 7.0, 260 mOsm/L) in to the heated vortexer of the hematology analyzer disclosed and described in
U.S. Application Serial No. 08/283,379 US 5939326 . This mixture was then automatically transported to the flow cell and analyzed (approximately 8 and 1/2 seconds for WBC/Diff/NRBC analysis.)Figures 18A - 18F are the cytograms of the blood. The top left cytogram,Figure 18A , of the light scatter signals (ALL vs IAS) shows 3 distinct populations of WBC (neutrophils, monocytes and lymphocytes. Basophil cluster is not apparent here because a normal blood contains only about 1% or less basophils. Eosinophils are separated on the top right DSS vs PSS cytogram,Figure 18B . The middle left cytogram,Figure 18C , is a display of ALL and FL3 signals. Note that normal blood does not contain any NRBC and that there are only few damaged cells to the right of the vertical line inFigure 18C (FL3+ signals). - An abnormal blood with NRBC ( 4.99 k/µL or 46.6 NRBC/100 WBC) was analyzed as described in Example 8 and the results are presented in
Figures 19A - 19F . The cluster right below the lymphocyte population in the top left cytogram (ALL vs IAS),Figure 19A , belongs to NRBC. The bottom right cytogram (ALL vs FL3+),Figure 19F , reveals that the stripped NRBC nuclei are stained brightly and pulled above the FL3+ trigger and counted. The NRBC counts are then subtracted from the total WBC counts before WBC differential analysis, producing an accurate WBC/Diff results. - A clinical sample (CLL) which contains damaged lymphocytes was analyzed as described in Example 8 and the results are presented in
Figures 20A - 20F . The cluster to the immediate lower right of the lymphocyte population in the top cytogram (ALL vs IAS),Figure 20A , belongs to damaged lymphocytes.Figure 20C (ALL vs FL3+) shows that almost one-half of the lymphocyte population stained with the nucleic acid dye (PI). Microscopic smear review of the sample revealed that about 50% of the lymphocyte population was either smudged or had lost their cytoplasmic membrane (naked nuclei). The damaged lymphocytes are distinguished from NRBC's along the ALL axis since their light scatter signals are higher than that of the stripped NRBC nuclei. - A normal blood sample aged for 35 hours under refrigeration was analyzed as described in Example 8 and the results are presented in
Figures 21A - 21F . The sample was processed as described in Example 8. The FL3+ signals shown on the ALL vs FL3 cytogram to the right of granulocytes and lymphocytes,Figure 19F , represent damaged granulocytes and lymphocytes respectively. - A manipulated sample in which hard-fixed human WBC's and platelets were mixed with human RBC fraction and re-suspended in a human plasma. This mixture was analyzed as in Example 8 and the results are presented in
Figures 22A - 22F . Unlike WBC's preserved by the multi-purpose reagent system disclosed herein, the ALL vs FL3 cytogram,Figure 22C , of the hard-fixed cells reveal that all the WBC's are intensely stained. The crosslinking reagent makes the cell membrane very porous permitting the nucleic acid dye to penetrate into the cells. Subpopulations of WBC's are identified via multi-dimensional light scatter analysis as described inU.S. Application Serial No. 08/283,379 US 5939326 . - Fifty µL each of two normal blood samples were mixed with 10 µL of Mab solution containing anti-CD3FITC and anti-CD4-PE in separate test tubes. A second 50 µL aliquot of the normal blood samples were mixed with 10 µL of Mab solution containing anti-CD3FITC and anti-CD8-PE in two additional and separate test tubes. A negative control was prepared without adding any Mab to a test tube. The mixtures were incubated at room temperature for 15 min before adding 1.7 ml of the multipurpose reagent of Example 1 without any nucleic acid dye, prewarmed at 42° C to each tube. The samples were presented to a FACScan® instrument (Becton, Dickinson & Co.) and the signal acquisition was begun exactly at 11 seconds after the addition of the multipurpose reagent. The results are presented in
Figures 23A - 23F , and Table 1. The top cytograms,Figure 23A & B represent the negative control of the normal blood, the left cytogram,Figure 23A shows forward scatter (FCS) vs 90° side scatter showing the lymphocyte gating; the right cytogram,Figure 23B shows the two dimensional display of FL1 vs FL2; the middle cytograms,Figure 23C & D represent the same sample but reacted with anti-CD4 Mab; the bottom cytograms,Figures 23E & F represent the same blood but reacted with anti-CD8 Mab. - Fifty µL of two normal blood samples were mixed with 10 µL of Mab solution containing anti-CD3FITC and anti-CD4-PE in a test tube. To a second tube, 50 µL of a normal blood sample was mixed with 10 µL of Mab solution containing anti-CD3FITC and anti-CD8-PE in a test tube. A negative control was prepared without adding any Mab. The mixture was incubated at room temperature for 15 min before adding 1.7 ml of the multipurpose reagent described above with PI (0.2 µg/ml), prewarmed at 42° C. The sample were presented to a FACScan® instrument (Becton, Dickinson & Co.) and the signal acquisition was begun exactly at 11 seconds after the addition of the multipurpose reagent. The results are presented in
Figures 24A - 24F and Table 1. The top cytograms,Figure 24A & B , represent a negative control of a normal blood, the left cytogram,Figure 24A shows forward scatter (FCS) vs 90° side scatter showing the lymphocyte gating; the right cytogram,Figure 24B , is the two dimensional display of FL1 vs FL2; the middle cytograms,Figures 24 C & D , represent the same sample but reacted with anti-CD4 Mab; and the bottom cytograms,Figures 24E & F , represent the same blood but reacted with anti-CD8 Mab.Table 1 Sample ID Quadrant Position Without PI
(% Gated)With PI
(% Gated)Neg. Control L 0.00 0.00 C1855 UR 0.00 0.00 LL 100.00 100.00 LR 0.00 0.00 CD3FITC/CD4PE L 2.20 2.96 C1855 UR (Helper T) 24.62 26.65 LL 34.73 33.94 LR 38.46 36.45 CD3FITC/CD8PE L 3.16 3.34 C1855 UR (Suppressor T) 34.12 32.09 LL 33.11 32.73 LR 29.60 31.84 Neg Control L 0.00 0.11 C1856 UR 0.00 0.00 LL 100.00 99.89 LR 0.00 0.00 CD3FITC/CD4PE L 0.97 1.68 C1856 UR (Helper T) 47.85 44.47 LL 32.72 35.54 LR 18.47 18.30 CD3FITC/CD8PE L 8.31 9.29 C1856 UR (Suppressor T) 15.61 16.98 LL 27.65 26.64 LR 48.43 47.09
Claims (10)
- A method of differentiating nucleated red blood cells NRBC, damaged white blood cells and white blood cells WBC in a sample by flow cytometry which comprises:(a) mixing an aliquot of a blood sample with a reagent system comprising a red blood cell RBC lysing component and a vital nuclear stain component to stain the nuclei of NRBC and any damaged WBC, wherein the lysing component lyses RBC while minimizing damage to WBC cellular membranes;(b) passing the mixed aliquot, substantially a cell at a time, through an area of optical stimulation;(c) obtaining one signal for each of the parameters of fluorescence FL and scattered light at both a first and second range of scatter angles;(d) qualifying the signals obtained by subjecting the signals to a logic wherein to be qualified the signal for scattered light at a second range of scatter angles must be greater than a second scatter signal threshold, while at the same time the signal for scattered light at a first range of scatter angles must be greater than a first scatter signal threshold or the FL signal must be greater than a FL threshold wherein the thresholds are set to eliminate spurious FL noise signals and include NRBC population signals in the signals obtained;(e) constructing a three-dimensional plot of intensity signals of FL and scattered light from the obtained and qualified signals; and(f) differentiating WBC, NRBC, damaged WBC and a WBC subclass differential WBC/Diff from the constructed three-dimensional plot and the qualified signals and determining the number of cells of each class and subclass.
- The method of claim 1 wherein the first range of scatter angles is from about 0° to about 1°.
- The method of claim1 wherein the parameter of scattered light at a first range of scatter angles is axial light loss ALL.
- The method of claim 4 wherein the ALL is obtained at an angle from about 0° to about 1°.
- The method of claim 1 wherein one obtained signal parameter comprises axial light loss ALL.
- The method of claim 1 wherein one obtained scatter parameter is forward angle scatter FSC.
- A method according to claim 1, wherein said first range of scatter angles comprise angles from about 0° to about 1° and said second range of angles comprise angles from about 3°- 10°.
- The method of claim 1 wherein the nuclear stain is selected from the group consisting of propidium iodide PI, ethidium bromide EBr, ethidium homodimer- 1EthD-1, ethidium homodimer-2 EthD-2 and diethylene triamine DTA.
- The method of claim 1 wherein the determined NRBC count is subtracted from the determined WBC counts before determining the WBC/Diff.
- The method of claim 1 further comprising the step of adding fluorescently labeled antibodies to the sample and incubating the antibody/sample mixture for a time sufficient for the antibodies to bind with their binding partner surface antigen prior to step (a).
Applications Claiming Priority (3)
| Application Number | Priority Date | Filing Date | Title |
|---|---|---|---|
| US57442495A | 1995-12-15 | 1995-12-15 | |
| PCT/US1996/020466 WO1997021994A1 (en) | 1995-12-15 | 1996-12-13 | Method for simultaneous analysis of cell viability, nucleated red blood cells and white blood cell differential |
| US574424 | 2000-05-19 |
Publications (2)
| Publication Number | Publication Date |
|---|---|
| EP0866960A1 EP0866960A1 (en) | 1998-09-30 |
| EP0866960B1 true EP0866960B1 (en) | 2010-06-30 |
Family
ID=24296069
Family Applications (1)
| Application Number | Title | Priority Date | Filing Date |
|---|---|---|---|
| EP96945254A Expired - Lifetime EP0866960B1 (en) | 1995-12-15 | 1996-12-13 | Method for simultaneous analysis of cell viability, nucleated red blood cells and white blood cell differential |
Country Status (7)
| Country | Link |
|---|---|
| EP (1) | EP0866960B1 (en) |
| JP (1) | JP4279900B2 (en) |
| AT (1) | ATE472725T1 (en) |
| CA (1) | CA2240158C (en) |
| DE (1) | DE69638209D1 (en) |
| ES (1) | ES2347110T3 (en) |
| WO (1) | WO1997021994A1 (en) |
Families Citing this family (10)
| Publication number | Priority date | Publication date | Assignee | Title |
|---|---|---|---|---|
| US5917584A (en) * | 1997-11-21 | 1999-06-29 | Coulter International Corp. | Method for differentiation of nucleated red blood cells |
| JP4564566B2 (en) | 2009-02-13 | 2010-10-20 | 三井造船株式会社 | Fluorescence detection apparatus and fluorescence detection method |
| JP4564567B2 (en) | 2009-02-13 | 2010-10-20 | 三井造船株式会社 | Fluorescence detection apparatus and fluorescence detection method |
| CA2759392A1 (en) * | 2009-04-27 | 2010-11-04 | Abbott Laboratories | Method for discriminating red blood cells from white blood cells by using forward scattering from a laser in an automated hematology analyzer |
| JP6104233B2 (en) * | 2011-05-04 | 2017-03-29 | アボット・ラボラトリーズAbbott Laboratories | Leukocyte analysis system and method |
| US9091625B2 (en) * | 2011-05-04 | 2015-07-28 | Abbott Laboratories | Basophil analysis system and method |
| EP2705136B1 (en) | 2011-05-04 | 2021-10-27 | Abbott Laboratories | Nucleated red blood cell analysis method and automated hematology analyzer |
| WO2014099629A1 (en) * | 2012-12-21 | 2014-06-26 | The Regents Of The University Of California | Rapid blood testing platform for use with mobile electronic devices |
| CN105699635A (en) * | 2016-01-28 | 2016-06-22 | 深圳市帝迈生物技术有限公司 | Simple and reliable hemocyte five-class analysis method, system and device |
| CN111602046B (en) * | 2018-04-28 | 2024-01-09 | 深圳迈瑞生物医疗电子股份有限公司 | Blood analyzer and analysis method |
Family Cites Families (5)
| Publication number | Priority date | Publication date | Assignee | Title |
|---|---|---|---|---|
| US5057413A (en) * | 1988-06-13 | 1991-10-15 | Becton, Dickinson And Company | Method for discriminating between intact and damaged cells in a sample |
| US5047321A (en) * | 1988-06-15 | 1991-09-10 | Becton Dickinson & Co. | Method for analysis of cellular components of a fluid |
| ES2151494T3 (en) | 1992-03-05 | 2001-01-01 | Becton Dickinson Co | METHOD FOR THE PREPARATION AND ANALYSIS OF LEUKOCYTES IN COMPLETE BLOOD THROUGH THE USE OF FLOW CYTOMETRY. |
| CA2156752C (en) * | 1993-02-25 | 1999-01-05 | Young Ran Kim | Multipurpose reagent system for rapid lysis of whole blood samples |
| US5559037A (en) * | 1994-12-15 | 1996-09-24 | Abbott Laboratories | Method for rapid and simultaneous analysis of nucleated red blood cells |
-
1996
- 1996-12-13 JP JP52228797A patent/JP4279900B2/en not_active Expired - Lifetime
- 1996-12-13 AT AT96945254T patent/ATE472725T1/en not_active IP Right Cessation
- 1996-12-13 WO PCT/US1996/020466 patent/WO1997021994A1/en active Application Filing
- 1996-12-13 EP EP96945254A patent/EP0866960B1/en not_active Expired - Lifetime
- 1996-12-13 CA CA002240158A patent/CA2240158C/en not_active Expired - Fee Related
- 1996-12-13 DE DE69638209T patent/DE69638209D1/en not_active Expired - Lifetime
- 1996-12-13 ES ES96945254T patent/ES2347110T3/en not_active Expired - Lifetime
Also Published As
| Publication number | Publication date |
|---|---|
| EP0866960A1 (en) | 1998-09-30 |
| JP4279900B2 (en) | 2009-06-17 |
| ATE472725T1 (en) | 2010-07-15 |
| JP2000501838A (en) | 2000-02-15 |
| CA2240158A1 (en) | 1997-06-19 |
| WO1997021994A1 (en) | 1997-06-19 |
| ES2347110T3 (en) | 2010-10-25 |
| CA2240158C (en) | 2004-11-30 |
| DE69638209D1 (en) | 2010-08-12 |
Similar Documents
| Publication | Publication Date | Title |
|---|---|---|
| US5879900A (en) | Method for simultaneous analysis of cell viability, nucleated red blood cells and white blood cell differentials | |
| EP0797762B1 (en) | Method for rapid and simultaneous analysis of nucleated red blood cells | |
| US7625712B2 (en) | Method for a fully automated monoclonal antibody-based extended differential | |
| US6197593B1 (en) | Method for enumerating blood cells | |
| EP0347039B1 (en) | Method for discriminating between intact and damaged cells in a sample | |
| EP1250585B1 (en) | Method and apparatus for analyzing cells in a whole blood sample | |
| US5917584A (en) | Method for differentiation of nucleated red blood cells | |
| US7674598B2 (en) | Method for a fully automated monoclonal antibody-based extended differential | |
| CA1309328C (en) | Method of classifying leukocytes by flow cytometry and reagents used in the method | |
| US5776709A (en) | Method for preparation and analysis of leukocytes in whole blood | |
| US5874311A (en) | Method for differentiation of reticulocytes in blood | |
| EP0866960B1 (en) | Method for simultaneous analysis of cell viability, nucleated red blood cells and white blood cell differential | |
| WO1997021994A9 (en) | Method for simultaneous analysis of cell viability, nucleated red blood cells and white blood cell differential | |
| EP0259833B1 (en) | Reagent and method for classifying leukocytes by flow cytometry | |
| Ronot et al. | Assessment of cell viability in mammalian cell lines |
Legal Events
| Date | Code | Title | Description |
|---|---|---|---|
| PUAI | Public reference made under article 153(3) epc to a published international application that has entered the european phase |
Free format text: ORIGINAL CODE: 0009012 |
|
| 17P | Request for examination filed |
Effective date: 19980529 |
|
| AK | Designated contracting states |
Kind code of ref document: A1 Designated state(s): AT BE CH DE ES FR GB IT LI NL |
|
| 17Q | First examination report despatched |
Effective date: 20071214 |
|
| GRAP | Despatch of communication of intention to grant a patent |
Free format text: ORIGINAL CODE: EPIDOSNIGR1 |
|
| GRAS | Grant fee paid |
Free format text: ORIGINAL CODE: EPIDOSNIGR3 |
|
| GRAA | (expected) grant |
Free format text: ORIGINAL CODE: 0009210 |
|
| AK | Designated contracting states |
Kind code of ref document: B1 Designated state(s): AT BE CH DE ES FR GB IT LI NL |
|
| REG | Reference to a national code |
Ref country code: GB Ref legal event code: FG4D Ref country code: CH Ref legal event code: EP |
|
| REF | Corresponds to: |
Ref document number: 69638209 Country of ref document: DE Date of ref document: 20100812 Kind code of ref document: P |
|
| REG | Reference to a national code |
Ref country code: ES Ref legal event code: FG2A Ref document number: 2347110 Country of ref document: ES Kind code of ref document: T3 |
|
| REG | Reference to a national code |
Ref country code: NL Ref legal event code: VDEP Effective date: 20100630 |
|
| PG25 | Lapsed in a contracting state [announced via postgrant information from national office to epo] |
Ref country code: AT Free format text: LAPSE BECAUSE OF FAILURE TO SUBMIT A TRANSLATION OF THE DESCRIPTION OR TO PAY THE FEE WITHIN THE PRESCRIBED TIME-LIMIT Effective date: 20100630 |
|
| PG25 | Lapsed in a contracting state [announced via postgrant information from national office to epo] |
Ref country code: NL Free format text: LAPSE BECAUSE OF FAILURE TO SUBMIT A TRANSLATION OF THE DESCRIPTION OR TO PAY THE FEE WITHIN THE PRESCRIBED TIME-LIMIT Effective date: 20100630 |
|
| PG25 | Lapsed in a contracting state [announced via postgrant information from national office to epo] |
Ref country code: BE Free format text: LAPSE BECAUSE OF FAILURE TO SUBMIT A TRANSLATION OF THE DESCRIPTION OR TO PAY THE FEE WITHIN THE PRESCRIBED TIME-LIMIT Effective date: 20100630 |
|
| PLBE | No opposition filed within time limit |
Free format text: ORIGINAL CODE: 0009261 |
|
| STAA | Information on the status of an ep patent application or granted ep patent |
Free format text: STATUS: NO OPPOSITION FILED WITHIN TIME LIMIT |
|
| 26N | No opposition filed |
Effective date: 20110331 |
|
| REG | Reference to a national code |
Ref country code: DE Ref legal event code: R097 Ref document number: 69638209 Country of ref document: DE Effective date: 20110330 |
|
| REG | Reference to a national code |
Ref country code: CH Ref legal event code: PL |
|
| PG25 | Lapsed in a contracting state [announced via postgrant information from national office to epo] |
Ref country code: CH Free format text: LAPSE BECAUSE OF NON-PAYMENT OF DUE FEES Effective date: 20101231 Ref country code: LI Free format text: LAPSE BECAUSE OF NON-PAYMENT OF DUE FEES Effective date: 20101231 |
|
| PGFP | Annual fee paid to national office [announced via postgrant information from national office to epo] |
Ref country code: GB Payment date: 20141124 Year of fee payment: 19 Ref country code: ES Payment date: 20141205 Year of fee payment: 19 |
|
| PGFP | Annual fee paid to national office [announced via postgrant information from national office to epo] |
Ref country code: IT Payment date: 20141215 Year of fee payment: 19 |
|
| REG | Reference to a national code |
Ref country code: FR Ref legal event code: PLFP Year of fee payment: 20 |
|
| PGFP | Annual fee paid to national office [announced via postgrant information from national office to epo] |
Ref country code: FR Payment date: 20151124 Year of fee payment: 20 |
|
| PGFP | Annual fee paid to national office [announced via postgrant information from national office to epo] |
Ref country code: DE Payment date: 20151230 Year of fee payment: 20 |
|
| GBPC | Gb: european patent ceased through non-payment of renewal fee |
Effective date: 20151213 |
|
| PG25 | Lapsed in a contracting state [announced via postgrant information from national office to epo] |
Ref country code: GB Free format text: LAPSE BECAUSE OF NON-PAYMENT OF DUE FEES Effective date: 20151213 |
|
| REG | Reference to a national code |
Ref country code: DE Ref legal event code: R071 Ref document number: 69638209 Country of ref document: DE |
|
| PG25 | Lapsed in a contracting state [announced via postgrant information from national office to epo] |
Ref country code: IT Free format text: LAPSE BECAUSE OF NON-PAYMENT OF DUE FEES Effective date: 20151213 |
|
| REG | Reference to a national code |
Ref country code: ES Ref legal event code: FD2A Effective date: 20170126 |
|
| PG25 | Lapsed in a contracting state [announced via postgrant information from national office to epo] |
Ref country code: ES Free format text: LAPSE BECAUSE OF NON-PAYMENT OF DUE FEES Effective date: 20151214 |