JP3986752B2 - Exhaust gas measurement and monitoring system - Google Patents
Exhaust gas measurement and monitoring system Download PDFInfo
- Publication number
- JP3986752B2 JP3986752B2 JP2000387308A JP2000387308A JP3986752B2 JP 3986752 B2 JP3986752 B2 JP 3986752B2 JP 2000387308 A JP2000387308 A JP 2000387308A JP 2000387308 A JP2000387308 A JP 2000387308A JP 3986752 B2 JP3986752 B2 JP 3986752B2
- Authority
- JP
- Japan
- Prior art keywords
- exhaust gas
- distance
- reference space
- mahalanobis
- data
- Prior art date
- Legal status (The legal status is an assumption and is not a legal conclusion. Google has not performed a legal analysis and makes no representation as to the accuracy of the status listed.)
- Expired - Lifetime
Links
Images


Description
【0001】
【発明の属する技術分野】
本発明は、一般廃棄物や産業廃棄物を焼却する焼却炉から排出される排ガスの計測と監視を行う排ガス計測・監視システムに関する。
【0002】
【従来の技術】
ごみ焼却場で廃棄物を焼却すると、その排ガス中に猛毒のダイオキシンが発生し、環境汚染を引き起こすため、近年深刻な社会問題となっている。ここで、ダイオキシンとは75種類の異性体を持つポリ塩化ジベンゾパラジオキシン(PCDDs)および135種類の異性体を持つポリ塩化ジベンゾフラン(PCDFs)の総称であり、より広義には、コプラナポリ塩化ビフェニル(Coplanar PCBs)を含めることもある。以後、ダイオキシンおよびそれに関した化合物群を総称してダイオキシン類と略記する。
【0003】
排ガスからダイオキシン類を計測する手法としては、近年種々の形態が試みられており、例えば、特開平10−267245号公報に開示されているようなものがある。特開平10−267245号公報には、クロロベンゼン・クロロフェノール類の濃度を測定する排ガス分析計やCO濃度計等から得られる計測値、炉出口温度、二次燃焼空気量などの複数のパラメータを基に、二次燃焼空気量を調節して、排ガス中のダイオキシン類の生成を抑制することが開示されている。
【0004】
【発明が解決しようとする課題】
従来の技術においては、炉の出口からサンプリングした各計測値等の時々刻々と変化するパラメータを固有の演算式に則って、焼却炉の制御を行うものである。つまり、固有の演算式を用いるため、制御の方法自体は変化することが無い。また、各パラメータの相関についても、予め定めた固有の相関関係に基づいており、変化することはない。
【0005】
しかしながら、実際の装置においては、焼却炉において燃焼を始めてから排ガスが煙突から大気中に排出されるまで、排ガスは多くの温度の異なる空間を経ると共に、排ガス中における多くの化学反応プロセスを経て排出される。また、プロセス条件が一定であっても時系列的に排ガスの性状が変化することもある。このような複雑な過程を経る排ガスは、様々な性状の変化を有し、計測装置から得られる各パラメータ同士もその相関関係は必ずしも一様ではなく、動的に変化している。したがって、ダイオキシン類を低減するためには正確なパラメータの相関関係の動向を分析し、プロセス条件を変更、最適化してやらねばならない。
【0006】
従来の技術では、制御を行うための演算方法が一定であり、この様な動的な変化に追従していくことが難しい。
【0007】
本発明の目的は、上述の問題点に鑑みてなされたものであって、廃棄物を焼却する焼却炉から排出される排ガスの計測・監視を行うシステムにおいて、プロセス条件の変更・最適化のための指標を開示し、有害物質類の排出の低減化を図ることである。
【0008】
【課題を解決するための手段】
前記課題は、廃棄物を焼却する焼却炉から排出される排ガスの計測と監視を行う場合に、排ガスの成分を複数項目にわたって測定し、前記各項目の成分に基づいて基準となる数値を作成し、以降この基準数値を基に排ガスの監視を行うことによって達成される。
【0009】
具体例を下記する。
(1)システム構成
前記課題を達成するために、具体例では、
排ガス中のダイオキシン類の前駆体であるクロロフェノール類、クロロベンゼン類や未燃物質の指標である炭化水素類を大気圧から低真空域でイオン化し、そのイオンを質量分析することにより定量化して排ガス中のダイオキシン類やクロロフェノール類、クロロベンゼン類の濃度や炭化水素類の濃度を連続的に求める質量分析計と、
前記質量分析計において、前記ダイオキシン類やクロロフェノール類、クロロベンゼン類のイオンと同時に得られる他の成分(塩化水パラメータ素、臭化水素、硫酸、水分、酸素、一酸化炭素等)を前記質量分析計のデータ処理部やその上位の管理機器部にて収集し、
更には、前記煙道から前記質量分析計までの測定ガス(排ガス)を輸送するのに具備される管路系において、前記排ガスの成分を連続監視するNox計、Sox計、HCL計、CO計、酸素計を分岐して設置することによりそれらの成分・濃度を収集し、或いは前記採集位置とは相違して別配管系にて収集して、それらの情報を前記質量分析計のデータ処理部やその上位の管理機器部にて収集し、
更に、前記プラントの運転変量である電気集塵器の設定温度や排ガスラインのプロセス流量やプロセス温度を収集して前記質量分析計のデータ処理部にて収集し、これらの情報を元に前記排ガスの“性状”を分析・判断する計算手段を前記質量分析計やその上位の管理機器部に具備し、
前記計算手段の結果を他の上位の管理機器や制御装置機器に送出・開示する構成としている。
(2)機能構成
(2−1)質量分析計による排ガス中の特定成分の検出
前記質量分析計においては、排ガス中の塩素、酸素元素を複数分子内に有するダイオキシン類、クロロフェノール類、クロロベンゼン類の検出を高感度に行う。前記塩素や酸素は電気陰性度の高い元素で、これらの元素を多数含む有機化合物は低エネルギの熱電子を捕獲して負イオンになり易い。クロロフェノール類は分子内に塩素原子を1個以上、酸素原子を1個有している。又、クロロベンゼン類は分子内に塩素原子を1個以上持っている。猛毒のダイオキシン類は分子内に4個から8個の塩素原子、2個の酸素原子を有している。このため、ダイオキシン類等は大気圧における負のコロナ放電により生じた熱電子により効率良くイオン化され、そのイオン量を減衰しないで質量分析計に取り込むことにより連続モニタが可能になる。この時、前記質量分析計においては排ガス中のH2SO4,HBR、H2SO4やNOX、SOX、CO3等の電気陰性度の高い分子も負イオンになり易く、同時にイオン化され検出される。
【0010】
更に、本質量分析計においては、排ガス中の未燃物(炭化水素系化合物)を、正のコロナ放電に切り替えることにより生じた熱電子で効率良くイオン化され、そのイオンを質量分析計に取り込むことにより連続モニタが可能になる。
【0011】
この時、前記針状電極を負のコロナ放電から正のコロナ放電に切り替えと同期して、各電極やレンズ系に印加するイオン加速電圧を負から正に切り替える。
【0012】
前記の構成によれば、針状電極に正電圧が印加されると、各電極の電圧が質量分析系の検出部に至る経路において、正イオンにイオン化された試料が加速され、効率良く生成イオンを検出出来る。
【0013】
好ましくは、ニードル部への印加電圧の切り替えは、正の高電圧を出力する電源と負の高電圧を出力する電源と、前記2つの電源とニードル部との接続を切り替える切替え機構を有し、前記切替え機構はイオン加速電圧の極性切り替えとドリフト電圧切り替えと同期して動作する。
【0014】
正イオンを測定する場合はイオン加速電圧に正の高電圧が各電極に印加され、『電極電圧1>電極電圧2』となるよう印加され、更に針電極には正の高電圧が印加される。又、負オンを測定する場合はイオン加速電圧に負の高電圧が印加され、『電極電圧1<電極電圧2』となるよう印加され、針電極へは負の高電圧が印加される。これらの切替え動作はいずれも同期して行われる。
【0015】
これよりイオン化室内で生成されたイオンは、正、負両イオンとも高感度で測定を行うことが出来る。
(2−2)プロセスセンサによる排ガス中の特定物質以外の特徴成分の抽出
第二には、前記排ガス中の成分とは別に、一般的に、排ガス監視用センサとしてプラントに具備されているHCL計、NOX計、SOX計、CO計、酸素計等からのプロセスデータを得る。
【0016】
(2−3)プロセス変量情報
第三には、前述の質量分析計からのデータと各プロセスセンサからのデータとは別に、プラントの運転と操作・調整を行う操作変量である、例えば電気集塵器の運転温度や投入蒸気流量や煙道内の温度分布や流量等のデータを得る。
(2−4)計算手段
(2−1)〜(2−3)項の質量分析計とプロセスセンサとプロセス変量情報からのデータ群は、変換器を介して前記質量分析計のデータ処理部或いは上位の管理機器に格納される。かかるデータは、焼却場に投入されるゴミ量やその質によって変化し、その際のプラント操作も種々相違する。
【0017】
従来技術によれば、これらの個々の情報は単一的な取り扱いにて扱われていたので、これらのデータ間の相関関係を求めるだけでも多大な時間を要し、増してや、最良の運転パラメータを模索するに当たってはより一層の時間を要していた。
【0018】
本システムの計算手段においては、排ガスの性状を表すデータや運転・操作に起因している情報データを基に、該当排ガスの性状状態を診断或いは判断する計算手段としている。
【0019】
前記該当排ガス時の各種の分析計やプラント変量からの情報で“該当排ガス稼働時の固有空間”を作成し、以後は前記“該当排ガス稼働時の固有空間”との差異から計算される各固有空間の隔離値を逐次比較して行き、この隔離値が前記“該当排ガス稼働時の固有空間”を形成している各パラメータ或いは要素中の主パラメータ(特徴要素)を開示する方式とした。
【0020】
以下、その方式の詳細フロー示す。
(A)当該排ガスの固有空間を作成するデータの収集
任意のプラントの運転モードにおいて、排ガスの性状が変化する場合に、その時の“当該排ガスの固有空間”の空間を作成するデータを収集する。この“当該排ガスの固有空間”は種々の焼却場の構成や焼却炉、運転法が異なるが、個々の焼却場単位にて、適宜その性状をカテゴリー化して、“当該排ガスの固有空間”を定義することが出来る。
【0021】
例えば、日々、週単位の運転モードにおいて
▲1▼焼却場に投入するゴミ質は比較的軟で乾燥状態・定常焼却量で排出ガスの規制値を満足している状態
▲2▼焼却場に投入するゴミ質は比較的軟で湿った状態・定常焼却量で排出ガスの規制値を満足している状態
▲3▼焼却場に投入するゴミ質は比較的硬で乾燥状態・定常焼却量で排出ガスの規制値を満足している状態
▲4▼焼却場に投入するゴミ質は比較的硬で湿った状態・定常焼却量で排出ガスの規制値を満足している状態等にカテゴリー化し、前記いずれかの運転時を“当該排ガスの固有空間”とする。或いは、前記▲1▼〜▲4▼とは全く反する運転時を“当該排ガスの固有空間”とすることも可能である。
(B)前記(A)項の“当該排ガスの固有空間”の基準空間のデータ群を作成
(A)項のデータ群を各“当該排ガスの固有空間”に、その平均値と標準偏差で正規化する。
(C)“当該排ガスの固有空間”の基準空間を作成
(B)項のデータ群から“当該排ガスの固有空間”の統計量D^2(マハラノビスの距離)を求める。マハラノビスの距離は、前記各要素の数のみで決定される2次元行列であり、使用されたデータの数に対応して、その距離が計算される。その平均値は“D^2”で、その平均値は“約1”で標準偏差はσiintである。
【0022】
更に、前記計算後、“当該排ガスの固有空間”で観測される期待値以外の値を設定し、或いは“排ガスを導入しない場合”の統計量D^2intairを求める。その平均値は“約1”で、その標準偏差はσintである。
【0023】
この値(D^2intair)は前記各“当該排ガスの固有空間”の絶対的な“隔離距離”を示し、その相違を示す指標である。
【0024】
かかる基準空間の作成においては、前記排ガス中のクロロフェノール類等の特定物質は別途内試料により検量されているので、本作成時に使用しなくても良い。或いは、検量可能範囲の値を入力して基準空間とすることも可能である。
【0025】
更にこの時、前記“当該排ガスの固有空間”D^2_intと前記D^2 intair作成に使用したデータを用いて、このD^2intの特徴パラメータを抽出し、保存しておく。かかる操作により、本D^2 intに至る特徴パラメータが判明する。
(D)観測データの収集と監視
排ガスからの観測データを収集する(一般的には前記基準空間作成時のデータとは異なる)。
【0026】
収集されたデータを前述の(A)、(B)項と同様な方法でデータ加工を行い、収集されたデータのD^2 x(マハラノビスの距離)を計算する。
(1)この値D^2 xと前記(C)項で得られた“当該排ガスの固有空間”の基準空間”の統計量D^2int(マハラノビスの距離)とを比較する。
(2)前記(1)項のD^2 xとD^2intに差異がない場合は、例えば“運転継続可能”と言う開示を行う。
【0027】
一方、差異がある場合には、例えば“運転変更”と言う開示を行うと共に、その隔離距離に至った主要因を開示する。例えば“CO変化”、“HCL変化”等である。かかる情報にて、プラント側の操作・制御状態の変更を促す。
【0028】
前記“基準空間”は計測値の平均ベクトルをゼロ点とし、基準空間に属する対象のマハラノビス距離の平均が1になるように定義している。このため、どのような基準空間をとっても同じであるが、前記ゼロ点にあたる理想状態は不明であるので、各プラントの操作者や技術者或いは専門家で前記基準空間を定義し、基準空間の計測データから、ゼロ点と単位量を決定する。
【0029】
マハラノビス距離は前述の如く、計測される対象がどれくらい基準空間から隔離しているかを示す距離である。前記計測される対象が基準空間に属さない場合、
▲1▼その距離の隔離程度が計量値で判断出来る場合は、その値を信号の水準値として、各パラメータを増減した場合の主パラメータ(特徴要素)を算出する。
▲2▼その距離の隔離程度が計量値で判断出来ないが基準空間内に入っていないことが明白な場合は、各パラメータを使用する、使用しないという2水準のカテゴリーのもとに、各パラメータの前記隔離距離に対してその有効性を判断する。
【0030】
かかる操作では、最終的には取り上げられた全パラメータに対し、重要なパラメータを取捨・選択出来る。
【0031】
又前記取捨・選択されたパラメータのみを用いてマハラノビスの距離を前述の手順にて求めて行くことも可能である。
【0032】
前記質量分析計において、排ガス中の塩素、酸素元素を複数分子内に有するダイオキシン類、クロロフェノール類、クロロベンゼン類は電気陰性度の高い元素で、これらの元素を多数含む有機化合物は低エネルギの熱電子を捕獲して負イオンになり易いので、負のコロナ放電により生じた熱電子により効率イオン化され、そのイオン量を取り込むことによりその量を高感度で、連続検量が可能になる。
更に、前記排ガス中のH2SO4、HBR、H2SO4やNOX、SOX、CO3等の電気陰性度の高い分子も負イオンになり易く、同時にイオン化され、そのイオン量を取り込むことによりその量を高感度で、連続モニタが可能になる。又、前記ダイオキシン類、クロロフェノール類、クロロベンゼン類等の有害な特定物質類は、前記分析計の内部にてその絶対量が検量されているので、かかる量のみの指標でも排ガスの性状を規定することが可能である。
【0033】
かかる検出されたイオン種は、排ガスの性状を示す成分である。
【0034】
更に、本質量分析部においては排ガス中の成分を、正のコロナ放電に切り替えることにより生じた熱電子で効率良くイオン化してそのイオン量を分析計に取り込むことにより、排ガス中の未燃物質の指標である炭化水素系化合物も高感度で、連続モニタが可能になる。
【0035】
かかる検出されたイオン種は、排ガスの性状を示す成分である。
【0036】
即ち、排ガス中に含まれるダイオキシン類、クロロフェノール類、クロロベンゼン類、H2SO4、HBR、H2SO4、NOX、SOX、CO3や炭化水素系化合物を高感度で検出が可能になり、排ガス成分やその性状を連続して計測・監視が可能になる。
【0037】
又、本システムでは、前記質量分析計からの排ガスの性状を示す成分以外の情報はプラントに具備されているHCL計、NOX計、SOX計、CO計等の一般的な監視用センサからのデータを前記性状を示す成分に付加することが出来るので、排ガスの性状を示す情報が多くなり、その確度が一層向上する。
【0038】
更には、前述の排ガスの性状を示す成分以外の情報とは別に、プラントの運転と操作・調整を行う操作変量であるプラント機器の運転温度や投入蒸気流量や煙道内の温度分布や流量等のデータを前記性状を示す成分に付加することが出来るので、排ガスの性状を示す情報とプロセス変量の情報とを総合して構築することが出来、より一層の総合計測と監視・運転が可能になる。
【0039】
以上の排ガスの性状を表すデータや運転・操作に起因している情報データを基に、前述の計算手段にて“該当排ガスの性状状態”を監視或いは判断する。
【0040】
前記“該当排ガスの性状状態”は各プラントの操作者や技術者或いは専門家で“固有空間或いは基準空間”を定義する。この“固有空間或いは基準空間”とは、例えば“焼却場に投入するゴミ質は比較的軟で乾燥状態・定常焼却量で排出ガスの規制値を満足している運転状態”で計測された生のデータ値群であり、或いはその指示値をカテゴリー化(1、2、3、…)した数量化したデータ値群でも良い。
【0041】
前記“基準空間”は前述の如く、計測値の平均ベクトルをゼロ点とし、基準空間に属する対象のマハラノビス距離の平均が1になるように定義している。このため、どのような基準空間をとっても同じであるが、前記ゼロ点にあたる理想状態は不明であるので、各プラントの操作者や技術者或いは専門家で前記基準空間を定義し、基準空間の計測データから、ゼロ点と単位量を決定している。
【0042】
従って、計測時には、マハラノビス距離は計測される対象がどれくらい基準空間から隔離しているかを示す指標となっている。
【0043】
このため、前記計測される対象が基準空間に属さない場合、かかる計測時の排ガスの性状が変化しているものと判断出来る(この時点では、変化した内容は排ガスの成分或いはプロセス変量なのかは不明)。
【0044】
次に、
▲1▼その距離の隔離程度が計量値或いはカテゴリー化(1、2、3、…)した数量化データで判断出来る場合は、その値を信号の水準値として、各パラメータを増減した場合の主パラメータ(特徴要素)を算出する。
▲2▼その距離の隔離程度が計量値で判断出来ないが基準空間内に入っていないことが明白な場合は、各パラメータを使用する、使用しないという2水準のカテゴリーのもとに、各パラメータの前記隔離距離に対してその有効性を判断し、主パラメータ(特徴要素)を算出する。
【0045】
かかる操作において、前記計測対象の“該当排ガスの性状状態”を隔離している重要なパラメータが取捨・選択される。このため、この重要なパラメータをプラントの運転者・管理者等に開示することにより、プラントの運転・操作を改善する処置策を誘導することが可能である。
【0046】
更に、プラントの運転・操作が成熟するにつれて、前記“基準空間”と“重要なパラメータ”はカテゴリー化出来るので、効率の良いプラント操作を達成出来る。
尚、上記で用いているマハラノビスの距離を用いる多変量解析の手法については、例えば特開平10−124766号公報や特開2000−46701号公報に開示がある。
【0047】
【発明の実施の形態】
以下図面を使って、本発明の実施の形態を説明する。
(システム構成例)
図1は排ガス中のクロロベンゼン類、クロロフェノール類、炭化水素類や他の成分を自動的に連続分析・計測するためのシステム構成を示した図である。
【0048】
図2は質量分析計部の構成例を詳細に示した図である。
【0049】
以下図1、2を用いて説明する。
【0050】
このシステムは主として、質量分析装置部10000と、前記質量分析装置以外のHCL計10001、CO計10002、NOX計・、SOX計10003、酸素計10004等のプロセスセンサ群と、以下の構成要素から構成されている。
【0051】
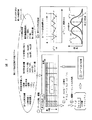
測定すべき排ガスをプラントの配管或いは煙突から直接サンプリングする採集管1000と、前記採取された排ガス内のダストやオイルやミスト更には塩化水素を除去するフィルタ(1)1004と、前記採取された排ガスを質量分析装置本体に導入する試料輸送管(1)1001と、装置本体とは別に具備した試料輸送管(2)1003と、試料輸送管(2)1003とは別に、前記装置本体と連結して本体内に試料接続管400を具備し、前記試料輸送管(1)1001の一端にて分岐して、前記排ガス試料を装置に取り込み、所定の流量のダイオキシン類、クロロフェノール類、クロロベンゼン類を含む排ガスを導き、試料導入フランジ33(図2)の試料導入管34(図2)に接続する。
【0052】
前記試料接続管400を通して導入された試料は、試料導入フランジ33に具備した試料導入管34を介して試料導入フランジ33内に導入される。
【0053】
前記試料導入フランジ33内に導入された試料の一部は、イオン化室10に導入され、残りは試料導入フランジ33に具備した排出管(2)36、或いはイオン化室10に具備した排出管(1)16より排出される。
【0054】
前記イオン化室10に導入された流量と排出管(2)36或いはイオン化室10に具備した排出管(1)16から排出される流量の合計は約1〜2l/min程度である。
【0055】
これらの流量は前記試料接続管400内に具備されるフローメータ402と可変絞り機器401により設定する。フローメータ402と可変絞り機器401はマスフローコントローラにて一体化しても良い。
【0056】
イオン化室10に導入される試料は、試料導入フランジ33の一方の面に具備された電極(1)2の細孔21により流出し、その流線は細孔21により拡散しない。
【0057】
前記検出体を含む試料は電極(1)2と高電圧を印加した針電極1の間で生成されるコロナ放電域にてイオン化される。この部分は図2に示す“イオン化部”10に相当する。針電極1に印加される電圧は、正イオンを生成させる場合には1〜6kV程度、負イオンを生成させる場合には-1〜-6kV程度であり、Hv電源110から定電圧あるいは定電流方式にて供給する。
【0058】
前記電極(1)2と高電圧を印加した針電極1の間で生成されるコロナ放電域にて前記排ガス中の成分がイオン化・分子反応する。かかる時、イオン化・分子反応の過程で、NO3―のイオン生成反応を抑制し、O2―とNOとの存在領域が重複しないことが重要であるので、細孔21により流出する試料速度を高めることにより、O2― + NO→NO3―の反応を抑制し、イオン化効率を高めることが重要である。
【0059】
一方、O2― +CP(クロロフェノール類) → (CP_H)― + HO2 で生成したイオンは電極(1)2と高電圧を印加した針電極1間に生成する電界により、流れに打ち勝ってイオンを引き出し、質量分析部に取り込む。
【0060】
又、排ガス中に塩化水素等の夾雑物質が存在すると、前記O2 イオンと夾雑物質間でイオン・分子反応が起こり、前記クロロフェノール類等のイオン化が変化する。
【0061】
このため、O2― +HCL → CL― + HO2の反応は試料接続管400に具備する除去剤や試料輸送管(1)1001内に具備する除去剤やフィルタ(1)1004内の除去剤により低減することが望ましい。しかし、100%の除去率は期待出来ないので、むしろ前記HCL等の腐食ガスの夾雑物質がある程度存在しても、イオン化部の効率が一定で安定していれば、連続計測上は実用上問題ない。このため、イオン源部は安定したコロナ放電と耐久性を確保出来る構成とすることが望ましく、本実施例では、前記コロナ放電部の安定化と耐久性を確保するため、針電極1が位置するイオン化部に別途ドライエアー、アルゴン等の純粋ガスを前記イオン化部に供給する手段を備えている構成例である。この供給量は、一般には細孔21から流出する流量よりも低く設定している。
【0062】
図2に従って説明する。前記針電極1は針ホルダー管11の先端に固定し、針ホルダー管11の一端にはバックガス(2)供給管12を連結し、他端には電源を供給するためのHV端子13を具備している。
【0063】
前記バックガス(2)供給管12の先端には外部からドライエアー、アルゴン等のガスを供給するバックガス接続管300とその量を制御するフローメータ302と可変絞り機器301を具備する。
【0064】
かかる構成においては、前記ドライエアー、アルゴン等の純粋なガスが、針ホルダー管11内を介して、常時平行流として針電極1の先端部に供給され、特に、供給流体がドライエアーの場合は、前記コロナ放電域に一次イオン化の種源である酸素を連続供給出来るので、試料ガス中の酸素濃度に依存しない一定の一次イオンを生成出来る。このため、コロナ放電が安定する。又、この供給ガスは最も高温である針先部を隔離するシルードガスの役目をしているので、益々安定化すると共に、針電極1の腐食防止にも効果がある。かかる構成は、前記排ガスの性状によっては具備する必要がないと判断出来る場合は削除しても良い。
【0065】
前記針ホルダー管11は針固定金具14に取り付けられ、針固定金具14はイオン化フランジ15に取り付ける構成とすることにより、着脱可能としている。かかる構成により、万一、コロナ放電部が支障を来した場合でも、本部位のみを容易に交換やクリーニング等で再生出来るので、メンテナンス性が向上する。
【0066】
前記イオン化部を通過した試料は、イオン化フランジ15に設けられた排出管(1)16から排出される。一方、前記イオン化フランジ15には、更にヒータ(1)17を装着している。これは、イオン化部のイオン化温度を一定にするために具備するものである。これにより、益々イオン化が安定化する。
【0067】
更に、前記イオン化フランジ15は試料導入フランジ33に端子板22を介して取り付けられる。端子板22の内部には電極(1)2が取り付けられ、端子板2の端子が電源線121を介して電源発生部120に連結している。
【0068】
更に、かかる構成においては前記針電極1と細孔21とイオン化フランジ15と試料導入フランジ33は同軸上に配置され、機能別にユニット化(コロナ針放電部、試料排気・加温部、コロナ放電電極部、試料導入部)されているので、各ユニット単位でも分解・再組立・交換作業を可能としている。
【0069】
前記イオン化した検出体、酸素、HCL等の分子は細孔21を通過して試料導入フランジ33内に、細孔21の孔径域で流出する。これは前記試料導入フランジ33内の流速は前記コロナ放電域の流速に比してその速度が遅く、イオン化した分子の運動エネルギが大きいため、試料の流れに逆行してもイオンを引き出せることを意味している。
【0070】
次に、これらのイオン化した分子を後述する差動排気室の初段に取り込む。差動排気室の初段部の細孔は、細孔21の径と同じなら問題ないが、一般には差動排気室に具備するポンプの排気能力には限界があるので、その圧力減衰比を概ね、1/10〜1/100程度としている。このため、生成したイオンを前記差動排気室の初段に取りこむ前に、収束する必要がある。又、前記生成したイオンの中にはHCL等の腐食性ガスも含まれている。これらのガスが差動排気室や後述する質量分析部に流入すると、検出感度の劣化や、機器自体の耐久性が低下する。更に、真空室内の各部品の交換・再生は非常にメンテナンスが悪化することが危惧される。このため、本実施例では、試料導入フランジ33に流出したイオンを収束する手段(イオンドリフト部20)と、HCL等の腐食性ガスを後述する真空室に流入させない構成とした。
【0071】
前記試料導入フランジ33内のイオンドリフト部20を通過したイオンは電極(2)3の細孔31に流入する。この時、電極(2)3の他方の面側(試料ガスが流れる面の裏側)に試料導入フランジ33室の圧力と同等で、且つ純粋なガス体を提供することにより、前記腐食性ガスを含む試料ガスの流入を阻止出来、後述する差動排気室や、質量分析部には好都合である。
【0072】
本発明の例示において、前記電極(2)3と差動排気室の第一細孔フランジ4間に前記純粋なガス体を密閉された微少空間に引き込む構成としている。この空間は電極(2)3と第一細孔4間に端子板(2)32或いはシール体を介在させ、第一細孔フランジ4の第一細孔41以外の位置にバックガス(1)供給管44を具備し、バックガス(1)供給管44の末端部には外部からドライエアー、アルゴン、窒素、ヘリウム等のガスを供給するバックガス接続管303とその量を制御するフローメータ305と可変絞り機器304を具備する。
【0073】
かかる構成においては、前記ドライエアー、アルゴン、窒素、ヘリウム等の純粋なガスが、バックガス(1)供給管44を介して、前記空間内に供給常時供給され、前記第一細孔41より差動排気室の内部に流入する。この時、差動室に引き込まれる流量とほぼ同じ流量とすることにより、前記試料ガスは一切流入しないようになる。
【0074】
更に、図2に示すように、前記バックガス(1)供給管44と第一細孔41の位置は隔離しているので、その流線は第一細孔41に集中するようになる。又、第一細孔41と電極(2)3の細孔31は同軸上に配置し、イオンの拡散を防止している。
【0075】
一方、前記電極(2)3の細孔31まで引き出されたイオン化された分子は、前記ドライエアー、アルゴン、窒素、ヘリウム等のガス流線内に混合される。この時、この流線は第一細孔41に集中しているので、効率良く(流線に沿って混合されているので)第一細孔41に取り込まれる(イオンドリフト30)。
【0076】
更に、図2に示すように、前記電極(2)3は端子板(2)32を介し、電源発生部120と接続線122を介して外部から電圧を印加している。この時、第一細孔41と電極(2)3には電位差が発生し、前記イオンを加速すると共に、第一細孔41の凸部形状により、第一細孔41にイオンを収束出来る。
【0077】
即ち、前記電極(2)3の細孔31まで引き出されたイオン化した分子は、前記ドライエアー、アルゴン、窒素、ヘリウム等のガス流の流体力と、第一細孔41と電極(2)3の電界力扶助により、第一細孔41に高効率で輸送される。又、前記試料ガスは流入しないので、真空室は高純度の不活性ガスの希薄流体のみで充満し、そのケミカルノイズあるいはバックガスによる影響が少なくなり、長期間の連続運転が可能である。
【0078】
かかる構成において、正イオンを測定する場合には、前記電極(1)2の電圧は電極(2)3より高く設定し、実際には電極(1)2は1000V(V1)、電極(2)3は300V(V2)程度、第一細孔フランジ4の電圧は50V(V3)程度である。逆に、負イオンを測定する場合には、正イオン測定の場合とは逆で、電極(1)2の電圧は電極(2)3より高く設定し、実際には電極(1)2は−1000V(V1)、電極2(3)は−300V(V2)程度、第一細孔フランジ4の電圧は−50V(V3)程度である。
【0079】
かかる正、負の切り替え操作は前記HV電源110により、手操作或いは装置に具備する測定シーケンスの一連の動作内にて実行することが可能となっている。
【0080】
更に、前記試料導入フランジ33内のイオンドリフト部20や電極(2)3と前記第一細孔フランジ間やイオンドリフト部30の温度は均一化した方が安定するので、試料導入フランジ33の一端にヒータ(2)35と第一細孔フランジ4にヒータ42を具備し、外部から制御し、温度を均一化している。
【0081】
前記イオンドリフト部30を構成する配管類や電極2や端子板2は、前記排ガスの性状よっては具備する必要がないと判断出来る場合は削除しても良い。
【0082】
前述の如く生成された正、或いは負イオンは第一細孔41に取り込まれる。
【0083】
本実施例では、前記第一細孔に41取り込まれたイオンを徐々に低圧力化した真空室を通過させて、高真空室の質量分析部(室)に導入する排気系の形状や配置に対し、よりイオンの透過性を向上出来る差動排気室構成を達成した。
【0084】
かかる構成において、前記第一細孔41と第二細孔51間の第一差動室の圧力は約0.1〜10Torrとし、第二細孔51と第三細孔61間の第二差動室の圧力の減衰比を1/10〜1/50程度とし、更に前記第三細孔61と第四細孔71間の第三差動室の圧力の減衰比を1/10程度とすることにより、前記第三差動室の圧力を0.001〜0.005Torrまで低下させることが出来、且つイオンを約φ0.2〜0.6の収束したイオンビーム流として取り出せた。
【0085】
このイオンビームは前記第四細孔71(φ0.2〜0.6)から噴出し、質量分析室80にて分子流となる。
【0086】
かかる構成では、高圧力下でのイオンビーム流的(粘性流的)挙動をしていたイオンは、徐々に圧力が低下すると、平均自由行程が長くなる。この時、イオンを加速する方向に電界を生成すると、イオンは電界中を加速飛行し、中性分子との衝突を繰り返すようになる。この衝突により、水分子等を脱離させることが出来ると共に前述のイオン化部の如く、その収束性も圧力が低くなるに従って良くなる方向である。そこで、前記差動室の各質を形成する第一細孔41の第一細孔フランジ43、第二細孔51の第二細孔フランジ5、第三細孔61の第三細孔フランジ6、第四細孔71の第四細孔フランジ7にイオン加速電界を生成するため、ドリフト電源(2)130から、前記各細孔フランジに各々V1、V2、V3、V4の電圧を印加する。ここで、イオンが正イオンの場合はV1>V2>V3>V4となるように、イオンが負の場合はV1<V2<V3<V4となるように印加した。
【0087】
又、これらの各フランジ内の各細孔は同軸上に配置され、偏芯によるイオン透過域の芯ずれを抑えている構成としている。更に、これらの電位は外部から調整・設定することにより、イオンと中性分子との衝突による脱溶媒の程度を変化させ、更にイオンの収束性と、組み立ての時の誤差が生じてた場合でもその誤差を吸収出来るようにしている。
【0088】
前記差動排気部に具備する排気ポンプは、ロータリポンプ、スクロールポンプ、又はメカニカルブースタポンプ、ターボ分子ポンプ等の排気ポンプが適用可能である。図2では、差動排気部の排気にスクロールポンプ210を採用(排気量は300〜900l/min 程度)し、前記質量分析部80の排気にターボ分子ポンプ220(排気量は150〜300 l/s程度)を用いた場合を示している。ターボ分子ポンプ220の背圧は連結管(B)76によりスクロールポンプ210にて兼用している。
【0089】
更に、前記各フランジには、各圧力を調整するための細孔52、62、72を具備し、適用する排気ポンプの能力に合わせて各室の圧力調整を可能にしている。
【0090】
前記差動排気室の最終段から流出した分子流域のイオンは、先ず質量分析部80の入り口に具備される第一の収束レンズ81により収束される。この収束レンズは、通常、3枚(81、82、83)の電極から成るアインツエルレンズ等が用いられる。
【0091】
次に収束したイオンは更に、スリットを具備したレンズ電極84を通過する。前記収束レンズ81、82、83の電極により、第四細孔71を通過したイオンはこのレンズ電極84にて収束し、収束されない中性子等はこのレンズ電極84のスリット部分に衝突し、質量分析部側に行きにくい構造となっている。
【0092】
前記レンズ電極84を通過したイオンは、多数の開口部を備えた内筒電極86と外筒電極85よりなる二重円筒型偏光器により偏光且つ収束される。二重円筒型偏光器では、内筒電極86の開口部より滲み出した外筒電極85の電界を用いて偏向し且つ収束している。
【0093】
前記二重円筒型偏光器を通過したイオンは、イオントラップ質量分析部に導入される。前記イオントラップ質量分析部は、ゲート電極91a、エンドキャップ電極92、リング電極94、つば電極921、絶縁リング93、イオン取り出しレンズ91bより構成される。
【0094】
前記ゲート電極91aはイオントラップ質量分析部内に捕捉したイオンをイオントラップ質量分析部外に取り出す際に、外部からイオンが質量分析部内に導入されないようにする役目をする。
【0095】
前記エンドキャップ電極92の細孔92aを通してイオントラップ質量分析部内に導入されたイオンは、イオントラップ質量分析部内部に導入されたヘリウムなどのバファーガスと衝突してその軌道が小さくなった後、エンドキャップ電極92とリング電極94間に印加された高周波電圧を走査することによって質量分析数毎にエンドキャップ電極92の細孔92bからイオントラップ質量分析部外に排出され、イオン取り出しレンズ91bを経て、イオン変換器101とイオン検出器140により検出される。前記バッファーガスは外部に設けたHe等のバックガス3のボンベ105から、バックガス(3)接続管104とバックガス(3)供給管104により連続的に供給される。
【0096】
前記バッファーガスを導入した際のイオントラップ質量分析部内部の圧力は10― 3〜10 ― 4Torr程度である。
【0097】
前記イオントラップ質量分析部の測定シーケンスやデータ処理や電圧制御は、質量分析部内のデータ処理・制御部230にて実行される。
【0098】
前記イオントラップ質量分析計のメリットの一つは、イオンを捕捉する特性を有するので、試料の濃度が希薄でも溜め込み時間を延ばせば検出出来る点にある。従って、試料濃度が低い場合でも、イオントラップ質量分析部のところでイオンの高倍率濃縮が可能となり、濃縮等の試料の前処理を非常に簡便化出来る。
【0099】
前記生成したイオンを質量分析するに当たっては、いろいろな種類の質量分析部が適用可能であり、例えば、同じ高周波電界を用いた質量分離を行う四重極質量分析計や、磁場内での質量分散を用いた磁場型質量分析部や、或いは他の質量分析計を用いた場合でも同様である。
【0100】
図1に従って説明する。前記イオン源にてイオン化済みのガス分子や未反応のガスは、試料導入フランジ33の排出管(2)36やイオン化フランジ15の排出管(1)16を介して、排出管(s)1005から排出される。この排出されたガスは試料輸送管(2)1003に戻される。
【0101】
更にこのガスは試料輸送管1001、1003系内(配管)に設けられた吸引ポンプ1002にて吸引され、更に、前記吸引ポンプの下流側に位置した排気ファン1006にて送り出され、排ガス排出管1007を経て、前記排ガスをプラントの配管或いは煙突等に排出するような配管系の構成としている。
【0102】
又、前記試料輸送管(2)1003の上流側に試料接続管400の一端が連結され、その下流側に差圧発生体(絞り機構)1008を具備し、その下流側に前記排出管(s)1005が連結されている。
【0103】
前記差圧発生体1008の差圧の発生量で試料接続管400の流量を設定している。
【0104】
又、前記バックガス(1)、(2)接続管300、303の上流側にポンプ1009を具備して、大気を吸引し、且つその下流側にミスト除去のためのフィルター等(図示せず)を介して清浄化して、前記イオン源やイオンドリフト部へのバックガスとして供給している。
【0105】
前記配管系(1001から1008、1007で構成された流路)は、採取した試料ガスを安定に且つ途中で測定対象物質の吸着、凝縮等による損失が無く、且つ一定流量でモニタ部に送り込む役目を果たしている。このため試料採取部全体は100℃〜300℃程度に加熱されている。
【0106】
前記質量分析部(モニタ)では、送り込まれた試料ガス中の測定対象物質を選択的に且つ高効率でイオン化し、生成したイオンを質量分析部で質量分析することにより、測定対象物を連続的に検出する。
【0107】
測定対象物に由来する質量数におけるイオン電流値と、あらじめ作成された標準物質の量とイオン電流値の関係(検量線)から、対象物質の存在量を定量的に求めることが出来る。
【0108】
例えば、2,3−ジクロロフェノール(分子量:162、観測されるイオンの質量数161)の場合、試料ガスの濃度に対するイオン強度の変化を測定し、検量線を作成している。この検量線と観測されたイオン強度から、その時の試料ガスの濃度データを算出する。得られたデータは更に整理され、成分の濃度、その他のパラメータと共にデータ処理・制御部230にて処理されて、連続的に表示、記憶される。或いは、ごみ焼却場の燃焼制御のためのデータとして上位の管理機器203や他の更なる上位の管理機器や制御装置に送られる。クロロベンゼン、クロロフェノール類の濃度からダイオキシン濃度を推定するには、あらかじめ求められた両者の相関関係を用い、その濃度を算出する。
【0109】
イオントラップ質量分析計を用いると、通常のマススペクトルに比較して、更に高い選択性を得ることが出来る。これは、イオントラップ質量分析部内部に捕捉した分子イオンにエネルギを注入し、電極内バッファガス(He等)分子と衝突させて分子イオンを解離するMS/MS法である。有機塩化化合物の場合、分子イオンから塩素原子が一又は二個脱離するイオンがMS/MS法で観測される。例えば、2,4ジクロロフェノールの場合、負のコロナ放電を用いてイオン化すると、(M-H)―、(M:分子、H:水素)という負イオンが生成する。この負イオンをMS/MS法により解離すると、塩素原子が1個脱離した負イオンが生成する。この負イオンを観測するということは、非常に高い選択性を得ることが出来る。このピーク強度から塩素原子が1個脱離した負イオンの量を定量すれば、排ガス中のジクロロフェノールの量を推定出来る。測定すべき分子種が複数ある場合にはこの測定過程を繰り返す。
【0110】
以上、主として、負イオン化モードの大気圧化学イオン化法を用いた場合について述べてきたが、排ガス中には種々の成分が含まれている。このため、ベンゼンなどに代表される芳香族化合物の炭化水素系化合物や塩素数の少ない化合物については、本質量分析部により、正イオン化モードでの連続測定も可能である。例えば、未燃物質の主体である炭化水素系のイオンや、更にベンゼンやモノクロロベンゼンでは、正イオン化モードの大気圧化学イオン化法により、M+のイオン種が生成する。
【0111】
従って、実際の試料ガス測定では、図2に示すHV電源110により、装置の測定シーケンスと同期して、電源発生部120とその電源線123から各電圧が供給され、所定の制御の元に正、負イオン化モードを交互に或いは所定の期間で繰り返し測定する。これにより試料ガス中のイオンの情報量を増やすことが出来る。
【0112】
図3(A)、(B)に本装置単体での前記特定イオンの特性確認結果例を示す。
【0113】
測定条件方法は、本装置の前記試料輸送管1001に、ジクロロフェノール(濃度:5μg/Nm3)を空気と混合し、その混合比率を変化させて濃度を変化させた。この時の流量は11/minであり、前記針電極のコロナ放電電流は5〜10μA、イオン取り込み時間は0.1秒、温度は150℃であった。図中、縦軸は、イオン強度で規格化した相対イオン強度で示している。
【0114】
図3(A)に、その濃度の変化を示す。図から判るように、その分解能は約0.2μg/Nm3、直線性は2〜10%以下であり、良好な直線関係が得られた。
【0115】
図3(B)に、マススペクトルの出力例を示す。
【0116】
測定条件は前記と同じであるが、試料としてはジクロロフェノールの他にトリクロロフェノール、テトラクロロフェノールを添加した。図中、縦軸は、イオン強度で規格化した相対イオン強度で示している。図に示すように、ジクロロフェノール(DCP)、トリクロロフェノール(TCP)、テトラクロロフェノール(TeCP)のマススペクトルのピークが明確に分析されているのが分かる。更に、試料の媒体である空気中の酸素、窒素のスペクトルも観測され、極めて良好なマススペクトルが得られた。
【0117】
図4(A)に、他のマススペクトルの出力例を示す。
【0118】
測定条件と方法は、本装置の前記試料輸送管1001に擬似排ガス(塩化水素、硫酸、臭化水素等の夾雑物質と炭化水素系ガス物質を若干含むガス)と空気を混合し、ジクロロフェノール(DCP)、トリクロロフェノール(TCP)、テトラクロロフェノール(TeCP)を添加した。更に内試料として、内試料発生器1100を装置内に具備して定量的に発生し、内試料輸送管1101、1102にて、試料輸送管1001に添加した。
【0119】
図中、縦軸は、イオン強度で規格化した相対イオン強度で示し、白抜き部は前述の図3(B)の条件での観測値であり、黒部は本擬似排ガスを観測した結果である。
【0120】
図に示すように、ジクロロフェノール(DCP)、トリクロロフェノール(TCP)、テトラクロロフェノール(TeCP)のマススペクトルのピークが明確に分析され、又試料の媒体である空気中の酸素、窒素のスペクトルと添加した内試料のスペクトルや炭化水素系(正イオンに切り替え)も観測され、更には、HCLイオンやH2SO4イオンやHBrイオンも同時に良好なマススペクトルが得られ、使用した擬似排ガスの種類の相違が明らかに有意であることを確認した。
【0121】
前記酸素、窒素のスペクトル強度は前記図3(B)に比して、減衰しているが、これは前記HCLイオン等の酸系イオンとの協奏反応により、そのスペクトル強度が低下したものと推定される。
【0122】
図4(B)は、図4(A)の条件において、その混合比や各濃度を故意に変化させた場合の、所定の観測されるイオン強度の時間的変化を示した図である。いずれの操作条件下においても、その強度変化は前記操作条件によって変化があり、十分に追従していることを確認出来た。
【0123】
本発明では、図1に示すように、質量分析計部:1000とは別に、HCL計10001、CO計10002、NOX計・SOX計1003、酸素計1004等のプロセスセンサ群を具備する。前記センサ群は測定すべき排ガスをプラントの配管或いは煙突から直接サンプリングする採集管1000と前記採取された排ガス内のダストやオイルやミストを除去するフィルタ(1)1004と前記採取された排ガスを質量分析計部10000に導入する配管計とは別に具備する試料接続管(3)10005にて連結して、所定の流量の排ガスを導き、測定される。図4(B)は、その測定例を示す。これらの値は周知の如く、前記プロセスの運転状況によって、刻々変化し、監視されなければならない情報群である。
【0124】
前記各種のプロセスセンサ群の出力は前記質量分析計部のデータ処理・制御部230とRS232CやRS485等のセンサ信号ケーブル1202或いは通信ケーブル1201を介して接続され、更に前記データ処理・制御部部230はプラント運転の上位の管理機器1203と接続されている。
【0125】
又、本システム構成では、前記排ガスの性状を的確に捉えるため、これらの計測量に電気集塵器の温度、投入蒸気流量、ライン温度(例えば図1に示すセンサ20000)、除去剤の投入量等のプロセス変量データを収集する。
【0126】
従来では、かかる種々の情報は単一的で且つ単発的な取り扱いが多く、前記排ガスの性状を総合的に的確に捉えることが不可能であった。
【0127】
本実施例では、これらの情報・データを前記質量分析計部1000のデータ処理・制御部230或いは管理機器1203内に収集して、所定のフォーマットにて、連続して収集して総合的に取り扱うことが可能であり、前記排ガスの性状の計測・監視を行うシステムとしている。
【0128】
この排ガスの性状は、前述の如く、各焼却場の投入ゴミ量やゴミ質や、焼却炉構成や、使用される除去フィルターの種類や、その運転状況によって相違する。しかし、いかなる場合でも公定規定値によりその排出濃度は規定されており、その規定値を満足するプロセス運転・操作が必要である。
【0129】
かかるプロセス運転・操作は各焼却場の専門技術者や実務運転者の経験・知恵によってある程度は基準化されて来ているが、その性状は専門技術者の経験や実務運転者の経験・知恵によってバラツキを生じてしまう。或いは、仮に多変量変数的な取り扱いを実施しても、各要因のパラメータの数が多く、確度の高い相関が得られず、各要因と排ガスの性状とは関連付けが困難であった。又、多大な時間(分析・解析等に)を要するので、オフラインでの作業が主体であり、且つ手間がかかるので、効率が悪かった。
【0130】
このため、本実施例では、排ガスの性状をより的確に捉えるため、以下の手法により、実現している。
【0131】
図5、図6は前記各分析機器からの情報から、排ガスの性状を決定するための概念を示した図である。
【0132】
図5において、排ガスの性状情報は、(1)質量分析計からのガス成分分析結果情報と(2)プロセス変量センサからの情報と更に(3)プラント運転変量情報とで構成され、かかる情報群が前記排ガスの性状を決定するデータ群である。
【0133】
かかるデータ群は、前記該当排ガス性状時に収集されて該当排ガス性状の状態変数(当該基準空間)を作成する。次に、かかる当該基準空間データと通常の計測・監視時に収集されるデータとを逐次比較することにより、後述する計算手段にて処理されて、前記該当排ガス性状(当該基準空間)との差を判断する。従って、この時点でも、前記各データは個々に開示されるのはいうまでもない。
【0134】
更に、その差(隔離値)を誘起している主要パラメータ或いは特徴要素(前記(1)〜(3)のデータ群内にある)を算出する。
【0135】
図6は前記状態変数の“データフォーマット”の内容を詳細に示す図である。
【0136】
前記質量分析計10000のデータ処理・制御部230或いは上位の管理機器1203のワークファイル内のフォーマット例1300を示したものであり、いずれも前記排ガスの“状態の変数”を表す一例であって、二次元の“表”の形式をとっている。
【0137】
前記排ガスの“当該排ガス性状の固有モード決定パラメータ=基準空間”の状態態変数において、各測定毎に“行”として登録し、この“行”を各状態変数毎(列)に並べてフォーマットされる。
【0138】
本図においては“排ガス性状 0”を前記該当排ガスの基準空間として扱い、“排ガス性状 1〜4”は前記基準空間作成時のデータ群とは異なった時点で作成したデータ群であることを意味する。このため、前記“排ガス性状 1〜4”のいずれかの性状でも基準空間として規定することが可能である。
【0139】
図7は本システムにおける、前記当該排ガス時に収集された状態変数(“排ガス性状の固有モード決定パラメータ”)の“データフォーマット1300”から、前記該当排ガス性状を決定する“基準空間”の作成手法とその概念を示した図である。図8は図7の計算手法を詳細に示したフロー図であり、又前記基準空間作成後の計算フローと判断手法を示した図である。
【0140】
図7において、
▲1▼前記各機器群から収集された排ガスの成分とプロセス変量やプラント運転変量等のデータから、該当排ガス性状を前記フォーマット1300の書式で編集する。これらのデータは前述の如く、二次元の表で有り、その“列”は、前記該当排ガスの性状に対応して監視する状態変数の数(n個)を割り当て、その“行”は、収集するサンプル数(p個)である。この二次元の表をX(i=p,j=n)のマトリックス表とする。その際、前記特定物質は各プラントによって相違するので、又前述の如く前記質量分析計部にて個別に定量化出来るので、削除可能である。或いは、前記質量分析計にて測定出来る範囲例えば、その範囲を0.1〜10μg/NM3とすると、その範囲で乱数発生させ、データとして取りこむことも可能である。
【0141】
この X(i,j) の条件としては、
p >= n であり、pはnの2〜3倍数以上のデータ数が好ましい。
【0142】
この“当該排ガスの固有空間”は種々の焼却場の構成や焼却炉、運転法が異なるが、個々の焼却場単位にて、適宜その性状をカテゴリー化して、“当該排ガスの基準空間”を定義することが出来る。
【0143】
例えば、日々、週単位の運転モードにおいて
(1)焼却場に投入するゴミ質は比較的軟で乾燥状態・定常焼却量で排出ガスの規制値を満足している状態
(2)焼却場に投入するゴミ質は比較的軟で湿った状態・定常焼却量で排出ガスの規制値を満足している状態
(3)焼却場に投入するゴミ質は比較的硬で乾燥状態・定常焼却量で排出ガスの規制値を満足している状態
(4)焼却場に投入するゴミ質は比較的硬で湿った状態・定常焼却量で排出ガスの規制値を満足している状態等にカテゴリー化し、前記いづれかの運転時を“当該排ガスの基準空間”とする。或いは、前記(1)〜(4)とは全く反する運転時を“当該排ガスの基準空間”とすることも可能である。
【0144】
或いは、前記“基準空間”は各プラントの操作者や技術者或いは専門家で所定の操業時の該当排ガスの性状を前記基準空間と定義することも可能である(図6の前記排ガス性状1〜4のいずれかに相当することを意味している)。
▲2▼前記 X(i,j)を統計手法にて変換・正規化し、そのマトリックスを X’(i,j)とする。
【0145】
X’(i,j)=(X(i,j)−μj)/σj
ここで、μjはパラメータ毎のp個の平均値
σjはパラメータ毎のp個の標準偏差
▲3▼D^2(マハラノビスの距離)の算出
(▲3▼−1) X’(i,j)から各パラメータ間の相関行列 R(s,t)を算出する。
【0146】
この段階で、行列はパラメータの数だけのnxnの正方行列(相関行列)となる。
【0147】

【0148】
D^2 i= X”(i,j) * R^(s,t) * X’(i,j)/j
▲4▼前記p個のD^2 iの値が前記機器の固有の状態を表現する基準空間となる。
【0149】
マハラノビスの距離は、前記各要素の数のみで決定される2次元行列であり、使用されたデータの数に対応して、その距離が計算される。その距離の平均値は約1で、標準偏差はσintの好ましくはほぼ正規分布とみなせる分布“D^2 intである。
【0150】
例えば、前記計算後に、“当該排ガスの固有空間”で観測される期待値以外の値を設定し、或いは“排ガスを導入しない場合”の統計量D^2 intairを求める。その平均値は“約1”で、その標準偏差はσintである。しかし、前記基準空間を“D^2 int=” D^2 intair“とし、前述の擬似排ガス(図4のA)を導入すると、膨大な隔離距離(図7 ▲5▼に示す図において右側に大きく隔離する)を示すことになる。これは、基準空間が空気であるため、空気以外のガスが混入したことを意味し、又前記基準空間を作成したパラメータのいずれか或は相互作用でいくつかのパラメータに変化が生じていることを意味する。
【0151】
即ち、前記該当排ガスの作成時に使用した各情報からの基準空間から、その距離が徐々に離れて行くので、前記該当排ガスとは異なった状態に変遷したものと判断出来る(図5に示す計算手段1400による)。
【0152】
この基準空間を基準としてシステムを継続的に動作させることにより、連続して前記排ガスの性状の変化を計測・監視することが出来る。
【0153】
又、従来の単一の警報値による管理法や、各パラメータの組合せによる警報の順位判定法に比べて、より総合的に排ガスの状態変化を捉えることが出来るので、又統計処理を容易に実現出来るので、信頼性が高いと共に汎用性に優れる。
▲5▼観測データの取りこみと基準空間との比較
(1)排ガスからの観測データを収集する。
【0154】
収集されたデータを前述と同様な方法でデータ加工を行い、収集されたデータのD^2 x(マハラノビスの距離)を計算する。
(2)この値D^2 xと前記“当該排ガスの固有空間の基準空間”の統計量D^2int(マハラノビスの距離)とを比較する。
(3)前記(1)項のD^2 xとD^2intに差異がない場合は、例えば“運転継続可能”と言う開示を行い、運転を継続する(図5に示す計算手段1400による)。
【0155】
更に、マハラノビス距離は前述の如く、計測される対象がどれくらい基準空間から隔離しているかを示す距離である。
【0156】
前記計測される対象が基準空間に属さない場合、
▲1▼その距離の隔離程度が計量値で判断出来る場合は、その値を信号の水準値として、各パラメータを増減した場合の主パラメータ(特徴要素)を算出する。
【0157】
前記信号値の水準値をMとし、その個数をl個或いはlカテゴリー(1、2、…l)とすれば、それらの対象に対して、マハラノビスの距離を線形式にて求める。
【0158】
L=M1*D1
上式より、前記項目の変動(増加、減少)に対して、比例項の変動と項目の変動と誤差変動を分散分析にて分離し、その寄与度を求め、主パラメータ(特徴要素)を取捨・選択する(図5に示す計算手段1400による)。
▲2▼その距離の隔離程度が計量値で判断出来ないが基準空間内に入っていないことが明白な場合は、各パラメータを使用する、使用しないという2水準のカテゴリーのもとに、各パラメータの前記隔離距離に対してその有効性を判断する(図5に示す計算手段1400による)。
【0159】
前記マハラノビスの距離は取り上げた全項目を用いて計算するので、項目の取捨選択時には、次の操作を必要とする。即ち、項目毎に、或いは項目のグループごとに、▲1▼その項目(その項目を含むグループ)を採用する▲2▼前記▲1▼を採用しないという2水準のカテゴリーを用いて、前記項目毎に、或いは項目のグループごとにその有意性を比較・計算し、取捨選択するれば良い。
【0160】
例えば、前記項目が30個の場合は、対応可能な2水準系の直交表L32を使用して、指定する項目或いはグループを用いて前記各直交表の各実験条件にてマハラノビスの距離を計算する。次に、各実験条件下における前記▲1▼、▲2▼の有意差を検定し、前記項目或いはその項目を含むグループ毎の寄与度を求め、取捨選択する。
【0161】
かかる操作では、最終的には取り上げられた全パラメータに対し、重要なパラメータを取捨・選択する。以後はこの取捨・選択したパラメータのみを用いてマハラノビスの距離を求めて行き、隔離距離の増大した時点で、その特徴パラメータを提示する(図5に示す計算手段1400による)。
【0162】
例えば、“CO変化”、“HCL変化”、“温度変化”等である。かかる情報にて、プラント側の操作・制御状態の変更を促す。
【0163】
図9は本システムを適用した場合の排ガスの計測・監視状態変化を示した図である。
【0164】
例えば、前述の基準空間の作成時のマハラノビスの距離を“D^2 int ”とし、かかる状況下の当該排ガスを“焼却場に投入するゴミ質は比較的軟で乾燥状態・定常焼却量で排出ガスの規制値を満足している運転状態下”を維持している場合に作成したものとする。
【0165】
次に、前記フォーマット1300にて、現在時点での排ガスの性状を示す状態変数を計測・収集する(図8の“観測データの読みこみ”部)。
【0166】
次に、図8に示す“D^2 Xiの計算”を行う。
【0167】
次に、図8に示す“基準空間との比較・診断・判定”を行う。この時、前記D^2 Xi が図9に示すD^2 int と有意差がないと(マハラノビスの距離の分布がD^2 int と有意差なし)判断出来る場合は、前記“焼却場に投入するゴミ質は比較的軟で乾燥状態・定常焼却量で排出ガスの規制値を満足している運転状態”を“維持”しているものと判断出来る。かかる場合は、プラント運転の操作パラメータをそのまま維持して運転を継続する。
【0168】
一方、図9に示すように、D^2 Xi が明らかにD^2 int と有意差がある場合(マハラノビスの距離の分布が D^2 int と有意差有り)と判断出来る場合は、前述の“焼却場に投入するゴミ質は比較的軟で乾燥状態・定常焼却量で排出ガスの規制値を満足している運転状態”からかけ離れた状態にあると判断出来る。このため、“投入ゴミ質やその量の相違”、“運転モードのパラメータ変更”や“プロセス監視機器の異常”等のいづれかの理由で、排ガスの性状が変化したものと推定される。かかる場合は、プラント運転の操作パラメータや機器等をそのまま維持して運転を継続するのは好ましくないので、処置が必要となる。
【0169】
かかる場合、各パラメータにて、基準空間作成時の平均値と標準偏差と観測・収集時の各パラメータ平均値と標準偏差を逐次比較することによって、或いは一般的な主成分分析手法によってもその主要因が推定可能であるので、その結果を開示する。
【0170】
更に、本実施例では、
▲1▼その距離の隔離程度が計量値或いはカテゴリー化(1、2、3、…)した数量化データで判断出来る場合は、その値を信号の水準値として、各パラメータを増減して、各パラメータ間での寄与率の大きいパラメータ(特徴要素)を抽出し、そのパラメータを開示することによって、処置の方向性を示唆する。例えば、図9に示すd^2 Xi の主要パラメータが“CO濃度”と“塩化水素”であるとすると、“CO濃度が変化してます。”、“HCL濃度が変化してます。”と開示すれば、運転者或いはメンテナンス者はその増減量を修正する操作を行い、且つHCL除去剤の投入量の増減操作を行う。
▲2▼その距離の隔離程度が計量値で判断出来ないが基準空間内に入っていないことが明白な場合は、各パラメータを使用する、使用しないという2水準のカテゴリーのもとに、各パラメータの前記隔離距離に対して、各パラメータ間での寄与率の大きいパラメータ(特徴要素)を抽出し、そのパラメータを開示することによって、処置の方向性を示唆する。例えば、図9に示すd^2 Xi +1の前記の主要パラメータが“Nox濃度”と“CiHi”と“ガス温度”であるとすると、“Nox濃度が変化してます。”、“CiHiの濃度が変化してます。”、“ガス温度が変化してます。”と開示すれば、運転者或いはメンテナンス者はその増減量を修正する操作を行い、且つガス温度の増減操作を行う。
【0171】
かかる操作▲1▼と▲2▼においては前記計測対象の“該当排ガスの性状状態”を隔離している重要なパラメータが逐次取捨・選択される。更に、前述の如く、排ガス中に存在するクロロベンゼン、クロロフェノール類の特定物質の増減量も、同時に、個別情報として開示される。
【0172】
このため、かかる重要なパラメータをプラントの運転者・管理者等に開示することにより、プラントの運転・操作を改善する処置策を誘導することが可能であり、操業の信頼性が向上する。
【0173】
更に、プラントの運転・操作が成熟するにつれて、前記“基準空間”と“重要なパラメータは各サイト毎に個々にカテゴリー化することにより計量値化出来るので、より一層の効率の良いプラント操業を達成出来る。又、プラントに依存しないので、汎用性が高い。
【0174】
かかる本実施例のシステムは、プラントを新設する場合やN倍プラントやN倍プロセスを立上時にも、これらのデータを活用することより、その計画段階から、保守費用や投資・回収等の経済性の指標の観点でも、排出ガスの管理と計画を実現出来、より効率の高い管理・計画業務が可能となる。
(その他の実施例)
本システムの他の実施例としては、図1に示す構成において前記各分析計、プロセス変量センサ群やプラント運転変量の情報群は適宜選択可能であり、限定されるものではない。
【0175】
又、これらの情報と計算手段はプラント全体を監視・制御する中央の上位管理機器内に具備することも可能である。かかる場合、特に前記質量分析計や上位の管理機器の負担が低減出来、よりリアルタイム性が期待出来ると共に、種々のプラント変量データやプロセスデータを大量に収集出来るので、より効率の高い一括集中形のプラント管理や計画や操業やサービス業務等が可能となる。
【0176】
図10には他の実施例を示す。
【0177】
本実施例では、前記質量分析計1000と、HCL計10001、CO計10002、NOX計・SOX計1003、酸素計1004等の排ガスの分析計は個々の試料接続管(3)10005、10006にて連結して、所定の流量の排ガスを導き、測定する構成としている。
【0178】
かかる構成によれば、前記排ガスの性状を求める基準空間の作成法と監視・判断・診断手法はその機能を損なうことはないが、各分析計を個々のプロセス毎に、或いはそのプロセスの特徴をより的確に捉える分析計とて配置することが出来るので、より確度の高い排ガスの性状を計測・監視することが出来るという効果がある。
【0179】
又、前記各分析計は既設のものでも適用可能であるため、拡張性に優れ、省力化の効果が大である。
【0180】
本実施例により、排ガス中のダイオキシン類、クロロフェノール類やクロロベンゼン類の特定物質を直接煙道から連続して採取することが出来、連続してモニタすることが可能である。
【0181】
又、本実施例によれば、前記ダイオキシン類、クロロフェノール類やクロロベンゼン類の特定成分以外の物質やプロセス変量情報やプラント運転変量をも同時に収集することにより、排ガスの性状をリアルタイムで連続して計測・分析・監視することが可能である。
【0182】
更には、プラントの動的な操作パラメータや処置法をリアルタイムにて開示することが出来、プラントの安定な操業や、大気汚染の低減が得られるという効果がある。
【0183】
【発明の効果】
本発明によれば、廃棄物を焼却する焼却炉から排出される排ガスの計測と監視を行う場合に、プロセス条件の変更・最適化のための指標を開示し、有害物質の排出の低減を図ることができる。
【図面の簡単な説明】
【図1】本発明の一実施例の排ガス計測・監視システムの構成例を示す図である。
【図2】質量分析計部の構成例を詳細に示す図である。
【図3】特定物質の計測例を示す図である。
【図4】特定物質の出力例を示す図である。
【図5】排ガスの性状情報を示す図である。
【図6】状態変数フォーマット例を示す図である。
【図7】排ガス性状空間の作成フローを示す図である。
【図8】排ガスの性状診断フローを示す図である。
【図9】排気ガスの状態変化例を示す図である。
【図10】本発明の他の実施例を示す図である。
【符号の説明】
1…針電極、2…電極(1)、3…電極(2)、4…第一細孔フランジ(1)、5…第二細孔フランジ、6…第三細孔フランジ、7…第四細孔フランジ、10…イオン化室、11…針ホルダー、12…バックガス2供給管、13…HV端子、14…針固定金具、15…イオン化フランジ、16…排出管(1)、17…ヒータ(1)、20…イオンドリフト部、21…電極1内細孔、22…端子板(1)、30…他のイオンドリフト部、31…電極2内細孔、32…端子板(2)、33…試料導入フランジ、34…試料導入管、35…ヒータ(2)、36…排出管(2)、41…第一細孔、42…スペーサ、43…第一細孔フランジ(2)、44…バックガス1供給管、51…第ニ細孔、52…サイド孔(2)、61…第三細孔、62…サイド孔(3)、71…第四細孔、72…サイド孔(4)、73…ヒータ、76…連結管、80…質量分析部、81、82、83…収束レンズ、84…レンズ電極、85…外筒電極、86…内筒電極、91…ゲート電極、92…エンドキャップ電極、92a,b…エンドキャップ電極の細孔、93…絶縁リング、94…リング電極、101…イオン変換器、103…バックガス3供給管、104…バックガス3接続管、105…バックガス3のボンベ、110…Hv電源、111…HV電源線、120…ドリフト電源(1)、121、122、123…電源線、130…ドリフト電源(2)、140…イオン検出器、210…ポンプ(1)、220…ポンプ、230…データ処理・制御部、301…可変絞り機器、302…フローメータ、400…試料接続管、401…可変絞り機器、402…フローメータ、921…つば電極、1000…採集管、1001…試料輸送管(1)、1002…吸引ポンプ、1003…試料輸送管(2)、1004…フィルター、1005…排出管(s)、1006…排気ファン、1007…排ガス排出管、1008…差圧発生体(絞り機構)、1009…ポンプ、1100…内試料発生器、1101、1102…内試料輸送管、1201、1202…通信、電気信号線、フィルター、1203…上位の管理機器、10000…質量分析計、10001…HCL計、10002…CO計、10003…NOX・SOX計、10004…酸素計、10005、10006…試料接続管(3)、20000…プロセスセンサ。[0001]
BACKGROUND OF THE INVENTION
The present invention relates to an exhaust gas measurement / monitoring system that measures and monitors exhaust gas discharged from an incinerator that incinerates general waste and industrial waste.
[0002]
[Prior art]
When waste is incinerated at a garbage incinerator, highly poisonous dioxins are generated in the exhaust gas, which causes environmental pollution, and has become a serious social problem in recent years. Here, dioxin is a general term for polychlorinated dibenzopararadixins (PCDDs) having 75 isomers and polychlorinated dibenzofurans (PCDFs) having 135 isomers, and in a broader sense, coplanar polychlorinated biphenyls (Coplanar). PCBs). Hereinafter, dioxins and related compounds are collectively abbreviated as dioxins.
[0003]
As a method for measuring dioxins from exhaust gas, various forms have been attempted in recent years, for example, as disclosed in JP-A-10-267245. In Japanese Patent Laid-Open No. 10-267245, a plurality of parameters such as measured values obtained from an exhaust gas analyzer, a CO concentration meter, etc. for measuring the concentration of chlorobenzene and chlorophenols, the furnace outlet temperature, and the amount of secondary combustion air are used. In addition, it is disclosed that the production of dioxins in exhaust gas is suppressed by adjusting the amount of secondary combustion air.
[0004]
[Problems to be solved by the invention]
In the prior art, the incinerator is controlled according to a specific arithmetic expression using parameters that change from time to time, such as measured values sampled from the furnace outlet. That is, since a unique arithmetic expression is used, the control method itself does not change. Further, the correlation of each parameter is also based on a predetermined inherent correlation and does not change.
[0005]
However, in actual equipment, exhaust gas passes through many spaces with different temperatures from the start of combustion in the incinerator until it is exhausted into the atmosphere through the chimney, and exhausts through many chemical reaction processes in the exhaust gas. Is done. Even if the process conditions are constant, the properties of the exhaust gas may change over time. Exhaust gas that has undergone such a complicated process has various changes in properties, and the correlation between parameters obtained from the measuring device is not necessarily uniform, but changes dynamically. Therefore, in order to reduce dioxins, it is necessary to analyze the trend of accurate parameter correlation, and to change and optimize the process conditions.
[0006]
In the conventional technique, the calculation method for performing the control is constant, and it is difficult to follow such a dynamic change.
[0007]
The object of the present invention has been made in view of the above-mentioned problems, and is intended to change and optimize process conditions in a system for measuring and monitoring exhaust gas discharged from an incinerator that incinerates waste. To reduce the emission of harmful substances.
[0008]
[Means for Solving the Problems]
The problem is that when measuring and monitoring exhaust gas discharged from an incinerator that incinerates waste, the exhaust gas component is measured over a plurality of items, and a reference numerical value is created based on the component of each item. Thereafter, this is achieved by monitoring the exhaust gas based on this reference numerical value.
[0009]
Specific examples are described below.
(1) System configuration
In order to achieve the above object, in a specific example,
Chlorophenols, which are precursors of dioxins in exhaust gas, chlorobenzenes, and hydrocarbons, which are indicators of unburned substances, are ionized from atmospheric pressure to low vacuum, and the ions are quantified by mass spectrometry to detect exhaust gases. A mass spectrometer that continuously determines the concentration of dioxins, chlorophenols, chlorobenzenes and hydrocarbons
In the mass spectrometer, the other components (water chloride parameter element, hydrogen bromide, sulfuric acid, moisture, oxygen, carbon monoxide, etc.) obtained at the same time as the ions of the dioxins, chlorophenols and chlorobenzenes are analyzed by the mass spectrometry. Collected by the total data processing department and its higher management equipment department,
Further, in a pipeline system for transporting a measurement gas (exhaust gas) from the flue to the mass spectrometer, a Nox meter, a Sox meter, an HCL meter, and a CO meter that continuously monitor the components of the exhaust gas. The oxygen analyzer is branched and installed to collect the components / concentrations, or collected in a separate piping system different from the collection position, and the information is collected by the data processing unit of the mass spectrometer. And the higher management equipment department,
Further, the set temperature of the electrostatic precipitator which is the operation variable of the plant, the process flow rate and the process temperature of the exhaust gas line are collected and collected by the data processing unit of the mass spectrometer, and the exhaust gas based on these information is collected. The calculation means for analyzing and judging the “property” is provided in the mass spectrometer and its upper management equipment section,
The result of the calculation means is configured to be transmitted / disclosed to other higher-level management devices and control device devices.
(2) Functional configuration
(2-1) Detection of specific components in exhaust gas by mass spectrometer
In the mass spectrometer, dioxins, chlorophenols, and chlorobenzenes having chlorine and oxygen elements in a plurality of molecules in exhaust gas are detected with high sensitivity. Chlorine and oxygen are elements having high electronegativity, and an organic compound containing a large number of these elements easily captures low-energy thermoelectrons and becomes negative ions. Chlorophenols have one or more chlorine atoms and one oxygen atom in the molecule. Chlorobenzenes have one or more chlorine atoms in the molecule. Extremely toxic dioxins have 4 to 8 chlorine atoms and 2 oxygen atoms in the molecule. For this reason, dioxins and the like are efficiently ionized by thermoelectrons generated by negative corona discharge at atmospheric pressure, and continuous monitoring becomes possible by taking the amount of ions into the mass spectrometer without attenuation. At this time, in the mass spectrometer, molecules having high electronegativity such as
[0010]
Furthermore, in this mass spectrometer, unburned substances (hydrocarbon compounds) in the exhaust gas are efficiently ionized by thermal electrons generated by switching to positive corona discharge, and the ions are taken into the mass spectrometer. Allows continuous monitoring.
[0011]
At this time, the ion acceleration voltage applied to each electrode and the lens system is switched from negative to positive in synchronization with switching of the needle-like electrode from negative corona discharge to positive corona discharge.
[0012]
According to the above configuration, when a positive voltage is applied to the needle electrodes, the sample ionized into positive ions is accelerated in the path where the voltage of each electrode reaches the detection unit of the mass spectrometry system, and the generated ions are efficiently generated. Can be detected.
[0013]
Preferably, the switching of the applied voltage to the needle unit includes a power source that outputs a positive high voltage, a power source that outputs a negative high voltage, and a switching mechanism that switches the connection between the two power sources and the needle unit, The switching mechanism operates in synchronization with the polarity switching of the ion acceleration voltage and the drift voltage switching.
[0014]
When measuring positive ions, a positive high voltage is applied to each electrode as an ion acceleration voltage so that “
[0015]
As a result, ions generated in the ionization chamber can be measured with high sensitivity for both positive and negative ions.
(2-2) Extraction of characteristic components other than specific substances in exhaust gas by process sensor
Secondly, in addition to the components in the exhaust gas, generally, process data is obtained from an HCL meter, NOX meter, SOX meter, CO meter, oxygen meter, etc. provided in the plant as an exhaust gas monitoring sensor. .
[0016]
(2-3) Process variable information
Third, separate from the data from the mass spectrometer and the data from each process sensor, are operational variables that operate, operate and adjust the plant, for example, the operating temperature of the electrostatic precipitator and the input steam flow rate. And obtain data such as temperature distribution and flow rate in the flue.
(2-4) Calculation means
The data group from the mass spectrometer, the process sensor, and the process variable information in the items (2-1) to (2-3) is stored in a data processing unit of the mass spectrometer or a higher management device via a converter. The Such data varies depending on the amount and quality of garbage put into the incineration plant, and the plant operation at that time is variously different.
[0017]
According to the prior art, since each piece of information is handled in a single handling, it takes a lot of time just to find the correlation between these data, and the best operation It took more time to search for the parameters.
[0018]
The calculation means of this system is a calculation means for diagnosing or judging the property state of the exhaust gas based on the data indicating the property of the exhaust gas and information data resulting from operation / operation.
[0019]
Create a “proprietary space when the exhaust gas is in operation” using information from the various analyzers and plant variables at the time of the exhaust gas, and then calculate each characteristic calculated from the difference from the “proprietary space when the exhaust gas is in operation”. The isolation values of the space were sequentially compared, and this isolation value disclosed a main parameter (characteristic element) in each parameter or element that forms the “proper space when the exhaust gas is in operation”.
[0020]
The detailed flow of this method is shown below.
(A) Collecting data to create a specific space for the exhaust gas
When the properties of the exhaust gas change in an operation mode of an arbitrary plant, data for creating a space of “the specific space of the exhaust gas” at that time is collected. This “exhaust gas unique space” is different in various incineration plant configurations, incinerators, and operation methods, but the properties are appropriately categorized by each incinerator unit to define “exhaust gas unique space”. I can do it.
[0021]
For example, in daily operation mode
(1) Garbage to be put into the incineration plant is relatively soft, dry, and satisfies the regulation value of exhaust gas with steady incineration amount
(2) The quality of garbage put into the incineration plant is relatively soft and damp, and the amount of steady incineration satisfies the regulation value of exhaust gas
(3) The quality of garbage put into the incineration plant is relatively hard, dry, and in a state where the amount of steady incineration satisfies the emission regulations.
(4) The waste quality to be put into the incineration plant is categorized into a relatively hard and damp state, a state in which the amount of steady incineration satisfies the exhaust gas regulation value, etc. Eigenspace ”. Alternatively, the operation time completely opposite to the above (1) to (4) can be set as “the proper space of the exhaust gas”.
(B) Create a data group of the reference space of the “proprietary space of the exhaust gas” in section (A) above
The data group in (A) is normalized to each “proper space of the exhaust gas” by its average value and standard deviation.
(C) Create a reference space for the “proper space of the exhaust gas”
The statistic D ^ 2 (Mahalanobis distance) of the “proper space of the exhaust gas” is obtained from the data group of the item (B). The Mahalanobis distance is a two-dimensional matrix determined only by the number of each element, and the distance is calculated according to the number of data used. The average value is “D ^ 2”, the average value is “about 1”, and the standard deviation is σ.iint.
[0022]
Further, after the calculation, a value other than the expected value observed in the “proper space of the exhaust gas” is set, or the statistic D ^ 2intair when “no exhaust gas is introduced” is obtained. The average value is “about 1”, and the standard deviation is σint.
[0023]
This value (D ^ 2intair) indicates the absolute “separation distance” of each “proper space of the exhaust gas” and is an index indicating the difference.
[0024]
In the creation of such a reference space, specific substances such as chlorophenols in the exhaust gas are separately calibrated by an internal sample, and thus may not be used at the time of the creation. Alternatively, it is also possible to input a value in the calibratable range and use it as a reference space.
[0025]
Further, at this time, the characteristic parameters of D ^ 2int are extracted and stored by using the “proper space of the exhaust gas” D ^ 2_int and the data used for creating the D ^ 2 intair. With this operation, the characteristic parameters leading to this D ^ 2 int are found.
(D) Collection and monitoring of observation data
Collect observation data from exhaust gas (generally different from the data used when creating the reference space).
[0026]
Data processing is performed on the collected data in the same manner as the above-mentioned items (A) and (B), and D ^ 2 x (Mahalanobis distance) of the collected data is calculated.
(1) This value D ^ 2 x is compared with the statistic D ^ 2int (Mahalanobis distance) of the "reference space of the" proper space of the exhaust gas "" obtained in the item (C).
(2) When there is no difference between D ^ 2 x and D ^ 2int in the item (1), for example, the disclosure that "operation can be continued" is made.
[0027]
On the other hand, when there is a difference, for example, the disclosure of “operation change” is performed, and the main factor that led to the separation distance is disclosed. For example, “CO change”, “HCL change”, and the like. With this information, it is urged to change the operation / control state on the plant side.
[0028]
The “reference space” is defined such that the average vector of measurement values is zero, and the average of the Mahalanobis distance of objects belonging to the reference space is 1. For this reason, it is the same regardless of the reference space, but since the ideal state corresponding to the zero point is unknown, an operator, engineer or expert of each plant defines the reference space and measures the reference space. From the data, determine the zero point and unit quantity.
[0029]
As described above, the Mahalanobis distance is a distance indicating how far the object to be measured is separated from the reference space. When the object to be measured does not belong to the reference space,
{Circle around (1)} When the degree of isolation of the distance can be determined from the measured value, the main parameter (feature element) when each parameter is increased or decreased is calculated using that value as the signal level value.
(2) If it is clear that the distance is not determined by the measured value, but it is clear that it is not within the reference space, each parameter is used under the two-level category of using and not using each parameter. The effectiveness of the isolation distance is determined.
[0030]
In this operation, important parameters can be selected and selected with respect to all the parameters finally taken up.
[0031]
It is also possible to obtain the Mahalanobis distance by the above-described procedure using only the selected and selected parameters.
[0032]
In the mass spectrometer, dioxins, chlorophenols, and chlorobenzenes having chlorine and oxygen elements in the exhaust gas in a plurality of molecules are elements having high electronegativity, and organic compounds containing many of these elements are low energy heat. Since electrons are easily captured and become negative ions, they are efficiently ionized by thermionic electrons generated by negative corona discharge, and by taking in the amount of ions, the amount can be highly sensitive and continuously calibrated.
Furthermore, molecules with high electronegativity such as H2SO4, HBR, H2SO4, NOX, SOX, CO3 in the exhaust gas are also easily negative ions, and are ionized at the same time. Continuous monitoring is possible. In addition, since the absolute amounts of harmful specific substances such as dioxins, chlorophenols and chlorobenzenes are calibrated inside the analyzer, the properties of the exhaust gas are defined even with only such amounts. It is possible.
[0033]
Such detected ionic species is a component showing the properties of exhaust gas.
[0034]
Furthermore, in this mass spectrometer, the components in the exhaust gas are efficiently ionized with thermionic electrons generated by switching to positive corona discharge, and the amount of ions is taken into the analyzer, so that the unburned substances in the exhaust gas are The hydrocarbon compound as an index is also highly sensitive and can be continuously monitored.
[0035]
Such detected ionic species is a component showing the properties of exhaust gas.
[0036]
In other words, dioxins, chlorophenols, chlorobenzenes, H2SO4, HBR, H2SO4, NOX, SOX, CO3 and hydrocarbon compounds contained in exhaust gas can be detected with high sensitivity, and exhaust gas components and their properties are continuously detected. Measurement and monitoring are possible.
[0037]
In addition, in this system, information other than the components indicating the properties of the exhaust gas from the mass spectrometer is data from general monitoring sensors such as HCL meters, NOX meters, SOX meters, and CO meters provided in the plant. Can be added to the component exhibiting the above properties, the amount of information indicating the properties of the exhaust gas is increased, and the accuracy is further improved.
[0038]
Furthermore, apart from the information other than the components indicating the properties of the exhaust gas described above, the operating temperature of the plant equipment, the flow rate of the input steam, the temperature distribution in the flue, the flow rate, etc. Since data can be added to the components indicating the above properties, information indicating the properties of exhaust gas and information on process variables can be integrated to build up more comprehensive measurement, monitoring and operation. .
[0039]
Based on the above data representing the properties of exhaust gas and information data resulting from operation / operation, the above-mentioned calculation means monitors or judges the “characteristic state of the exhaust gas”.
[0040]
The “characteristic state of the exhaust gas” defines an “inherent space or reference space” by an operator, engineer or expert of each plant. The “proprietary space or reference space” is, for example, a raw material measured in “an operating state in which the waste quality to be put into the incineration plant is relatively soft, in a dry state, and in a steady incineration amount and satisfies the emission emission control value” Or a quantified data value group obtained by categorizing the indicated values (1, 2, 3,...).
[0041]
As described above, the “reference space” is defined such that the average vector of measured values is zero, and the average of the Mahalanobis distances of objects belonging to the reference space is 1. For this reason, it is the same regardless of the reference space, but since the ideal state corresponding to the zero point is unknown, an operator, engineer or expert of each plant defines the reference space and measures the reference space. The zero point and unit quantity are determined from the data.
[0042]
Accordingly, at the time of measurement, the Mahalanobis distance is an index indicating how far the object to be measured is separated from the reference space.
[0043]
For this reason, when the object to be measured does not belong to the reference space, it can be determined that the property of the exhaust gas at the time of measurement has changed (whether the changed content is a component of exhaust gas or a process variable). unknown).
[0044]
next,
(1) If the degree of isolation of the distance can be determined from the measured value or quantified data that is categorized (1, 2, 3, ...), the value is the main level when each parameter is increased or decreased using that value as the signal level. Calculate parameters (feature elements).
(2) If it is clear that the distance is not determined by the measured value, but it is clear that it is not within the reference space, each parameter is used under the two-level category of using and not using each parameter. The effectiveness is judged with respect to the isolation distance of and the main parameter (feature element) is calculated.
[0045]
In this operation, an important parameter that isolates the “characteristic state of the exhaust gas” to be measured is selected and selected. For this reason, by disclosing this important parameter to the plant operator / manager, etc., it is possible to induce a measure for improving the operation / operation of the plant.
[0046]
Furthermore, as the operation and operation of the plant matures, the “reference space” and “important parameters” are categorized.LeeConversioncomeTherefore, efficient plant operation can be achieved.
The multivariate analysis method using the Mahalanobis distance used above is disclosed in, for example, Japanese Patent Application Laid-Open Nos. 10-124766 and 2000-46701.
[0047]
DETAILED DESCRIPTION OF THE INVENTION
Embodiments of the present invention will be described below with reference to the drawings.
(System configuration example)
FIG. 1 is a diagram showing a system configuration for automatically and continuously analyzing and measuring chlorobenzenes, chlorophenols, hydrocarbons and other components in exhaust gas.
[0048]
FIG. 2 is a diagram showing a detailed configuration example of the mass spectrometer unit.
[0049]
This will be described below with reference to FIGS.
[0050]
This system mainly includes a
[0051]
A
[0052]
The sample introduced through the
[0053]
Part of the sample introduced into the
[0054]
The sum of the flow rate introduced into the
[0055]
These flow rates are set by a
[0056]
The sample introduced into the
[0057]
The sample including the detection body is ionized in a corona discharge region generated between the electrode (1) 2 and the
[0058]
In the corona discharge region generated between the electrode (1) 2 and the
[0059]
Meanwhile, O2- + CP (chlorophenols) → (CP_H)- The ions generated by + HO2 are overcome by the electric field generated between the electrode (1) 2 and the
[0060]
In addition, when contaminants such as hydrogen chloride are present in the exhaust gas, ion / molecule reactions occur between the O2 ions and the contaminants, and ionization of the chlorophenols and the like changes.
[0061]
For this reason, O2- + HCL → CL- The reaction of + HO2 is preferably reduced by a remover provided in the
[0062]
This will be described with reference to FIG. The
[0063]
At the tip of the back gas (2)
[0064]
In such a configuration, pure gas such as dry air and argon is always supplied to the tip of the
[0065]
The needle holder tube 11 is attached to a
[0066]
The sample that has passed through the ionization section is discharged from a discharge pipe (1) 16 provided on the
[0067]
Further, the
[0068]
Further, in such a configuration, the
[0069]
The ionized detector, oxygen, HCL, and other molecules pass through the pore 21 and flow into the
[0070]
Next, these ionized molecules are taken into the first stage of a differential exhaust chamber described later. There is no problem if the pore size of the first stage of the differential exhaust chamber is the same as the diameter of the pore 21, but generally the exhaust capacity of the pump provided in the differential exhaust chamber is limited. 1/10 to 1/100. For this reason, it is necessary to converge the generated ions before taking them into the first stage of the differential exhaust chamber. The generated ions contain corrosive gas such as HCL. When these gases flow into the differential exhaust chamber or a mass analysis unit described later, the detection sensitivity deteriorates and the durability of the device itself decreases. Furthermore, there is a concern that maintenance and replacement of each part in the vacuum chamber will be extremely deteriorated. For this reason, in this embodiment, a configuration (ion drift portion 20) for converging the ions flowing out to the
[0071]
Ions that have passed through the
[0072]
In the illustration of the present invention, the pure gas body is drawn into a sealed minute space between the electrode (2) 3 and the
[0073]
In such a configuration, pure gas such as dry air, argon, nitrogen, and helium is constantly supplied into the space via the back gas (1)
[0074]
Further, as shown in FIG. 2, the back gas (1)
[0075]
On the other hand, the ionized molecules extracted to the pores 31 of the electrode (2) 3 are mixed in a gas stream line such as dry air, argon, nitrogen, helium. At this time, since the streamlines are concentrated in the first pores 41, they are efficiently taken into the first pores 41 (because they are mixed along the streamlines) (ion drift 30).
[0076]
Further, as shown in FIG. 2, the electrode (2) 3 applies a voltage from the outside via the terminal plate (2) 32 and the
[0077]
That is, the ionized molecules extracted to the pores 31 of the electrode (2) 3 are the fluid force of the gas flow such as dry air, argon, nitrogen, helium, the first pore 41 and the electrode (2) 3. With the assistance of the electric field force, it is transported to the first pore 41 with high efficiency. Further, since the sample gas does not flow in, the vacuum chamber is filled only with a high-purity inert gas dilute fluid, and the influence of the chemical noise or the back gas is reduced, and long-term continuous operation is possible.
[0078]
In such a configuration, when positive ions are measured, the voltage of the electrode (1) 2 is set higher than that of the electrode (2) 3, and the electrode (1) 2 is actually 1000 V (V1) and the electrode (2). 3 is about 300V (V2), and the voltage of the
[0079]
Such a positive / negative switching operation can be executed by the
[0080]
Further, since the temperature of the
[0081]
The pipes, the
[0082]
Positive or negative ions generated as described above are taken into the first pore 41.
[0083]
In the present embodiment, the shape and arrangement of the exhaust system introduced into the mass analysis section (chamber) of the high vacuum chamber by passing the ions taken into the first pore 41 through the vacuum chamber where the pressure is gradually reduced. On the other hand, a differential exhaust chamber configuration that can further improve ion permeability has been achieved.
[0084]
In such a configuration, the pressure in the first differential chamber between the first pore 41 and the second pore 51 is about 0.1 to 10 Torr, and the second difference between the second pore 51 and the
[0085]
This ion beam is ejected from the fourth pore 71 (φ0.2 to 0.6) and becomes a molecular flow in the
[0086]
In such a configuration, an ion having a behavior similar to that of an ion beam under a high pressure (viscous flow) has a longer mean free path when the pressure gradually decreases. At this time, when an electric field is generated in the direction of accelerating the ions, the ions accelerate and fly in the electric field and repeatedly collide with neutral molecules. By this collision, water molecules and the like can be desorbed, and the convergence is improved as the pressure is lowered as in the above-described ionization portion. Therefore, the
[0087]
In addition, the respective pores in each of these flanges are arranged coaxially so as to suppress misalignment of the ion transmission region due to eccentricity. Furthermore, these potentials are adjusted and set from the outside to change the degree of desolvation due to collisions between ions and neutral molecules, and even if ion convergence and assembly errors occur. The error can be absorbed.
[0088]
An exhaust pump such as a rotary pump, a scroll pump, a mechanical booster pump, or a turbo molecular pump can be used as the exhaust pump provided in the differential exhaust section. In FIG. 2, a
[0089]
Further, the flanges are provided with pores 52, 62, 72 for adjusting the pressures, and the pressures of the chambers can be adjusted in accordance with the capacity of the exhaust pump to be applied.
[0090]
The ions in the molecular flow region flowing out from the final stage of the differential exhaust chamber are first converged by the first converging
[0091]
Next, the focused ions further pass through a
[0092]
The ions that have passed through the
[0093]
Ions that have passed through the double cylindrical polarizer are introduced into an ion trap mass spectrometer. The ion trap mass spectrometer includes a
[0094]
The
[0095]
The ions introduced into the ion trap mass analyzer through the
[0096]
The pressure inside the ion trap mass spectrometer when the buffer gas is introduced is 10- Three~Ten - FourAbout Torr.
[0097]
The measurement sequence, data processing, and voltage control of the ion trap mass analysis unit are executed by the data processing /
[0098]
One of the merits of the ion trap mass spectrometer is that it has the property of trapping ions, so that it can be detected by extending the accumulation time even if the sample concentration is low. Therefore, even when the sample concentration is low, high-concentration of ions can be performed at the ion trap mass spectrometer, and the sample pretreatment such as concentration can be greatly simplified.
[0099]
For mass analysis of the generated ions, various types of mass analyzers can be applied.For example, a quadrupole mass spectrometer that performs mass separation using the same high-frequency electric field, mass dispersion in a magnetic field, or the like. The same applies to the case of using a magnetic field type mass spectrometer or other mass spectrometer.
[0100]
A description will be given with reference to FIG. Gas molecules ionized by the ion source and unreacted gas are discharged from the discharge pipe (s) 1005 through the discharge pipe (2) 36 of the
[0101]
Further, this gas is sucked by a
[0102]
One end of the
[0103]
The flow rate of the
[0104]
The back gas (1), (2) has a pump 1009 on the upstream side of the connecting
[0105]
The piping system (the flow path constituted by 1001 to 1008, 1007) has a function to send the collected sample gas to the monitor unit stably and without any loss due to adsorption, condensation, etc. of the substance to be measured on the way. Plays. For this reason, the whole sample collection part is heated by about 100 to 300 degreeC.
[0106]
In the mass analysis unit (monitor), the measurement target substance in the supplied sample gas is selectively and efficiently ionized, and the generated ions are subjected to mass analysis in the mass analysis unit, thereby continuously measuring the measurement target. To detect.
[0107]
The abundance of the target substance can be quantitatively determined from the ion current value in the mass number derived from the measurement object and the relationship (calibration curve) between the amount of the standard substance prepared in advance and the ion current value.
[0108]
For example, in the case of 2,3-dichlorophenol (molecular weight: 162, observed ion mass number 161), a change in ion intensity with respect to the concentration of the sample gas is measured to create a calibration curve. The concentration data of the sample gas at that time is calculated from this calibration curve and the observed ion intensity. The obtained data is further organized, processed by the data processing /
[0109]
When an ion trap mass spectrometer is used, higher selectivity can be obtained as compared with a normal mass spectrum. This is an MS / MS method in which energy is injected into molecular ions trapped inside the ion trap mass spectrometer and collides with molecules in the buffer gas (such as He) in the electrode to dissociate the molecular ions. In the case of an organic chloride compound, ions from which one or two chlorine atoms are eliminated from molecular ions are observed by MS / MS. For example, in the case of 2,4 dichlorophenol, when ionized using a negative corona discharge, (M-H)-, (M: molecule, H: hydrogen). When this negative ion is dissociated by the MS / MS method, a negative ion from which one chlorine atom is eliminated is generated. Observing these negative ions can provide very high selectivity. By quantifying the amount of negative ions from which one chlorine atom is eliminated from the peak intensity, the amount of dichlorophenol in the exhaust gas can be estimated. If there are multiple molecular species to be measured, this measurement process is repeated.
[0110]
As mentioned above, although the case where the atmospheric pressure chemical ionization method of negative ionization mode was used was mainly described, various components are contained in exhaust gas. For this reason, it is possible to perform continuous measurement in the positive ionization mode by the present mass spectrometer for hydrocarbon-based aromatic compounds typified by benzene and the like and compounds having a small number of chlorines. For example, in the case of hydrocarbon ions, which are mainly unburned substances, and benzene and monochlorobenzene, M + ion species are generated by atmospheric pressure chemical ionization in the positive ionization mode.
[0111]
Therefore, in actual sample gas measurement, each voltage is supplied from the
[0112]
FIGS. 3A and 3B show examples of characteristic confirmation results of the specific ions in this apparatus alone.
[0113]
In the measurement condition method, dichlorophenol (concentration: 5 μg / Nm 3) was mixed with air in the
[0114]
FIG. 3A shows the change in the concentration. As can be seen from the figure, the resolution is about 0.2 μg /
[0115]
FIG. 3B shows an output example of the mass spectrum.
[0116]
The measurement conditions were the same as above, but as a sample, trichlorophenol and tetrachlorophenol were added in addition to dichlorophenol. In the figure, the vertical axis represents relative ionic strength normalized by ionic strength. As shown in the figure, it can be seen that the peaks of mass spectra of dichlorophenol (DCP), trichlorophenol (TCP), and tetrachlorophenol (TeCP) are clearly analyzed. Furthermore, the spectrum of oxygen and nitrogen in the air as the sample medium was also observed, and a very good mass spectrum was obtained.
[0117]
FIG. 4A shows another output example of the mass spectrum.
[0118]
The measurement conditions and method are as follows. The
[0119]
In the figure, the vertical axis indicates the relative ionic strength normalized by the ionic strength, the white portion is the observed value under the condition of FIG. 3B, and the black portion is the result of observing the pseudo exhaust gas. .
[0120]
As shown in the figure, the mass spectrum peaks of dichlorophenol (DCP), trichlorophenol (TCP), and tetrachlorophenol (TeCP) are clearly analyzed, and the spectrum of oxygen and nitrogen in the air that is the sample medium The spectrum of the added sample and the hydrocarbon system (switched to positive ions) are also observed. Furthermore, good mass spectra of HCL ions, H2SO4 ions, and HBr ions can be obtained at the same time. It was confirmed that it was clearly significant.
[0121]
The spectral intensities of oxygen and nitrogen are attenuated as compared with FIG. 3B, but this is presumed that the spectral intensities have been reduced due to the concerted reaction with acid ions such as the HCL ions. Is done.
[0122]
FIG. 4B is a diagram showing a temporal change in a predetermined observed ion intensity when the mixing ratio and each concentration are intentionally changed under the conditions of FIG. 4A. Under any operating condition, it was confirmed that the intensity change varied depending on the operating condition and was sufficiently followed.
[0123]
In the present invention, as shown in FIG. 1, in addition to the
[0124]
Outputs of the various process sensor groups are connected to the data processing /
[0125]
Further, in this system configuration, in order to accurately grasp the properties of the exhaust gas, the measured amounts of the electrostatic precipitator temperature, the input steam flow rate, the line temperature (for example, the
[0126]
Conventionally, such various information is often handled in a single and single manner, and it has been impossible to accurately and comprehensively grasp the properties of the exhaust gas.
[0127]
In this embodiment, these pieces of information and data are collected in the data processing /
[0128]
As described above, the properties of this exhaust gas differ depending on the amount of waste input and the quality of each incinerator, the configuration of the incinerator, the type of removal filter used, and the operating conditions. However, in any case, the emission concentration is regulated by the official regulation value, and process operation / operation that satisfies the regulation value is necessary.
[0129]
This process operation / operation has been standardized to some extent by the experience and wisdom of professional engineers and practitioners in each incineration plant, but the nature of the process depends on the experience and knowledge of practitioners and the practitioners. Variations will occur. Alternatively, even if multivariate variable handling is performed, the number of parameters for each factor is large, a highly accurate correlation cannot be obtained, and it is difficult to correlate each factor with the properties of exhaust gas. Further, since it takes a lot of time (for analysis / analysis etc.), the work is mainly offline and time-consuming, so the efficiency is poor.
[0130]
For this reason, in the present Example, in order to grasp the property of exhaust gas more accurately, it is realized by the following method.
[0131]
5 and 6 are diagrams showing a concept for determining the properties of the exhaust gas from the information from each analytical instrument.
[0132]
In FIG. 5, the property information of the exhaust gas is composed of (1) gas component analysis result information from the mass spectrometer, (2) information from the process variable sensor, and (3) plant operation variable information. Is a data group for determining the properties of the exhaust gas.
[0133]
Such a data group is collected at the time of the relevant exhaust gas property and creates a state variable (the reference space) of the relevant exhaust gas property. Next, by sequentially comparing the reference space data and the data collected at the time of normal measurement / monitoring, the reference space data is processed by calculation means described later, and the difference from the relevant exhaust gas property (the reference space) is calculated. to decide. Therefore, it goes without saying that each data is disclosed individually even at this point.
[0134]
Further, the main parameter or characteristic element (in the data group (1) to (3)) that induces the difference (isolation value) is calculated.
[0135]
FIG. 6 shows the details of the “data format” of the state variable.
[0136]
The format example 1300 in the work file of the data processing /
[0137]
In the state variable of “exhaust gas characteristic eigenmode determination parameter = reference space” of the exhaust gas, it is registered as “row” for each measurement, and this “row” is arranged for each state variable (column). .
[0138]
In this figure, “
[0139]
FIG. 7 shows a method of creating a “reference space” for determining the relevant exhaust gas properties from “
[0140]
In FIG.
{Circle around (1)} The exhaust gas properties are edited in the format of the
[0141]
The condition of X (i, j) is
p> = n, and p is preferably a data number of 2 to 3 times or more of n.
[0142]
The “proper space of the exhaust gas” is different in various incineration plant configurations, incinerators, and operating methods, but the properties are appropriately categorized by each incineration unit to define the “reference space of the exhaust gas”. I can do it.
[0143]
For example, in daily operation mode
(1) Garbage to be put into the incineration plant is relatively soft, dry, and in a state where the amount of steady incineration satisfies the exhaust gas regulation value
(2) The quality of garbage put into the incineration plant is relatively soft and damp, and the amount of steady incineration satisfies the exhaust gas regulation value
(3) The quality of garbage put into the incineration plant is relatively hard, dry, and in a state where the amount of steady incineration satisfies the regulation value of exhaust gas
(4) The quality of garbage put into the incineration plant is categorized into a relatively hard and damp state, a state in which the amount of steady incineration satisfies the exhaust gas regulation value, etc. “Space”. Alternatively, an operation time completely opposite to the above (1) to (4) may be set as the “exhaust gas reference space”.
[0144]
Alternatively, the “reference space” can be defined as the reference space by the operator, engineer or expert of each plant and the property of the exhaust gas at the time of a predetermined operation (the
{Circle around (2)} X (i, j) is converted and normalized by a statistical method, and its matrix is assumed to be X ′ (i, j).
[0145]
X ′ (i, j) = (X (i, j) −μj) / σj
Here, μj is p average value for each parameter.
σj is p standard deviations for each parameter
(3) Calculation of D ^ 2 (Mahalanobis distance)
((3) -1) A correlation matrix R (s, t) between each parameter is calculated from X ′ (i, j).
[0146]
At this stage, the matrix becomes an nxn square matrix (correlation matrix) corresponding to the number of parameters.
[0147]
[0148]
D ^ 2 i = X "(i, j) * R ^ (s, t) * X '(i, j) / j
(4) The value of the p D ^ 2 i is a reference space for expressing the unique state of the device.
[0149]
The Mahalanobis distance is a two-dimensional matrix determined only by the number of each element, and the distance is calculated according to the number of data used. The average value of the distance is about 1, and the standard deviation is a distribution “D ^ 2 int” which can be regarded as a normal distribution of σint.
[0150]
For example, after the calculation, a value other than the expected value observed in the “proper space of the exhaust gas” is set, or the statistic D ^ 2 intair for “when no exhaust gas is introduced” is obtained. The average value is “about 1”, and the standard deviation is σint. However, if the reference space is “D ^ 2 int =” D ^ 2 intair ”and the above-mentioned pseudo exhaust gas (A in FIG. 4) is introduced, an enormous separation distance (on the right side in FIG. This means that the reference space is air, which means that a gas other than air has been mixed in, and some of the parameters that created the reference space or the number of interactions. It means that some parameter has changed.
[0151]
That is, since the distance gradually deviates from the reference space from each information used when creating the relevant exhaust gas, it can be determined that the state has changed to a state different from the relevant exhaust gas (calculation means shown in FIG. 5). 1400).
[0152]
By continuously operating the system with reference to this reference space, it is possible to continuously measure and monitor the change in the properties of the exhaust gas.
[0153]
Compared to the conventional management method using a single alarm value and the alarm ranking method using a combination of parameters, it can capture the exhaust gas state change more comprehensively, and also realizes statistical processing easily. Because it is possible, it is highly reliable and versatile.
(5) Comparing observation data and reference space
(1) Collect observation data from exhaust gas.
[0154]
Data processing is performed on the collected data in the same manner as described above, and D ^ 2 x (Mahalanobis distance) of the collected data is calculated.
(2) This value D ^ 2 x is compared with the statistic D ^ 2int (Mahalanobis distance) of the "reference space of the eigenspace of the exhaust gas".
(3) When there is no difference between D ^ 2 x and D ^ 2int in the above item (1), for example, the disclosure that “operation can be continued” is performed and the operation is continued (by calculation means 1400 shown in FIG. 5). .
[0155]
Further, as described above, the Mahalanobis distance is a distance indicating how far the object to be measured is separated from the reference space.
[0156]
When the object to be measured does not belong to the reference space,
{Circle around (1)} When the degree of isolation of the distance can be determined from the measured value, the main parameter (feature element) when each parameter is increased or decreased is calculated using that value as the signal level value.
[0157]
If the level value of the signal value is M and the number thereof is l or l category (1, 2,..., L), the Mahalanobis distance is obtained in a linear form for those objects.
[0158]
L = M1 * D1
From the above formula, the variation of the proportional item, the variation of the item, and the error variation are separated by analysis of variance for the variation (increase and decrease) of the item, the contribution is obtained, and the main parameter (feature element) is discarded. Select (by calculation means 1400 shown in FIG. 5).
(2) If it is clear that the distance is not determined by the measured value, but it is clear that it is not within the reference space, each parameter is used under the two-level category of using and not using each parameter. The effectiveness is judged with respect to the isolation distance (by calculation means 1400 shown in FIG. 5).
[0159]
Since the Mahalanobis distance is calculated using all the items taken up, the following operations are required when selecting items. That is, for each item or for each group of items, (1) adopt the item (a group including the item), (2) use the two-level category that does not adopt (1), and Or, the significance of each item group may be compared and calculated and selected.
[0160]
For example, when the number of items is 30, the corresponding two-level orthogonal table L32 is used to calculate the Mahalanobis distance under each experimental condition of each orthogonal table using the specified item or group. . Next, the significant difference between the above (1) and (2) under each experimental condition is tested, and the contribution degree for each item or group including the item is obtained and selected.
[0161]
In such an operation, important parameters are finally selected and selected from all the parameters taken up. Thereafter, the Mahalanobis distance is obtained using only the selected and selected parameters, and when the separation distance increases, the characteristic parameters are presented (by the calculation means 1400 shown in FIG. 5).
[0162]
For example, “CO change”, “HCL change”, “temperature change”, and the like. With this information, it is urged to change the operation / control state on the plant side.
[0163]
FIG. 9 is a diagram showing changes in the measurement / monitoring state of the exhaust gas when the present system is applied.
[0164]
For example, the Mahalanobis distance at the time of creation of the above-mentioned reference space is “D ^ 2 int”, and the exhaust gas under such conditions is “the waste quality that is put into the incineration plant is relatively soft and discharged in a dry state / steady incineration amount. It shall be created when the “operating condition that satisfies the regulation value of gas” is maintained.
[0165]
Next, in the
[0166]
Next, “D ^ 2 Xi calculation” shown in FIG. 8 is performed.
[0167]
Next, “comparison / diagnosis / determination with reference space” shown in FIG. 8 is performed. At this time, if it can be determined that the D ^ 2 Xi is not significantly different from the D ^ 2 int shown in Fig. 9 (the Mahalanobis distance distribution is not significantly different from the D ^ 2 int), the "injection site" It can be judged that the waste quality is relatively “soft”, “dried” and “maintained” in an operating state that satisfies the regulation value of exhaust gas with a steady incineration amount. In such a case, the operation parameters of the plant operation are maintained as they are and the operation is continued.
[0168]
On the other hand, as shown in Fig. 9, if D ^ 2 Xi is clearly different from D ^ 2 int (the Mahalanobis distance distribution is significantly different from D ^ 2 int), It can be judged that it is far from the “operating state in which the quality of the waste put into the incineration site is relatively soft and dry, and the incineration amount satisfies the regulation value of exhaust gas by the steady incineration amount”. For this reason, it is presumed that the property of the exhaust gas has changed due to any one of the reasons such as “difference in input waste quality and amount”, “parameter change in operation mode”, and “abnormality of process monitoring device”. In such a case, it is not preferable to continue the operation while maintaining the operation parameters, equipment, etc. of the plant operation as they are, and therefore treatment is required.
[0169]
In such a case, for each parameter, the average value and standard deviation at the time of creating the reference space and the average value and standard deviation of each parameter at the time of observation / collection are sequentially compared, or by a general principal component analysis method. Since the cause can be estimated, the result is disclosed.
[0170]
Furthermore, in this embodiment,
(1) If the degree of separation of the distance can be determined from the measurement data or quantified data categorized (1, 2, 3, ...), the value is used as the signal level, and each parameter is increased or decreased. By extracting a parameter (feature element) having a large contribution ratio between parameters and disclosing the parameter, the directionality of the treatment is suggested. For example, if the main parameters of d ^ 2 Xi shown in Fig. 9 are “CO concentration” and “hydrogen chloride”, “CO concentration is changing” and “HCL concentration is changing”. If it is disclosed, the driver or the maintenance person performs an operation of correcting the increase / decrease amount, and performs an increase / decrease operation of the input amount of the HCL removal agent.
(2) If it is clear that the distance is not determined by the measured value, but it is clear that it is not within the reference space, each parameter is used under the two-level category of using and not using each parameter. A parameter (feature element) having a large contribution rate between each parameter is extracted with respect to the isolation distance, and the direction of treatment is suggested by disclosing the parameter. For example, if the main parameters of d ^ 2 Xi +1 shown in Fig. 9 are "Nox concentration", "CiHi", and "gas temperature", "Nox concentration changes", "CiHi If the concentration is changed "or" the gas temperature is changed ", the driver or the maintenance person performs an operation for correcting the increase / decrease amount and an operation for increasing / decreasing the gas temperature.
[0171]
In the operations {circle around (1)} and {circle around (2)}, important parameters that isolate the “characteristic state of exhaust gas” to be measured are sequentially discarded and selected. Furthermore, as described above, the amount of increase / decrease in the specific substances of chlorobenzene and chlorophenols present in the exhaust gas is also disclosed as individual information.
[0172]
For this reason, by disclosing such important parameters to the plant operator / manager, etc., it is possible to guide a measure for improving the operation / operation of the plant, and the reliability of operation is improved.
[0173]
Furthermore, as the plant operation and operation matures, the “reference space” and “important parameters” can be quantified by categorizing them individually for each site, thus achieving even more efficient plant operation. It is also versatile because it does not depend on the plant.
[0174]
Such a system of this embodiment uses such data even when a new plant is established or when an N-fold plant or N-fold process is started up. From the standpoint of performance index, it is possible to realize the management and planning of exhaust gas, and more efficient management and planning work is possible.
(Other examples)
As another embodiment of the present system, in the configuration shown in FIG. 1, the respective analyzers, the process variable sensor group, and the plant operation variable information group can be appropriately selected and are not limited.
[0175]
These information and calculation means can also be provided in a central upper management device that monitors and controls the entire plant. In such a case, the burden on the mass spectrometer and the upper management device can be reduced, and more real-time performance can be expected, and a large amount of various plant variable data and process data can be collected. Plant management, planning, operation, service operations, etc. are possible.
[0176]
FIG. 10 shows another embodiment.
[0177]
In the present embodiment, the
[0178]
According to such a configuration, the method of creating the reference space for determining the properties of the exhaust gas and the monitoring / judgment / diagnostic method do not impair the function, but each analyzer is characterized for each individual process or the characteristics of the process. Since it can be arranged as an analyzer that captures more accurately, there is an effect that it is possible to measure and monitor the properties of the exhaust gas with higher accuracy.
[0179]
In addition, since each of the analyzers can be applied to an existing analyzer, it has excellent expandability and a great labor saving effect.
[0180]
According to the present embodiment, specific substances such as dioxins, chlorophenols and chlorobenzenes in the exhaust gas can be continuously collected directly from the flue and can be continuously monitored.
[0181]
In addition, according to the present embodiment, by collecting substances other than the specific components of the dioxins, chlorophenols and chlorobenzenes, process variable information and plant operation variables at the same time, the properties of the exhaust gas can be continuously monitored in real time. It is possible to measure, analyze and monitor.
[0182]
Furthermore, dynamic operation parameters and treatment methods of the plant can be disclosed in real time, and there is an effect that stable operation of the plant and reduction of air pollution can be obtained.
[0183]
【The invention's effect】
According to the present invention, when measuring and monitoring exhaust gas discharged from an incinerator that incinerates waste, an indicator for changing / optimizing process conditions is disclosed to reduce emission of harmful substances. be able to.
[Brief description of the drawings]
FIG. 1 is a diagram showing a configuration example of an exhaust gas measurement / monitoring system according to an embodiment of the present invention.
FIG. 2 is a diagram illustrating a detailed configuration example of a mass spectrometer unit.
FIG. 3 is a diagram showing a measurement example of a specific substance.
FIG. 4 is a diagram illustrating an output example of a specific substance.
FIG. 5 is a diagram showing property information of exhaust gas.
FIG. 6 is a diagram illustrating an example of a state variable format.
FIG. 7 is a diagram showing a flow of creating an exhaust gas property space.
FIG. 8 is a diagram showing an exhaust gas property diagnosis flow.
FIG. 9 is a diagram showing an example of a state change of exhaust gas.
FIG. 10 is a diagram showing another embodiment of the present invention.
[Explanation of symbols]
DESCRIPTION OF
Claims (3)
排ガスに含まれる複数の成分を計測する成分検出手段と、前記焼却炉の温度や圧力や流量等のプロセス変量を計測するプロセス変量センサと、前記成分検出手段やプロセス変量センサからの計測値を収集し排ガスの状態を監視する管理機器を備え、
前記管理機器は、前記焼却炉を運転した際に前記成分検出手段やプロセス変量センサから得られる計測値の情報を収集してマハラノビスの距離を求めることにより基準空間を作成し、当該基準空間作成以降の焼却炉の運転において発生する排ガスを前記成分検出手段及びプロセス変量センサからの計測値を基に監視時のマハラノビスの距離を求め、当該監視時のマハラノビスの距離と前記基準空間との距離を算出し、前記基準空間と前記監視時のマハラノビスの距離を比較し、その距離が予め定められた範囲外である場合、且つその距離の隔離程度が計量値で判断出来る場合には、その値を信号の水準値として、前記各計測値と運転制御情報の各パラメータを増減して、寄与率の大きいパラメータのみを特徴要素として算出し、その特徴要素を提示することによってプラント運転の変更を促すことを特徴とする排ガス計測・監視システム。In the exhaust gas measurement and monitoring system that measures and monitors the exhaust gas discharged from the incinerator that incinerates waste,
Component detection means for measuring multiple components contained in exhaust gas, process variable sensor for measuring process variables such as temperature, pressure, and flow rate of the incinerator, and collected measurement values from the component detection means and process variable sensors Management equipment to monitor the state of exhaust gas,
The management device creates a reference space by collecting information of measurement values obtained from the component detection means and process variable sensors when the incinerator is operated and obtaining a Mahalanobis distance, and after the creation of the reference space The distance of Mahalanobis at the time of monitoring exhaust gas generated during the operation of the incinerator is calculated based on the measured values from the component detection means and the process variable sensor, and the distance between the Mahalanobis at the time of monitoring and the reference space is calculated. Then, the distance between the reference space and the Mahalanobis at the time of monitoring is compared, and if the distance is outside a predetermined range, and if the degree of isolation of the distance can be determined by a measured value, the value is signaled. As the standard value, each parameter of the measured value and the operation control information is increased or decreased, and only a parameter having a large contribution rate is calculated as a feature element. Emission measurement and monitoring system characterized by prompting the change of the plant operation by presenting.
排ガスに含まれる複数の成分を計測する成分検出手段と、前記焼却炉の温度や圧力や流量等のプロセス変量を計測するプロセス変量センサと、前記成分検出手段やプロセス変量センサからの計測値を収集し排ガスの状態を監視する管理機器を備え、
前記管理機器は、前記焼却炉を運転した際に前記成分検出手段やプロセス変量センサから得られる計測値の情報を収集してマハラノビスの距離を求めることにより基準空間を作成し、当該基準空間作成以降の焼却炉の運転において発生する排ガスを前記成分検出手段及びプロセス変量センサからの計測値を基に監視時のマハラノビスの距離を求め、当該監視時のマハラノビスの距離と前記基準空間との距離を算出し、前記基準空間と前記監視時のマハラノビスの距離を比較し、その距離が予め定められた範囲外である場合、且つその距離の隔離程度が計量値で判断出来ないが基準空間内に入っていないことが明白な場合は、各パラメータを使用する、使用しないという2水準のカテゴリーのもとに各パラメータの前記隔離距離に対して、その有効性の寄与率の大きいパラメータのみを特徴要素として算出し、その特徴要素を提示することによってプラント運転の変更を促すことを特徴とする排ガス計測・監視システム。 In the exhaust gas measurement and monitoring system that measures and monitors the exhaust gas discharged from the incinerator that incinerates waste ,
Component detection means for measuring multiple components contained in exhaust gas, process variable sensor for measuring process variables such as temperature, pressure, and flow rate of the incinerator, and collected measurement values from the component detection means and process variable sensors Management equipment to monitor the state of exhaust gas,
The management device creates a reference space by collecting information of measurement values obtained from the component detection means and process variable sensors when the incinerator is operated and obtaining a Mahalanobis distance, and after the creation of the reference space The distance of Mahalanobis at the time of monitoring exhaust gas generated during the operation of the incinerator is calculated based on the measured values from the component detection means and the process variable sensor, and the distance between the Mahalanobis at the time of monitoring and the reference space is calculated. The distance between the reference space and the Mahalanobis at the time of monitoring is compared. If the distance is out of the predetermined range, and the degree of isolation of the distance cannot be determined by the measured value, it is within the reference space. If it is clear that there is no such distance for each parameter under the two-level category of using and not using each parameter Emission measurement and monitoring system characterized by prompting the change of the plant operation by only large parameter of effectiveness of the contribution rate is calculated as a feature element, presenting its characteristic elements.
(1)前記成分検出手段やプロセス変量センサからの計測値データ、及び前記運転制御情報を収集し、
(2)前記(1)項のデータを、各データの平均値と標準偏差で正規化し、
(3)前記(2)項のデータから、2次元の相関行列を作成し、さらに当該行列からのマハラノビスの距離を求め、これらの距離で決定した分布状態を前記排ガスの基準空間とする。The exhaust gas measurement / monitoring system according to claim 1 or 2, wherein the reference space is created by the following procedures (1) to (3) .
(1) Collect measurement value data from the component detection means and process variable sensor, and the operation control information,
(2) Normalize the data of the item (1) by the average value and standard deviation of each data,
(3) A two-dimensional correlation matrix is created from the data of the item (2), and further, the Mahalanobis distance from the matrix is obtained, and the distribution state determined by these distances is defined as the exhaust gas reference space.
Priority Applications (1)
| Application Number | Priority Date | Filing Date | Title |
|---|---|---|---|
| JP2000387308A JP3986752B2 (en) | 2000-12-20 | 2000-12-20 | Exhaust gas measurement and monitoring system |
Applications Claiming Priority (1)
| Application Number | Priority Date | Filing Date | Title |
|---|---|---|---|
| JP2000387308A JP3986752B2 (en) | 2000-12-20 | 2000-12-20 | Exhaust gas measurement and monitoring system |
Publications (3)
| Publication Number | Publication Date |
|---|---|
| JP2002189019A JP2002189019A (en) | 2002-07-05 |
| JP2002189019A5 JP2002189019A5 (en) | 2004-11-04 |
| JP3986752B2 true JP3986752B2 (en) | 2007-10-03 |
Family
ID=18854268
Family Applications (1)
| Application Number | Title | Priority Date | Filing Date |
|---|---|---|---|
| JP2000387308A Expired - Lifetime JP3986752B2 (en) | 2000-12-20 | 2000-12-20 | Exhaust gas measurement and monitoring system |
Country Status (1)
| Country | Link |
|---|---|
| JP (1) | JP3986752B2 (en) |
Cited By (1)
| Publication number | Priority date | Publication date | Assignee | Title |
|---|---|---|---|---|
| CN102735799A (en) * | 2012-06-19 | 2012-10-17 | 北京雪迪龙科技股份有限公司 | Engine exhaust monitoring system |
Families Citing this family (4)
| Publication number | Priority date | Publication date | Assignee | Title |
|---|---|---|---|---|
| JP5944206B2 (en) * | 2012-04-12 | 2016-07-05 | 住友重機械工業株式会社 | Abnormality monitoring device and abnormality monitoring method for circulating fluidized bed boiler |
| JP6198638B2 (en) * | 2013-03-06 | 2017-09-20 | 新日鉄住金エンジニアリング株式会社 | Waste charge control device and waste charge control method |
| JP6838289B2 (en) * | 2016-06-02 | 2021-03-03 | いすゞ自動車株式会社 | How to measure the amount of fuel in the exhaust gas |
| KR101843879B1 (en) * | 2017-06-26 | 2018-03-30 | 한국환경공단 | System for detecting abnormality data, method thereof and computer recordable medium storing the method |
Family Cites Families (7)
| Publication number | Priority date | Publication date | Assignee | Title |
|---|---|---|---|---|
| JPH09330858A (en) * | 1996-06-07 | 1997-12-22 | Hitachi Ltd | Method and system for generating schedule management chart |
| JP3280872B2 (en) * | 1996-10-23 | 2002-05-13 | ニッタン株式会社 | Environmental monitoring system, abnormality detection method, and abnormality detection device |
| JP3108405B2 (en) * | 1998-07-23 | 2000-11-13 | 核燃料サイクル開発機構 | Device diagnosis method |
| JP3668010B2 (en) * | 1998-09-29 | 2005-07-06 | 株式会社日立製作所 | Waste incineration equipment and its control method |
| JP3349455B2 (en) * | 1998-09-30 | 2002-11-25 | 宮崎沖電気株式会社 | Management method and management system for semiconductor manufacturing equipment |
| JP2000259222A (en) * | 1999-03-04 | 2000-09-22 | Hitachi Ltd | Device monitoring and preventive maintenance system |
| JP2000252179A (en) * | 1999-03-04 | 2000-09-14 | Hitachi Ltd | Semiconductor manufacturing process stabilization support system |
-
2000
- 2000-12-20 JP JP2000387308A patent/JP3986752B2/en not_active Expired - Lifetime
Cited By (2)
| Publication number | Priority date | Publication date | Assignee | Title |
|---|---|---|---|---|
| CN102735799A (en) * | 2012-06-19 | 2012-10-17 | 北京雪迪龙科技股份有限公司 | Engine exhaust monitoring system |
| CN102735799B (en) * | 2012-06-19 | 2015-11-04 | 北京雪迪龙科技股份有限公司 | A kind of motor exhaust monitoring system |
Also Published As
| Publication number | Publication date |
|---|---|
| JP2002189019A (en) | 2002-07-05 |
Similar Documents
| Publication | Publication Date | Title |
|---|---|---|
| JP3876554B2 (en) | Method and apparatus for monitoring chemical substance and combustion furnace using the same | |
| JP4105348B2 (en) | Sample analysis monitor device and combustion control system using the same | |
| US8334505B2 (en) | Chemical ionization reaction or proton transfer reaction mass spectrometry | |
| JP2011511929A (en) | Chemical ionization or proton transfer reaction mass spectrometry using a quadrupole or time-of-flight mass spectrometer | |
| US8866075B2 (en) | Apparatus preparing samples to be supplied to an ion mobility sensor | |
| JP5125248B2 (en) | Ion mobility spectrometer | |
| US20040036020A1 (en) | Mass spectrometer, mass spectrometry, and monitoring system | |
| JP2006322899A (en) | Gas-monitoring apparatus | |
| JP3757820B2 (en) | Ion source and mass spectrometer using the same | |
| JP3986752B2 (en) | Exhaust gas measurement and monitoring system | |
| EP1895566A2 (en) | Gas monitoring apparatus and gas monitoring method | |
| JP4054493B2 (en) | Ion source | |
| JP2001351569A (en) | On-line monitor for measuring gas | |
| JP3825251B2 (en) | Exhaust gas measuring device | |
| JP3596354B2 (en) | Combustion state monitoring method and apparatus | |
| JP3663975B2 (en) | Exhaust gas monitoring device | |
| JP2005098705A (en) | Apparatus and method for monitoring chemical substance | |
| JP2002189020A5 (en) | ||
| JP3819146B2 (en) | Monitor device | |
| JP3725826B2 (en) | Exhaust gas measuring device and its standard sample generator | |
| JP4920067B2 (en) | Chemical substance monitoring device and chemical substance monitoring method | |
| JP3668010B2 (en) | Waste incineration equipment and its control method | |
| JP4197676B2 (en) | Monitoring system | |
| CN109950122A (en) | Adjusting in situ in mass spectrometer system |
Legal Events
| Date | Code | Title | Description |
|---|---|---|---|
| A131 | Notification of reasons for refusal |
Free format text: JAPANESE INTERMEDIATE CODE: A131 Effective date: 20061114 |
|
| A521 | Written amendment |
Free format text: JAPANESE INTERMEDIATE CODE: A523 Effective date: 20070109 |
|
| RD02 | Notification of acceptance of power of attorney |
Free format text: JAPANESE INTERMEDIATE CODE: A7422 Effective date: 20070109 |
|
| TRDD | Decision of grant or rejection written | ||
| A01 | Written decision to grant a patent or to grant a registration (utility model) |
Free format text: JAPANESE INTERMEDIATE CODE: A01 Effective date: 20070710 |
|
| A61 | First payment of annual fees (during grant procedure) |
Free format text: JAPANESE INTERMEDIATE CODE: A61 Effective date: 20070711 |
|
| R150 | Certificate of patent or registration of utility model |
Free format text: JAPANESE INTERMEDIATE CODE: R150 Ref document number: 3986752 Country of ref document: JP Free format text: JAPANESE INTERMEDIATE CODE: R150 |
|
| FPAY | Renewal fee payment (event date is renewal date of database) |
Free format text: PAYMENT UNTIL: 20100720 Year of fee payment: 3 |
|
| FPAY | Renewal fee payment (event date is renewal date of database) |
Free format text: PAYMENT UNTIL: 20100720 Year of fee payment: 3 |
|
| FPAY | Renewal fee payment (event date is renewal date of database) |
Free format text: PAYMENT UNTIL: 20110720 Year of fee payment: 4 |
|
| FPAY | Renewal fee payment (event date is renewal date of database) |
Free format text: PAYMENT UNTIL: 20110720 Year of fee payment: 4 |
|
| FPAY | Renewal fee payment (event date is renewal date of database) |
Free format text: PAYMENT UNTIL: 20120720 Year of fee payment: 5 |
|
| FPAY | Renewal fee payment (event date is renewal date of database) |
Free format text: PAYMENT UNTIL: 20130720 Year of fee payment: 6 |
|
| EXPY | Cancellation because of completion of term |