JP2014178281A - Method for analyzing grain size of soil - Google Patents
Method for analyzing grain size of soil Download PDFInfo
- Publication number
- JP2014178281A JP2014178281A JP2013053917A JP2013053917A JP2014178281A JP 2014178281 A JP2014178281 A JP 2014178281A JP 2013053917 A JP2013053917 A JP 2013053917A JP 2013053917 A JP2013053917 A JP 2013053917A JP 2014178281 A JP2014178281 A JP 2014178281A
- Authority
- JP
- Japan
- Prior art keywords
- particle size
- soil
- sample
- particle
- test
- Prior art date
- Legal status (The legal status is an assumption and is not a legal conclusion. Google has not performed a legal analysis and makes no representation as to the accuracy of the status listed.)
- Granted
Links
- 239000002689 soil Substances 0.000 title claims abstract description 84
- 238000000034 method Methods 0.000 title claims description 26
- 238000003384 imaging method Methods 0.000 claims abstract description 9
- 239000002245 particle Substances 0.000 claims description 211
- 238000001035 drying Methods 0.000 claims description 11
- 238000003921 particle size analysis Methods 0.000 claims description 4
- 238000004458 analytical method Methods 0.000 claims 2
- 238000012360 testing method Methods 0.000 description 46
- 238000009825 accumulation Methods 0.000 description 16
- 238000010191 image analysis Methods 0.000 description 14
- 239000000463 material Substances 0.000 description 12
- 230000000052 comparative effect Effects 0.000 description 8
- 238000012986 modification Methods 0.000 description 7
- 230000004048 modification Effects 0.000 description 7
- 238000010586 diagram Methods 0.000 description 6
- 238000003908 quality control method Methods 0.000 description 5
- 238000010276 construction Methods 0.000 description 4
- 238000002474 experimental method Methods 0.000 description 3
- 238000010998 test method Methods 0.000 description 3
- 239000010419 fine particle Substances 0.000 description 2
- 238000005259 measurement Methods 0.000 description 2
- 238000012545 processing Methods 0.000 description 2
- 238000010224 classification analysis Methods 0.000 description 1
- 238000012937 correction Methods 0.000 description 1
- 238000003703 image analysis method Methods 0.000 description 1
- 238000009434 installation Methods 0.000 description 1
- 239000004973 liquid crystal related substance Substances 0.000 description 1
- 238000005070 sampling Methods 0.000 description 1
- 238000007873 sieving Methods 0.000 description 1
- XLYOFNOQVPJJNP-UHFFFAOYSA-N water Substances O XLYOFNOQVPJJNP-UHFFFAOYSA-N 0.000 description 1
Images


Landscapes
- Sampling And Sample Adjustment (AREA)
- Investigating Or Analysing Materials By Optical Means (AREA)
Abstract
Description
本発明は、土壌の粒度解析方法に関する。 The present invention relates to a soil particle size analysis method.
工事で使用される材料は、その用途に応じた品質管理が行われる。この品質管理の一つとして、材料の粒度管理がある。特許文献1には、コンクリート骨材を測定板上に散布して撮影し、画像解析により粒度分布を測定する技術が記載されている。
The materials used in the construction are quality-controlled according to their use. One of the quality controls is the material particle size control.
ところで、建設工事で土材料を使用する際には、通常、JIS A 1204に規定される「土の粒度試験方法」によって土の粒度分析が実施されている。しかし、この「土の粒度試験方法」では、試料を24時間炉乾燥した後、ふるい分けによって試験を実施するため、少なくとも2日間の試験時間を必要とするとともに、炉乾燥装置などの特殊な機器及び15種類以上の目開きが異なるふるいが必要となるため、設備の整った試験室でしか試験を行うことができず、設備コストも高くなるという問題があった。 By the way, when using a soil material in construction work, a soil particle size analysis is usually performed by the “soil particle size test method” defined in JIS A 1204. However, in this “soil particle size test method”, after the sample is oven-dried for 24 hours, the test is carried out by sieving. Therefore, a test time of at least 2 days is required. Since 15 or more types of sieves having different openings are required, the test can be performed only in a well-equipped test room, and there is a problem that the equipment cost increases.
そこで、本発明は、土壌の粒度を特定するまでの所要時間及び設備コストを削減することを目的とする。 Then, an object of this invention is to reduce the time required to specify the particle size of soil, and equipment cost.
本発明は、土壌を、粒径の範囲が決められた複数の土粒子群のそれぞれに分級し、これら各土粒子群の重量を求める分級工程と、各々の前記土粒子群を撮像した結果に基づき、各々の前記土粒子群における粒度を特定する部分粒度特定工程と、前記分級工程により求めた各土粒子群の重量と、前記部分粒度特定工程により特定した各土粒子群における粒度に基づいて、前記土壌全体の粒度を特定する全体粒度特定工程とを備える土壌の粒度解析方法を提供する。 The present invention classifies the soil into each of a plurality of soil particle groups having a determined particle size range, and obtains the weight of each soil particle group, and the result of imaging each of the soil particle groups. Based on the partial particle size specifying step for specifying the particle size in each of the soil particle groups, the weight of each soil particle group determined by the classification step, and the particle size in each soil particle group specified by the partial particle size specifying step And a method for analyzing the particle size of soil, comprising a whole particle size specifying step of specifying the particle size of the entire soil.
また、前記分級工程において分級した複数の前記土粒子群のうち、少なくとも、最も粒径が小さい土粒子群については、前記部分粒度特定工程の前に乾燥させる乾燥工程を備えるようにしてもよい。これにより、湿潤状態により粒径が誤認識されるという可能性を小さくすることができる。 In addition, among the plurality of soil particle groups classified in the classification step, at least the soil particle group having the smallest particle size may include a drying step of drying before the partial particle size specifying step. Thereby, the possibility that the particle diameter is erroneously recognized due to the wet state can be reduced.
また、前記全体粒度特定工程において特定した粒度と、土壌に対して要求される粒度の範囲とを比較した状態で表示する表示工程を備えるようにしてもよい。これにより、要求される粒度との比較が簡単になる。 Moreover, you may make it provide the display process displayed in the state which compared the particle size specified in the said whole particle size identification process, and the range of the particle size requested | required with respect to soil. This simplifies comparison with the required granularity.
本発明によれば、土壌の粒度を特定するまでの所要時間及び設備コストを削減することができる。 According to the present invention, it is possible to reduce the time required for specifying the grain size of the soil and the equipment cost.
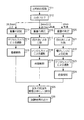
以下、本発明を実施するための形態について図面を用いて説明する。まず、本実施形態による土壌の粒度解析方法を用いた土の粒度試験の概要について説明する。図1は、本実施形態による土の粒度試験の概要を示すフロー図である。図1に示すように、この粒度試験は、大きく分けて、採取工程、分級工程、分取工程、乾燥工程、撮影工程、部分粒度特定工程、全体粒度特定工程という手順で実施される。 Hereinafter, embodiments for carrying out the present invention will be described with reference to the drawings. First, an outline of a soil particle size test using the soil particle size analysis method according to the present embodiment will be described. FIG. 1 is a flowchart showing an outline of a soil particle size test according to the present embodiment. As shown in FIG. 1, this particle size test is roughly divided into a sampling process, a classification process, a sorting process, a drying process, a photographing process, a partial particle size specifying process, and an overall particle size specifying process.
まず、採取工程において、地山から湿潤状態の土壌を試料として採取する(ステップS1)。続いて、分級工程において、採取した試料を2〜4種類のふるいによって分級し、分級した各試料の重量を測定する(ステップS2)。続いて、分取工程において、分級した各試料から試験に必要な分量を分取する(ステップS3)。ここで、最も小さい粒径の試料については、乾燥工程において、電子レンジを用いて試料を乾燥させる(ステップS4)。その他の試料については、乾燥工程は行わない。続いて、撮影工程において、分取した各試料をデジタルカメラ20により撮影する(ステップS5)。 First, in the collection step, a wet soil is collected from the natural ground as a sample (step S1). Subsequently, in the classification step, the collected samples are classified by 2 to 4 types of sieves, and the weight of each classified sample is measured (step S2). Subsequently, in the sorting process, an amount necessary for the test is collected from each classified sample (step S3). Here, for the sample having the smallest particle size, the sample is dried using a microwave oven in the drying step (step S4). For other samples, the drying process is not performed. Subsequently, in the photographing process, each sampled part is photographed by the digital camera 20 (step S5).
続いて、部分粒度特定工程において、撮影した画像の解析により、分級した各試料の粒度を特定する(ステップS6)。この粒度とは、土粒子径の分布状態を重量百分率で表したものをいう。続いて、全体粒度特定工程において、特定した各試料の粒度をその重量比率に基づいて統合し、試料の全粒径範囲の粒度を特定する(ステップS7)。この部分粒度特定工程及び全体粒度特定工程は、コンピュータ10によって行われる。
Subsequently, in the partial particle size specifying step, the particle size of each classified sample is specified by analyzing the captured image (step S6). This particle size refers to the distribution of soil particle size expressed as a percentage by weight. Subsequently, in the overall particle size specifying step, the particle sizes of the specified samples are integrated based on the weight ratio, and the particle size in the entire particle size range of the sample is specified (step S7). The partial particle size identification step and the overall particle size identification step are performed by the
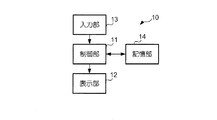
図2は、コンピュータ10の構成を示す図である。このコンピュータ10は、例えば工事現場の事務所に設置されたパーソナルコンピュータである。コンピュータ10は、CPU(Central Processing Unit)、ROM(Read Only Memory)及びRAM(Random Access Memory)を有する制御部11と、液晶パネルやその駆動回路を有する表示部12と、タッチパネルや操作ボタンを有する入力部13と、制御部11によって実行されるプログラムや制御部11によって用いられる各種のデータを記憶した記憶部14とを備えている。また、記憶部14には、画像解析を行うための画像解析ソフトウェアが記憶されている。
FIG. 2 is a diagram illustrating the configuration of the
(実施例)
次に、本実施形態による土の粒度試験について、実施例を挙げて具体的に説明する。図3は、本実施例による土の粒度試験の詳細な手順を示すフロー図である。ここでは、粒径が300mm以下の粒度分布が良好な試料を用いた場合における粒度試験の詳細な手順について説明する。
(Example)
Next, the soil particle size test according to the present embodiment will be specifically described with reference to examples. FIG. 3 is a flowchart showing a detailed procedure of the soil particle size test according to this embodiment. Here, the detailed procedure of the particle size test when a sample having a particle size distribution of 300 mm or less and a good particle size distribution is used will be described.
まず、作業者は、地山から湿潤状態の土壌を試料として10〜15kg程度採取する(ステップS11)。続いて、作業者は、目開きが26.5mmのふるいと目開きが2mmのふるいとを用いて、ステップS11で採取した試料を分級する(ステップS12)。具体的には、作業者は、まず目開きが26.5mmのふるいを使用して、採取した試料を、粒径が26.5mm以上の土粒子群(以下、「第1の試料」という)と粒径が26.5mm未満の土粒子群とに分級する。続いて、作業者は、目開きが2mmのふるいを使用して、目開きが26.5mmのふるいを通過した土粒子群を、さらに粒径が2mm以上26.5mm未満の土粒子群(以下、「第2の試料」という)と粒径が2mm未満の土粒子群(以下、「第3の試料」という)とに分級する。 First, an operator collects about 10 to 15 kg of soil from a natural ground as a sample (step S11). Subsequently, the operator classifies the sample collected in step S11 using a sieve having an aperture of 26.5 mm and a sieve having an aperture of 2 mm (step S12). Specifically, the operator first uses a sieve having an aperture of 26.5 mm, and collects the collected sample as a soil particle group having a particle size of 26.5 mm or more (hereinafter referred to as “first sample”). And a soil particle group having a particle size of less than 26.5 mm. Subsequently, the operator uses a sieve having an aperture of 2 mm, and further selects an earth particle group having passed through the sieve having an aperture of 26.5 mm, and further an earth particle group having a particle size of 2 mm or more and less than 26.5 mm (hereinafter referred to as “particle size”) , “Second sample”) and a soil particle group having a particle size of less than 2 mm (hereinafter referred to as “third sample”).
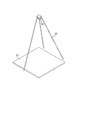
第1の試料については、以下の手順で粒度試験が進められる。まず、作業者は、はかりなどの計測機器で第1の試料の全重量を測定する(ステップS13)。続いて、作業者は、第1の試料をデジタルカメラ20で撮影する(ステップS14)。図4は、試料の撮影を説明するための図である。この撮影には、デジタルカメラ20の他に、縦1m×横1mの白色板によって構成される撮影台21と、デジタルカメラ20を支持するカメラスタンド22とが用いられる。作業者は、まずカメラスタンド22によって撮影台21全体が撮影できる位置にデジタルカメラ20を固定して、撮影台21をデジタルカメラ20で撮影する。続いて、作業者は、撮影台21の上に定規を置いて、定規をデジタルカメラ20で撮影する。続いて、作業者は、第1の試料を撮影台21上に散在させ、これをデジタルカメラ20で撮影する。
For the first sample, the particle size test proceeds in the following procedure. First, the operator measures the total weight of the first sample with a measuring device such as a scale (step S13). Subsequently, the operator photographs the first sample with the digital camera 20 (step S14). FIG. 4 is a diagram for explaining photographing of a sample. For this photographing, in addition to the
続いて、作業者は、例えばデジタルカメラ20とコンピュータ10とを有線又は無線で接続することによって、デジタルカメラ20で撮影された画像を表す画像データをコンピュータ10に取り込む。制御部11は、作業者の操作により画像解析ソフトウェアを実行して、デジタルカメラ20から取得した画像データに基づく画像解析を行うことにより、第1の試料の粒度を特定する(ステップS15)。この粒度は、例えば第1の試料の土粒子径に対応する通過質重量百分率によって表される。この通過重量百分率は、対象の粒径より小さい粒径の土粒子の重量を第1の試料の全重量で除した値を百分率で表すことによって求められる。この土粒子径は、例えば特開2008−268051号公報に開示されているように、画像データに対して2値化処理を行った後、撮影された土粒子の画像の面積を算出し、算出した面積を真円に置き換えた等価円の直径を求めることによって測定される。なお、ステップS14で撮影された撮影台21の画像及び定規の画像は、画像解析のキャリブレーション(例えば、2値化処理の閾値の補正や基準スケールの校正)に用いられる。
Subsequently, the operator captures image data representing an image captured by the
第2の試料については、以下の手順で粒度試験が進められる。まず、作業者は、はかりなどの計測機器で第2の試料の全重量を測定する(ステップS16)。続いて、作業者は、JISで規定された四分法によって、第2の試料から100〜200g程度の分量を分取する(ステップS17)。続いて、作業者は、分取した第2の試料をデジタルカメラ20で撮影する(ステップS18)。ここでは、上述したステップS14と同様に、図4に示す撮影台21、カメラスタンド22及びデジタルカメラ20を用いて、第2の試料を撮影する。ただし、撮影台21は、縦15cm×横20cm程度の大きさがあればよく、透明なパネルを有するバックライト付のものであってもよい。このとき、作業者は、第2の試料を10〜20g程度の分量毎に分けて撮影を行う。
For the second sample, the particle size test proceeds in the following procedure. First, the operator measures the total weight of the second sample with a measuring device such as a scale (step S16). Subsequently, the worker dispenses an amount of about 100 to 200 g from the second sample by the quadrant defined by JIS (step S17). Subsequently, the operator takes an image of the collected second sample with the digital camera 20 (step S18). Here, as in step S14 described above, the second sample is imaged using the imaging table 21, the
続いて、作業者は、例えばデジタルカメラ20とコンピュータ10とを有線又は無線で接続することによって、デジタルカメラ20で撮影された画像を表す画像データをコンピュータ10に取り込む。制御部11は、上述したステップS15と同様に、作業者の操作により画像解析ソフトウェアを実行して、デジタルカメラ20から取得した画像データに基づく画像解析を行うことにより、第2の試料の粒度を特定する(ステップS19)。
Subsequently, the operator captures image data representing an image captured by the
第3の試料については、以下の手順で粒度試験が進められる。まず、作業者は、はかりなどの計測機器で第3の試料の全重量を測定する(ステップS20)。続いて、作業者は、JISで規定された四分法によって、第3の試料から5〜20g程度の分量を分取する(ステップS21)。続いて、作業者は、地盤工学会基準(JGS 0122−2009)に規定される「電子レンジを用いた土の含水比試験方法」によって、分取した第3の試料を電子レンジで加熱、乾燥させる(ステップ22)。例えば、600Wの電子レンジを用いた場合には、第3の試料を10分程度加熱する。続いて、作業者は、上述したステップS18と同様に、図4に示す撮影台21、カメラスタンド22及びデジタルカメラ20を用いて、乾燥した第3の試料を撮影する(ステップS23)。このとき、作業者は、第3の試料を0.5g程度の分量毎に分けて撮影を行う。
For the third sample, the particle size test proceeds in the following procedure. First, the operator measures the total weight of the third sample with a measuring device such as a scale (step S20). Subsequently, the worker dispenses an amount of about 5 to 20 g from the third sample by the quadrant defined by JIS (step S21). Subsequently, the worker heated and dried the sampled third sample with a microwave oven according to the “Method for testing the moisture content of soil using a microwave oven” defined by the Japan Geotechnical Society Standard (JGS 0122-2009). (Step 22). For example, when a 600 W microwave is used, the third sample is heated for about 10 minutes. Subsequently, the operator images the dried third sample using the imaging table 21, the
続いて、作業者は、例えばデジタルカメラ20とコンピュータ10とを有線又は無線で接続することによって、デジタルカメラ20で撮影された画像を表す画像データをコンピュータ10に取り込む。制御部11は、上述したステップS15と同様に、作業者の操作により画像解析ソフトウェアを実行して、デジタルカメラ20から取得した画像データに基づく画像解析を行うことにより、第3の試料の粒度を特定する(ステップS24)。
Subsequently, the operator captures image data representing an image captured by the
次に、制御部11は、ステップS15、S19及びS24で特定した第1の試料の粒度、第2の試料の粒度及び第3の試料の粒度をその重量比率に基づいて統合し、試料の全粒径範囲の粒度を特定する(ステップS25)。この粒度は、例えば試料の各土粒子径に対応する通過質重量百分率によって表される。この通過重量百分率は、対象の粒径より小さい粒径の土粒子の重量を全体の重量で除した値を百分率で表すことによって求められる。
Next, the
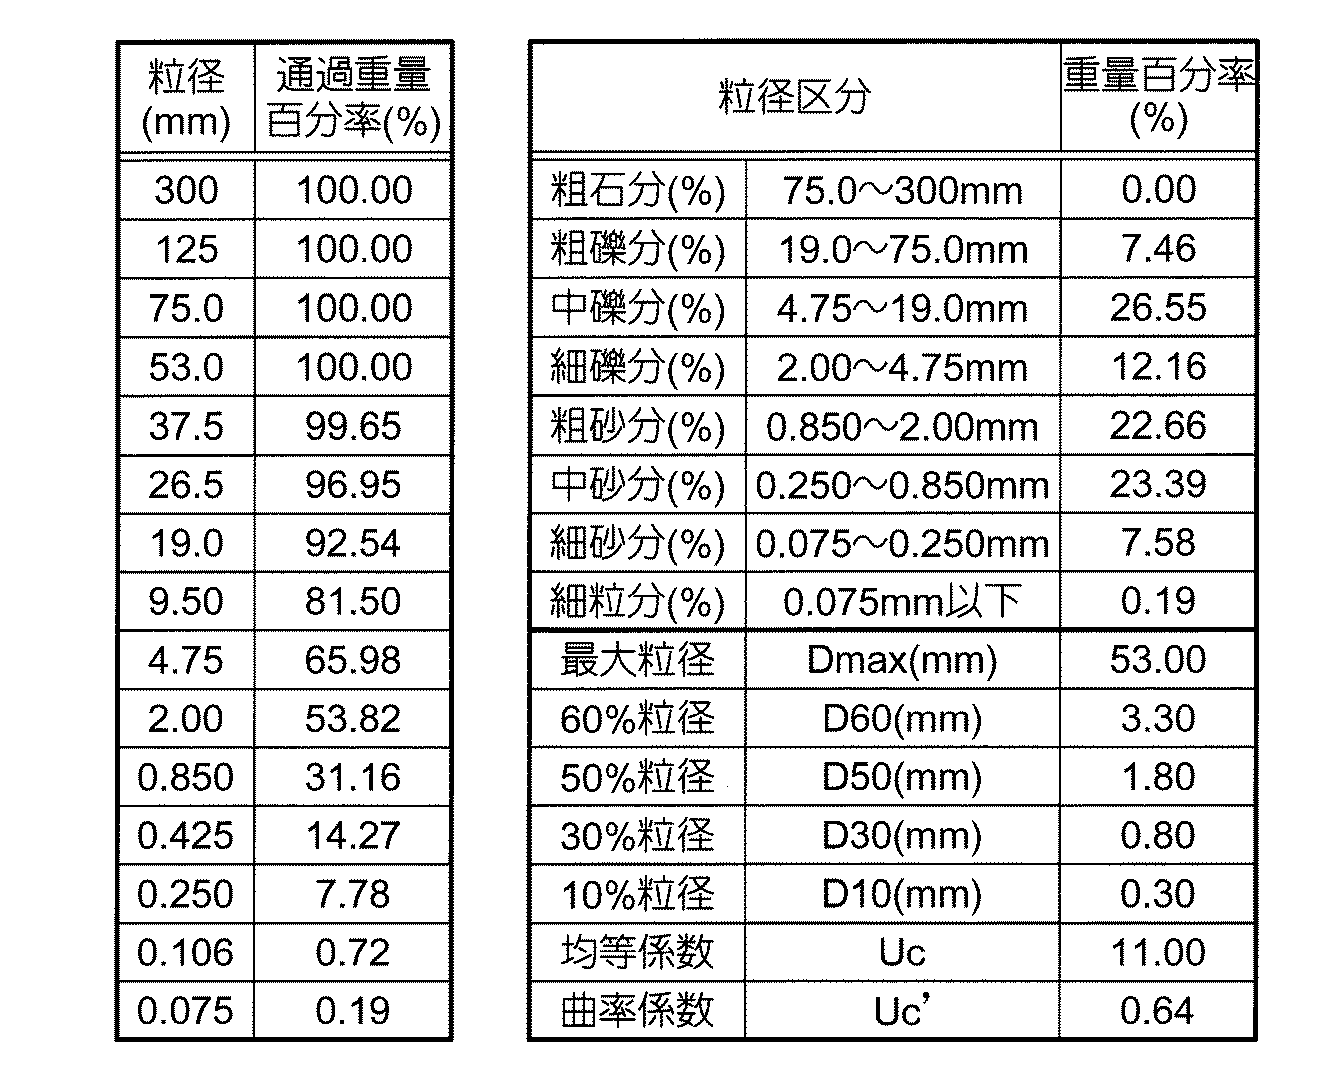
続いて、制御部11は、ステップS25で特定した全粒径範囲の粒度に基づいて、粒度試験の結果を作成して出力する(ステップS26)。図5は、粒度試験の結果の一例を示す図である。例えば、制御部11は、全粒径範囲の粒度に基づいて粒径加積曲線C1を作成し、作成した粒径加積曲線C1を表示部12に表示させる(表示工程)。このとき、制御部11は、土材料に対して要求される粒度の範囲である基準範囲Rを粒径加積曲線C1とともに表示部12に表示させる。この基準範囲Rは、例えば土材料の用途に応じて決められる。
Subsequently, the
例えば、各粒径に対応する通過重量百分率が図5に示すような値である場合には、半対数グラフの対数目盛に粒径を、算数目盛に通過重量百分率をとることによって、図6に示すような粒径加積曲線C1が作成される。図6に示す例では、粒径加積曲線C1は、基準範囲R内に収まっている。これは、土壌の粒度が、土材料に対して要求される粒度の範囲を満たしていることを意味する。このように、粒径加積曲線C1と基準範囲Rとを比較した状態で表示することにより、作業者は、土壌の粒度が、土材料に対して要求される粒度の範囲を満たしているか否かを容易に判断することができる。また、作業者がこの判断をより簡単に行えるように、制御部11は、粒径加積曲線C1が基準範囲R内に収まっているか否かを判定し、その判定結果を表示部12に表示させてもよい。
For example, when the passing weight percentage corresponding to each particle size is a value as shown in FIG. 5, by taking the particle size on the logarithmic scale of the semilogarithmic graph and passing weight percentage on the arithmetic scale, FIG. A particle size accumulation curve C1 as shown is created. In the example illustrated in FIG. 6, the particle size accumulation curve C1 is within the reference range R. This means that the soil particle size meets the required particle size range for the soil material. Thus, by displaying the particle size accumulation curve C1 and the reference range R in a state of comparison, the operator can determine whether the soil particle size satisfies the particle size range required for the soil material. Can be easily determined. Further, the
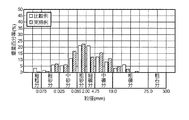
また、制御部11は、粒径加積曲線C1から粒度組成を求め、この粒度組成に基づいてヒストグラムを作成し、作成したヒストグラムを表示部12に表示させてもよい。この粒度組成は、粒径に応じて定められた粒径区分毎に、土粒子径の分布状態を重量百分率で表したものをいい、例えば各粒径区分に対応する重量百分率によって表される。この重量百分率は、各粒径区分に属する土粒子の重量を全体の重量で除した値を百分率で表すことによって求められる。例えば、各粒径区分に対応する重量百分率が図5に示すような値である場合には、横軸に粒径、縦軸に重量百分率をとることによって、図7に示すようなヒストグラムが作成される。
Moreover, the
さらに、制御部11は、粒径加積曲線C1から粒度分布の特徴を表す値を算出し、算出した値を表示部12に表示させてもよい。この粒度分布の特徴を表す値には、例えば図5に示す最大粒径Dmax、通過重量百分率が10%、30%、50%及び60%のときの粒径である10%粒径D10、30%粒径D30、50%粒径D50及び60%粒径D60、均等係数Uc、曲率係数Uc’が含まれる。この均等係数Ucは、以下の式(1)によって求められる。
道路や河川築堤のために用いられる盛土材の品質管理の項目には、最大粒径や細粒分含有率(粒径が0.075mm以下の土粒子の含有率)が含まれている場合がある。また、地盤改良材の品質管理の項目には、粒度範囲や細粒分含有率(粒径が0.075mm以下の土粒子の含有率)が含まれている場合がある。したがって、上述したように粒径加積曲線C1、ヒストグラム、最大粒径Dmax等の情報を表示することにより、作業者が品質管理に必要な情報を容易に把握することができる。 Items for quality control of embankment materials used for roads and river embankments may include maximum particle size and fine particle content (content of soil particles with a particle size of 0.075 mm or less). is there. Further, the quality control items of the ground improvement material may include a particle size range and a fine particle content (content of soil particles having a particle size of 0.075 mm or less). Therefore, by displaying information such as the particle size accumulation curve C1, the histogram, the maximum particle size Dmax and the like as described above, the operator can easily grasp information necessary for quality control.
次に、本実施例による土の粒度試験の精度を調べるために本願発明者らが行った実験について説明する。この実験では、比較例として、本実施例による土の粒度試験と同様の試料を用いて、JIS A 1204に規定される「土の粒度試験方法」を用いた粒度試験を行い、双方の試験の結果を比較した。図8は、本実施例による粒度試験の結果と、比較例による粒度試験の結果とを示す図である。図9は、本実施例による粒度試験の結果に基づいて作成された粒径加積曲線C1と、比較例による粒度試験の結果に基づいて作成された粒径加積曲線C2とを示す図である。図10は、本実施例による粒度試験の結果に基づいて作成されたヒストグラムと、比較例による粒度試験の結果に基づいて作成されたヒストグラムとを示す図である。図8〜図10では、本実施例による粒度試験の結果と比較例による粒度試験の結果の間に大きな差異は見られなかった。この実験によれば、本実施例による土の粒度試験が十分な精度を有することが分かった。 Next, an experiment conducted by the inventors of the present application in order to examine the accuracy of the soil particle size test according to the present embodiment will be described. In this experiment, as a comparative example, a particle size test using the “soil particle size test method” defined in JIS A 1204 was performed using the same sample as the soil particle size test according to this example. The results were compared. FIG. 8 is a diagram illustrating the result of the particle size test according to the present example and the result of the particle size test according to the comparative example. FIG. 9 is a diagram illustrating a particle size accumulation curve C1 created based on the result of the particle size test according to the present example and a particle size accumulation curve C2 created based on the result of the particle size test according to the comparative example. is there. FIG. 10 is a diagram illustrating a histogram created based on the result of the particle size test according to the present example and a histogram created based on the result of the particle size test according to the comparative example. 8 to 10, no significant difference was found between the results of the particle size test according to this example and the results of the particle size test according to the comparative example. According to this experiment, it was found that the soil particle size test according to this example had sufficient accuracy.
以上説明したように、本実施形態では、試料を分級してから、分級した各々の試料について撮影及び画像解析を行っている。通常、土には大小様々な粒径の土粒子が混ざっているため、例えば試料を分級せずに撮影して画像解析を行おうとしても、試料の粒径範囲が測定可能範囲を超えてしまって画像解析ができないか、画像解析ができても著しく精度が悪くなる場合がある。しかし、本実施形態によれば、試料を分級してから、分級した各々の試料について撮影及び画像解析を行っているため、画像解析により、粒径が300mm〜0.75mmまでの試料について粒度の測定を実現することができる。 As described above, in this embodiment, after classifying a sample, photographing and image analysis are performed for each classified sample. Normally, soil particles of various sizes are mixed in the soil, so even if, for example, a sample is taken without classification and image analysis is performed, the particle size range of the sample exceeds the measurable range. Therefore, there is a case where the image analysis cannot be performed or the accuracy is remarkably deteriorated even if the image analysis can be performed. However, according to the present embodiment, since the samples are classified and then shooting and image analysis are performed for each of the classified samples, the particle size of the samples having a particle size of 300 mm to 0.75 mm is determined by image analysis. Measurement can be realized.
また、本実施形態によれば、最も小さい粒径以外の粒径の試料(例えば、粒径が26.5mm以上の試料及び粒径が2mm以上26.5mm未満の試料)については、試料を乾燥させずに粒度試験を行うため、粒度試験に要する時間が短くなる。なお、これらの試料については、一般的に自然に水が切れるくらい粒径が大きいため、乾燥させなくても粒度試験に大きな支障はない。 In addition, according to the present embodiment, for a sample having a particle size other than the smallest particle size (for example, a sample having a particle size of 26.5 mm or more and a sample having a particle size of 2 mm or more and less than 26.5 mm), the sample is dried. Since the particle size test is performed without doing so, the time required for the particle size test is shortened. Since these samples generally have a particle size that is large enough to allow water to drain naturally, there is no major problem in the particle size test even if they are not dried.
また、本実施形態では、最も小さい粒径の試料(例えば、粒径が2mm未満の試料)については、試料を乾燥させることにより、土粒子を個々に分離してから撮影を行っている。最も小さい粒径の試料は、湿潤状態のままだと複数の土粒子がくっついて見かけ上粒径が大きくなる場合があるため、画像解析において粒径が誤認識される恐れがある。しかし、本実施形態によれば、最も小さい粒径の試料については、試料を乾燥させてから撮影するため、画像解析において粒径が誤認識される可能性を小さくすることができる。 In the present embodiment, a sample having the smallest particle size (for example, a sample having a particle size of less than 2 mm) is photographed after the soil particles are individually separated by drying the sample. When the sample with the smallest particle size is left in a wet state, a plurality of soil particles may stick together and the particle size may increase apparently, so that the particle size may be erroneously recognized in image analysis. However, according to this embodiment, since the sample with the smallest particle size is photographed after the sample is dried, the possibility that the particle size is erroneously recognized in the image analysis can be reduced.
そして、この乾燥工程では電子レンジを用いるから、炉乾燥装置などの特殊な機器を必要とせず、土の粒度試験を行うための設備コストが削減される。また、このような特殊な機器を使用しないことにより、土の粒度試験を、設備の整った試験室ではなく、例えば工事現場に設置された事務所で実施することができる。この場合、土の粒度試験の実施頻度を増やすことができるため、土材料の品質管理の精度を高めることができる。 And since a microwave oven is used in this drying process, special equipments, such as a furnace drying apparatus, are not required, and the installation cost for performing the soil particle size test is reduced. Further, by not using such special equipment, the soil particle size test can be carried out in an office installed at a construction site, for example, instead of a well-equipped test room. In this case, since the frequency of performing the soil particle size test can be increased, the accuracy of quality control of the soil material can be increased.
(変形例)
本発明は上述した実施形態に限定されず、次のような変形が可能である。また、以下の変形例を相互に組み合わせてもよい。
(変形例1)
上述した実施例で説明したふるいの目開きの大きさは一例であり、ふるいの目開きの大きさは、例えば試料の特性に応じて選択すればよい。
(Modification)
The present invention is not limited to the above-described embodiment, and the following modifications are possible. Further, the following modifications may be combined with each other.
(Modification 1)
The size of the sieve opening described in the above-described embodiments is an example, and the size of the opening of the sieve may be selected according to the characteristics of the sample, for example.
(変形例2)
上述した実施形態では、最も小さい粒径の試料(例えば、粒径が2mm未満の試料)を乾燥させていたが、この試料の乾燥は必須ではない。例えば試料の粒径や含水率によっては、最も小さい粒径の試料についても試料を乾燥させなくてもよい。反対に、最も小さい粒径以外の粒径の試料についても、撮影前に試料を乾燥させてもよい。
(Modification 2)
In the above-described embodiment, the sample having the smallest particle size (for example, the sample having a particle size of less than 2 mm) is dried. However, drying of this sample is not essential. For example, depending on the particle size and moisture content of the sample, it is not necessary to dry the sample with the smallest particle size. Conversely, for a sample with a particle size other than the smallest particle size, the sample may be dried before imaging.
(変形例3)
上述した実施例では、図6に示す粒径加積曲線C1、図7に示すヒストグラム、図5に示す土の粒度試験の結果などの情報を表示部12に出力していたが、例えばコンピュータ10にプリンターが接続されている場合には、コンピュータ10はこれらの情報をこのプリンターによって媒体に印刷して出力させ得るようにしてもよい。
(Modification 3)
In the embodiment described above, information such as the particle size accumulation curve C1 shown in FIG. 6, the histogram shown in FIG. 7, the result of the soil particle size test shown in FIG. When a printer is connected to the computer, the
(変形例4)
画像解析の方法は、実施例で説明した方法に限らず、その他の周知の方法を採用することができる。
(Modification 4)
The image analysis method is not limited to the method described in the embodiment, and other known methods can be employed.
10 コンピュータ、11 制御部、12 表示部、13 入力部、14 記憶部、20 デジタルカメラ、21 撮影台、22 カメラスタンド。
DESCRIPTION OF
Claims (3)
各々の前記土粒子群を撮像した結果に基づき、各々の前記土粒子群における粒度を特定する部分粒度特定工程と、
前記分級工程により求めた各土粒子群の重量と、前記部分粒度特定工程により特定した各土粒子群における粒度に基づいて、前記土壌全体の粒度を特定する全体粒度特定工程と
を備える土壌の粒度解析方法。 Classifying the soil into each of a plurality of soil particle groups having a determined particle size range, and determining the weight of each of the soil particle groups,
Based on the result of imaging each of the soil particle groups, a partial particle size specifying step for specifying the particle size in each of the soil particle groups;
A soil particle size comprising: a weight of each soil particle group determined by the classification step, and an overall particle size identification step that identifies the particle size of the entire soil based on the particle size in each soil particle group identified by the partial particle size identification step analysis method.
請求項1記載の土壌の粒度解析方法。 The soil particle size according to claim 1, further comprising a drying step of drying the soil particle group having the smallest particle size among the plurality of soil particle groups classified in the classification step before the partial particle size specifying step. analysis method.
請求項1または2に記載の土壌の粒度解析方法。 The soil particle size analysis method according to claim 1, further comprising a display step of displaying the particle size specified in the overall particle size specifying step and the range of the particle size required for the soil.
Priority Applications (1)
| Application Number | Priority Date | Filing Date | Title |
|---|---|---|---|
| JP2013053917A JP6189059B2 (en) | 2013-03-15 | 2013-03-15 | Soil size analysis method |
Applications Claiming Priority (1)
| Application Number | Priority Date | Filing Date | Title |
|---|---|---|---|
| JP2013053917A JP6189059B2 (en) | 2013-03-15 | 2013-03-15 | Soil size analysis method |
Publications (2)
| Publication Number | Publication Date |
|---|---|
| JP2014178281A true JP2014178281A (en) | 2014-09-25 |
| JP6189059B2 JP6189059B2 (en) | 2017-08-30 |
Family
ID=51698364
Family Applications (1)
| Application Number | Title | Priority Date | Filing Date |
|---|---|---|---|
| JP2013053917A Active JP6189059B2 (en) | 2013-03-15 | 2013-03-15 | Soil size analysis method |
Country Status (1)
| Country | Link |
|---|---|
| JP (1) | JP6189059B2 (en) |
Cited By (2)
| Publication number | Priority date | Publication date | Assignee | Title |
|---|---|---|---|---|
| JP2021063380A (en) * | 2019-10-15 | 2021-04-22 | ケミカルグラウト株式会社 | Stratum structure analysis system and program |
| JP2021067468A (en) * | 2019-10-17 | 2021-04-30 | 五洋建設株式会社 | Method, device, program, and system for estimating soil quality |
Citations (12)
| Publication number | Priority date | Publication date | Assignee | Title |
|---|---|---|---|---|
| JPS54115188A (en) * | 1978-02-27 | 1979-09-07 | Sumitomo Metal Ind | Method of measuring form of powder grain and projected area measuring device therefor |
| JPS55164038A (en) * | 1979-06-05 | 1980-12-20 | Sumitomo Metal Ind Ltd | Water-content control method for sintered raw material |
| JPS6090053A (en) * | 1983-10-22 | 1985-05-21 | 株式会社大阪砕石工業所 | Crushed sand particle size adjusting apparatus |
| JPH0216432A (en) * | 1988-07-05 | 1990-01-19 | Seiki Tokyu Kogyo Kk | Aggregate grading analyzing method and broken stone grading control method for asphalt plant using image processing |
| JPH1110087A (en) * | 1997-06-23 | 1999-01-19 | Kobe Steel Ltd | Automatic particle size measuring device for sand |
| JPH11258141A (en) * | 1998-03-13 | 1999-09-24 | Nikkiso Co Ltd | Particle size distribution-measuring apparatus |
| JP2001074641A (en) * | 1999-06-30 | 2001-03-23 | Nikkiso Co Ltd | Grain size distribution-measuring device |
| JP2001337028A (en) * | 2000-05-30 | 2001-12-07 | Nikkiso Co Ltd | Method and apparatus for measuring particle size distribution |
| JP2005189179A (en) * | 2003-12-26 | 2005-07-14 | Jfe Steel Kk | Method for measuring granularity of powder granular material |
| JP2011163836A (en) * | 2010-02-06 | 2011-08-25 | Kajima Corp | Grain size measuring system for granular material and program |
| JP2012242099A (en) * | 2011-05-16 | 2012-12-10 | Kajima Corp | Method and system for measuring grain size of partitioned granular material |
| JP2013257188A (en) * | 2012-06-12 | 2013-12-26 | Kajima Corp | Particle size distribution measurement method and system for granular material |
-
2013
- 2013-03-15 JP JP2013053917A patent/JP6189059B2/en active Active
Patent Citations (12)
| Publication number | Priority date | Publication date | Assignee | Title |
|---|---|---|---|---|
| JPS54115188A (en) * | 1978-02-27 | 1979-09-07 | Sumitomo Metal Ind | Method of measuring form of powder grain and projected area measuring device therefor |
| JPS55164038A (en) * | 1979-06-05 | 1980-12-20 | Sumitomo Metal Ind Ltd | Water-content control method for sintered raw material |
| JPS6090053A (en) * | 1983-10-22 | 1985-05-21 | 株式会社大阪砕石工業所 | Crushed sand particle size adjusting apparatus |
| JPH0216432A (en) * | 1988-07-05 | 1990-01-19 | Seiki Tokyu Kogyo Kk | Aggregate grading analyzing method and broken stone grading control method for asphalt plant using image processing |
| JPH1110087A (en) * | 1997-06-23 | 1999-01-19 | Kobe Steel Ltd | Automatic particle size measuring device for sand |
| JPH11258141A (en) * | 1998-03-13 | 1999-09-24 | Nikkiso Co Ltd | Particle size distribution-measuring apparatus |
| JP2001074641A (en) * | 1999-06-30 | 2001-03-23 | Nikkiso Co Ltd | Grain size distribution-measuring device |
| JP2001337028A (en) * | 2000-05-30 | 2001-12-07 | Nikkiso Co Ltd | Method and apparatus for measuring particle size distribution |
| JP2005189179A (en) * | 2003-12-26 | 2005-07-14 | Jfe Steel Kk | Method for measuring granularity of powder granular material |
| JP2011163836A (en) * | 2010-02-06 | 2011-08-25 | Kajima Corp | Grain size measuring system for granular material and program |
| JP2012242099A (en) * | 2011-05-16 | 2012-12-10 | Kajima Corp | Method and system for measuring grain size of partitioned granular material |
| JP2013257188A (en) * | 2012-06-12 | 2013-12-26 | Kajima Corp | Particle size distribution measurement method and system for granular material |
Non-Patent Citations (1)
| Title |
|---|
| "土の粒度試験方法", 日本工業規格(JIS), vol. JIS-A-1204, JPN6016046142, 2009, JP, pages 1 - 10, ISSN: 0003454340 * |
Cited By (4)
| Publication number | Priority date | Publication date | Assignee | Title |
|---|---|---|---|---|
| JP2021063380A (en) * | 2019-10-15 | 2021-04-22 | ケミカルグラウト株式会社 | Stratum structure analysis system and program |
| JP7303720B2 (en) | 2019-10-15 | 2023-07-05 | ケミカルグラウト株式会社 | Strata structure analysis system and program |
| JP2021067468A (en) * | 2019-10-17 | 2021-04-30 | 五洋建設株式会社 | Method, device, program, and system for estimating soil quality |
| JP7292176B2 (en) | 2019-10-17 | 2023-06-16 | 五洋建設株式会社 | SOIL PROPERTIES ESTIMATION METHOD, DEVICE, PROGRAM AND SYSTEM |
Also Published As
| Publication number | Publication date |
|---|---|
| JP6189059B2 (en) | 2017-08-30 |
Similar Documents
| Publication | Publication Date | Title |
|---|---|---|
| Macfarlane | Classification method of mixed pixels does not affect canopy metrics from digital images of forest overstorey | |
| EP3605064A1 (en) | Raw material particle size distribution measuring device, particle size distribution measuring method, and void ratio measuring device | |
| CN104502245B (en) | A kind of method that utilization image analysis technology determines sand fineness modulus | |
| US8675122B2 (en) | Determining exposure time in a digital camera | |
| US20210209422A1 (en) | Learning data collection apparatus, learning data collection method, and program | |
| KR102084535B1 (en) | Defect inspection device, defect inspection method | |
| JP2008268051A (en) | Method and system for measuring freshly mixed concrete aggregate particle size | |
| US10115034B2 (en) | Method and system for projecting image with differing exposure times | |
| CN103063576A (en) | Method for quantitatively analyzing inclusions in steel under laser microscope | |
| KR101674391B1 (en) | Apparatus for measuring contamination on lens | |
| US9557299B2 (en) | Adaptive data collection for local states of a material | |
| JP6189059B2 (en) | Soil size analysis method | |
| KR101370496B1 (en) | Estimation method for volume fractions of constituent materials in a unit voxel of x-ray ct image | |
| JP2015138271A (en) | Unevenness analysis method | |
| CN112945808A (en) | Method and system for analyzing aggregate particle size after slag soil multi-stage separation | |
| US8301410B2 (en) | Visual weight compensation | |
| CN103048257A (en) | Sandy soil type identification and particle component analysis device | |
| JP6489912B2 (en) | Particle size distribution analysis method and quality control method for construction materials | |
| JP7411494B2 (en) | Concrete management system, concrete management method and concrete management program | |
| JP4939860B2 (en) | Method and apparatus for analyzing image data | |
| KR102614845B1 (en) | Fraction measurement method and device | |
| JP2009041953A (en) | Quantitative analyzer, quantitative analyzing method and quantitative analyzing program | |
| JP2021111928A (en) | Abnormality detection device and abnormality detection method | |
| JP2021064201A (en) | Image inspection method, image inspection device, and image inspection program | |
| JP2010281631A (en) | Quality inspection method and quality inspection apparatus |
Legal Events
| Date | Code | Title | Description |
|---|---|---|---|
| A621 | Written request for application examination |
Free format text: JAPANESE INTERMEDIATE CODE: A621 Effective date: 20160107 |
|
| A977 | Report on retrieval |
Free format text: JAPANESE INTERMEDIATE CODE: A971007 Effective date: 20161019 |
|
| A131 | Notification of reasons for refusal |
Free format text: JAPANESE INTERMEDIATE CODE: A131 Effective date: 20161206 |
|
| A521 | Request for written amendment filed |
Free format text: JAPANESE INTERMEDIATE CODE: A523 Effective date: 20170201 |
|
| TRDD | Decision of grant or rejection written | ||
| A01 | Written decision to grant a patent or to grant a registration (utility model) |
Free format text: JAPANESE INTERMEDIATE CODE: A01 Effective date: 20170801 |
|
| A61 | First payment of annual fees (during grant procedure) |
Free format text: JAPANESE INTERMEDIATE CODE: A61 Effective date: 20170802 |
|
| R150 | Certificate of patent or registration of utility model |
Ref document number: 6189059 Country of ref document: JP Free format text: JAPANESE INTERMEDIATE CODE: R150 |
|
| R250 | Receipt of annual fees |
Free format text: JAPANESE INTERMEDIATE CODE: R250 |