JP2004144748A - Efficient sampling method and apparatus for digital waveform for eye diagram analysis - Google Patents
Efficient sampling method and apparatus for digital waveform for eye diagram analysis Download PDFInfo
- Publication number
- JP2004144748A JP2004144748A JP2003357418A JP2003357418A JP2004144748A JP 2004144748 A JP2004144748 A JP 2004144748A JP 2003357418 A JP2003357418 A JP 2003357418A JP 2003357418 A JP2003357418 A JP 2003357418A JP 2004144748 A JP2004144748 A JP 2004144748A
- Authority
- JP
- Japan
- Prior art keywords
- data signal
- digital data
- eye diagram
- waveform
- determining
- Prior art date
- Legal status (The legal status is an assumption and is not a legal conclusion. Google has not performed a legal analysis and makes no representation as to the accuracy of the status listed.)
- Pending
Links
Images


Classifications
-
- G—PHYSICS
- G01—MEASURING; TESTING
- G01R—MEASURING ELECTRIC VARIABLES; MEASURING MAGNETIC VARIABLES
- G01R31/00—Arrangements for testing electric properties; Arrangements for locating electric faults; Arrangements for electrical testing characterised by what is being tested not provided for elsewhere
- G01R31/28—Testing of electronic circuits, e.g. by signal tracer
- G01R31/317—Testing of digital circuits
- G01R31/3181—Functional testing
- G01R31/319—Tester hardware, i.e. output processing circuits
- G01R31/31901—Analysis of tester Performance; Tester characterization
-
- G—PHYSICS
- G01—MEASURING; TESTING
- G01R—MEASURING ELECTRIC VARIABLES; MEASURING MAGNETIC VARIABLES
- G01R29/00—Arrangements for measuring or indicating electric quantities not covered by groups G01R19/00 - G01R27/00
- G01R29/26—Measuring noise figure; Measuring signal-to-noise ratio
-
- G—PHYSICS
- G01—MEASURING; TESTING
- G01R—MEASURING ELECTRIC VARIABLES; MEASURING MAGNETIC VARIABLES
- G01R31/00—Arrangements for testing electric properties; Arrangements for locating electric faults; Arrangements for electrical testing characterised by what is being tested not provided for elsewhere
- G01R31/28—Testing of electronic circuits, e.g. by signal tracer
- G01R31/317—Testing of digital circuits
- G01R31/31703—Comparison aspects, e.g. signature analysis, comparators
Abstract
Description
本発明は、一般にディジタル信号の計測に係り、より詳しくはアイ・ダイヤグラム解析を活用してディジタルデータ信号の特性を割り出す方法及び装置に関する。 The present invention generally relates to digital signal measurement, and more particularly, to a method and apparatus for determining characteristics of a digital data signal by utilizing eye diagram analysis.
アイ・ダイヤグラム解析は、高速のディジタルの電気的・光学的通信信号の挙動を研究するための重要なツールである。アイ・ダイヤグラムは、オシロスコープや他の適当なディスプレイデバイス上にディジタルデータ信号の論理1,0の波形を組み合わせた合成像を表示する一つの方法である。例えば、アイ・ダイヤグラムは、例えばディジタル信号のデータレートで同期クロック信号によりトリガーしながら、オシロスコープの垂直チャンネルに波形を印加することでオシロスコープ上で生成される。高速ディジタル信号のアイ・ダイヤグラムは、しばしば繰り返しサンプリングオシロスコープ(例えば、アジレント・テクノロジーズ(Agilent Technologies)社製86100Bサンプリングオシロスコープ)を用いて生成される。生成されたアイ・ダイヤグラムの特徴を計測することで、信号対雑音比や消光比やジッタやデューティサイクル歪等のディジタルデータ信号の様々な特性を簡単に割り出す(測定する)ことができる。 Eye diagram analysis is an important tool for studying the behavior of high-speed digital electrical and optical communication signals. An eye diagram is one method of displaying a composite image combining the logical 1, 0 waveforms of a digital data signal on an oscilloscope or other suitable display device. For example, an eye diagram is generated on an oscilloscope by applying a waveform to a vertical channel of the oscilloscope, for example, triggered by a synchronous clock signal at the data rate of the digital signal. Eye diagrams of high-speed digital signals are often generated using a repetitive sampling oscilloscope (e.g., Agilent @ Technologies 86100B sampling oscilloscope). By measuring the characteristics of the generated eye diagram, it is possible to easily determine (measure) various characteristics of the digital data signal such as the signal-to-noise ratio, the extinction ratio, the jitter, and the duty cycle distortion.
完全なアイ・ダイヤグラムの構成には200,000乃至1,000,000サンプルを必要とすることがあり、この量のデータを得るのに何十秒かが必要とされよう。この種の時間長は、部品やシステムの製造者の効率及び適応性やアイ・ダイヤグラム解析を用いるその他の人に悪影響を及ぼすことがある。 Construction of a complete eye diagram may require 200,000 to 1,000,000 samples, and tens of seconds will be required to obtain this amount of data. This length of time can have an adverse effect on the efficiency and adaptability of the part or system manufacturer and others using eye diagram analysis.
従って、アイ・ダイヤグラム解析を用いてディジタルデータ信号の特性を効率的に割り出す方法と装置に対する要求が存在する。 Accordingly, there is a need for a method and apparatus for efficiently characterizing digital data signals using eye diagram analysis.
本発明は、アイ・ダイヤグラム解析を用いてディジタルデータ信号の特性を割り出す効率的な方法と装置を提供するものである。 The present invention provides an efficient method and apparatus for determining characteristics of a digital data signal using eye diagram analysis.
本発明になるディジタルデータ信号の少なくとも一つの特性を割り出す方法には、ディジタルデータ信号の関心のある少なくとも一つの特性を割り出すための情報を含むアイ・ダイヤグラムの少なくとも一つの領域の特定が含まれる。ディジタルデータ信号の十分なサンプルを採取し、アイ・ダイヤグラム全体を完全に構成することなくアイ・ダイヤグラムの特定された少なくとも一つの領域だけを完全に構成し、アイ・ダイヤグラムの完全構成した少なくとも一つの領域から少なくとも一つの関心のある特性をそこで割り出す。 The method of determining at least one characteristic of a digital data signal according to the present invention includes identifying at least one region of an eye diagram that includes information for determining at least one characteristic of interest of the digital data signal. Taking a sufficient sample of the digital data signal to completely compose at least one identified area of the eye diagram without completely composing the entire eye diagram; From there, at least one characteristic of interest is determined.
本発明は、ディジタルデータ信号の多くの特性をアイ・ダイヤグラムの1又は数個の領域のみに含まれる情報を活用することで割り出すことを認めるものである。従って、本発明はディジタルデータ信号の関心のある特定の特性を割り出すのに必要なアイ・ダイヤグラムの1又は複数の領域だけを完全に構成し、アイ・ダイヤグラムの他の領域は完全に構成はしない。その結果、ディジタルデータ信号の関心のある特定の特性を、アイ・ダイヤグラム全体を完全に構成するのに必要とされるであろうディジタルデータ信号よりも少ないサンプルで構成されるアイ・ダイヤグラムから正確に割り出すことができ、サンプリング時間の相当の低減をもたらすことができる。 The present invention recognizes that many characteristics of a digital data signal can be determined by utilizing information contained in only one or a few areas of an eye diagram. Thus, the present invention completely configures only one or more regions of the eye diagram necessary to determine a particular characteristic of interest of the digital data signal, and does not completely configure other regions of the eye diagram. . As a result, the particular characteristic of interest of the digital data signal can be accurately derived from an eye diagram composed of fewer samples than would be required to fully compose the entire eye diagram. Can be determined and can result in a significant reduction in sampling time.
本発明の例示実施形態によれば、消光比やコントラスト比やオーバーシュートやアンダーシュートや1と0のレベルや信号対雑音比や立ち上がり時間や立ち下がり時間やビットレートや交差百分率やジッタやデューティサイクル歪やアイ高やアイ幅やアイ振幅や光変調振幅(OMA)といったディジタルデータ信号の特性を、必要な計測をなさしめるのに必要なアイ・ダイヤグラムの1又は複数の領域だけを完全に構成することで容易に割り出すことができる。 According to exemplary embodiments of the present invention, extinction ratio, contrast ratio, overshoot, undershoot, 1 to 0 level, signal to noise ratio, rise time, fall time, bit rate, cross percentage, jitter, duty cycle The characteristics of the digital data signal, such as distortion, eye height, eye width, eye amplitude, and optical modulation amplitude (OMA), completely compose only one or more regions of the eye diagram needed to make the required measurements. Can be easily determined.
本発明の他の例示的実施形態によれば、特定ステップはアイ・ダイヤグラム上に重畳した少なくとも一つのマスク領域に近いアイ・ダイヤグラムの少なくとも一つの領域の特定を含み、割り出しステップは少なくとも一つのマスク領域に対するディジタルデータ信号の関心のある少なくとも一つの特性の割り出しを含む。 According to another exemplary embodiment of the present invention, the identifying step includes identifying at least one region of the eye diagram that is close to the at least one mask region superimposed on the eye diagram, and wherein the determining step includes at least one masking operation. The method includes determining at least one characteristic of interest of the digital data signal for the region.
重畳したマスク領域に近いアイ・ダイヤグラムの1又は複数の領域にだけサンプルを集中させることで、より効率的にサンプルを分布させ、例えば試験対象の特定の製品がマスク試験に合格するかどうか、仮にそうである場合にその製品がマスク試験に合格する余地があるかどうかを正確に判定することができる。さらに、本発明は上述のものに加え或いはこれに代え他の特徴と効果を備えた実施形態を供給するものである。これらの特徴と効果の多くは、以下の図面を参照することで下記の説明から明らかとなろう。 By concentrating the sample only in one or more areas of the eye diagram near the superimposed mask area, the sample can be distributed more efficiently, e.g., to determine whether a particular product under test passes the mask test. If so, it can be accurately determined whether the product has room to pass the mask test. Further, the present invention provides embodiments having other features and advantages in addition to or in place of those described above. Many of these features and advantages will be apparent from the description below with reference to the following drawings.
図1は、ディジタルの光学的或いは電気的な通信信号等のディジタルデータ信号の特性を表わし、本発明の説明を助ける例示的アイ・ダイヤグラムを概略示している。このアイ・ダイヤグラムは概ね参照符号10で表わされるようなものであり、適当なサンプリング装置のディスプレイ上、例えばサンプリングオシロスコープの表示スクリーン12上に表示される。
FIG. 1 schematically illustrates an exemplary eye diagram that illustrates the characteristics of a digital data signal, such as a digital optical or electrical communication signal, and helps to explain the present invention. The eye diagram is generally represented by
アイ・ダイヤグラム10はディジタルデータ信号の論理1,0の組み合わせ波形の合成像であり、同期クロック信号を例えばディジタルデータ信号のデータレートでもってトリガーしつつサンプリングオシロスコープの垂直チャンネルへ波形を印加することで生成される。アイ・ダイヤグラム10の特徴を計測することで、ディジタルデータ信号の様々な特性を容易に割り出す(測定する)ことができる。 An eye diagram 10 is a composite image of a combination waveform of logic 1 and 0 of a digital data signal, and is obtained by applying a waveform to a vertical channel of a sampling oscilloscope while triggering a synchronous clock signal at, for example, the data rate of a digital data signal. Generated. By measuring the characteristics of the eye diagram 10, various characteristics of the digital data signal can be easily determined (measured).
1Gb/s未満のデータレートでは、一般に実時間サンプリングオシロスコープが用いられ、図1のアイ・ダイヤグラム10などのアイ・ダイヤグラムを生成する。実時間サンプリングオシロスコープは、連続するデータビットの完全なシーケンスからなる波形記録を捕捉するのに非常に高速のA/D変換器を用いている。実時間サンプリングにより、一例として例えば緩慢な立ち上がり時間や過度のオーバーシュートといった波形誤差に先行するデータパターンの特性が分かるようになる。アイ・ダイヤグラムは、エッジを位置決めし、互いの頂部にビットを配置することで実時間サンプリングオシロスコープにより生成することができる。 At data rates less than $ 1 Gb / s, a real-time sampling oscilloscope is typically used to generate an eye diagram, such as eye diagram 10 of FIG. Real-time sampling oscilloscopes use very fast A / D converters to capture waveform records consisting of a complete sequence of consecutive data bits. By real-time sampling, the characteristics of a data pattern preceding a waveform error such as a slow rise time or excessive overshoot can be known, for example. An eye diagram can be generated by a real-time sampling oscilloscope by locating edges and placing bits on top of each other.
実時間サンプリングオシロスコープのA/D変換器は、データレートよりも遥かに高速で波形をサンプリングする。例えば商用の実時間サンプリングオシロスコープはデータレートの4〜10倍のサンプリングレートを採用することもできる。商用の実時間サンプリングオシロスコープは通常約2GHzの帯域と約1Gb/sのデータレートに限られる。より高いデータレートについては、繰り返しサンプリングオシロスコープがアイ・ダイヤグラムの構成に用いられる。繰り返しサンプリングオシロスコープでは、各トリガー事象によりオシロスコープはデータ波形の単純なサンプルを採取し、そのサンプルを表示スクリーン上に単一点として表示する。各後続のサンプリング点(新たなトリガー事象に続く)は、トリガー時点に対し次第に遅れるようになる。様々なトリガー事象の後で、オシロスコープはサンプリングした波形の表示を含むアイ・ダイヤグラムでもって表示スクリーンを満たす。 The real-time sampling oscilloscope A / D converter samples the waveform much faster than the data rate. For example, a commercial real-time sampling oscilloscope may employ a sampling rate that is 4 to 10 times the data rate. Commercial real-time sampling oscilloscopes are typically limited to a bandwidth of about 2 GHz and a data rate of about 1 Gb / s. For higher data rates, a repetitive sampling oscilloscope is used to construct the eye diagram. In a repetitive sampling oscilloscope, each trigger event causes the oscilloscope to take a simple sample of the data waveform and display that sample as a single point on the display screen. Each subsequent sampling point (following a new trigger event) becomes progressively delayed with respect to the trigger time. After various trigger events, the oscilloscope fills the display screen with an eye diagram that includes a display of the sampled waveform.
ディジタル通信信号を正確に表わす図1のアイ・ダイヤグラム10などのアイ・ダイヤグラム全体を完全に構成するには、約200,000乃至約1,000,000サンプルが必要であろう。この量のデータの入手には何十秒も必要になりそうであり、この試験時間の低減をもたらすであろうディジタルデータ信号の特性割り出しに有効な技法をもたらすことが望まれる。 構成 Completely constructing an entire eye diagram, such as eye diagram 10 of FIG. 1 that accurately represents a digital communication signal, will require about 200,000 to about 1,000,000 samples. Obtaining this amount of data is likely to require tens of seconds, and it is desirable to provide an effective technique for characterizing digital data signals that will result in this test time reduction.
本発明は、ディジタルデータ信号の多くの特性がアイ・ダイヤグラムの1又は数個の領域にのみ含まれる特徴を計測することで割り出せることを認めるものである。従って、特定の関心のある特性を割り出すのに計測しなければならない特徴を含むアイ・ダイヤグラムの特定の1又は複数の領域を完全に構成することだけが必要であり、アイ・ダイヤグラム全体を完全に構成することは必要でない。 The present invention recognizes that many characteristics of a digital data signal can be determined by measuring features contained only in one or several regions of the eye diagram. Thus, it is only necessary to completely configure one or more specific areas of the eye diagram that include the features that must be measured to determine a particular property of interest, and to completely construct the entire eye diagram. No configuration is necessary.
例えば、ディジタルデータ信号の消光比は、一般にアイ・ダイヤグラム中央の20%ほどにヒストグラムを構築し、二つの得られたヒストグラムの平均値を配置して1と0のレベルを計測することで割り出される。従って、アイ・ダイヤグラム中央の20%内に含まれるサンプルだけが消光比の割り出しに関係し、多数のサンプルを採取してアイ・ダイヤグラムのその領域のみを完全構成する必要がある(何故なら1,0レベル、特に0レベルを正確に計測するには、多数のサンプルが必要だからである)。アイ・ダイヤグラム全体を完全に構成するのに通常採取するであろう他のサンプルは、この特定の計測には必要ではなく、かくして限られた数のサンプルを採取して1と0の交点に対するアイ中央の20%を配置すること(このことは後述する)以外は必要ではない。
For example, the extinction ratio of a digital data signal is generally determined by constructing a histogram at about 20% of the center of the eye diagram, arranging the average value of the two obtained histograms, and measuring the levels of 1 and 0. It is. Therefore, only those samples that fall within 20% of the center of the eye diagram are involved in determining the extinction ratio, and it is necessary to take a number of samples to completely compose only that region of the eye diagram (because 1, This is because a large number of samples are required to accurately measure the zero level, especially the zero level.) Other samples that would normally be taken to make up the complete eye diagram are not necessary for this particular measurement, and thus a limited number of samples are taken to obtain the eye for the intersection of 1 and 0. It is not necessary other than to arrange the
図2は、本発明の一実施形態になるディジタルデータ信号の消光比を割り出すのに用いることのできるアイ・ダイヤグラムを概略示すものである。アイ・ダイヤグラム20は、先ず数個のサンプルを採取しアイ・ダイヤグラム20全体を大雑把に画定し、これによりアイ・ダイヤグラム20の関心のある領域25a,25bを特定し、続いて領域25a,25b内で十分な数を採取してその領域を完全に構成することで構成される。かくして、図2に示した如く、アイ・ダイヤグラム20は完全に構成された領域25a,25bと、部分的にのみ構成された領域26,27を備える。完全に構成された領域25a,25bには、通常(交点間の)ビット周期の中央20%が含まれ、領域25a,25bが28,29に概略図示した完全構成ヒストグラムであるため、ディジタルデータ信号の消光比は正確に割り出すことのできる領域25a,25b内のデータを用いて構築することができる。
FIG. 2 schematically shows an eye diagram that can be used to determine the extinction ratio of a digital data signal according to an embodiment of the present invention. The eye diagram 20 first takes a few samples and roughly defines the entire eye diagram 20, thereby identifying the regions of
ここで用いる用語「完全に構成」が、十分な数のサンプルを採取してアイ・ダイヤグラム全体を正確に構成するか、或いはディジタルデータ信号の関心のある特性を正確に割り出せるよう計測をなすことができるアイ・ダイヤグラムの一領域を正確に構成することを概ね指すことは理解されたい。アイ・ダイヤグラム全体を完全に構成したりアイ・ダイヤグラムの一領域を完全構成するのに必要とされるであろうサンプルの数は、例えば割り出そうとしている関心のある特定の特性やユーザの精度要件に応じて変化しよう。 As used herein, the term "completely configured" refers to either taking a sufficient number of samples to accurately compose the entire eye diagram, or to make measurements to accurately determine the properties of interest of a digital data signal. It should be understood that this generally refers to exactly configuring one area of the possible eye diagram. The number of samples that will be required to fully compose the entire eye diagram or a region of the eye diagram depends, for example, on the specific characteristics of interest that are being determined and the accuracy of the user. Let's change according to requirements.
用語「アイ・ダイヤグラム全体」が、ここでは図1のアイ・ダイヤグラムなどの全ての領域を含むアイ・ダイヤグラムの記述に用いていることもまた理解されたい。図1のアイは二つのエッジ交差を示し、データ信号の1.6ビット周期の表示であることを意味する約1.6UI(単位周期)を備える。しかしながら、アイ・ダイヤグラム全体は1.6UIを超えるかそれ未満であるが、通常は1UI以上であり、2UI未満である。1UIを超えるアイは冗長データサンプルを有しており、それ故データ信号に関する追加の情報を一切供給しない。これにも拘わらず、明瞭にしかつ幾つかの計測値がより複雑化しないよう、これらの追加の冗長サンプルは通常アイ・ダイヤグラム内に含まれる。この理由から、用語「アイ・ダイヤグラム全体」はここでは少なくとも1UIのデータからなる全領域を意味するのに用いられる。 It should also be understood that the term “entire eye diagram” is used herein to describe an eye diagram that includes all regions, such as the eye diagram of FIG. The eye in FIG. 1 shows two edge crossings and has about 1.6 UI (unit period), which is a representation of a 1.6 bit period of the data signal. However, the overall eye diagram is greater than or less than 1.6 UI, but is typically greater than or equal to 1 UI and less than 2 UI. Eyes greater than 1 UI have redundant data samples and therefore do not provide any additional information about the data signal. Nevertheless, these additional redundant samples are usually included in the eye diagram, for clarity and to make some measurements less complicated. For this reason, the term "whole eye diagram" is used herein to mean the entire region consisting of at least 1 UI of data.
また、図1のアイは、その二つのエッジが交差する領域を左右に等間隔に置いた状態で表示領域内で中央寄せして図示してある。しかしながら、ディスプレイの各側にある交点を備える二つの交差領域が示すのはアイ・ダイヤグラムの通常の位置であり、本発明の好適な実施形態はそのように中央寄せしていないアイ・ダイヤグラム上で同じく良好に機能するが、例えば、単一の交差領域がディスプレイ中央或いは他の位置に配置される場合である。 {Circle around (1)} The eye in FIG. 1 is shown centered in the display area with the areas where the two edges intersect at equal intervals on the left and right. However, the two intersecting regions with intersections on each side of the display indicate the normal location of the eye diagram, and a preferred embodiment of the present invention is on such an uncentered eye diagram. It works equally well, for example, when a single intersection area is located at the center of the display or elsewhere.
図1のアイ・ダイヤグラムは、NRZデータ信号或いはノン・リターン・ゼロ・データ信号から生成されたノンリターン・ツー・ゼロ・アイである。アイは、必ずしもこの形式だけであるとは限らない。本発明の好適な実施形態は、RZ(リターン・ツー・ゼロ)や3以上の信号レベルを用いるデータ信号から生成された複数レベル変調アイなどの他の信号形式を用いても同じく良好に機能する。 ア イ The eye diagram of FIG. 1 is a non-return to zero eye generated from an NRZ data signal or a non-return zero data signal. Eyes are not always in this form. The preferred embodiment of the present invention works equally well with other signal formats such as RZ (Return to Zero) and multi-level modulated eyes generated from data signals using more than two signal levels. .
図2に示した本発明の例示実施形態では、約2,000程度のみのサンプルを採取してアイ・ダイヤグラム20全体を大雑把に画定している。領域25a,25b内に残るサンプルを集中させ、ビット周期の中央20%を構成することで、かくしてディジタルデータ信号の消光比の割り出しには1.6単位期間のアイ・ダイヤグラムを完全に構成した場合に必要とされるであろうものよりも約88%少ないデータが必要とされることになろう。このことで、試験時間全体の約88%が低減される結果となる。アイ・ダイヤグラム全体を完全に構成するのに1,000,000サンプルを採取することになる例示実施形態では、約120,000個のサンプルだけがアイ・ダイヤグラムの領域25a,25bの完全な構成に必要とされよう。
In the exemplary embodiment of the present invention shown in FIG. 2, only about 2,000 samples are taken to roughly define the entire eye diagram 20. When the samples remaining in the
ディジタルデータ信号の他の特性もまた、アイ・ダイヤグラム内の中央20%のビット周期にのみ含まれるデータを用いることで割り出すことができる。例えば、1,0レベルや信号対雑音比やアイ高さやアイ振幅を割り出すための計測は、アイ・ダイヤグラム20の領域25a,25bだけを用いて作成することができる。
Other characteristics of the digital data signal can also be determined by using the data contained only in the central 20% bit period in the eye diagram. For example, measurements for determining the 1,0 level, the signal-to-noise ratio, the eye height, and the eye amplitude can be created using only the
ディジタルデータ信号の他の特性を割り出すには、アイ・ダイヤグラムの他の領域を完全構成する。例えば、図3に示すように、アイ・ダイヤグラム30の領域35にサンプルを集中させることでジッタを割り出すことができる。図4に示す如く、立ち上がり時間はサンプルをアイ・ダイヤグラム40の領域45,46に集中させることで割り出すことができ、図5に示す如く、立ち下がり時間はアイ・ダイヤグラム50の領域55,56にサンプルを集中させることで割り出すことができる。図6に示す如く、ビットレートとアイ幅はアイ・ダイヤグラム60の領域65,66にサンプルを集中させることで割り出すことができる。
割 り To determine other characteristics of the digital data signal, complete the other areas of the eye diagram. For example, as shown in FIG. 3, the jitter can be determined by concentrating the sample in the
図2乃至6から明らかな如く、ディジタルデータ信号の多くの特性はアイ・ダイヤグラムの比較的小さな1又は複数の領域だけを構成することで割り出すことができる。 As is apparent from FIGS. 2-6, many characteristics of a digital data signal can be determined by constructing only one or more relatively small areas of the eye diagram.
ディジタルデータ信号の若干の特性は、図2乃至6のアイ・ダイヤグラム内に図示した領域の一部組み合わせ或いはアイ・ダイヤグラムの他の領域の一部組み合わせを用いて割り出すことができる。例えば、交差百分率は1,0レベルとジッタの両方の割り出しに収集するデータから割り出すことができる。デューティサイクル歪の割り出しもまた、1,0レベルとジッタの割り出しに用いるのと同じデータを必要とするが、データサイクル歪が大である場合は、交点周りに収集するデータを増大させる必要があるかも知れない。 Some characteristics of the digital data signal can be determined using some combination of the regions shown in the eye diagrams of FIGS. 2-6 or some combination of other regions of the eye diagram. For example, the intersection percentage can be determined from the data collected for both the 1,0 level and jitter determination. Determining the duty cycle distortion also requires the same data used to determine the 1,0 level and jitter, but if the data cycle distortion is large, more data needs to be collected around the intersection. May.
ディジタルデータ信号の特性を割り出す他の一般的な方法は、「マスク試験」である。従来、マスク試験は、ディジタルデータ信号の十分なサンプルを採取してアイ・ダイヤグラム全体を完全に構成し、続いて構成済みアイ・ダイヤグラム全体に「締め出し」領域のマスク或いはテンプレートを重畳させることで構成していた。例えば1以上のサンプルが、マスク領域の内側に含まれることでマスクを侵犯する場合は、試験は失敗である。 Another common method of determining the characteristics of a digital data signal is a "mask test". Traditionally, mask testing consists of taking enough samples of the digital data signal to completely compose the entire eye diagram, and then superimposing a mask or template in the "lock-out" area over the entire constructed eye diagram. Was. The test fails if, for example, one or more samples violates the mask by being contained inside the mask area.
本発明の一実施形態によれば、アイ・ダイヤグラムは近接してマスク領域を侵犯するアイ・ダイヤグラムの1又は複数の領域内にのみ完全構成してある。例えば図7は、その上に重畳した複数のマスク領域72,74,76を有するアイ・ダイヤグラム70を示している。また、図7に示す如く、各マスク領域の区域72a,74a,76aはマスクと各マスク領域の領域72b,74b,76bは、マスク縁部を備えている。
According to one embodiment of the present invention, the eye diagram is fully configured only in one or more regions of the eye diagram that violate the mask region in close proximity. For example, FIG. 7 shows an eye diagram 70 having a plurality of
また、図7に示す如く、アイ・ダイヤグラム70の領域78はマスク領域76の近くにある。従って、領域78内にサンプルを集中させることで、マスク領域に対するディジタルデータ信号の特性、例えばサンプルがマスク或いはマスク縁部内に落ちるか否かを確認することができる。アイ・ダイヤグラム70の残りはマスク領域の近くにはなく、従ってアイ・ダイヤグラム70の残りを完全構成する必要はなく、何故ならその中に含まれる情報はマスク試験にとって重要でないからである。本発明の例示実施形態では、アイ・ダイヤグラム70全体の少数のサンプルを採取してマスクが適切に配置されるようにし、マスクに近い領域を特定し、続いてより多数のサンプルを採取して近接領域を構成するようにしてある。図7の領域78などの領域は、約12,000のサンプルだけを採取することで正確に構成することができ、その生成に約300msが必要であり、対照的に例えばアイ・ダイヤグラム全体を完全構成するには約500,000サンプルを採取し、その生成には約13秒が必要である。この点で、他のアイ・ダイヤグラムはマスクに近い別の領域或いは複数の領域を有し、大半のサンプルがこの種の領域の完全構成に必要とされることになろうことは認識されたい。しかしながら、ここでもアイ・ダイヤグラム全体を完全構成する必要はない。
{Circle around (7)} As shown in FIG. 7, the
図8は、図2乃至7に示した全ての領域を完全構成して全ての一般的なアイ計測が実行できるようにするアイ・ダイヤグラム80を概略示す。図8から明らかな如く、たとえこの「最悪のケース」の筋書きにあっても、アイ・ダイヤグラム全体の完全構成に必要なデータの約50%だけが必要である(ただし、どのアイ・ダイヤグラムの領域、或いは、どれ位の数のアイ・ダイヤグラムの領域がマスクに近いかに応じて厳密な百分率は変わることがある)。 FIG. 8 schematically illustrates an eye diagram 80 that fully configures all regions shown in FIGS. 2 through 7 so that all common eye measurements can be performed. As is evident from FIG. 8, even in this "worst case" scenario, only about 50% of the data required for the complete construction of the entire eye diagram is needed (however, the area of any eye diagram Alternatively, the exact percentage may vary depending on how many areas of the eye diagram are close to the mask).
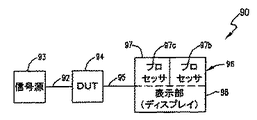
図9は、本発明の一実施形態になるディジタルデータ信号の特性を割り出す装置90を概略示すブロック線図である。図9に示す如く、信号源93からのディジタルデータ信号92は試験対象デバイス(DUT)94を通過する。別々の構成要素として示したが、信号源93はそれらの固有信号を生成することのできる特定のDUT内に組み込むことができる。ディジタルデータ信号95はDUT94から出力され、ディジタルデータ信号95を表わすアイ・ダイヤグラムがサンプリング装置96により生成される。サンプリング装置96は、好ましくはサンプリングオシロスコープを含み、アイ・ダイヤグラムを生成するプロセッサ部97と生成されたアイ・ダイヤグラムを表示する表示部98を含む。生成されたアイ・ダイヤグラムから出力ディジタルデータ信号95の特性を割り出すことで、DUTによるディジタルデータ信号92の変化態様を割り出すことができる。
FIG. 9 is a block diagram schematically showing an apparatus 90 for determining characteristics of a digital data signal according to an embodiment of the present invention. As shown in FIG. 9, a digital data signal 92 from a signal source 93 passes through a device under test (DUT) 94. Although shown as separate components, the signal source 93 can be incorporated into a particular DUT capable of generating their unique signals. Digital data signal 95 is output from
アイ・ダイヤグラム全体を完全構成することなく、アイ・ダイヤグラムの1以上の領域を完全構成するよう選択的なサンプリングを達成するため、サンプリング装置96はトリガー基準に対するサンプリングタイミングとサンプリング対象波形中の特定ビットの両方を制御できることが好ましい。前述の如く、サンプリングオシロスコープはトリガーに対するサンプリング時間の制御能力を既に含んでおり、この能力は第1のプロセッサ部97aにより図9に表わしてある。サンプリング対象波形中の特定ビットを制御することには、DUTを駆動するのに用いるパターン発生器を制御するか、さもなくば制御されたパターン発生器から、すなわちサンプリング装置内の長期プログラム遅延又はパターン長に設定したカウンタでもってトリガーした既知の固定パターンからトリガーを生成する必要がある。サンプリング対象波形中の特定ビットを制御する能力は、第2のプロセッサ部97bにより図9に表わしてある。 To achieve selective sampling to completely construct one or more regions of the eye diagram without completely constructing the entire eye diagram, the sampling device 96 may include a sampling timing relative to a trigger reference and a particular bit in the waveform to be sampled. It is preferable that both can be controlled. As described above, the sampling oscilloscope already includes the ability to control the sampling time for the trigger, which is represented in FIG. 9 by the first processor unit 97a. Controlling specific bits in the waveform to be sampled involves controlling the pattern generator used to drive the DUT, or from a controlled pattern generator, ie, a long program delay or pattern in the sampling device. It is necessary to generate a trigger from a known fixed pattern triggered by a counter set to long. The ability to control specific bits in the waveform to be sampled is shown in FIG. 9 by the second processor unit 97b.
図10は、本発明の一実施形態になる等価時間サンプリングシステム内でのアイ・ダイヤグラムを生成するサンプリング装置90のプロセッサ部97aの詳細を示す。プロセッサ部97aは、同期トリガー事象(例えば、印加したトリガー信号102中の立ち上がりエッジ或いは立ち下がりエッジなど)をトリガー検出ユニット104を介して検出する連続的なタイムベースを用い、高精度遅延発生器106を介してトリガー事象とトリガー検出ユニットのサンプリングストローブとの間の正確にプログラム可能な遅延を生成する。高精度遅延発生器106は、微遅延発生器108と粗遅延発生器110を含む。サンプルは、タイムベース遅延により決まる可変時間においてサンプリングチャンネル120,122により採取され、採取したサンプルはA/D変換器124,126によりディジタル値へ変換される。(図10に示した装置は例示のみを意図したものであって、本発明が図示した特定のアーキテクチャに限定されないことは理解されたい。例えば、プロセッサ部97aは2を超えるか或いはこれよりも少ないサンプリングチャンネルを有するかし、本発明はどんな特定数のサンプリングチャンネルに限定されないことは理解されたい)。
FIG. 10 shows the details of the processor unit 97a of the sampling device 90 that generates an eye diagram in the equivalent time sampling system according to one embodiment of the present invention. The processor unit 97a uses a continuous time base that detects a synchronization trigger event (eg, a rising edge or a falling edge in the applied trigger signal 102) via the trigger detection unit 104, and uses a high
データストリーム内の個々のビットを視認し計測するのに、パターントリガーが用いられる。パターントリガーは、パターンを反復するたびに一回発生するトリガーパルスである。例えば、27−1PRBSパターンを用いた場合、パターン発生器は127ビットごとにトリガーパルスを生成するよう設定される。ビットストリーム内の特定ビットに着目するため、一つの方法として高精度遅延発生器106内の時間遅延をパターントリガーと関心のあるビットとの間の時間期間に等しくプログラムすることがある。別の仕方では、トリガーパルスを時間軸上でビットに整列配置する。パターン発生器はパターン内のどのビットが1であり、どれが0であるかを先験的に知っており、それ故それは特にビット種或いはサブパターンに着目するようパターントリガーを配置することができる。
Pattern triggers are used to view and measure individual bits in the data stream. The pattern trigger is a trigger pulse generated once each time the pattern is repeated. For example, when using the 2 7 -1 PRBS pattern, the pattern generator is set to generate a trigger pulse every 127 bits. To focus on specific bits in the bitstream, one approach is to program the time delay in the
例えば231−1PRBSほどパターンが長くなると、パターントリガー間の時間はデータレートに応じて極端に長くなることがある。そのような場合、パターン発生器は各パターンごとに複数のトリガーパルスを生成することができ、オシロスコープが各トリガーごとに個別にデータをグループ分けする。例えば、パターンごとに三つのトリガーパルスが存在する場合、この範囲がそれぞれ(複数値アイ・ダイヤグラムに対し)異なる単一値波形に対応するデータの三つの個別データベースを維持する。このことは、例えば立ち上がりエッジの合成が望まれる場合、或いはサンプルをアイ・ダイヤグラム内で併せ載置する前に先ずサンプルを平均化することが望ましい場合に役立つ。 For example, if the pattern is as long as 2 31 -1 PRBS, the time between pattern triggers may be extremely long depending on the data rate. In such a case, the pattern generator can generate multiple trigger pulses for each pattern, and the oscilloscope groups the data individually for each trigger. For example, if there are three trigger pulses per pattern, this range would maintain three separate databases of data each corresponding to a different single-valued waveform (for a multi-valued eye diagram). This is useful, for example, if it is desired to combine rising edges or if it is desirable to average the samples first before placing them together in the eye diagram.
クロックトリガーに対するタイミングだけを用いてアイ・ダイヤグラムの領域を選択して完全に構成する場合、アイ・ダイヤグラムの任意の領域に対してアイの垂直スライス(垂直薄片)だけを完全に構成することができ、通常はより多くの数のサンプルを採取する必要がある。例えば、ジッタ計測用のサンプリングが交点だけをサンプリングする(すなわち、選択的サンプリング法を用いた)場合、アイ・ダイヤグラム全体を完全に構成するのに必要とされるであろうサンプル内の約90%の節約を達成することができる。タイミング制御だけを用いた場合、交点の上方或いは下方の1,0もまたサンプリングされ、より多くの数のサンプルの採取が必要となる。この場合にサンプリング効率における重要な節約(約80%の節約)が依然達成できるが、これは交差を含む垂直スライス内のサンプルだけを採取する必要があるからである。 If a region of the eye diagram is selected and completely constructed using only the timing for the clock trigger, then only a vertical slice (vertical slice) of the eye can be completely constructed for any region of the eye diagram. Usually, a larger number of samples need to be taken. For example, if the jitter measurement sampling only samples the intersections (ie, using a selective sampling method), then about 90% of the sample that would be needed to fully construct the entire eye diagram Savings can be achieved. If only timing control is used, the 1,0 above or below the intersection will also be sampled, requiring more samples to be taken. Significant savings in sampling efficiency (about 80% savings) can still be achieved in this case because only the samples in the vertical slice containing the intersection need be taken.
サンプリング対象のアイの領域とそれらの領域の密度は、サンプルを採取する間に動的に調整することができる。一部の計測数が安定化し、その一方で他のものがより多くのデータが必要とされるのに伴ない依然変化している場合、残るサンプルは未だ安定化していない計測に集中させることができる。さもなくば、各計測用にどれ位の数が必要とされるかという先験的知識を用いて異なる領域を評価することもできる。また、マスク試験を実行する場合、定期点検によりアイの他の領域がマスク侵犯へ向けてドリフトしているかどうかを割り出すこともできる。そうである場合は、将来のサンプルをそれらの領域に集中させることができる。 The eye areas to be sampled and the density of those areas can be dynamically adjusted while taking the sample. If some readings stabilize, while others are still changing as more data is needed, the remaining samples can be concentrated on unstabilized measurements. it can. Otherwise, different regions can be evaluated using a priori knowledge of how many are needed for each measurement. Also, when performing a mask test, periodic inspections can determine whether other areas of the eye are drifting toward mask breach. If so, future samples can be focused on those areas.
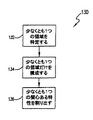
図11は、本発明の一実施形態によりディジタルデータ信号の少なくとも一つの特性を割り出す方法130のステップを例示するフローチャートである。図示の如く、ディジタルデータ信号の少なくとも一つの特性を割り出すための情報を含むアイ・ダイヤグラムの少なくとも一つの領域が、ステップ132に示す如く特定される。ステップ134では十分なステップを採取し、アイ・ダイヤグラム全体を構成することなくアイ・ダイヤグラムの特定された少なくとも一つの領域だけを完全に構成する。ディジタルデータ信号の関心のある少なくとも一つの特性を、次にステップ136において完全に構成された少なくとも一つの領域から割り出す。
FIG. 11 is a flowchart illustrating steps of a
説明した内容は本発明の例示的な実施形態を構成するものであり、本発明がそこから逸脱することなく多くの点で変形できることは認識されたい。例えば、本発明は主としてアイ・ダイヤグラムに関連して説明してきたが、本発明は単一値波形などの他の波形の1以上の領域を完全に構成することでディジタルデータ信号の特性の割り出しに用いることもできる。本発明は多くの仕方で変形できるので、本発明が特許請求の範囲が必要とするものにだけ限定されるべきであることは理解されたい。 It should be appreciated that what has been described constitutes exemplary embodiments of the present invention, and that the present invention may be modified in many respects without departing from it. For example, while the invention has been described primarily with reference to an eye diagram, the invention can be used to determine the characteristics of a digital data signal by completely configuring one or more regions of another waveform, such as a single-valued waveform. It can also be used. It is to be understood that this invention may be varied in many ways, so that this invention should be limited only to the needs of the appended claims.
以上の説明及び添付の図面から、当該技術者には本発明に対するさまざまな修正が明らかになるであろう。従って、本発明は、付属の特許請求の範囲によってのみ制限されるものとする。しかしながら、本発明の広汎な応用の可能性に鑑み、以下に本発明の実施態様を幾つか例示する。 From the above description and accompanying drawings, various modifications to the present invention will be apparent to those skilled in the art. Accordingly, the invention is to be limited only by the appended claims. However, in view of the wide application potential of the present invention, some embodiments of the present invention will be illustrated below.
(実施態様1)
ディジタルデータ信号の少なくとも一つの特性を割り出す方法であって、
前記ディジタルデータ信号の関心のある少なくとも一つの特性を割り出す情報を含む波形(20,30,40,50,60,70,80)の少なくとも一つの領域(25a,25b,35,45,46,55,56,65,66,78)を特定するステップと、
前記ディジタルデータ信号の十分なサンプルを採取し、前記波形(20,30,40,50,60,70,80)全体を完全に構成することなく、前記波形(20,30,40,50,60,70,80)の前記特定した少なくとも一つの領域(25a,25b,35,45,46,55,56,65,66,78)だけを完全に構成するステップと、
前記波形(20,30,40,50,60,70,80)の前記完全に構成した少なくとも一つの領域(25a,25b,35,45,46,55,56,65,66,78)から関心のある少なくとも一つの特性を割り出すステップを有する、
ことを特徴とする方法。
(Embodiment 1)
A method for determining at least one characteristic of a digital data signal, comprising:
At least one region (25a, 25b, 35, 45, 46, 55) of a waveform (20, 30, 40, 50, 60, 70, 80) containing information identifying at least one characteristic of interest of the digital data signal; , 56, 65, 66, 78);
Sufficient samples of the digital data signal are taken and the waveforms (20, 30, 40, 50, 60) are not completely composed of the waveforms (20, 30, 40, 50, 60, 70, 80). , 70, 80) completely comprising only the identified at least one region (25a, 25b, 35, 45, 46, 55, 56, 65, 66, 78);
Interest from the at least one fully constructed region (25a, 25b, 35, 45, 46, 55, 56, 65, 66, 78) of the waveform (20, 30, 40, 50, 60, 70, 80) Determining at least one characteristic of
A method comprising:
(実施態様2)
前記ディジタルデータ信号の関心のある少なくとも一つの特性を選択するステップをさらに有し、前記特定ステップが、前記選択した関心のある少なくとも一つの特性を割り出す少なくとも一つの特徴を含む前記波形(20,30,40,50,60,70,80)の少なくとも一つの領域(25a,25b,35,45,46,55,56,65,66,78)の特定を含み、前記割り出しステップが、前記少なくとも一つの特徴を計測し、前記ディジタルデータ信号の前記選択した関心のある少なくとも一つの特性を割り出すステップを有する、
ことを特徴とする実施態様1に記載の方法。
(Embodiment 2)
Selecting at least one characteristic of interest of the digital data signal, wherein the identifying includes at least one characteristic for determining the selected at least one characteristic of interest. , 40, 50, 60, 70, 80) including identifying at least one region (25a, 25b, 35, 45, 46, 55, 56, 65, 66, 78), wherein the step of determining Measuring one characteristic and determining at least one characteristic of the selected digital data signal of interest.
The method of embodiment 1, wherein
(実施態様3)
前記ディジタルデータ信号の限定数のサンプルを採取し、前記波形(20,30,40,50,60,70,80)の前記少なくとも一つの領域(25a,25b,35,45,46,55,56,65,66,78)を特定する前に前記波形(20,30,40,50,60,70,80)全体を大雑把に構成するステップをさらに有する、
ことを特徴とする実施態様1に記載の方法。
(Embodiment 3)
A limited number of samples of the digital data signal are taken and the at least one region (25a, 25b, 35, 45, 46, 55, 56) of the waveform (20, 30, 40, 50, 60, 70, 80). , 65, 66, 78) further comprising roughly configuring the entire waveform (20, 30, 40, 50, 60, 70, 80).
The method of embodiment 1, wherein
(実施態様4)
十分なサンプルを採取する前記ステップは、前記ディジタルデータ信号に同期したトリガー基準に対するサンプルのタイミングを制御することによるサンプルの採取を含む、
ことを特徴とする実施態様1に記載の方法。
(Embodiment 4)
The step of taking a sufficient sample comprises taking a sample by controlling the timing of the sample relative to a trigger reference synchronized with the digital data signal.
The method of embodiment 1, wherein
(実施態様5)
十分なサンプルを採取する前記ステップは、前記ディジタルデータ信号中の特定ビットのサンプリングを含む、
ことを特徴とする実施態様1に記載の方法。
(Embodiment 5)
The step of taking sufficient samples comprises sampling particular bits in the digital data signal.
The method of embodiment 1, wherein
(実施態様6)
前記波形(20,30,40,50,60,70,80)は、アイ・ダイヤグラム(20,30,40,50,60,70,80)を含む、
ことを特徴とする実施態様1に記載の方法。
(Embodiment 6)
The waveform (20, 30, 40, 50, 60, 70, 80) includes an eye diagram (20, 30, 40, 50, 60, 70, 80).
The method of embodiment 1, wherein
(実施態様7)
前記特定ステップは、前記アイ・ダイヤグラム(70)上に重畳させた少なくとも一つのマスク領域(72,74,76)の近くにある前記アイ・ダイヤグラム(70)の少なくとも一つの領域(78)の特定を含み、前記割り出しステップは、前記少なくとも一つのマスク領域(72,74,76)に関して前記ディジタルデータ信号の関心のある少なくとも一つの特性の割り出しを含む、
ことを特徴とする実施態様6に記載の方法。
(Embodiment 7)
The identifying step includes identifying at least one region (78) of the eye diagram (70) near at least one mask region (72, 74, 76) superimposed on the eye diagram (70). Wherein the determining step includes determining at least one characteristic of interest of the digital data signal with respect to the at least one mask region (72, 74, 76).
7. The method according to embodiment 6, wherein the method comprises:
(実施態様8)
前記割り出しステップは、前記アイ・ダイヤグラムの前記少なくとも一つの領域がマスク領域を侵犯するか否かの判定を含む、
ことを特徴とする実施態様7に記載の方法。
(Embodiment 8)
The determining step includes determining whether the at least one area of the eye diagram violates a mask area,
Embodiment 8. The method of embodiment 7, wherein
(実施態様9)
ディジタルデータ信号の少なくとも一つの特性を割り出す装置であって、
前記ディジタルデータ信号を表わす波形(20,30,40,50,60,70,80)を表示するディスプレイ(98)を有するサンプリング装置(96)と、
前記ディジタルデータ信号のサンプルの採取を制御して前記ディスプレイ(98)上の前記波形(20,30,40,50,60,70,80)の生成を制御するプロセッサ(97)で、トリガー基準に対して採取したサンプルのタイミングを制御する第1のプロセッサ部(97a)と、サンプリングする特定ビットを制御する第2のプロセッサ部(97b)を有し、前記波形(20,30,40,50,60,70,80)全体を完全に構成することなく該波形(20,30,40,50,60,70,80)の選択された1又は複数の領域(25a,25b,35,45,46,55,56,65,66,78)だけを完全に構成させ、前記サンプリング装置(96)の前記ディスプレイ(98)に表示されるようにする前記プロセッサ(97)を備える、
ことを特徴とする装置。
(Embodiment 9)
A device for determining at least one characteristic of a digital data signal,
A sampling device (96) having a display (98) for displaying a waveform (20, 30, 40, 50, 60, 70, 80) representing the digital data signal;
A processor (97) for controlling the sampling of the digital data signal to control the generation of the waveforms (20, 30, 40, 50, 60, 70, 80) on the display (98); A first processor section (97a) for controlling the timing of the sampled sample, and a second processor section (97b) for controlling a specific bit to be sampled, wherein the waveforms (20, 30, 40, 50, 50, 60, 70, 80) without completely configuring the entire waveform (20, 30, 40, 50, 60, 70, 80) in one or more selected regions (25a, 25b, 35, 45, 46). , 55, 56, 65, 66, 78) fully configured and displayed on the display (98) of the sampling device (96). Equipped with a 97),
An apparatus characterized in that:
(実施態様10)前記サンプリング装置(96)は、サンプリングオシロスコープ(96)を具備する、
ことを特徴とする請求項9に記載の装置。
(Embodiment 10) The sampling device (96) includes a sampling oscilloscope (96).
10. The device according to claim 9, wherein:
10,20,30,40,50,60,70,80 アイ・ダイヤグラム(波形)
12 表示スクリーン
25a,25b,35,45,46,55,56,65,66,78 領域
26,27 領域
72,74,76 マスク領域
72a,72b,74a,74b,76a,76b 区域
90 装置
92,95 ディジタルデータ信号
93 信号源
94 DUT
96 サンプリング装置
97 プロセッサ部
97a 第1のプロセッサ部
97b 第2のプロセッサ部
98 表示部(ディスプレイ)
102 トリガー信号
104 トリガー検出ユニット
106 高精度遅延発生器
108 微遅延発生器
110 粗遅延発生器
120,122 サンプリングチャンネル
124,126 A/D変換器
10, 20, 30, 40, 50, 60, 70, 80 Eye diagram (waveform)
12
96 Sampling device 97 Processor unit 97a First processor unit 97b
102 Trigger signal 104
Claims (10)
前記ディジタルデータ信号の関心のある少なくとも一つの特性を割り出す情報を含む波形の少なくとも一つの領域を特定するステップと、
前記ディジタルデータ信号の十分なサンプルを採取し、前記波形全体を完全に構成することなく、前記波形の前記特定した少なくとも一つの領域だけを完全に構成するステップと、
前記波形の前記完全に構成した少なくとも一つの領域から関心のある少なくとも一つの特性を割り出すステップを有する、
ことを特徴とする方法。 A method for determining at least one characteristic of a digital data signal, comprising:
Identifying at least one region of the waveform that includes information that determines at least one characteristic of interest of the digital data signal;
Taking sufficient samples of the digital data signal to completely configure only the identified at least one region of the waveform without completely configuring the entire waveform;
Determining at least one characteristic of interest from the at least one fully configured region of the waveform;
A method comprising:
ことを特徴とする請求項1に記載の方法。 Selecting at least one characteristic of interest of the digital data signal, wherein the identifying includes at least one characteristic of determining the selected at least one characteristic of interest. Including identifying a region, wherein determining comprises measuring the at least one characteristic and determining the selected at least one characteristic of the digital data signal.
The method of claim 1, wherein:
ことを特徴とする請求項1に記載の方法。 Taking a limited number of samples of the digital data signal and roughly configuring the entire waveform before identifying the at least one region of the waveform;
The method of claim 1, wherein:
ことを特徴とする請求項1に記載の方法。 The step of taking a sufficient sample comprises taking a sample by controlling the timing of the sample relative to a trigger reference synchronized with the digital data signal.
The method of claim 1, wherein:
ことを特徴とする請求項1に記載の方法。 The step of taking sufficient samples comprises sampling particular bits in the digital data signal.
The method of claim 1, wherein:
ことを特徴とする請求項1に記載の方法。 The waveform includes an eye diagram,
The method of claim 1, wherein:
ことを特徴とする請求項6に記載の方法。 The identifying step includes identifying at least one region of the eye diagram that is near at least one mask region superimposed on the eye diagram, and wherein the determining step includes determining the at least one mask region with respect to the at least one mask region. Including determining at least one characteristic of interest of the digital data signal;
The method of claim 6, wherein:
ことを特徴とする請求項7に記載の方法。 The determining step includes determining whether the at least one area of the eye diagram violates a mask area,
The method of claim 7, wherein:
前記ディジタルデータ信号を表わす波形を表示するディスプレイを有するサンプリング装置と、
前記ディジタルデータ信号のサンプルの採取を制御して前記ディスプレイ上の前記波形の生成を制御するプロセッサで、トリガー基準に対して採取したサンプルのタイミングを制御する第1のプロセッサ部と、サンプリングする特定ビットを制御する第2のプロセッサ部を有し、前記波形全体を完全に構成することなく該波形の選択された1又は複数の領域だけを完全に構成させ、前記サンプリング装置の前記ディスプレイに表示されるようにする前記プロセッサを備える、
ことを特徴とする装置。 A device for determining at least one characteristic of a digital data signal,
A sampling device having a display for displaying a waveform representing the digital data signal;
A first processor for controlling the sampling of the digital data signal and controlling the generation of the waveform on the display, wherein the first processor controls the timing of the sampled sample with respect to a trigger reference; Having a second processor section for controlling only one or a plurality of selected regions of the waveform without completely configuring the entire waveform, which is displayed on the display of the sampling device. Comprising the processor to
An apparatus characterized in that:
ことを特徴とする請求項9に記載の装置。
The sampling device includes a sampling oscilloscope,
10. The device according to claim 9, wherein:
Applications Claiming Priority (1)
| Application Number | Priority Date | Filing Date | Title |
|---|---|---|---|
| US10/278,339 US6934647B2 (en) | 2002-10-22 | 2002-10-22 | Efficient sampling of digital waveforms for eye diagram analysis |
Publications (2)
| Publication Number | Publication Date |
|---|---|
| JP2004144748A true JP2004144748A (en) | 2004-05-20 |
| JP2004144748A5 JP2004144748A5 (en) | 2006-11-24 |
Family
ID=32093404
Family Applications (1)
| Application Number | Title | Priority Date | Filing Date |
|---|---|---|---|
| JP2003357418A Pending JP2004144748A (en) | 2002-10-22 | 2003-10-17 | Efficient sampling method and apparatus for digital waveform for eye diagram analysis |
Country Status (2)
| Country | Link |
|---|---|
| US (1) | US6934647B2 (en) |
| JP (1) | JP2004144748A (en) |
Cited By (2)
| Publication number | Priority date | Publication date | Assignee | Title |
|---|---|---|---|---|
| JP2006133218A (en) * | 2004-09-24 | 2006-05-25 | Tektronix Inc | Method of pattern identification |
| US7656181B2 (en) | 2005-07-25 | 2010-02-02 | Samsung Electronics Co., Ltd. | Apparatus and method for testing circuit characteristics by using eye mask |
Families Citing this family (8)
| Publication number | Priority date | Publication date | Assignee | Title |
|---|---|---|---|---|
| US7493223B2 (en) * | 2005-08-02 | 2009-02-17 | Tektronix, Inc. | Pattern identification and bit level measurements on repetitive patterns |
| JP4955303B2 (en) * | 2006-03-23 | 2012-06-20 | テクトロニクス・インコーポレイテッド | Digital signal analysis program and waveform display device |
| US20070271052A1 (en) * | 2006-05-16 | 2007-11-22 | Abel Christopher J | Method and apparatus for measuring duty cycle based on data eye monitor |
| US8625986B2 (en) * | 2006-09-27 | 2014-01-07 | Tti Inventions A Llc | Methods and systems for optical performance monitoring |
| US8364033B2 (en) * | 2009-12-08 | 2013-01-29 | Telcordia Technologies, Inc. | Differential eye diagrams |
| US9933984B1 (en) | 2014-09-29 | 2018-04-03 | Advanced Testing Technologies, Inc. | Method and arrangement for eye diagram display of errors of digital waveforms |
| US9893879B2 (en) * | 2015-09-21 | 2018-02-13 | Tektronix, Inc. | Method for automatically finding the optimum sampling point in an eye diagram |
| CN117871920A (en) * | 2024-03-13 | 2024-04-12 | 上海知白智能科技有限公司 | Eye pattern acquisition method, device, system and storage medium |
Citations (6)
| Publication number | Priority date | Publication date | Assignee | Title |
|---|---|---|---|---|
| JPS54100652A (en) * | 1978-01-25 | 1979-08-08 | Mitsubishi Electric Corp | Sampler |
| JPH06289079A (en) * | 1993-04-02 | 1994-10-18 | Nec Corp | Waveform observing apparatus |
| JPH10282153A (en) * | 1997-04-04 | 1998-10-23 | Tektronix Inc | Sampling method and channel compensating method |
| WO2001038888A1 (en) * | 1999-11-19 | 2001-05-31 | Advantest Corporation | Apparatus and method for measuring jitter, and tester for semiconductor integrated circuit equipped with the apparatus for measuring jitter |
| JP2002055123A (en) * | 2000-06-28 | 2002-02-20 | Agilent Technol Inc | Device and method for determining obeying margin of waveform to standard |
| JP2004282555A (en) * | 2003-03-18 | 2004-10-07 | Tektronix Japan Ltd | Clock regeneration method and jitter measurement method |
Family Cites Families (5)
| Publication number | Priority date | Publication date | Assignee | Title |
|---|---|---|---|---|
| US6546345B1 (en) * | 2000-08-30 | 2003-04-08 | Sun Microsystems, Inc. | System and method for measuring extinction ratio and deterministic jitter |
| US6785622B2 (en) * | 2001-10-29 | 2004-08-31 | Agilent Technologies, Inc. | Method and apparatus for performing eye diagram measurements |
| US6748338B2 (en) * | 2001-11-21 | 2004-06-08 | Winbond Electronics Corporation | Method and apparatus for testing eye diagram characteristics |
| US20030165259A1 (en) * | 2002-02-15 | 2003-09-04 | Balent James S. | Signal analysis using image processing techniques |
| US6892150B2 (en) * | 2002-05-24 | 2005-05-10 | Tektronix, Inc. | Combined analog and DSP trigger system for a digital storage oscilloscope |
-
2002
- 2002-10-22 US US10/278,339 patent/US6934647B2/en not_active Expired - Lifetime
-
2003
- 2003-10-17 JP JP2003357418A patent/JP2004144748A/en active Pending
Patent Citations (6)
| Publication number | Priority date | Publication date | Assignee | Title |
|---|---|---|---|---|
| JPS54100652A (en) * | 1978-01-25 | 1979-08-08 | Mitsubishi Electric Corp | Sampler |
| JPH06289079A (en) * | 1993-04-02 | 1994-10-18 | Nec Corp | Waveform observing apparatus |
| JPH10282153A (en) * | 1997-04-04 | 1998-10-23 | Tektronix Inc | Sampling method and channel compensating method |
| WO2001038888A1 (en) * | 1999-11-19 | 2001-05-31 | Advantest Corporation | Apparatus and method for measuring jitter, and tester for semiconductor integrated circuit equipped with the apparatus for measuring jitter |
| JP2002055123A (en) * | 2000-06-28 | 2002-02-20 | Agilent Technol Inc | Device and method for determining obeying margin of waveform to standard |
| JP2004282555A (en) * | 2003-03-18 | 2004-10-07 | Tektronix Japan Ltd | Clock regeneration method and jitter measurement method |
Cited By (2)
| Publication number | Priority date | Publication date | Assignee | Title |
|---|---|---|---|---|
| JP2006133218A (en) * | 2004-09-24 | 2006-05-25 | Tektronix Inc | Method of pattern identification |
| US7656181B2 (en) | 2005-07-25 | 2010-02-02 | Samsung Electronics Co., Ltd. | Apparatus and method for testing circuit characteristics by using eye mask |
Also Published As
| Publication number | Publication date |
|---|---|
| US20040078158A1 (en) | 2004-04-22 |
| US6934647B2 (en) | 2005-08-23 |
Similar Documents
| Publication | Publication Date | Title |
|---|---|---|
| US7310389B2 (en) | Method and apparatus for determining the errors of a multi-valued data signal that are outside the limits of an eye mask | |
| EP1560034B1 (en) | A method and apparatus to measure and display data dependent eye diagrams | |
| KR101085564B1 (en) | Test instrument and test method | |
| US7254168B2 (en) | Method for decomposing timing jitter on arbitrary serial data sequences | |
| US9294237B2 (en) | Method for performing joint jitter and amplitude noise analysis on a real time oscilloscope | |
| JP2004144748A (en) | Efficient sampling method and apparatus for digital waveform for eye diagram analysis | |
| JP4046518B2 (en) | Bit error rate measurement | |
| EP2343557B1 (en) | Dynamic oscilloscope triggering | |
| US7840858B2 (en) | Detection apparatus and test apparatus | |
| DE102005013327A1 (en) | Analog waveform information of binary sampled measurements | |
| US6998893B2 (en) | Circuit and method for inducing jitter to a signal | |
| US20160018443A1 (en) | Method for determining a correlated waveform on a real time oscilloscope | |
| US7634371B2 (en) | System and method for analyzing jitter of signals | |
| EP3220550B1 (en) | Method and apparatus for analyzing a transmission signal | |
| DE102009007482A1 (en) | Jitter injection circuit, pattern generator, tester and electronic device | |
| JP2009085748A (en) | Signal generator | |
| US6856924B2 (en) | Mixer-based timebase for sampling multiple input signal references asynchronous to each other | |
| EP1460793A1 (en) | A method and apparatus for counting the errors of a data signal that are outside the limits of an eye mask | |
| JP5671075B2 (en) | Jitter measuring apparatus and jitter measuring method using jitter measuring trigger generator | |
| US20070291885A1 (en) | Asynchronous sampling system | |
| CN110646655B (en) | RMS value-based triggering method and digital oscilloscope | |
| US11624781B2 (en) | Noise-compensated jitter measurement instrument and methods | |
| KR20030065062A (en) | Apparatus and method for generating writing pulse on optical recording medium using ring oscillator | |
| US20040156430A1 (en) | Component measures | |
| JPH03278376A (en) | Jitter generating method and asymmetry generating method by delay element |
Legal Events
| Date | Code | Title | Description |
|---|---|---|---|
| A521 | Written amendment |
Free format text: JAPANESE INTERMEDIATE CODE: A523 Effective date: 20061011 |
|
| A621 | Written request for application examination |
Free format text: JAPANESE INTERMEDIATE CODE: A621 Effective date: 20061011 |
|
| A131 | Notification of reasons for refusal |
Free format text: JAPANESE INTERMEDIATE CODE: A131 Effective date: 20090610 |
|
| A02 | Decision of refusal |
Free format text: JAPANESE INTERMEDIATE CODE: A02 Effective date: 20091203 |