EP4583048A2 - Bildverarbeitungsvorrichtung zur gasdetektion, bildverarbeitungsverfahren zur gasdetektion und bildverarbeitungsprogramm zur gasdetektion - Google Patents
Bildverarbeitungsvorrichtung zur gasdetektion, bildverarbeitungsverfahren zur gasdetektion und bildverarbeitungsprogramm zur gasdetektion Download PDFInfo
- Publication number
- EP4583048A2 EP4583048A2 EP25168192.0A EP25168192A EP4583048A2 EP 4583048 A2 EP4583048 A2 EP 4583048A2 EP 25168192 A EP25168192 A EP 25168192A EP 4583048 A2 EP4583048 A2 EP 4583048A2
- Authority
- EP
- European Patent Office
- Prior art keywords
- data
- image processing
- frequency component
- time
- image
- Prior art date
- Legal status (The legal status is an assumption and is not a legal conclusion. Google has not performed a legal analysis and makes no representation as to the accuracy of the status listed.)
- Pending
Links
Images


Classifications
-
- G—PHYSICS
- G01—MEASURING; TESTING
- G01N—INVESTIGATING OR ANALYSING MATERIALS BY DETERMINING THEIR CHEMICAL OR PHYSICAL PROPERTIES
- G01N21/00—Investigating or analysing materials by the use of optical means, i.e. using sub-millimetre waves, infrared, visible or ultraviolet light
- G01N21/17—Systems in which incident light is modified in accordance with the properties of the material investigated
- G01N21/25—Colour; Spectral properties, i.e. comparison of effect of material on the light at two or more different wavelengths or wavelength bands
- G01N21/31—Investigating relative effect of material at wavelengths characteristic of specific elements or molecules, e.g. atomic absorption spectrometry
- G01N21/35—Investigating relative effect of material at wavelengths characteristic of specific elements or molecules, e.g. atomic absorption spectrometry using infrared light
- G01N21/3504—Investigating relative effect of material at wavelengths characteristic of specific elements or molecules, e.g. atomic absorption spectrometry using infrared light for analysing gases, e.g. multi-gas analysis
-
- G—PHYSICS
- G01—MEASURING; TESTING
- G01M—TESTING STATIC OR DYNAMIC BALANCE OF MACHINES OR STRUCTURES; TESTING OF STRUCTURES OR APPARATUS, NOT OTHERWISE PROVIDED FOR
- G01M3/00—Investigating fluid-tightness of structures
- G01M3/02—Investigating fluid-tightness of structures by using fluid or vacuum
- G01M3/04—Investigating fluid-tightness of structures by using fluid or vacuum by detecting the presence of fluid at the leakage point
-
- G—PHYSICS
- G06—COMPUTING OR CALCULATING; COUNTING
- G06T—IMAGE DATA PROCESSING OR GENERATION, IN GENERAL
- G06T5/00—Image enhancement or restoration
- G06T5/10—Image enhancement or restoration using non-spatial domain filtering
-
- G—PHYSICS
- G06—COMPUTING OR CALCULATING; COUNTING
- G06T—IMAGE DATA PROCESSING OR GENERATION, IN GENERAL
- G06T5/00—Image enhancement or restoration
- G06T5/50—Image enhancement or restoration using two or more images, e.g. averaging or subtraction
-
- G—PHYSICS
- G06—COMPUTING OR CALCULATING; COUNTING
- G06T—IMAGE DATA PROCESSING OR GENERATION, IN GENERAL
- G06T7/00—Image analysis
- G06T7/0002—Inspection of images, e.g. flaw detection
- G06T7/0004—Industrial image inspection
-
- G—PHYSICS
- G01—MEASURING; TESTING
- G01M—TESTING STATIC OR DYNAMIC BALANCE OF MACHINES OR STRUCTURES; TESTING OF STRUCTURES OR APPARATUS, NOT OTHERWISE PROVIDED FOR
- G01M3/00—Investigating fluid-tightness of structures
- G01M3/38—Investigating fluid-tightness of structures by using light
-
- G—PHYSICS
- G01—MEASURING; TESTING
- G01N—INVESTIGATING OR ANALYSING MATERIALS BY DETERMINING THEIR CHEMICAL OR PHYSICAL PROPERTIES
- G01N21/00—Investigating or analysing materials by the use of optical means, i.e. using sub-millimetre waves, infrared, visible or ultraviolet light
- G01N21/17—Systems in which incident light is modified in accordance with the properties of the material investigated
- G01N21/25—Colour; Spectral properties, i.e. comparison of effect of material on the light at two or more different wavelengths or wavelength bands
- G01N21/31—Investigating relative effect of material at wavelengths characteristic of specific elements or molecules, e.g. atomic absorption spectrometry
- G01N21/35—Investigating relative effect of material at wavelengths characteristic of specific elements or molecules, e.g. atomic absorption spectrometry using infrared light
- G01N21/3504—Investigating relative effect of material at wavelengths characteristic of specific elements or molecules, e.g. atomic absorption spectrometry using infrared light for analysing gases, e.g. multi-gas analysis
- G01N2021/3531—Investigating relative effect of material at wavelengths characteristic of specific elements or molecules, e.g. atomic absorption spectrometry using infrared light for analysing gases, e.g. multi-gas analysis without instrumental source, i.e. radiometric
-
- G—PHYSICS
- G06—COMPUTING OR CALCULATING; COUNTING
- G06T—IMAGE DATA PROCESSING OR GENERATION, IN GENERAL
- G06T2207/00—Indexing scheme for image analysis or image enhancement
- G06T2207/10—Image acquisition modality
- G06T2207/10016—Video; Image sequence
-
- G—PHYSICS
- G06—COMPUTING OR CALCULATING; COUNTING
- G06T—IMAGE DATA PROCESSING OR GENERATION, IN GENERAL
- G06T2207/00—Indexing scheme for image analysis or image enhancement
- G06T2207/10—Image acquisition modality
- G06T2207/10048—Infrared image
-
- G—PHYSICS
- G06—COMPUTING OR CALCULATING; COUNTING
- G06T—IMAGE DATA PROCESSING OR GENERATION, IN GENERAL
- G06T2207/00—Indexing scheme for image analysis or image enhancement
- G06T2207/20—Special algorithmic details
- G06T2207/20048—Transform domain processing
- G06T2207/20056—Discrete and fast Fourier transform, [DFT, FFT]
Definitions
- the present invention relates to a technique for detecting a gas by using infrared images.
- Patent Literature 1 discloses a gas leak detection device including an infrared camera that shoots a region to be inspected and an image processing unit that processes infrared images shot by the infrared camera, and the image processing unit includes a fluctuation extraction unit that extracts dynamic fluctuation caused by a gas leak from a plurality of infrared images arranged on a time-series basis.
- a temperature change caused by the leaking gas is small (e.g., 0.5°C).
- a temperature change caused by the leaking gas is small (e.g., 0.5°C).
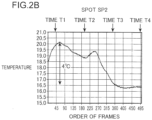
- the temperature of a background to be monitored changes more sharply and greatly than the temperature change caused by the leaking gas (e.g., 4°C).
- the temperature change caused by the gas leak will coincide with the background temperature change.
- the inventors have found out that in such a case, if the background temperature change is larger than the temperature change caused by the leaking gas, unless the background temperature change is taken into consideration, it is not possible to display as infrared images how the gas is leaking, that is, it is difficult to detect the gas.
- Patent Literature 1 Japanese Patent Application Laid-Open No. 2012-58093
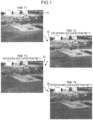
- FIG. 1 is an image diagram illustrating, on a time-series basis, infrared images obtained by shooting an outdoor test site while a gas leak and a background temperature change occur in parallel. These are infrared images obtained by shooting a moving image with an infrared camera.
- At the test site there is a spot SP1 where a gas can be belched out.
- a spot SP2 where a gas is not belched out is illustrated.
- the infrared image I1 is an infrared image of the test site shot at a time T1 immediately before sunlight is blocked by a cloud.
- the infrared image I2 is an infrared image of the test site shot at a time T2 that is five seconds after the time T1. Since sunlight is blocked by a cloud at the time T2, the background temperature is lower than at the time T1.
- the image I4 is an infrared image of the test site shot at a time T4 that is 15 seconds after the time T1. Since sunlight is continuously blocked by a cloud from the time T3 to the time T4, the background temperature is lower at the time T4 than at the time T3.
- the background temperature decreases by about 4°C. For this reason, it is understood that the image I4 is darker than the image I1 as a whole, and that the background temperature has decreased.
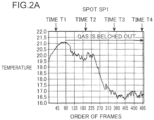
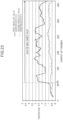
- the graph indicating the temperature change at the spot SP1 is different from the graph indicating the temperature change at the spot SP2. Since a gas is not belched out at the spot SP2, the temperature change at the spot SP2 indicates the background temperature change. In contrast, since a gas is belched out at the spot SP1, the gas is drifting at the spot SP1. Therefore, the temperature change at the spot SP1 indicates the temperature change obtained by adding the background temperature change to the temperature change caused by the leaking gas.
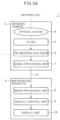
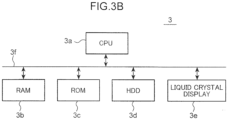
- FIG. 3A is a block diagram illustrating a configuration of a gas detection system 1 according to the present embodiment.
- the gas detection system 1 includes an infrared camera 2 and an image processing device for gas detection 3.
- the moving image indicated by the moving image data D1 has a structure in which a plurality of frames is arranged on a time-series basis. It is assumed that data obtained by arranging pixel data of pixels at identical positions of the plurality of frames on a time-series basis is time-series pixel data.
- the time-series pixel data will be specifically described.
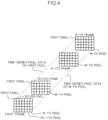
- FIG. 4 is an explanatory diagram explaining the time-series pixel data. It is assumed that the number of frames of the moving image of the infrared images is K. It is assumed that one frame includes M pixels, that is, a first pixel, a second pixel,..., an (M-1)th pixel, and an M-th pixel.
- the pixel data indicates luminance or temperature of the pixel.
- the pixels at the identical position in the plurality of (K) frames mean pixels in the same order.
- data obtained by arranging the following pixel data on a time-series basis is the time-series pixel data of the first pixel: pixel data of the first pixel included in the first frame, pixel data of the first pixel included in the second frame,..., pixel data of the first pixel included in the (K-1)th frame, and pixel data of the first pixel included in the K-th frame.
- data obtained by arranging the following pixel data on a time-series basis is the time-series pixel data of the M-th pixel: pixel data of the M-th pixel included in the first frame, pixel data of the M-th pixel included in the second frame,..., pixel data of the M-th pixel included in the (K-1)th frame, and pixel data of the M-th pixel included in the K-th frame.
- the number of time-series pixel data is the same as the number of pixels constituting one frame, and the plurality of (M) time-series pixel data constitutes the moving image data D1.
- the image processing device for gas detection 3 is a device such as a personal computer, a smartphone, and a tablet terminal, and includes, as functional blocks, an image processing unit 8, a display control unit 9, and a display unit 10.
- the image processing unit 8 and the display control unit 9 are implemented by devices such as a central processing unit (CPU), a random access memory (RAM), a read only memory (ROM), and a hard disk drive (HDD).
- the display unit 10 is implemented by, for example, a liquid crystal display.
- the image processing unit 8 performs a predetermined process on the moving image data D1 (image data).
- the predetermined process includes a process of removing second frequency component data from the moving image data D1. This process will be described.
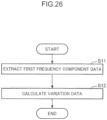
- the moving image data D1 includes first frequency component data indicating the temperature change caused by the leaking gas.
- an image indicated by the first frequency component data indicates how the gas is leaking (in other words, a region where the leaking gas is drifting).
- the inventors have found out the following phenomenon. While the infrared camera 2 is shooting the moving image of the object to be monitored for a gas leak and the background, when the gas leak and the background temperature change occur in parallel and the background temperature change is larger than the temperature change caused by the leaking gas, it is unknown from the moving image of the infrared images how the gas is leaking. This is because, in addition to the first frequency component data, the moving image data D1 includes the second frequency component data that is lower in frequency than the first frequency component data and indicates the background temperature change. The image indicated by the first frequency component data becomes invisible due to an image indicated by the second frequency component data (this image is a change in contrast between light and shade of the background). With reference to FIG. 2A , a small change included in the graph indicating the temperature change at the spot SP1 corresponds to the first frequency component data. The graph indicating the temperature change at the spot SP2 corresponds to the second frequency component data.
- Programs for implementing functional blocks of the image processing unit 8 and the display control unit 9 illustrated in FIG. 3A have been stored in the HDD 3d (this may be a ROM 3c instead of the HDD 3d).
- the program that implements the image processing unit 8 is a processing program that acquires the moving image data D1 (image data) and performs the predetermined process on the moving image data D1.
- the program that implements the display control unit 9 is a display control program that causes the display unit 10 to display images (e.g., a moving image indicated by the moving image data D1 that has undergone the predetermined process). These programs may be stored in the ROM 3c instead of in the HDD 3d.
- the first extraction unit and the first extraction program will be described as an example.
- the first extraction unit defines, as the second frequency component data, data extracted from the time-series pixel data by calculating a simple moving average of the time-series pixel data in units of the first predetermined number of frames smaller than the K frames illustrated in FIG. 4 .
- the first extraction unit extracts the M second frequency component data corresponding to each of the M time-series pixel data illustrated in FIG. 4 .
- the first extraction program is a program that defines, as the second frequency component data, data extracted from the time-series pixel data by calculating a simple moving average of the time-series pixel data in units of the first predetermined number of frames smaller than the K frames illustrated in FIG. 4 .
- the first extraction program extracts the M second frequency component data corresponding to each of the M time-series pixel data illustrated in FIG. 4 .
- FIG. 5 A flowchart of these programs to be executed by the CPU 3a (the first extraction program, the first calculation program, and the second calculation program) is FIG. 5 to be described later.
- FIG. 5 is a flowchart of the process to be executed by the first mode of the image processing unit 8.
- the first mode of the image processing unit 8 functions as the first extraction unit.
- the first extraction unit defines, as the second frequency component data, data extracted from the time-series pixel data by calculating a simple moving average of the time-series pixel data in units of the first predetermined number of frames smaller than the K frames illustrated in FIG. 4 .
- the first extraction unit extracts the M second frequency component data corresponding to each of the M time-series pixel data illustrated in FIG. 4 (step S1).
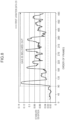
- FIG. 6 is a graph illustrating the time-series pixel data D2 of the pixels corresponding to the spot SP1 in FIG. 2A and the second frequency component data D3 extracted from this time-series pixel data D2.
- the temperature indicated by the time-series pixel data D2 changes relatively rapidly (change period is relatively short), whereas the temperature indicated by the second frequency component data D3 changes relatively slowly (change period is relatively long).
- a vertical axis and a horizontal axis of the graph are the same as the vertical axis and the horizontal axis of the graph of FIG. 2A , respectively. That is, the vertical axis of the graph represents the temperature.
- the horizontal axis of the graph represents the order of frames.
- the first predetermined number of frames is, for example, 21 frames.
- the breakdown is a target frame, ten consecutive frames before the target frame, and ten consecutive frames after the target frame.
- the first predetermined number is required at least to be the number that allows extraction of the second frequency component data from the time-series pixel data, and the first predetermined number is not limited to 21, but may be more than 21 or less than 21.
- the first mode of the image processing unit 8 functions as the first calculation unit.
- the first calculation unit defines, as first difference data, data obtained by calculating a difference between the time-series pixel data and the second frequency component data extracted from this time-series pixel data, and calculates the M first difference data corresponding to each of the M time-series pixel data (step S2).
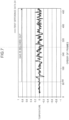
- FIG. 7 is a graph illustrating the first difference data D4.
- a vertical axis and a horizontal axis of the graph are the same as the vertical axis and the horizontal axis of the graph of FIG. 2A , respectively.
- the first difference data D4 is data obtained by calculating the difference between the time-series pixel data D2 and the second frequency component data D3 illustrated in FIG. 6 .
- repetition of minute amplitude indicated by the first difference data D4 mainly indicates sensor noise of the two-dimensional image sensor 6.
- variations in the amplitude and the waveform of the first difference data D4 have become larger.
- the image processing unit 8 functions as the second calculation unit.
- the second calculation unit defines, as first fluctuation data, data indicating a fluctuation in the first difference data calculated by performing a predetermined operation on the first difference data in units of the second predetermined number of frames.
- the second calculation unit calculates the plurality of (M) first fluctuation data corresponding to each of the plurality of (M) time-series pixel data illustrated in FIG. 4 .
- the first mode of the image processing unit 8 uses the first variation data as the first fluctuation data.
- the first variation data is data indicating the variation in the waveform of the first difference data.
- the second calculation unit defines, as the first variation data, data obtained by calculating a moving standard deviation of the first difference data in units of the second predetermined number of frames smaller than the K frames.
- the second calculation unit calculates the M first variation data corresponding to each of the M time-series pixel data (step S3). Note that instead of the moving standard deviation, moving dispersion may be calculated.
- FIG. 8 is a graph illustrating the first variation data D5.
- a horizontal axis of the graph is the same as the horizontal axis of the graph of FIG. 2A .
- a vertical axis of the graph represents a standard deviation.
- the first variation data D5 is data indicating the moving standard deviation of the first difference data D4 illustrated in FIG. 7 .
- the second predetermined number of frames is, for example, 21 frames. Since the second predetermined number is required at least to be the number that allows calculation of a statistically significant standard deviation, the second predetermined number may be the same as or different from the first predetermined number.
- the first mode of the image processing unit 8 can detect the gas leak.
- the display control unit 9 illustrated in FIG. 3A may cause the display unit 10 to display that the gas leak is detected, and the image processing device for gas detection 3 may operate an unillustrated alarm (speaker) to notify that the gas leak is detected.
- This display and notification of the gas leak detection are also applicable to the second to seventh modes of the image processing unit 8 to be described later.
- the display control unit 9 defines the M first variation data obtained in step S3 as the moving image data D1 that has undergone the process of removing the second frequency component data, and causes the display unit 10 to display the moving image indicated by the moving image data D1.
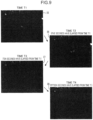
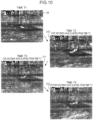
- images of frames at the time T1, the time T2, the time T3, and the time T4 are illustrated in FIGS. 9 and 10 .
- FIGS. 9 and 10 are image diagrams illustrating, on a time-series basis, one example of the images processed by the first mode of the image processing unit 8. In generation of these images, a coefficient that determines a magnification of the moving standard deviation is different, whereby these images differ in contrast.
- FIG. 9 illustrates an image I5, an image I6, an image I7, and an image I8 obtained in step S3 with the standard deviation of 1000
- FIG. 10 illustrates an image I9, an image I10, an image I11, and an image I12 obtained in step S3 with the standard deviation of 5000
- the images I5 and I9 are images obtained by processing the infrared image I1 illustrated in FIG. 1 by the first mode of the image processing unit 8.
- the images I6 and I10 are images obtained by processing the infrared image I2 illustrated in FIG. 1 by the first mode of the image processing unit 8.
- the images I7 and I11 are images obtained by processing the infrared image I3 illustrated in FIG. 1 by the first mode of the image processing unit 8.
- the images I8 and I12 are images obtained by processing the infrared image I4 illustrated in FIG. 1 by the first mode of the image processing unit 8. In both FIGS. 9 and 10 , it is understood that the gas is belched out at the spot SP1.
- the image processing unit 8 performs the process of removing the second frequency component data included in the moving image data D1, and then the display control unit 9 causes the display unit 10 to display the moving image indicated by the moving image data D1 that has undergone this process. Therefore, even when the gas leak and the background temperature change occur in parallel and the background temperature change is larger than the temperature change caused by the leaking gas, the first mode of the image processing unit 8 can display as the moving image how the gas is leaking.
- the second mode of the image processing unit 8 will be described.
- the second mode of the image processing unit 8 perform the process of removing, in addition to the second frequency component data indicating the background temperature change, third frequency component data indicating high-frequency noise from the moving image data D1.
- the high-frequency noise is mainly sensor noise of the two-dimensional image sensor 6.
- the third frequency component data is higher in frequency than the first frequency component data indicating the temperature change caused by the leaking gas.
- the second mode of the image processing unit 8 transmits the first frequency component data indicating the temperature change caused by the leaking gas, and cuts the second frequency component data that is lower in frequency than the first frequency component data, and the third frequency component data that is higher in frequency than the first frequency component data. Therefore, the second mode of the image processing unit 8 functions as a band pass filter.
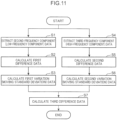
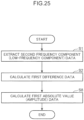
- FIG. 11 is a flowchart of the process to be executed by the second mode of the image processing unit 8.
- the second mode of the image processing unit 8 functions as the first extraction unit that executes step S1, that is, extracts the second frequency component data. This function has been described in the first mode of the image processing unit 8.
- the second mode of the image processing unit 8 functions as a second extraction unit.
- the second extraction unit defines, as the third frequency component data, data extracted from the time-series pixel data by calculating a simple moving average of the time-series pixel data in units of the third predetermined number (e.g., 3) of frames that is smaller than the first predetermined number (e.g., 21).
- the second extraction unit extracts the M third frequency component data corresponding to each of the M time-series pixel data illustrated in FIG. 4 (step S4).
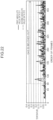
- FIG. 12 is a graph illustrating the time-series pixel data D2 of the pixels corresponding to the spot SP1, the second frequency component data D3 extracted from the time-series pixel data D2, and the third frequency component data D6 extracted from the time-series pixel data D2.
- a vertical axis and a horizontal axis of the graph are the same as the vertical axis and the horizontal axis of the graph of FIG. 2A , respectively.
- FIG. 12 is a graph obtained by adding the third frequency component data D6 to the graph illustrated in FIG. 6 .
- the temperature indicated by the time-series pixel data D2 changes relatively rapidly (change period is relatively short), whereas the temperature indicated by the second frequency component data D3 changes relatively slowly (change period is relatively long).
- the third frequency component data D6 substantially overlaps the time-series pixel data D2.
- the third predetermined number of frames is, for example, three frames.
- the breakdown is a target frame, one frame immediately before the target frame, and one frame immediately after the target frame.
- the third predetermined number is required at least to be the number that allows extraction of the third frequency component from the time-series pixel data, and the third predetermined number is not limited to three, but may be more than three.
- the second mode of the image processing unit 8 functions as the first calculation unit that executes step S2, that is, calculates the first difference data. This function has been described in the first mode of the image processing unit 8.
- the second mode of the image processing unit 8 functions as a third calculation unit.
- the third calculation unit defines, as second difference data, data obtained by calculating a difference between the time-series pixel data and the third frequency component data extracted from the time-series pixel data.
- the third calculation unit calculates the M second difference data corresponding to each of the M time-series pixel data (step S5).
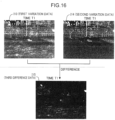
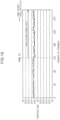
- FIG. 13A is a graph illustrating the first difference data D4, whereas FIG. 13B is a graph illustrating the second difference data D7.
- the first difference data D4 is the same as the first difference data D4 illustrated in FIG. 7 , and is data obtained by calculating a difference between the time-series pixel data D2 and the second frequency component data D3 illustrated in FIG. 12 .
- the second difference data D7 is data obtained by calculating a difference between the time-series pixel data D2 and the third frequency component data D6 illustrated in FIG. 12 .
Landscapes
- Physics & Mathematics (AREA)
- Engineering & Computer Science (AREA)
- General Physics & Mathematics (AREA)
- Theoretical Computer Science (AREA)
- Spectroscopy & Molecular Physics (AREA)
- Quality & Reliability (AREA)
- Computer Vision & Pattern Recognition (AREA)
- Life Sciences & Earth Sciences (AREA)
- Health & Medical Sciences (AREA)
- Chemical & Material Sciences (AREA)
- Analytical Chemistry (AREA)
- Biochemistry (AREA)
- General Health & Medical Sciences (AREA)
- Immunology (AREA)
- Pathology (AREA)
- Image Analysis (AREA)
- Examining Or Testing Airtightness (AREA)
- Radiation Pyrometers (AREA)
- Investigating Or Analysing Materials By Optical Means (AREA)
Applications Claiming Priority (4)
| Application Number | Priority Date | Filing Date | Title |
|---|---|---|---|
| JP2015212518 | 2015-10-29 | ||
| EP21201144.9A EP3957969A1 (de) | 2015-10-29 | 2016-10-19 | Bildverarbeitungsvorrichtung zur gasdetektion, bildverarbeitungsverfahren zur gasdetektion und bildverarbeitungsprogramm zur gasdetektion |
| EP16859660.9A EP3351916B1 (de) | 2015-10-29 | 2016-10-19 | Bildverarbeitungsvorrichtung zur gasdetektion, bildverarbeitungsverfahren zur gasdetektion und bildverarbeitungsprogramm zur gasdetektion |
| PCT/JP2016/080968 WO2017073430A1 (ja) | 2015-10-29 | 2016-10-19 | ガス検知用画像処理装置、ガス検知用画像処理方法及びガス検知用画像処理プログラム |
Related Parent Applications (2)
| Application Number | Title | Priority Date | Filing Date |
|---|---|---|---|
| EP21201144.9A Division EP3957969A1 (de) | 2015-10-29 | 2016-10-19 | Bildverarbeitungsvorrichtung zur gasdetektion, bildverarbeitungsverfahren zur gasdetektion und bildverarbeitungsprogramm zur gasdetektion |
| EP16859660.9A Division EP3351916B1 (de) | 2015-10-29 | 2016-10-19 | Bildverarbeitungsvorrichtung zur gasdetektion, bildverarbeitungsverfahren zur gasdetektion und bildverarbeitungsprogramm zur gasdetektion |
Publications (2)
| Publication Number | Publication Date |
|---|---|
| EP4583048A2 true EP4583048A2 (de) | 2025-07-09 |
| EP4583048A3 EP4583048A3 (de) | 2025-09-17 |
Family
ID=58631464
Family Applications (3)
| Application Number | Title | Priority Date | Filing Date |
|---|---|---|---|
| EP25168192.0A Pending EP4583048A3 (de) | 2015-10-29 | 2016-10-19 | Bildverarbeitungsvorrichtung zur gasdetektion, bildverarbeitungsverfahren zur gasdetektion und bildverarbeitungsprogramm zur gasdetektion |
| EP21201144.9A Ceased EP3957969A1 (de) | 2015-10-29 | 2016-10-19 | Bildverarbeitungsvorrichtung zur gasdetektion, bildverarbeitungsverfahren zur gasdetektion und bildverarbeitungsprogramm zur gasdetektion |
| EP16859660.9A Active EP3351916B1 (de) | 2015-10-29 | 2016-10-19 | Bildverarbeitungsvorrichtung zur gasdetektion, bildverarbeitungsverfahren zur gasdetektion und bildverarbeitungsprogramm zur gasdetektion |
Family Applications After (2)
| Application Number | Title | Priority Date | Filing Date |
|---|---|---|---|
| EP21201144.9A Ceased EP3957969A1 (de) | 2015-10-29 | 2016-10-19 | Bildverarbeitungsvorrichtung zur gasdetektion, bildverarbeitungsverfahren zur gasdetektion und bildverarbeitungsprogramm zur gasdetektion |
| EP16859660.9A Active EP3351916B1 (de) | 2015-10-29 | 2016-10-19 | Bildverarbeitungsvorrichtung zur gasdetektion, bildverarbeitungsverfahren zur gasdetektion und bildverarbeitungsprogramm zur gasdetektion |
Country Status (4)
| Country | Link |
|---|---|
| US (2) | US10145788B2 (de) |
| EP (3) | EP4583048A3 (de) |
| JP (1) | JP6245418B2 (de) |
| WO (1) | WO2017073430A1 (de) |
Families Citing this family (20)
| Publication number | Priority date | Publication date | Assignee | Title |
|---|---|---|---|---|
| JP6508439B2 (ja) * | 2016-12-27 | 2019-05-08 | コニカミノルタ株式会社 | ガス検知用画像処理装置、ガス検知用画像処理方法及びガス検知用画像処理プログラム |
| WO2018207528A1 (ja) * | 2017-05-10 | 2018-11-15 | コニカミノルタ株式会社 | 構造物異常診断装置 |
| WO2018211778A1 (ja) * | 2017-05-18 | 2018-11-22 | コニカミノルタ株式会社 | ガス漏れ位置推定装置、ガス漏れ位置推定方法及びガス漏れ位置推定プログラム |
| EP3735577B1 (de) * | 2018-01-03 | 2023-01-25 | Flir Systems AB | Dynamische bestimmung von radiometrischen werten unter verwendung von mehrband-sensorarray-systemen und -verfahren |
| US10684216B2 (en) * | 2018-03-30 | 2020-06-16 | Konica Minolta Laboratory U.S.A., Inc. | Multi-spectral gas quantification and differentiation method for optical gas imaging camera |
| JP7031570B2 (ja) * | 2018-11-30 | 2022-03-08 | コニカミノルタ株式会社 | 振動検出方法 |
| WO2020188905A1 (ja) | 2019-03-19 | 2020-09-24 | コニカミノルタ株式会社 | ガス検知装置、該方法および該プログラム |
| WO2020250461A1 (ja) | 2019-06-11 | 2020-12-17 | コニカミノルタ株式会社 | ガス監視装置、該方法および該プログラム |
| TWI905105B (zh) * | 2019-07-26 | 2025-11-21 | 日商半導體能源研究所股份有限公司 | 攝像裝置及其工作方法及電子裝置 |
| WO2021095112A1 (ja) * | 2019-11-12 | 2021-05-20 | コニカミノルタ株式会社 | ガス検知装置、画像処理制御方法および画像処理制御プログラム |
| JPWO2021181675A1 (de) | 2020-03-13 | 2021-09-16 | ||
| JP7272507B2 (ja) | 2020-04-10 | 2023-05-12 | コニカミノルタ株式会社 | ガス検知装置、ガス検知方法、および、ガス検知プログラム |
| WO2022004461A1 (ja) * | 2020-07-03 | 2022-01-06 | コニカミノルタ株式会社 | ガス領域判定装置、ガス領域判定方法、学習モデル生成装置、学習モデル生成方法、および、プログラム |
| DE102021100405A1 (de) | 2021-01-12 | 2022-07-14 | Inficon Gmbh | Verfahren zur Detektion von aus einem Prüfling austretendem Prüfgas mit einem optischen Sensor |
| CN113406035A (zh) * | 2021-05-31 | 2021-09-17 | 浙江焜腾红外科技有限公司 | 一种voc气体排放用的成像传感器结构 |
| US12469250B2 (en) * | 2021-10-06 | 2025-11-11 | Colorado State University Research Foundation | Plume identification algorithm for optical natural gas emissions imaging |
| WO2023105856A1 (ja) | 2021-12-10 | 2023-06-15 | コニカミノルタ株式会社 | ガス濃度測定装置、ガス濃度測定方法、およびプログラム |
| EP4626009A4 (de) * | 2022-11-22 | 2026-03-04 | Konica Minolta Inc | Bilderfassungsvorrichtung, bilderfassungsverfahren und computerprogramm |
| WO2024195560A1 (ja) | 2023-03-20 | 2024-09-26 | コニカミノルタ株式会社 | 画像処理装置、ガス流量推定システム、プログラム及びガス流量推定方法 |
| JP2026002161A (ja) | 2024-06-20 | 2026-01-08 | コニカミノルタ株式会社 | ガス流量推定装置、ガス流量推定方法及びガス流量推定プログラム、漏洩ガス検出装置及び漏洩ガス検出方法並びに検出データ処理装置 |
Citations (2)
| Publication number | Priority date | Publication date | Assignee | Title |
|---|---|---|---|---|
| JP2012058093A (ja) | 2010-09-09 | 2012-03-22 | Mitsubishi Electric Building Techno Service Co Ltd | ガス漏れ検出装置 |
| JP2015212518A (ja) | 2015-07-29 | 2015-11-26 | 株式会社ニュー・メソッド | コンクリートブロック |
Family Cites Families (12)
| Publication number | Priority date | Publication date | Assignee | Title |
|---|---|---|---|---|
| US7358860B2 (en) * | 2005-03-31 | 2008-04-15 | American Air Liquide, Inc. | Method and apparatus to monitor and detect cryogenic liquefied gas leaks |
| US7851758B1 (en) * | 2005-09-29 | 2010-12-14 | Flir Systems, Inc. | Portable multi-function inspection systems and methods |
| US7649174B2 (en) * | 2008-02-11 | 2010-01-19 | Flir Systems, Inc. | Thermography camera configured for gas leak detection |
| US8539818B2 (en) * | 2010-02-01 | 2013-09-24 | The Boeing Company | Methods and systems for evaporative cooling infrared thermographic leak detection |
| US20130050466A1 (en) * | 2010-02-26 | 2013-02-28 | Ahmet Enis Cetin | Method, device and system for determining the presence of volatile organic and hazardous vapors using an infrared light source and infrared video imaging |
| CN103460686B (zh) * | 2011-03-25 | 2017-02-22 | 埃克森美孚上游研究公司 | 化学羽状流的自主检测 |
| EP2590138B1 (de) * | 2011-11-07 | 2019-09-11 | Flir Systems AB | Gasvisualisierungsanordnungen, Vorrichtungen und Verfahren |
| JP2013122389A (ja) | 2011-12-09 | 2013-06-20 | Mitsubishi Electric Corp | 気体検出装置 |
| US20140210984A1 (en) * | 2013-01-28 | 2014-07-31 | General Electric Company | System, Apparatus, And Method For Gas Turbine Leak Detection |
| CA2985486C (en) * | 2014-05-09 | 2021-04-13 | Kairos Aerospace Inc. | Systems and methods for detecting gas leaks |
| US9482592B2 (en) * | 2014-09-24 | 2016-11-01 | General Monitors, Inc. | Directional ultrasonic gas leak detector |
| US9995647B2 (en) * | 2015-09-30 | 2018-06-12 | General Monitors, Inc. | Ultrasonic gas leak location system and method |
-
2016
- 2016-10-19 EP EP25168192.0A patent/EP4583048A3/de active Pending
- 2016-10-19 US US15/770,273 patent/US10145788B2/en active Active
- 2016-10-19 EP EP21201144.9A patent/EP3957969A1/de not_active Ceased
- 2016-10-19 EP EP16859660.9A patent/EP3351916B1/de active Active
- 2016-10-19 JP JP2017543848A patent/JP6245418B2/ja active Active
- 2016-10-19 WO PCT/JP2016/080968 patent/WO2017073430A1/ja not_active Ceased
-
2018
- 2018-10-17 US US16/162,963 patent/US10520429B2/en active Active
Patent Citations (2)
| Publication number | Priority date | Publication date | Assignee | Title |
|---|---|---|---|---|
| JP2012058093A (ja) | 2010-09-09 | 2012-03-22 | Mitsubishi Electric Building Techno Service Co Ltd | ガス漏れ検出装置 |
| JP2015212518A (ja) | 2015-07-29 | 2015-11-26 | 株式会社ニュー・メソッド | コンクリートブロック |
Also Published As
| Publication number | Publication date |
|---|---|
| EP3351916A1 (de) | 2018-07-25 |
| EP4583048A3 (de) | 2025-09-17 |
| US20180313748A1 (en) | 2018-11-01 |
| WO2017073430A1 (ja) | 2017-05-04 |
| US10520429B2 (en) | 2019-12-31 |
| EP3351916B1 (de) | 2021-11-17 |
| US10145788B2 (en) | 2018-12-04 |
| JP6245418B2 (ja) | 2017-12-13 |
| JPWO2017073430A1 (ja) | 2017-12-14 |
| US20190049371A1 (en) | 2019-02-14 |
| EP3957969A1 (de) | 2022-02-23 |
| EP3351916A4 (de) | 2019-03-06 |
Similar Documents
| Publication | Publication Date | Title |
|---|---|---|
| EP4583048A2 (de) | Bildverarbeitungsvorrichtung zur gasdetektion, bildverarbeitungsverfahren zur gasdetektion und bildverarbeitungsprogramm zur gasdetektion | |
| EP3372996B1 (de) | Vorrichtung zur messung eines gaskonzentrationsdickeprodukts, verfahren zur messung eines gaskonzentrationsdickeprodukts, programm zur messung eines gaskonzentrationsdickeprodukts und computerlesbares aufzeichnungsmedium mit darauf aufgezeichnetem programm zur messung eines gaskonzentrationsdickeprodukts | |
| JP6620878B2 (ja) | ガス漏れ位置推定装置、ガス漏れ位置推定方法及びガス漏れ位置推定プログラム | |
| WO2017104617A1 (ja) | ガス検知用画像処理装置、ガス検知用画像処理方法、ガス検知用画像処理プログラム、ガス検知用画像処理プログラムを記録したコンピュータ読み取り可能な記録媒体、及び、ガス検知システム | |
| JP6493624B2 (ja) | ガス検知用画像処理装置、ガス検知用画像処理方法及びガス検知用画像処理プログラム | |
| JP7047638B2 (ja) | ガス可視化用画像処理装置、ガス可視化用画像処理方法、ガス可視化用画像処理プログラム、及び、ガス検知システム | |
| JPWO2019058863A1 (ja) | ガス検知用画像処理装置、ガス検知用画像処理方法、及び、ガス検知用画像処理プログラム | |
| JP6579291B2 (ja) | ガス検知用画像処理装置、ガス検知用画像処理方法、及び、ガス検知用画像処理プログラム | |
| US20190325587A1 (en) | Gas detection-use image processing device, gas detection-use image processing method, and gas detection-use image processing program | |
| US11302010B2 (en) | Gas-detection image processing device, gas-detection image processing method, and gas-detection image processing program | |
| US11954839B2 (en) | Leak source specification assistance device, leak source specification assistance method, and leak source specification assistance program | |
| US20140019864A1 (en) | Image processing apparatus, recording medium storing image processing program, and method of image processing | |
| WO2018211778A1 (ja) | ガス漏れ位置推定装置、ガス漏れ位置推定方法及びガス漏れ位置推定プログラム | |
| US10497131B2 (en) | Monitoring apparatus, monitoring system, monitoring method, and computer-readable storage medium | |
| US10991090B2 (en) | Gas detection-use image processing device, gas detection-use image processing method, and gas detection-use image processing program | |
| US9395706B2 (en) | Noise determination device |
Legal Events
| Date | Code | Title | Description |
|---|---|---|---|
| PUAI | Public reference made under article 153(3) epc to a published international application that has entered the european phase |
Free format text: ORIGINAL CODE: 0009012 |
|
| STAA | Information on the status of an ep patent application or granted ep patent |
Free format text: STATUS: THE APPLICATION HAS BEEN PUBLISHED |
|
| AC | Divisional application: reference to earlier application |
Ref document number: 3351916 Country of ref document: EP Kind code of ref document: P Ref document number: 3957969 Country of ref document: EP Kind code of ref document: P |
|
| AK | Designated contracting states |
Kind code of ref document: A2 Designated state(s): AL AT BE BG CH CY CZ DE DK EE ES FI FR GB GR HR HU IE IS IT LI LT LU LV MC MK MT NL NO PL PT RO RS SE SI SK SM TR |
|
| REG | Reference to a national code |
Ref country code: DE Ref legal event code: R079 Free format text: PREVIOUS MAIN CLASS: G06T0007000000 Ipc: G01M0003380000 |
|
| PUAL | Search report despatched |
Free format text: ORIGINAL CODE: 0009013 |
|
| P01 | Opt-out of the competence of the unified patent court (upc) registered |
Free format text: CASE NUMBER: UPC_APP_2569_4583048/2025 Effective date: 20250806 |
|
| AK | Designated contracting states |
Kind code of ref document: A3 Designated state(s): AL AT BE BG CH CY CZ DE DK EE ES FI FR GB GR HR HU IE IS IT LI LT LU LV MC MK MT NL NO PL PT RO RS SE SI SK SM TR |
|
| RIC1 | Information provided on ipc code assigned before grant |
Ipc: G01M 3/38 20060101AFI20250813BHEP Ipc: G01M 3/02 20060101ALI20250813BHEP Ipc: G01M 3/04 20060101ALI20250813BHEP Ipc: G01N 21/3504 20140101ALI20250813BHEP |
|
| STAA | Information on the status of an ep patent application or granted ep patent |
Free format text: STATUS: REQUEST FOR EXAMINATION WAS MADE |