EP4535005A1 - Vorrichtung zur messung biologischer proben - Google Patents
Vorrichtung zur messung biologischer proben Download PDFInfo
- Publication number
- EP4535005A1 EP4535005A1 EP23811366.6A EP23811366A EP4535005A1 EP 4535005 A1 EP4535005 A1 EP 4535005A1 EP 23811366 A EP23811366 A EP 23811366A EP 4535005 A1 EP4535005 A1 EP 4535005A1
- Authority
- EP
- European Patent Office
- Prior art keywords
- biological sample
- light
- surface boundary
- processing unit
- image processing
- Prior art date
- Legal status (The legal status is an assumption and is not a legal conclusion. Google has not performed a legal analysis and makes no representation as to the accuracy of the status listed.)
- Pending
Links
Images





Classifications
-
- G—PHYSICS
- G01—MEASURING; TESTING
- G01F—MEASURING VOLUME, VOLUME FLOW, MASS FLOW OR LIQUID LEVEL; METERING BY VOLUME
- G01F23/00—Indicating or measuring liquid level or level of fluent solid material, e.g. indicating in terms of volume or indicating by means of an alarm
- G01F23/22—Indicating or measuring liquid level or level of fluent solid material, e.g. indicating in terms of volume or indicating by means of an alarm by measuring physical variables, other than linear dimensions, pressure or weight, dependent on the level to be measured, e.g. by difference of heat transfer of steam or water
- G01F23/28—Indicating or measuring liquid level or level of fluent solid material, e.g. indicating in terms of volume or indicating by means of an alarm by measuring physical variables, other than linear dimensions, pressure or weight, dependent on the level to be measured, e.g. by difference of heat transfer of steam or water by measuring the variations of parameters of electromagnetic or acoustic waves applied directly to the liquid or fluent solid material
- G01F23/284—Electromagnetic waves
- G01F23/292—Light, e.g. infrared or ultraviolet
-
- G—PHYSICS
- G01—MEASURING; TESTING
- G01B—MEASURING LENGTH, THICKNESS OR SIMILAR LINEAR DIMENSIONS; MEASURING ANGLES; MEASURING AREAS; MEASURING IRREGULARITIES OF SURFACES OR CONTOURS
- G01B11/00—Measuring arrangements characterised by the use of optical techniques
- G01B11/24—Measuring arrangements characterised by the use of optical techniques for measuring contours or curvatures
-
- G—PHYSICS
- G01—MEASURING; TESTING
- G01F—MEASURING VOLUME, VOLUME FLOW, MASS FLOW OR LIQUID LEVEL; METERING BY VOLUME
- G01F23/00—Indicating or measuring liquid level or level of fluent solid material, e.g. indicating in terms of volume or indicating by means of an alarm
- G01F23/22—Indicating or measuring liquid level or level of fluent solid material, e.g. indicating in terms of volume or indicating by means of an alarm by measuring physical variables, other than linear dimensions, pressure or weight, dependent on the level to be measured, e.g. by difference of heat transfer of steam or water
- G01F23/28—Indicating or measuring liquid level or level of fluent solid material, e.g. indicating in terms of volume or indicating by means of an alarm by measuring physical variables, other than linear dimensions, pressure or weight, dependent on the level to be measured, e.g. by difference of heat transfer of steam or water by measuring the variations of parameters of electromagnetic or acoustic waves applied directly to the liquid or fluent solid material
- G01F23/284—Electromagnetic waves
- G01F23/292—Light, e.g. infrared or ultraviolet
- G01F23/2921—Light, e.g. infrared or ultraviolet for discrete levels
-
- G—PHYSICS
- G01—MEASURING; TESTING
- G01N—INVESTIGATING OR ANALYSING MATERIALS BY DETERMINING THEIR CHEMICAL OR PHYSICAL PROPERTIES
- G01N33/00—Investigating or analysing materials by specific methods not covered by groups G01N1/00 - G01N31/00
- G01N33/48—Biological material, e.g. blood, urine; Haemocytometers
- G01N33/483—Physical analysis of biological material
-
- G—PHYSICS
- G01—MEASURING; TESTING
- G01N—INVESTIGATING OR ANALYSING MATERIALS BY DETERMINING THEIR CHEMICAL OR PHYSICAL PROPERTIES
- G01N35/00—Automatic analysis not limited to methods or materials provided for in any single one of groups G01N1/00 - G01N33/00; Handling materials therefor
- G01N35/00584—Control arrangements for automatic analysers
-
- G—PHYSICS
- G06—COMPUTING OR CALCULATING; COUNTING
- G06T—IMAGE DATA PROCESSING OR GENERATION, IN GENERAL
- G06T7/00—Image analysis
- G06T7/10—Segmentation; Edge detection
- G06T7/12—Edge-based segmentation
-
- G—PHYSICS
- G01—MEASURING; TESTING
- G01N—INVESTIGATING OR ANALYSING MATERIALS BY DETERMINING THEIR CHEMICAL OR PHYSICAL PROPERTIES
- G01N15/00—Investigating characteristics of particles; Investigating permeability, pore-volume or surface-area of porous materials
- G01N15/04—Investigating sedimentation of particle suspensions
- G01N15/05—Investigating sedimentation of particle suspensions in blood
-
- G—PHYSICS
- G06—COMPUTING OR CALCULATING; COUNTING
- G06T—IMAGE DATA PROCESSING OR GENERATION, IN GENERAL
- G06T2207/00—Indexing scheme for image analysis or image enhancement
- G06T2207/30—Subject of image; Context of image processing
- G06T2207/30004—Biomedical image processing
Definitions
- the present disclosure relates to a device that measures a biological sample separated into a plurality of component regions.
- a technique for automating a related-art liquid amount checking operation of a biological specimen before opening (before aliquoting) performed by visual checking For the purpose of improving efficiency of clinical tests such as blood tests, there is a demand for a technique for automating a related-art liquid amount checking operation of a biological specimen before opening (before aliquoting) performed by visual checking.
- a biological sample such as a blood specimen before aliquoting is separated into a plurality of layers by centrifugal separation or the like, and a technique for measuring only a liquid amount of a sample that is an analysis target is required.
- a barcode label for identification or a pre-label attached to a blood collection tube and shipped may be attached to the biological sample before the aliquoting, there is a demand for a technique capable of performing measurement in a state where the labels are attached.
- PTL 1 discloses a liquid detection device in which infrared light is applied to a specimen to detect transmitted light by a line sensor, a boundary between a label and a serum region (measurement target region) is obtained based on a primary differential value thereof, and a serum amount of the specimen is measured.
- PTL 2 a signal of transmitted light is acquired by changing a light amount, so that analysis can be performed regardless of presence or absence of attenuation of the transmitted light due to the label.
- PTL 2 discloses a technique in which pulsed light having two wavelengths is emitted by performing switching in a time-division manner to a sample separated into a plurality of layers, and the transmitted light is measured while scanning the sample in a vertical direction, thereby detecting a height of a predetermined region of the sample separated into the plurality of layers.
- the serum amount is measured by detecting a position in an upper-lower direction where the label is attached and heights of upper and lower surfaces of the serum which is a measurement target.
- the signal processing of PTL 1 has a problem that under condition of a specimen in which the transmitted light is scattered by the label, such as a specimen in which the label is attached to a detector side, signals indicating the upper and lower surfaces of the serum are blurred due to the scattering, and detection accuracy decreases. Accordingly, a rotation mechanism for detecting and aligning an orientation of the label (an orientation of the specimen) is required, and it is difficult to reduce a size of the device.
- a biological sample to be measured in Embodiment 1 of the disclosure is a specimen to which a pre-opening (pre-analysis) label is attached, and is assumed to be separated into a plurality of component layers (typically, one to three layers) depending on presence or absence of centrifugal separation.
- a measurement target is a portion that is an analysis target (that is an aliquoting target) by a biochemical analyzer or the like such as a plasma or a serum of a specimen separated into a plurality of layers.
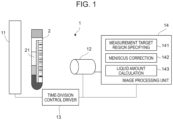
- FIG. 1 is a configuration diagram of the biological sample measuring device 1 according to Embodiment 1 of the disclosure.
- the biological sample measuring device 1 is a device that measures the biological sample 2.
- the biological sample 2 is a sample configured as described above.
- the biological sample measuring device 1 specifies the measurement target region 21 of the biological sample 2, and measures a liquid amount thereof.
- the biological sample measuring device 1 includes a surface illumination light source 11, an area camera 12, a time-division control driver 13, and the image processing unit 14.
- the surface illumination light source 102 switches a wavelength of emitted light between two wavelengths, and illuminates the biological sample 2 with the light.
- the light emitted from the surface illumination light source 11 can simultaneously illuminate two or more component layers (that is, across two or more component layers) that constitute the biological sample 2.
- an upper surface of an uppermost layer a boundary between the sample and an air layer
- the area camera 12 images surface illumination light transmitted through the biological sample 2, thereby generating a two-dimensional captured image of the biological sample 2.
- the area camera 12 has sensitivity characteristics that can detect light in a wavelength band emitted from the surface illumination light source 11.
- the area camera 12 can be implemented by, for example, an InGaAs camera.
- the time-division control driver 13 switches the wavelength of the light emitted from the surface illumination light source 11 in a time-division manner.
- the time-division control driver 13 adjusts an exposure time (or gain) of the area camera 12 to a time suitable for the wavelength in synchronization with the switching of the wavelength.
- An imaging timing of the area camera 12 is controlled by the time-division control driver 13 in synchronization with the wavelength emitted from the surface illumination light source 11.
- the time-division control driver 13 may receive a processing result from the image processing unit 14 and control re-imaging according to the result.
- the image processing unit 14 extracts a measurement target region (an image region of the specimen) from the captured image acquired by the area camera 12. An extraction principle will be described later.
- the image processing unit 14 includes a measurement target region specifying unit 141, a meniscus correction unit 142, and a liquid amount calculation unit 143. These operations will also be described later.
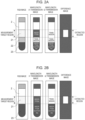
- FIGS. 2A and 2B are diagrams showing a principle for specifying the measurement target region.
- the area camera 12 captures a two-dimensional transmission image of the biological sample 2 as shown in FIGS. 2A and 2B .
- FIG. 2A shows an example in which the biological sample 2 is separated into three layers.
- FIG. 2B shows an example in which the biological sample 2 is separated into two layers.
- a blood clot 23 is formed at a lower layer when the biological sample 2 is centrifugally separated.
- a separation material 22 is mixed to separate the blood clot 23 from the measurement target region 21.
- a transmittance when the wavelength 1 is transmitted through the blood clot 23 and a transmittance when the wavelength 2 is transmitted through the blood clot 23 are substantially the same. Therefore, a difference between a captured image of the blood clot 23 acquired using the wavelength 1 and a captured image of the blood clot 23 acquired using the wavelength 2 is very small. Similarly, for the separation material 22, since the transmittance of the wavelength 1 and the transmittance of the wavelength 2 are substantially the same, a difference between the two images is very small.
- a transmittance when the wavelength 1 is transmitted through the measurement target region 21 and a transmittance when the wavelength 2 is transmitted through the measurement target region 21 are greatly different. Therefore, a difference between a captured image of the measurement target region 21 acquired using the wavelength 1 and a captured image of the measurement target region 21 acquired using the wavelength 2 is remarkable. The difference is identified, whereby the measurement target region 21 can be extracted from the captured images.
- Wavelength bands adopted as the wavelength 1 and the wavelength 2 need to be selected in advance such that a remarkable difference is generated between the wavelengths in the measurement target region 21, but almost no difference is generated in other portions as exemplified in FIGS. 2A and 2B .
- a specific numerical value of a wavelength may be optional. That is, at least a difference between the transmittance when the wavelength 1 is transmitted through the measurement target region 21 and the transmittance when the wavelength 2 is transmitted through the measurement target region 21 just needs to be larger than a difference between a transmittance when the wavelength 1 is transmitted through a region other than the measurement target region 21 and a transmittance when the wavelength 2 is transmitted through a region other than the measurement target region 21.
- the measurement target region 21 can be specified.
- the image processing unit 14 specifies the measurement target region 21 according to the principle. Although the number of component layers does not matter, a typical biological sample such as plasma or serum is separated into one to three layers. In either case, the measurement target region 21 can be accurately specified.
- the biological sample 2 having one component layer and the biological sample 2 having three component layers when the number of component layers is known in advance before the measurement, measurement can be performed using a transmission image having only one wavelength.
- a wavelength having a difference in an absorptance between the measurement target region 21 and the separation material 22 or the air layer located above and below the measurement target region 21 may be selected.
- a wavelength having a difference between the air layer above the measurement target region 21 and an absorptance of the measurement target region 21 may be selected.
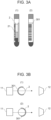
- FIGS. 3A and 3B show an example in which a label is attached to a container of the biological sample 2.
- FIG. 3A is a side view of the container
- FIG. 3B is a top view thereof.
- Abarcode label, a pre-label (label 301), or the like may be attached to the container (for example, a blood collection tube) of the biological sample 2. Even in such a case, it is required to accurately specify the measurement target region 21.
- a mechanism for controlling the orientation of the biological sample 2 is not provided, a positional relationship among the label 301, the surface illumination light source 11, and the area camera 12 varies for each biological sample 2. For example, there are a case where the label 301 is on an illumination side ((1) in FIG. 3B ) and a case where the label 301 is on a side opposite to the illumination ((2) in FIG. 3B ). In either case, it is required to specify the measurement target region 21 with the same accuracy.
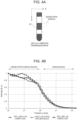
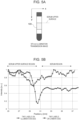
- FIG. 4A is an example of the transmission image.
- FIG. 4B and 4C show a result obtained by imaging the same simulated specimen by actually changing the orientation of the label (the orientation of the specimen) using illumination of a wavelength (1550 nm) having absorption in the measurement target region, and extracting an inclination of a boundary of a serum upper surface.
- the image processing unit 14 extracts a width of 3 mm at a specimen center from an image captured at the wavelength of 1550 nm, and averages the extracted width in an x-direction to acquire a one-dimensional signal.
- the "label illumination side” corresponds to (1) in FIG. 3B
- the "label camera side” corresponds to (2) in FIG. 3B .
- FIG. 4B shows results obtained by measuring a specimen on which one label 301 is attached to the camera (area camera 12) side, a specimen on which two labels 301 are attached to the camera side, and a specimen on which (a total of two) labels 301 are attached to the entire circumference.
- FIG. 4C shows results obtained by measuring a specimen on which one label 301 is attached to the camera side, a specimen on which two labels 301 are attached to the camera side, and a specimen on which no label 301 is attached.
- FIGS. 5A to 5B show a result obtained by extracting a signal of the serum upper surface when imaging is performed by illumination with a wavelength of 970 nm.
- the image processing unit 14 extracts a width of 3 mm at a specimen center from an image captured at the wavelength of 970 nm, and averages the extracted width in the x-direction as in FIGS. 4B to 4C to acquire a one-dimensional signal.
- FIG. 5B shows results of a case where two labels 301 are attached to the illumination (surface illumination light source 11) side and a case where two labels 301 are attached to the camera side.
- Attenuation in a serum region is less than that in the case of the illumination with the wavelength of 1550 nm.
- characteristic attenuation of transmitted light is observed in a meniscus region on the serum upper surface. This is because transmitted light is scattered and refracted due to a curved meniscus.
- the label 301 is on the camera side, a shape of a dip is unclear. This is because the transmitted light is scattered due to the label on the specimen surface as in FIGS. 4B to 4C .
- FIG. 6 is a graph showing results obtained by attaching two labels 301 to one side of the specimen, in which FIGS. 4B and 4C are overlapped.
- the inclination of the signal greatly differs depending on the orientation of the label, but it is known that both have a characteristic of point symmetry at a point in the vicinity of a luminance of 50%. Accordingly, in the disclosure, the boundary of the measurement target region 21 is accurately detected regardless of the orientation of the label by using the symmetry and detecting a center point of the luminance change.
- a luminance value of the one-dimensional signal takes a maximum value (a left half region in FIG. 6 ) and a minimum value (a right half region in FIG. 6 ).
- the luminance of 50% is a luminance value corresponding to a center point between the maximum value and the minimum value.
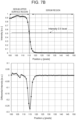
- FIGS. 7A to 7B show a method of detecting the center point of the luminance change of the one-dimensional signal.
- the image processing unit 14 can detect an inflection point of the one-dimensional signal by detecting a peak of a primary differential of the one-dimensional signal (for example, detecting a zero cross point of a secondary differential of the one-dimensional signal), and specify the inflection point as the center point of the luminance change (that is, the boundary of the measurement target region 21).
- FIG. 7A shows a one-dimensional signal acquired by light having a wavelength of 1550 nm and a profile of a primary differential thereof when the label 301 is on the camera side.
- the boundary of the measurement target region 21 can be specified by specifying a peak position of the primary differential of the one-dimensional signal. The same applies to both the upper surface boundary and the lower surface boundary.
- the boundary of the measurement target region 21 may not be a center point between a maximum luminance and a minimum luminance in the vicinity of the boundary (not at 50% level of the luminance). Therefore, the image processing unit 14 can treat, as the boundary of the measurement target region 21, such a luminance level as to minimize the variation.
- a luminance for example, 60% level of luminance
- slightly closer to the maximum luminance than the center between the maximum luminance and the minimum luminance in the vicinity of the boundary of the measurement target region 21 may be regarded as the boundary.
- an intermediate point therebetween in this example, 60% level of luminance
- a position obtained by further correcting the boundary position obtained by the inflection point of the luminance change may be regarded as a final boundary.
- a method of regarding an intermediate position between the two boundary positions as a boundary is considered.
- Such correction of the boundary position can be performed by obtaining a correction amount in advance by experiments or the like and applying the correction amount to the boundary position obtained by the primary differential peak, the luminance center point, or the like.
- the processing of obtaining the correction amount can be performed, for example, in a calibration process before the measurement is performed.
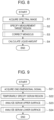
- FIG. 8 is a flowchart showing a procedure in which the image processing unit 14 measures a liquid amount (serum liquid amount) in the measurement target region 21.
- the image processing unit 14 acquires transmission images having two wavelengths captured by the area camera 12 (S1).
- the measurement target region specifying unit 141 specifies the measurement target region 21 from the captured images having wavelengths (S2: details will be described later).
- the meniscus correction unit 142 applies the correction of the meniscus width to the boundary of the specified measurement target region 21 (S3: details will be described later).
- the liquid amount calculation unit 143 calculates the liquid amount in the measurement target region 21 (S4).
- FIG. 9 is a flowchart showing details of S2. Hereinafter, each step in FIG. 9 will be described.
- the measurement target region specifying unit 141 acquires a one-dimensional signal of an acquired spectral image.
- the one-dimensional signal is obtained by extracting the vicinity of the center along a horizontal direction from the image of the biological sample 2 by a predetermined width and using a pixel value thereof.
- a width of the extracted central region is from 1 pixel to a width of the biological sample 2.
- a mean or a median of the pixel values in the central region is defined as the one-dimensional signal.
- the measurement target region specifying unit 141 acquires a difference between the one-dimensional signal of the transmission image acquired using the illumination with the wavelength of 970 nm and the one-dimensional signal of the transmission image acquired using the illumination with the wavelength of 1550 nm.
- the measurement target region specifying unit 141 temporarily specifies the measurement target region 21 based on the difference.
- a specific example is as described in FIGS. 2A to 2B .
- the measurement target region specifying unit 141 acquires a partial image in the vicinity of the upper surface boundary of the measurement target region 21 temporarily specified in S22, and specifies the upper surface boundary of the measurement target region 21 using the partial image. For example, a range of about ⁇ 5 mm of the boundary of the measurement target region 21 temporarily specified in S22 may be acquired as the partial image.
- S23 noise resistance can be improved in the subsequent analysis. When the noise is small, this step can be omitted. The same applies to S24. Details of this step will be described later.
- the measurement target region specifying unit 141 acquires a partial image in the vicinity of the lower surface boundary of the measurement target region 21 temporarily specified in S22, and specifies the lower surface boundary of the measurement target region 21 using the partial image.
- a range of the partial image is, for example, about ⁇ 5 mm of the boundary of the measurement target region 21 temporarily specified in S22. Details of this step will be described later.
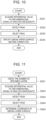
- FIG. 12 is a flowchart showing details of S3.
- the meniscus correction unit 142 acquires upper surface boundary coordinates specified in S2 (S31).
- the meniscus correction unit 142 acquires a meniscus width (S32).
- the meniscus correction unit 142 acquires an assumed meniscus width in advance from a blood collection tube to be used, experimental data acquired in advance, or the like.
- the meniscus width may be obtained from a signal of transmitted light at 970 nm (at this time, a characteristic dip is observed in the meniscus region).
- FIG. 13A shows a simulation model in which a meniscus is simulated.
- the upper surface boundary of the measurement target region 21 is a meniscus lower surface.
- a position where a Y coordinate is 15 mm is the meniscus lower surface.
- the meniscus width is 1.7 mm.
- FIG. 13B shows a result obtained by performing a simulation of transmitted light (one-dimensional signal in the vicinity of the serum upper surface) by a light beam tracing simulation using the model of FIG. 13A .
- the upper surface boundary (50% level of the luminance in FIG. 13B ) specified in S2 is shifted upward from the meniscus lower surface due to the influence of the meniscus.
- the meniscus correction unit 142 brings an estimated position of the upper surface boundary closer to the meniscus lower surface.
- the correction coefficient shown in FIG. 12 is defined by a ratio between a shift amount and the meniscus width.
- FIG. 13B it is shown by the simulation model of FIG.
- the meniscus correction unit 142 calculates the correction amount by multiplying the meniscus width acquired in advance by the correction coefficient (the correction coefficient is 0.94 in the result of FIG. 13B ), and corrects the position of the upper surface boundary downward toward the meniscus lower surface by applying the correction amount.
- the correction coefficient is preferably a value from 0.5 to 1.0.
- the correction coefficient can be determined in advance by the simulation or calibration.
- the correction coefficient may be stored in advance in a storage unit provided in the biological sample measuring device 1, or may be acquired from a storage device provided in an external device.
- the correction coefficient may be obtained in advance for each type of the biological sample 2, and the correction coefficient may be used according to the type of the biological sample 2 during measurement.
- the biological sample measuring device 1 can accurately specify the upper surface boundary and the lower surface boundary of the measurement target region 21 without adjusting the position (the position with respect to the surface illumination light source 11 or the position with respect to the area camera 12) of the label 301 attached to the biological sample 2.
- the biological sample measuring device 1 in Embodiment 1 can also be mounted as an additional option of an existing device in the existing device, or the biological sample measuring device 1 can also be used alone.
- the specific configuration (serum sample) of the biological sample 2 is assumed, and the specific example of the wavelength used for obtaining the transmission image is described.
- the disclosure is not limited thereto, and can be applied to other types of samples. That is, by appropriately selecting a wavelength for obtaining the transmission image as shown in FIGS. 2A to 2B based on absorbance characteristics of the sample, the wavelength can be applied to other samples.
- the image processing unit 14 (and each functional unit provided in the image processing unit 14) can be implemented by hardware such as a circuit device where a function of the image processing unit 14 is provided, or can also be implemented by an arithmetic device such as a central processing unit (CPU) executing software where the function is provided.
- hardware such as a circuit device where a function of the image processing unit 14 is provided
- an arithmetic device such as a central processing unit (CPU) executing software where the function is provided.
- CPU central processing unit
- the vicinity of a center along a horizontal direction may be extracted by a predetermined width from an image of the biological sample 2, and a mean or a median of pixel values may be obtained from the pixel values to obtain a one-dimensional signal, or each pixel row of two-dimensional images of the biological sample 2 may be treated as a one-dimensional signal.
- Analysis processing shown in FIG. 9 may be performed in units of pixel rows. When the analysis processing is performed in units of pixel rows, the mean or the median of the boundary coordinates determined in each pixel row is obtained to determine an upper surface and a lower surface.
Landscapes
- Physics & Mathematics (AREA)
- General Physics & Mathematics (AREA)
- Electromagnetism (AREA)
- Life Sciences & Earth Sciences (AREA)
- Health & Medical Sciences (AREA)
- Engineering & Computer Science (AREA)
- Chemical & Material Sciences (AREA)
- Fluid Mechanics (AREA)
- Thermal Sciences (AREA)
- Biomedical Technology (AREA)
- Pathology (AREA)
- Analytical Chemistry (AREA)
- Immunology (AREA)
- General Health & Medical Sciences (AREA)
- Biochemistry (AREA)
- Medicinal Chemistry (AREA)
- Urology & Nephrology (AREA)
- Food Science & Technology (AREA)
- Molecular Biology (AREA)
- Hematology (AREA)
- Biophysics (AREA)
- Theoretical Computer Science (AREA)
- Computer Vision & Pattern Recognition (AREA)
- Investigating Or Analysing Materials By Optical Means (AREA)
- Measurement Of Levels Of Liquids Or Fluent Solid Materials (AREA)
- Automatic Analysis And Handling Materials Therefor (AREA)
Applications Claiming Priority (2)
| Application Number | Priority Date | Filing Date | Title |
|---|---|---|---|
| JP2022084300A JP2023172471A (ja) | 2022-05-24 | 2022-05-24 | 生体試料測定装置 |
| PCT/JP2023/004335 WO2023228485A1 (ja) | 2022-05-24 | 2023-02-09 | 生体試料測定装置 |
Publications (1)
| Publication Number | Publication Date |
|---|---|
| EP4535005A1 true EP4535005A1 (de) | 2025-04-09 |
Family
ID=88918935
Family Applications (1)
| Application Number | Title | Priority Date | Filing Date |
|---|---|---|---|
| EP23811366.6A Pending EP4535005A1 (de) | 2022-05-24 | 2023-02-09 | Vorrichtung zur messung biologischer proben |
Country Status (5)
| Country | Link |
|---|---|
| US (1) | US20250224267A1 (de) |
| EP (1) | EP4535005A1 (de) |
| JP (1) | JP2023172471A (de) |
| CN (1) | CN118974561A (de) |
| WO (1) | WO2023228485A1 (de) |
Families Citing this family (1)
| Publication number | Priority date | Publication date | Assignee | Title |
|---|---|---|---|---|
| EP4692738A1 (de) * | 2023-03-31 | 2026-02-11 | Hitachi High-Tech Corporation | Vorrichtung zur erkennung einer flüssigkeitsoberfläche und verfahren zur erkennung einer flüssigkeitsoberfläche |
Family Cites Families (8)
| Publication number | Priority date | Publication date | Assignee | Title |
|---|---|---|---|---|
| US6770883B2 (en) * | 2002-01-30 | 2004-08-03 | Beckman Coulter, Inc. | Sample level detection system |
| JP4472442B2 (ja) * | 2004-06-24 | 2010-06-02 | アロカ株式会社 | 界面検出装置、体積計測装置及び界面検出方法 |
| DE102009005252A1 (de) * | 2009-01-14 | 2010-07-15 | Pvt Probenverteiltechnik Gmbh | Verfahren und Vorrichtung zur Bestimmung der Position einer Grenzfläche |
| JP5078920B2 (ja) * | 2009-01-27 | 2012-11-21 | 株式会社日立ハイテクノロジーズ | 液面検出装置及び方法 |
| JP5470295B2 (ja) * | 2011-02-03 | 2014-04-16 | 株式会社日立ハイテクノロジーズ | 生体試料の分析装置とその方法 |
| JP6800223B2 (ja) * | 2016-10-28 | 2020-12-16 | ベックマン コールター, インコーポレイテッド | 物質調製評価システム |
| JP7411908B2 (ja) * | 2020-02-28 | 2024-01-12 | パナソニックIpマネジメント株式会社 | 界面検出センサ |
| JP7767027B2 (ja) * | 2021-05-21 | 2025-11-11 | 株式会社日立ハイテク | 生体試料測定装置 |
-
2022
- 2022-05-24 JP JP2022084300A patent/JP2023172471A/ja active Pending
-
2023
- 2023-02-09 WO PCT/JP2023/004335 patent/WO2023228485A1/ja not_active Ceased
- 2023-02-09 EP EP23811366.6A patent/EP4535005A1/de active Pending
- 2023-02-09 US US18/853,245 patent/US20250224267A1/en active Pending
- 2023-02-09 CN CN202380028178.4A patent/CN118974561A/zh active Pending
Also Published As
| Publication number | Publication date |
|---|---|
| US20250224267A1 (en) | 2025-07-10 |
| WO2023228485A1 (ja) | 2023-11-30 |
| JP2023172471A (ja) | 2023-12-06 |
| CN118974561A (zh) | 2024-11-15 |
Similar Documents
| Publication | Publication Date | Title |
|---|---|---|
| EP3149492B1 (de) | Verfahren und systeme für rohrinspektion und flüssigkeitspegelerfassung | |
| JP6532486B2 (ja) | 液面検査装置、自動分析装置および処理装置 | |
| JP5330313B2 (ja) | 生体試料の分析装置 | |
| JP5414707B2 (ja) | 分析装置 | |
| JP2019504996A (ja) | 試料内のアーチファクトを分類する方法と装置 | |
| US9285348B2 (en) | Automated system for handling components of a chromatographic system | |
| CN116297438A (zh) | 微流体图像分析系统 | |
| EP4292049A1 (de) | Verfahren und vorrichtung zur identifizierung der 3d-zentrumsposition eines probenbehälters unter verwendung einer einzelbildaufnahmevorrichtung | |
| EP4535005A1 (de) | Vorrichtung zur messung biologischer proben | |
| US20180052108A1 (en) | Image processing method and image processing device | |
| JP2018535393A (ja) | 画像分析システム及び方法 | |
| US20240202953A1 (en) | Biological sample measurement device | |
| JP5644580B2 (ja) | 異状判定装置及び異状判定方法 | |
| JP6328530B2 (ja) | 血液凝固検出装置、血液凝固検出方法及び血液凝固検出プログラム | |
| US20110206186A1 (en) | X-ray analyzer and mapping method for an x-ray analysis | |
| EP3457114B1 (de) | Verfahren zur detektion von fest-flüssig-verteilung in fest-flüssig-trennungssäule einer fest-flüssig-trennungsvorrichtung und detektionsvorrichtung | |
| CN114585926B (zh) | 标识管组件类型的设备和方法 | |
| KR101590552B1 (ko) | 곡선형 스프링 형상 검사 방법 | |
| JP7358411B2 (ja) | 体外診断システムにおける試料容器の特性を決定するための方法、分析デバイス、および体外診断システム | |
| KR102410896B1 (ko) | 이미지 센서 기반 객체 분류 방법 및 장치 | |
| EP4465023A1 (de) | Messverfahren und messsystem | |
| EP4715343A1 (de) | Vorrichtung zur messung biologischer proben und kalibrierungsverfahren | |
| US20120208202A1 (en) | Method for the Reduction of Biological Sampling Errors by Means of Image Processing | |
| CN107121438B (zh) | 检查装置以及检查方法 | |
| JP2018128427A (ja) | 食品分析装置 |
Legal Events
| Date | Code | Title | Description |
|---|---|---|---|
| STAA | Information on the status of an ep patent application or granted ep patent |
Free format text: STATUS: THE INTERNATIONAL PUBLICATION HAS BEEN MADE |
|
| PUAI | Public reference made under article 153(3) epc to a published international application that has entered the european phase |
Free format text: ORIGINAL CODE: 0009012 |
|
| STAA | Information on the status of an ep patent application or granted ep patent |
Free format text: STATUS: REQUEST FOR EXAMINATION WAS MADE |
|
| 17P | Request for examination filed |
Effective date: 20240923 |
|
| AK | Designated contracting states |
Kind code of ref document: A1 Designated state(s): AL AT BE BG CH CY CZ DE DK EE ES FI FR GB GR HR HU IE IS IT LI LT LU LV MC ME MK MT NL NO PL PT RO RS SE SI SK SM TR |
|
| DAV | Request for validation of the european patent (deleted) | ||
| DAX | Request for extension of the european patent (deleted) |