EP4513155A2 - Spektrometrische vorrichtung und spektrometrisches verfahren - Google Patents
Spektrometrische vorrichtung und spektrometrisches verfahren Download PDFInfo
- Publication number
- EP4513155A2 EP4513155A2 EP25150742.2A EP25150742A EP4513155A2 EP 4513155 A2 EP4513155 A2 EP 4513155A2 EP 25150742 A EP25150742 A EP 25150742A EP 4513155 A2 EP4513155 A2 EP 4513155A2
- Authority
- EP
- European Patent Office
- Prior art keywords
- spectrum data
- region
- light
- measurement target
- exposure time
- Prior art date
- Legal status (The legal status is an assumption and is not a legal conclusion. Google has not performed a legal analysis and makes no representation as to the accuracy of the status listed.)
- Granted
Links
Images


Classifications
-
- G—PHYSICS
- G01—MEASURING; TESTING
- G01J—MEASUREMENT OF INTENSITY, VELOCITY, SPECTRAL CONTENT, POLARISATION, PHASE OR PULSE CHARACTERISTICS OF INFRARED, VISIBLE OR ULTRAVIOLET LIGHT; COLORIMETRY; RADIATION PYROMETRY
- G01J3/00—Spectrometry; Spectrophotometry; Monochromators; Measuring colours
- G01J3/28—Investigating the spectrum
- G01J3/30—Measuring the intensity of spectral lines directly on the spectrum itself
- G01J3/32—Investigating bands of a spectrum in sequence by a single detector
-
- G—PHYSICS
- G01—MEASURING; TESTING
- G01J—MEASUREMENT OF INTENSITY, VELOCITY, SPECTRAL CONTENT, POLARISATION, PHASE OR PULSE CHARACTERISTICS OF INFRARED, VISIBLE OR ULTRAVIOLET LIGHT; COLORIMETRY; RADIATION PYROMETRY
- G01J3/00—Spectrometry; Spectrophotometry; Monochromators; Measuring colours
- G01J3/28—Investigating the spectrum
- G01J3/2803—Investigating the spectrum using photoelectric array detector
-
- G—PHYSICS
- G01—MEASURING; TESTING
- G01J—MEASUREMENT OF INTENSITY, VELOCITY, SPECTRAL CONTENT, POLARISATION, PHASE OR PULSE CHARACTERISTICS OF INFRARED, VISIBLE OR ULTRAVIOLET LIGHT; COLORIMETRY; RADIATION PYROMETRY
- G01J3/00—Spectrometry; Spectrophotometry; Monochromators; Measuring colours
- G01J3/02—Details
- G01J3/0205—Optical elements not provided otherwise, e.g. optical manifolds, diffusers, windows
- G01J3/0254—Spectrometers, other than colorimeters, making use of an integrating sphere
-
- G—PHYSICS
- G01—MEASURING; TESTING
- G01J—MEASUREMENT OF INTENSITY, VELOCITY, SPECTRAL CONTENT, POLARISATION, PHASE OR PULSE CHARACTERISTICS OF INFRARED, VISIBLE OR ULTRAVIOLET LIGHT; COLORIMETRY; RADIATION PYROMETRY
- G01J3/00—Spectrometry; Spectrophotometry; Monochromators; Measuring colours
- G01J3/12—Generating the spectrum; Monochromators
-
- G—PHYSICS
- G01—MEASURING; TESTING
- G01J—MEASUREMENT OF INTENSITY, VELOCITY, SPECTRAL CONTENT, POLARISATION, PHASE OR PULSE CHARACTERISTICS OF INFRARED, VISIBLE OR ULTRAVIOLET LIGHT; COLORIMETRY; RADIATION PYROMETRY
- G01J3/00—Spectrometry; Spectrophotometry; Monochromators; Measuring colours
- G01J3/28—Investigating the spectrum
- G01J3/2823—Imaging spectrometer
-
- G—PHYSICS
- G01—MEASURING; TESTING
- G01J—MEASUREMENT OF INTENSITY, VELOCITY, SPECTRAL CONTENT, POLARISATION, PHASE OR PULSE CHARACTERISTICS OF INFRARED, VISIBLE OR ULTRAVIOLET LIGHT; COLORIMETRY; RADIATION PYROMETRY
- G01J3/00—Spectrometry; Spectrophotometry; Monochromators; Measuring colours
- G01J3/28—Investigating the spectrum
- G01J3/40—Measuring the intensity of spectral lines by determining density of a photograph of the spectrum; Spectrography
-
- G—PHYSICS
- G01—MEASURING; TESTING
- G01N—INVESTIGATING OR ANALYSING MATERIALS BY DETERMINING THEIR CHEMICAL OR PHYSICAL PROPERTIES
- G01N21/00—Investigating or analysing materials by the use of optical means, i.e. using sub-millimetre waves, infrared, visible or ultraviolet light
- G01N21/62—Systems in which the material investigated is excited whereby it emits light or causes a change in wavelength of the incident light
- G01N21/63—Systems in which the material investigated is excited whereby it emits light or causes a change in wavelength of the incident light optically excited
- G01N21/64—Fluorescence; Phosphorescence
-
- G—PHYSICS
- G01—MEASURING; TESTING
- G01J—MEASUREMENT OF INTENSITY, VELOCITY, SPECTRAL CONTENT, POLARISATION, PHASE OR PULSE CHARACTERISTICS OF INFRARED, VISIBLE OR ULTRAVIOLET LIGHT; COLORIMETRY; RADIATION PYROMETRY
- G01J3/00—Spectrometry; Spectrophotometry; Monochromators; Measuring colours
- G01J3/12—Generating the spectrum; Monochromators
- G01J2003/1208—Prism and grating
-
- G—PHYSICS
- G01—MEASURING; TESTING
- G01J—MEASUREMENT OF INTENSITY, VELOCITY, SPECTRAL CONTENT, POLARISATION, PHASE OR PULSE CHARACTERISTICS OF INFRARED, VISIBLE OR ULTRAVIOLET LIGHT; COLORIMETRY; RADIATION PYROMETRY
- G01J3/00—Spectrometry; Spectrophotometry; Monochromators; Measuring colours
- G01J3/28—Investigating the spectrum
- G01J3/2803—Investigating the spectrum using photoelectric array detector
- G01J2003/2813—2D-array
-
- G—PHYSICS
- G01—MEASURING; TESTING
- G01J—MEASUREMENT OF INTENSITY, VELOCITY, SPECTRAL CONTENT, POLARISATION, PHASE OR PULSE CHARACTERISTICS OF INFRARED, VISIBLE OR ULTRAVIOLET LIGHT; COLORIMETRY; RADIATION PYROMETRY
- G01J3/00—Spectrometry; Spectrophotometry; Monochromators; Measuring colours
- G01J3/28—Investigating the spectrum
- G01J2003/283—Investigating the spectrum computer-interfaced
-
- G—PHYSICS
- G01—MEASURING; TESTING
- G01J—MEASUREMENT OF INTENSITY, VELOCITY, SPECTRAL CONTENT, POLARISATION, PHASE OR PULSE CHARACTERISTICS OF INFRARED, VISIBLE OR ULTRAVIOLET LIGHT; COLORIMETRY; RADIATION PYROMETRY
- G01J3/00—Spectrometry; Spectrophotometry; Monochromators; Measuring colours
- G01J3/28—Investigating the spectrum
- G01J3/30—Measuring the intensity of spectral lines directly on the spectrum itself
- G01J3/36—Investigating two or more bands of a spectrum by separate detectors
-
- G—PHYSICS
- G01—MEASURING; TESTING
- G01N—INVESTIGATING OR ANALYSING MATERIALS BY DETERMINING THEIR CHEMICAL OR PHYSICAL PROPERTIES
- G01N21/00—Investigating or analysing materials by the use of optical means, i.e. using sub-millimetre waves, infrared, visible or ultraviolet light
- G01N21/62—Systems in which the material investigated is excited whereby it emits light or causes a change in wavelength of the incident light
- G01N21/63—Systems in which the material investigated is excited whereby it emits light or causes a change in wavelength of the incident light optically excited
- G01N21/64—Fluorescence; Phosphorescence
- G01N2021/6417—Spectrofluorimetric devices
- G01N2021/6421—Measuring at two or more wavelengths
-
- G—PHYSICS
- G01—MEASURING; TESTING
- G01N—INVESTIGATING OR ANALYSING MATERIALS BY DETERMINING THEIR CHEMICAL OR PHYSICAL PROPERTIES
- G01N21/00—Investigating or analysing materials by the use of optical means, i.e. using sub-millimetre waves, infrared, visible or ultraviolet light
- G01N21/62—Systems in which the material investigated is excited whereby it emits light or causes a change in wavelength of the incident light
- G01N21/63—Systems in which the material investigated is excited whereby it emits light or causes a change in wavelength of the incident light optically excited
- G01N21/64—Fluorescence; Phosphorescence
- G01N21/645—Specially adapted constructive features of fluorimeters
- G01N2021/6484—Optical fibres
-
- G—PHYSICS
- G01—MEASURING; TESTING
- G01N—INVESTIGATING OR ANALYSING MATERIALS BY DETERMINING THEIR CHEMICAL OR PHYSICAL PROPERTIES
- G01N2201/00—Features of devices classified in G01N21/00
- G01N2201/06—Illumination; Optics
- G01N2201/065—Integrating spheres
Definitions
- the present disclosure relates to a spectroscopic measurement apparatus and a spectroscopic measurement method.
- a spectroscopic measurement apparatus receives a spectral image of measurement target light generated in an object using a photodetector to acquire a spectrum of the measurement target light, and can analyze a composition of the object based on the spectrum, and can monitor phenomenon in the object.
- the spectroscopic measurement apparatus in some cases, it is required to acquire a spectrum of a high dynamic range (see Patent Document 1).
- light due to a gas used for the etching is generated, and further, light due to a material of the etching object is also generated.
- a wavelength band of the light due to the gas may be different from a wavelength band of the light due to the material.
- Monitoring an intensity of the light due to the gas enables monitoring a state of the gas.
- Monitoring a temporal change in intensity of the light due to the material enables detection of etching end timing.
- the light due to the gas is of high intensity, whereas the light due to the material is often of low intensity.
- a spectrum of excitation light is measured in a state in which no sample is put in the integrating sphere, and further, a spectrum of the excitation light absorbed by the sample and a spectrum of light generated in the sample (for example, fluorescence) are measured at the same time in a state in which the sample is put in the integrating sphere.
- a spectrum of the excitation light absorbed by the sample and a spectrum of light generated in the sample (for example, fluorescence) are measured at the same time in a state in which the sample is put in the integrating sphere.
- the excitation light intensity is extremely high compared with the generated light intensity, an exposure time has to be short for measuring the high excitation light intensity regardless of the necessity of measuring the low generated light intensity. Therefore, it is not possible to measure the generated light with a good S/N ratio.
- the photodetector is saturated with the excitation light having an intensity of a certain light amount or more, and thus, increasing the excitation light intensity is not easy.
- the dynamic range of the spectrum of the measurement target light may be large, and it may be desired to acquire the spectrum of the measurement target light at the same time.
- Patent Document 1 Japanese Patent Application Laid-Open Publication No. 2007-527516
- the dynamic range of the photodetector (the ratio of the maximum level and the minimum level of the light intensity detectable by the photodetector) has limitations.
- the dynamic range of the spectrum of the measurement target light is larger than the dynamic range of the photodetector, the spectrum of the measurement target light fails to be acquired by receiving a spectral image by the photodetector at one time. That is, when a signal level output for light in a low-intensity wavelength band is set to a noise level or more, a signal level output for light in a high-intensity wavelength band is a saturation level or more. On the other hand, when the signal level output for light in the high-intensity wavelength band is set to the saturation level or less, the signal level output for light in the low-intensity wavelength band is the noise level or less.
- An object of an embodiment is to provide a spectroscopic measurement apparatus and a spectroscopic measurement method that can acquire a spectrum of light with a high dynamic range using one photodetector.
- An embodiment is a spectroscopic measurement apparatus.
- the spectroscopic measurement apparatus includes (1) an optical system for dispersing measurement target light to form a spectral image, (2) a photodetector including a light receiving surface on which a plurality of pixels are arranged respectively on a plurality of rows with the spectral image having a wavelength axis in a pixel arrangement direction of each of the plurality of rows being formed on the light receiving surface, and for receiving the spectral image for a first exposure time by a plurality of pixels arranged on one or a plurality of rows in a first region on the light receiving surface to output first spectrum data of the measurement target light, and receiving the spectral image for a second exposure time by a plurality of pixels arranged on one or a plurality of rows in a second region on the light receiving surface to output second spectrum data of the measurement target light, and (3) an analysis unit for obtaining a spectrum of the measurement target light based on the first spectrum data and the second spectrum data, and (4) the second exposure time is longer
- An embodiment is a spectroscopic measurement method.
- the spectroscopic measurement method includes (1) a light detection step of using a photodetector including a light receiving surface on which a plurality of pixels are arranged respectively on a plurality of rows, forming a spectral image of measurement target light having a wavelength axis in a pixel arrangement direction of each of the plurality of rows on the light receiving surface, receiving the spectral image for a first exposure time by a plurality of pixels arranged on one or a plurality of rows in a first region on the light receiving surface to output first spectrum data of the measurement target light, and receiving the spectral image for a second exposure time by a plurality of pixels arranged on one or a plurality of rows in a second region on the light receiving surface to output second spectrum data of the measurement target light, and (2) an analysis step of obtaining a spectrum of the measurement target light based on the first spectrum data and the second spectrum data, and (3) in the light detection step, the second exposure time is longer than the first exposure time
- a spectrum of light of a high dynamic range can be acquired using one photodetector.
- FIG. 1 is a diagram illustrating a configuration of a spectroscopic measurement apparatus 1.
- the spectroscopic measurement apparatus 1 includes an optical system 10, a photodetector 20, an analysis unit 30, a display unit 40, and an input unit 50, and acquires a spectrum of measurement target light reached from an object S.
- the object S is an object of dry etching by plasma processing, and the measurement target light from the object S includes light due to a gas used for the etching, and light due to a material of the etching object.
- the object S is an object put in an integrating sphere for measuring a photoluminescence quantum yield, and the measurement target light from the object S includes excitation light and generated light (for example, fluorescence).
- the optical system 10 guides the measurement target light from the object S to the light receiving surface of the photodetector 20, and forms a spectral image of the measurement target light on the light receiving surface of the photodetector 20.
- the optical system 10 may include an optical fiber for guiding the light.
- the optical system 10 disperses the measurement target light into wavelength components using a spectroscopic element such as a grating or a prism, and forms the spectral image on the light receiving surface of the photodetector 20.
- the optical system 10 may include an optical element such as a lens and a mirror. Further, the optical system 10 may be a Czerny-Turner spectroscope, for example.
- the photodetector 20 includes a light receiving surface on which a plurality of pixels are arranged respectively on a plurality of rows. On the light receiving surface, a spectral image having a wavelength axis in a pixel arrangement direction of each of the plurality of rows is formed.
- the photodetector 20 is a CCD image sensor or a CMOS image sensor formed on a semiconductor substrate, for example.
- the photodetector 20 is preferably a photodetector that is thinned by grinding the rear surface (surface on the opposite side of the image sensor forming surface) of the semiconductor substrate and that can detect light with a high sensitivity in a wide wavelength band.
- the CCD image sensor is preferable since it is of sensitivity higher than the CMOS image sensor.
- the CCD image sensor may be any of an interline CCD type, a frame transfer CCD type, and a full-frame transfer CCD type.
- the light receiving surface of the photodetector 20 is divided into a first region and a second region.
- the photodetector 20 receives the spectral image for a first exposure time by a plurality of pixels arranged on one or a plurality of rows in the first region on the light receiving surface, and outputs first spectrum data of the measurement target light. Further, the photodetector 20 receives the spectral image for a second exposure time by a plurality of pixels arranged on one or a plurality of rows in the second region on the light receiving surface, and outputs second spectrum data of the measurement target light.
- the second exposure time is longer than the first exposure time.
- the analysis unit 30 obtains the spectrum of the measurement target light based on the first spectrum data and the second spectrum data. The content of the analysis by the analysis unit 30 will be described later.
- the analysis unit 30 includes a storage unit storing input first spectrum data, second spectrum data, analysis results, and the like. Further, the analysis unit 30 may control the photodetector 20.
- the analysis unit 30 may be a computer or a tablet terminal including a processor such as a central processing unit (CPU) and a storage medium such as a random access memory (RAM) and a read only memory (ROM), for example, and in this case, it can be integrated with the display unit 40 and the input unit 50. Further, the analysis unit 30 may be configured by a microcomputer or a field-programmable gate array (FPGA).
- a processor such as a central processing unit (CPU) and a storage medium such as a random access memory (RAM) and a read only memory (ROM), for example, and in this case, it can be integrated with the display unit 40 and the input unit 50.
- the analysis unit 30 may be configured by a microcomputer or a field-programmable gate array (FPGA).
- the display unit 40 displays the spectrum based on the first spectrum data and the second spectrum data input to the analysis unit 30, and further, displays the analysis result by the analysis unit 30.
- the input unit 50 is a keyboard, a mouse, and the like, for example, accepts an input instruction from an operator performing a spectroscopic measurement using the spectroscopic measurement apparatus 1, and gives the input information (for example, measurement conditions, display conditions, and the like) to the analysis unit 30. Further, the display unit 40 and the input unit 50 may be an integrated touch panel or the like.
- FIG. 2 is a diagram showing an example of the spectral image.
- a wavelength axis extends in the horizontal direction
- an image for each wavelength extends in the vertical direction.
- the spectral image has a vertically symmetrical shape with a certain center line (a dashed line in the drawing) extending in the horizontal direction as the axis of symmetry.
- the image for each wavelength has an arcuate shape in some cases.
- FIG. 3 is a diagram schematically illustrating a configuration of the photodetector 20.
- the photodetector 20 is a CCD image sensor.
- the light receiving surface of the photodetector 20 is divided into the first region 21 and the second region 22 with the symmetry axis (the dashed line in FIG. 2 ) of the spectral image to be formed as a boundary.
- a plurality of pixels are arranged on one or a plurality of rows.
- Each pixel can generate and accumulate charges of an amount according to an intensity of received light.
- each of the first region 21 and the second region 22 has 128 rows in the vertical direction, and 2048 pixels are arranged in the horizontal direction in each row.
- the charges generated and accumulated in each pixel are transferred to a horizontal shift register 23, and the charges of one or more pixels in each column are added for each column in the horizontal shift register 23 (hereinafter, this operation is referred to as “vertical transfer”).
- the charges added for each column in the horizontal shift register 23 are sequentially read from the horizontal shift register 23 (hereinafter, this operation is referred to as "horizontal transfer”).
- a voltage value according to the amount of charges read from the horizontal shift register 23 is output from an amplifier 25, and the voltage value is AD-converted by an AD converter into a digital value. Accordingly, the first spectrum data is acquired.
- the charges generated and accumulated in each pixel are transferred to a horizontal shift register 24, and the charges of one or more pixels in each column are added for each column in the horizontal shift register 24 (vertical transfer). After that, the charges added for each column in the horizontal shift register 24 are sequentially read from the horizontal shift register 24 (horizontal transfer). Then, a voltage value according to the amount of charges read from the horizontal shift register 24 is output from an amplifier 26, and the voltage value is AD-converted by an AD converter into a digital value. Accordingly, the second spectrum data is acquired.
- the second exposure time in the second region 22 is longer than the first exposure time in the first region 21.
- the exposure time of each region can be set by an electronic shutter.
- the electronic shutter can be achieved by using an anti-blooming gate (ABG).
- the photodetector 20 synchronizes an output operation of the first spectrum data with an output operation of the second spectrum data. Further, preferably, the photodetector 20 has an output period of the second spectrum data at an integral multiple of an output period of the first spectrum data.
- FIG. 4 is a timing chart illustrating a first operation example of the photodetector 20.
- This drawing is a timing chart in the case in which a full-frame transfer type CCD image sensor is used. In this case, half of the charges accumulated during the vertical transfer period are transferred to the horizontal shift register in the vertical transfer, and the remaining half are transferred to the horizontal shift register in the next vertical transfer.
- the ABG is always in the off state, and the charges are continuously accumulated in both the first region 21 and the second region 22.
- the output period of the second spectrum data from the second region 22 is five times the output period of the first spectrum data from the first region 21. Therefore, the second exposure time in the second region 22 is about five times the first exposure time in the first region 21.
- the analysis unit 30 may average a plurality (five, for example) of first spectrum data continuously output from the photodetector 20 and process the averaged first spectrum data.
- FIG. 5 is a timing chart illustrating a second operation example of the photodetector 20. This drawing is also a timing chart in the case in which a full-frame transfer type CCD image sensor is used.
- the ABG In the second operation example, in the second region 22, the ABG is always in the off state, and the charges are continuously accumulated. Therefore, in the second region 22, the pulse phenomenon that occurs only for a moment can be measured.
- the ABG in the first region 21, the ABG periodically repeats on/off. Therefore, in the first region 21, the charges generated during the period when the ABG is in the on state are discarded, and the charges generated during the period when the ABG is in the off state are accumulated. In the first region 21, the unread charges in the vertical transfer are discarded before the next vertical transfer.
- the signal instructing one output operation may be superimposed as noise on the signal instructing the other output operation. Therefore, when the output operations of the first region 21 and the second region 22 are performed at the same timing, preferably, the output operations of the first region 21 and the second region 22 are completely synchronized.
- FIG. 6 is a diagram showing an example of the first spectrum data.
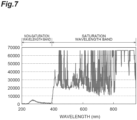
- FIG. 7 is a diagram showing an example of the second spectrum data.
- the first spectrum data and the second spectrum data are acquired substantially at the same time by the photodetector 20.
- the first spectrum data ( FIG. 6 ) is acquired in the first region 21 with a short exposure time, and is at the saturation level or less in all wavelength bands.
- the second spectrum data ( FIG. 7 ) is acquired in the second region 22 with a long exposure time, and is at the saturation level or more in a certain wavelength band.
- the analysis unit 30 divides the entire wavelength band of the spectrum (approximately 200 nm to 880 nm in these drawings) into a saturation wavelength band (approximately 400 nm to 880 nm) including a wavelength band in which a value is at the saturation level or more in the second spectrum data and a non-saturation wavelength band (approximately 200 nm to 400 nm) other than the saturation wavelength band.
- the saturation wavelength band the first spectrum data is less than the saturation level even though the second spectrum data is at the saturation level or more.
- the non-saturation wavelength band the second spectrum data is less than the saturation level, and can have a S/N ratio better than that in the first spectrum data.
- the analysis unit 30 obtains the spectrum of the measurement target light based on the first partial spectrum data of the saturation wavelength band in the first spectrum data and the second partial spectrum data of the non-saturation wavelength band in the second spectrum data.
- the analysis unit 30 combines the first partial spectrum data in the saturation wavelength band in the first spectrum data and the second partial spectrum data in the non-saturation wavelength band in the second spectrum data as described below, and thus, one spectrum of the measurement light can be obtained.
- the analysis unit 30 obtains a ratio of the integrated values of the first spectrum data and the second spectrum data in a wavelength band in which both of the first spectrum data and the second spectrum data are at the saturation level or less. Specifically, the analysis unit 30 first sets the values of the first spectrum data and the second spectrum data to zero in a wavelength band in which both or one of the first spectrum data and the second spectrum data is the saturation level or more.
- FIG. 8 is a diagram showing an example in which the value in the predetermined wavelength band (wavelength band of the saturation level or more) is set to zero in the first spectrum data ( FIG. 6 ).
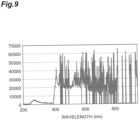
- FIG. 9 is a diagram showing an example in which the value in the predetermined wavelength band (wavelength band of the saturation level or more) is set to zero in the second spectrum data ( FIG. 7 ).
- the analysis unit 30 obtains the integrated values of the first spectrum data and the second spectrum data after setting the values in the predetermined wavelength band to zero, and obtains the ratio of these two integrated values.
- the ratio of the integrated values represents the intensity ratio of the output signals from the first region 21 and the second region 22, and represents the ratio of the exposure times.
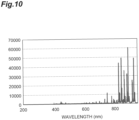
- the analysis unit 30 adjusts both or one of the first partial spectrum data and the second partial spectrum data using the ratio of the integrated values, and obtains the entire spectrum of the measurement target light based on the first partial spectrum data and the second partial spectrum data after the adjustment.
- the first partial spectrum data may be multiplied by the integrated value ratio, or the second partial spectrum data may be divided by the integrated value ratio.
- the second partial spectrum data may be divided by the integrated value ratio.
- FIG. 10 is a diagram showing the spectrum of the measurement target light obtained based on the first partial spectrum data and the second partial spectrum data after the adjustment.
- the spectroscopic measurement method of the present embodiment performs measurement using the spectroscopic measurement apparatus of the present embodiment described above, and includes a light detection step of outputting the first spectrum data and the second spectrum data using the photodetector 20, and an analysis step of obtaining the spectrum of the measurement target light based on the first spectrum data and the second spectrum data.
- the content of the light detection step is as described as the configuration and operation of the photodetector 20.
- the content of the analysis step is as described as the analysis content of the analysis unit 30.
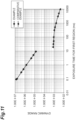
- FIG. 11 is a graph showing an example of the relationship between the exposure time in the first region and the dynamic range in an example and a comparative example.
- the dynamic range of the comparative example is a dynamic range in the case in which the spectrum of the measurement target light is acquired without division into the first region and the second region.
- the dynamic range of the example is larger than that of the comparative example.
- the dynamic range is expressed as a ratio of a maximum detectable level and a minimum detectable level.
- the maximum detectable level is a saturation charge amount of the horizontal shift register (for example, 300 ke - ), and the minimum detectable level is a noise level.
- the second partial spectrum data is divided by the integrated value ratio (output signal intensity ratio), and thus, the minimum detectable level (noise level) in the second partial spectrum data becomes smaller, and the dynamic range becomes larger.
- the spectrum of light having a high dynamic range can be acquired using one photodetector 20.
- both of the light of high intensity and the light of low intensity can be measured substantially at the same time. Therefore, in a step of dry etching of an object by plasma processing, a spectrum of measurement target light including both of the light of high intensity due to a gas and the light of low intensity due to a material can be acquired, the state of the gas can be monitored, and the etching end timing can be detected.
- a spectrum of excitation light absorbed by the sample and a spectrum of light generated from the sample can be measured at the same time in a state in which the sample is put in the integrating sphere.
- the spectroscopic measurement apparatus and the spectroscopic measurement method of the present embodiment can measure both of the light of high intensity and the light of low intensity substantially at the same time, and further, can measure the light of high intensity and the light of low intensity at the different periods.
- the same measurement conditions can be set for the measurement of the light of high intensity and the measurement of the light of low intensity, and for example, an ND filter does not necessarily have to be inserted in the measurement of the light of high intensity.
- applications include a measurement of a spectrum of weak output light when a small current is applied to a light emitting diode (LED) and a measurement of a spectrum of bright output light when a rated current is applied to the LED. In such applications, the measurement of a high dynamic range of light can be performed with high wavelength accuracy.
- the spectroscopic measurement apparatus and the spectroscopic measurement method are not limited to the above embodiments and configuration examples, and various other modifications are possible.
- the spectroscopic measurement apparatus of the above embodiment is configured to include (1) an optical system for dispersing measurement target light to form a spectral image, (2) a photodetector including a light receiving surface on which a plurality of pixels are arranged respectively on a plurality of rows with the spectral image having a wavelength axis in a pixel arrangement direction of each of the plurality of rows being formed on the light receiving surface, and for receiving the spectral image for a first exposure time by a plurality of pixels arranged on one or a plurality of rows in a first region on the light receiving surface to output first spectrum data of the measurement target light, and receiving the spectral image for a second exposure time by a plurality of pixels arranged on one or a plurality of rows in a second region on the light receiving surface to output second spectrum data of the measurement target light, and (3) an analysis unit for obtaining a spectrum of the measurement target light based on the first spectrum data and the second spectrum data, and (4) the second exposure time is longer than the first exposure time, and
- the spectroscopic measurement method of the above embodiment is configured to include (1) a light detection step of using a photodetector including a light receiving surface on which a plurality of pixels are arranged respectively on a plurality of rows, forming a spectral image of measurement target light having a wavelength axis in a pixel arrangement direction of each of the plurality of rows on the light receiving surface, receiving the spectral image for a first exposure time by a plurality of pixels arranged on one or a plurality of rows in a first region on the light receiving surface to output first spectrum data of the measurement target light, and receiving the spectral image for a second exposure time by a plurality of pixels arranged on one or a plurality of rows in a second region on the light receiving surface to output second spectrum data of the measurement target light, and (2) an analysis step of obtaining a spectrum of the measurement target light based on the first spectrum data and the second spectrum data, and (3) in the light detection step, the second exposure time is longer than the first exposure time, and in the analysis step,
- the photodetector may be a CCD image sensor. Further, in the above spectroscopic measurement method, in the light detection step, a CCD image sensor may be used as the photodetector.
- the photodetector may set at least one of the first exposure time and the second exposure time by an anti-blooming gate. Further, in the above spectroscopic measurement method, in the light detection step, at least one of the first exposure time and the second exposure time may be set by an anti-blooming gate.
- the photodetector may synchronize an output operation of the first spectrum data with an output operation of the second spectrum data. Further, in the above spectroscopic measurement method, in the light detection step, an output operation of the first spectrum data may be synchronized with an output operation of the second spectrum data.
- an output period of the second spectrum data is an integral multiple of an output period of the first spectrum data.
- an output period of the second spectrum data may be an integral multiple of an output period of the first spectrum data.
- the analysis unit may adjust both or one of the first partial spectrum data and the second partial spectrum data using a ratio of integrated values of the first spectrum data and the second spectrum data in a wavelength band in which both of the first spectrum data and the second spectrum data are at the saturation level or less, and may obtain the spectrum of the measurement target light based on the first partial spectrum data and the second partial spectrum data after the adjustment.
- both or one of the first partial spectrum data and the second partial spectrum data may be adjusted using a ratio of integrated values of the first spectrum data and the second spectrum data in a wavelength band in which both of the first spectrum data and the second spectrum data are at the saturation level or less, and the spectrum of the measurement target light may be obtained based on the first partial spectrum data and the second partial spectrum data after the adjustment.
- the embodiments can be used as a spectroscopic measurement apparatus and a spectroscopic measurement method that can acquire a spectrum of light with a high dynamic range using one photodetector.
- 1 - spectroscopic measurement apparatus 10 - optical system, 20 - photodetector, 21 - first region, 22 - second region, 30 - analysis unit, 40 - display unit, 50 - input unit.
Landscapes
- Physics & Mathematics (AREA)
- Spectroscopy & Molecular Physics (AREA)
- General Physics & Mathematics (AREA)
- Health & Medical Sciences (AREA)
- Biochemistry (AREA)
- Analytical Chemistry (AREA)
- Chemical & Material Sciences (AREA)
- General Health & Medical Sciences (AREA)
- Life Sciences & Earth Sciences (AREA)
- Immunology (AREA)
- Pathology (AREA)
- Nuclear Medicine, Radiotherapy & Molecular Imaging (AREA)
- Spectrometry And Color Measurement (AREA)
- Transforming Light Signals Into Electric Signals (AREA)
- Investigating Or Analysing Materials By Optical Means (AREA)
Applications Claiming Priority (3)
| Application Number | Priority Date | Filing Date | Title |
|---|---|---|---|
| JP2019007632A JP7219096B2 (ja) | 2019-01-21 | 2019-01-21 | 分光測定装置および分光測定方法 |
| PCT/JP2019/050199 WO2020153070A1 (ja) | 2019-01-21 | 2019-12-20 | 分光測定装置および分光測定方法 |
| EP19911798.7A EP3916367B1 (de) | 2019-01-21 | 2019-12-20 | Spektrometrische vorrichtung und spektrometrisches verfahren |
Related Parent Applications (2)
| Application Number | Title | Priority Date | Filing Date |
|---|---|---|---|
| EP19911798.7A Division EP3916367B1 (de) | 2019-01-21 | 2019-12-20 | Spektrometrische vorrichtung und spektrometrisches verfahren |
| EP19911798.7A Division-Into EP3916367B1 (de) | 2019-01-21 | 2019-12-20 | Spektrometrische vorrichtung und spektrometrisches verfahren |
Publications (3)
| Publication Number | Publication Date |
|---|---|
| EP4513155A2 true EP4513155A2 (de) | 2025-02-26 |
| EP4513155A3 EP4513155A3 (de) | 2025-04-23 |
| EP4513155B1 EP4513155B1 (de) | 2025-10-29 |
Family
ID=71735739
Family Applications (2)
| Application Number | Title | Priority Date | Filing Date |
|---|---|---|---|
| EP19911798.7A Active EP3916367B1 (de) | 2019-01-21 | 2019-12-20 | Spektrometrische vorrichtung und spektrometrisches verfahren |
| EP25150742.2A Active EP4513155B1 (de) | 2019-01-21 | 2019-12-20 | Spektrometrische vorrichtung und spektrometrisches verfahren |
Family Applications Before (1)
| Application Number | Title | Priority Date | Filing Date |
|---|---|---|---|
| EP19911798.7A Active EP3916367B1 (de) | 2019-01-21 | 2019-12-20 | Spektrometrische vorrichtung und spektrometrisches verfahren |
Country Status (7)
| Country | Link |
|---|---|
| US (3) | US11892352B2 (de) |
| EP (2) | EP3916367B1 (de) |
| JP (3) | JP7219096B2 (de) |
| KR (1) | KR102765003B1 (de) |
| CN (5) | CN118089945A (de) |
| TW (2) | TWI910848B (de) |
| WO (1) | WO2020153070A1 (de) |
Families Citing this family (11)
| Publication number | Priority date | Publication date | Assignee | Title |
|---|---|---|---|---|
| JP7219096B2 (ja) * | 2019-01-21 | 2023-02-07 | 浜松ホトニクス株式会社 | 分光測定装置および分光測定方法 |
| JP7630371B2 (ja) * | 2021-06-21 | 2025-02-17 | 東京エレクトロン株式会社 | 測定方法および測定装置 |
| DE112022007294T5 (de) * | 2022-05-27 | 2025-03-20 | Hamamatsu Photonics K.K. | Spektroskopische Vorrichtung, Raman-spektroskopische Messvorrichtung und spektroskopisches Verfahren |
| DE112022007298T5 (de) * | 2022-05-27 | 2025-03-20 | Hamamatsu Photonics K.K. | Spektroskopische Vorrichtung, Raman-spektroskopische Messvorrichtung und spektroskopisches Verfahren |
| CN119836563A (zh) | 2022-09-06 | 2025-04-15 | 浜松光子学株式会社 | 分光测定装置及分光测定方法 |
| EP4583150A1 (de) | 2022-12-06 | 2025-07-09 | Hamamatsu Photonics K.K. | Halbleiterprozessüberwachungsvorrichtung und halbleiterprozessüberwachungsverfahren |
| WO2024122134A1 (ja) | 2022-12-06 | 2024-06-13 | 浜松ホトニクス株式会社 | 半導体プロセス監視装置及び半導体プロセス監視方法 |
| JPWO2025027924A1 (de) * | 2023-07-31 | 2025-02-06 | ||
| WO2025027925A1 (ja) * | 2023-07-31 | 2025-02-06 | 浜松ホトニクス株式会社 | 光検出装置、膜厚計測装置、半導体プロセス監視装置及びノイズ検出方法 |
| CN119901718A (zh) * | 2024-01-22 | 2025-04-29 | 江苏鉴知技术有限公司 | 拉曼光谱采集方法、装置、电子设备及存储介质 |
| JP2025179474A (ja) * | 2024-05-28 | 2025-12-10 | 浜松ホトニクス株式会社 | 分光測定装置および分光測定方法 |
Citations (1)
| Publication number | Priority date | Publication date | Assignee | Title |
|---|---|---|---|---|
| JP2007527516A (ja) | 2003-07-02 | 2007-09-27 | ヴェリティー インストルメンツ,インコーポレイテッド | 電荷結合装置に基づく分光計のダイナミックレンジ拡張装置および方法 |
Family Cites Families (27)
| Publication number | Priority date | Publication date | Assignee | Title |
|---|---|---|---|---|
| CA2021052C (en) | 1990-07-12 | 1995-08-29 | Clifford D. Anger | Pushbroom spectrographic imager |
| US5986297A (en) * | 1996-05-22 | 1999-11-16 | Eastman Kodak Company | Color active pixel sensor with electronic shuttering, anti-blooming and low cross-talk |
| JP4408150B2 (ja) | 1999-07-08 | 2010-02-03 | 浜松ホトニクス株式会社 | 固体撮像装置 |
| JP2001061765A (ja) * | 1999-08-26 | 2001-03-13 | Fuji Photo Film Co Ltd | 撮像方法および装置 |
| JP2003523510A (ja) * | 2000-02-15 | 2003-08-05 | ベアリアン・オーストラリア・プロプライエタリー・リミテッド | 分光分析のための方法および装置 |
| US6753959B2 (en) * | 2000-02-15 | 2004-06-22 | Varian Australia Pty Ltd | Optical shutter for spectroscopy instrument |
| JP2002062189A (ja) | 2000-08-24 | 2002-02-28 | Shimadzu Corp | 分光測定用検出器及びこれを用いた積分球測定器および分光光度計 |
| US7633616B2 (en) * | 2003-06-02 | 2009-12-15 | Sensovation Ag | Apparatus and method for photo-electric measurement |
| WO2005008200A2 (en) * | 2003-07-18 | 2005-01-27 | Chemimage Corporation | Method and apparatus for compact dispersive imaging spectrometer |
| IL165237A0 (en) * | 2004-11-16 | 2005-12-18 | Method and system for spectral measurements | |
| US7130041B2 (en) * | 2005-03-02 | 2006-10-31 | Li-Cor, Inc. | On-chip spectral filtering using CCD array for imaging and spectroscopy |
| JP2008070274A (ja) * | 2006-09-15 | 2008-03-27 | Shimadzu Corp | 分光光度計 |
| JP5161755B2 (ja) * | 2008-12-25 | 2013-03-13 | 浜松ホトニクス株式会社 | 分光測定装置、分光測定方法、及び分光測定プログラム |
| US8013911B2 (en) * | 2009-03-30 | 2011-09-06 | Texas Instruments Incorporated | Method for mixing high-gain and low-gain signal for wide dynamic range image sensor |
| CN102901564B (zh) * | 2012-07-27 | 2014-09-03 | 中国科学院空间科学与应用研究中心 | 一种互补测量的时间分辨单光子光谱计数成像系统及方法 |
| CN103207016B (zh) * | 2012-12-30 | 2015-01-14 | 吉林大学 | 光谱型太阳辐射照度测量仪 |
| US9100600B2 (en) * | 2013-07-10 | 2015-08-04 | Samsung Electronics Co., Ltd. | Anti-blooming shutter control in image sensors |
| WO2015046045A1 (ja) | 2013-09-27 | 2015-04-02 | 富士フイルム株式会社 | 撮像装置及び撮像方法 |
| US9163986B2 (en) * | 2013-10-17 | 2015-10-20 | The Boeing Company | Method and system for enhancing spectrometer function |
| JP6677651B2 (ja) * | 2014-12-02 | 2020-04-08 | 浜松ホトニクス株式会社 | 分光測定装置および分光測定方法 |
| JP6693694B2 (ja) * | 2014-12-02 | 2020-05-13 | 浜松ホトニクス株式会社 | 分光測定装置および分光測定方法 |
| US9332200B1 (en) | 2014-12-05 | 2016-05-03 | Qualcomm Incorporated | Pixel readout architecture for full well capacity extension |
| US10408874B2 (en) | 2015-05-29 | 2019-09-10 | Hamamatsu Photonics K.K. | Light source device and inspection device |
| US9797776B2 (en) * | 2015-09-04 | 2017-10-24 | Bwt Property, Inc. | Laser induced breakdown spectroscopy (LIBS) apparatus based on high repetition rate pulsed laser |
| JP2018128326A (ja) * | 2017-02-07 | 2018-08-16 | 大塚電子株式会社 | 光学スペクトル測定装置および光学スペクトル測定方法 |
| US11424115B2 (en) * | 2017-03-31 | 2022-08-23 | Verity Instruments, Inc. | Multimode configurable spectrometer |
| JP7219096B2 (ja) * | 2019-01-21 | 2023-02-07 | 浜松ホトニクス株式会社 | 分光測定装置および分光測定方法 |
-
2019
- 2019-01-21 JP JP2019007632A patent/JP7219096B2/ja active Active
- 2019-12-20 US US17/423,948 patent/US11892352B2/en active Active
- 2019-12-20 CN CN202410376316.4A patent/CN118089945A/zh active Pending
- 2019-12-20 KR KR1020217022159A patent/KR102765003B1/ko active Active
- 2019-12-20 CN CN202410376227.XA patent/CN118129910A/zh active Pending
- 2019-12-20 EP EP19911798.7A patent/EP3916367B1/de active Active
- 2019-12-20 CN CN202410376037.8A patent/CN118089943A/zh active Pending
- 2019-12-20 CN CN202410376149.3A patent/CN118089944A/zh active Pending
- 2019-12-20 CN CN201980089626.5A patent/CN113396317B/zh active Active
- 2019-12-20 EP EP25150742.2A patent/EP4513155B1/de active Active
- 2019-12-20 WO PCT/JP2019/050199 patent/WO2020153070A1/ja not_active Ceased
-
2020
- 2020-01-06 TW TW113137102A patent/TWI910848B/zh active
- 2020-01-06 TW TW109100307A patent/TWI859178B/zh active
-
2023
- 2023-01-03 US US18/092,603 patent/US11828653B2/en active Active
- 2023-01-26 JP JP2023010170A patent/JP7410340B2/ja active Active
- 2023-11-10 US US18/388,632 patent/US12174072B2/en active Active
- 2023-12-21 JP JP2023215944A patent/JP7583905B2/ja active Active
Patent Citations (1)
| Publication number | Priority date | Publication date | Assignee | Title |
|---|---|---|---|---|
| JP2007527516A (ja) | 2003-07-02 | 2007-09-27 | ヴェリティー インストルメンツ,インコーポレイテッド | 電荷結合装置に基づく分光計のダイナミックレンジ拡張装置および方法 |
Also Published As
| Publication number | Publication date |
|---|---|
| JP7583905B2 (ja) | 2024-11-14 |
| EP3916367A4 (de) | 2022-10-26 |
| WO2020153070A1 (ja) | 2020-07-30 |
| KR20210113994A (ko) | 2021-09-17 |
| CN118089944A (zh) | 2024-05-28 |
| US12174072B2 (en) | 2024-12-24 |
| CN118089945A (zh) | 2024-05-28 |
| CN113396317B (zh) | 2024-04-16 |
| CN118089943A (zh) | 2024-05-28 |
| JP7410340B2 (ja) | 2024-01-09 |
| EP3916367B1 (de) | 2025-03-05 |
| US11892352B2 (en) | 2024-02-06 |
| TWI859178B (zh) | 2024-10-21 |
| CN113396317A (zh) | 2021-09-14 |
| JP7219096B2 (ja) | 2023-02-07 |
| US20220082439A1 (en) | 2022-03-17 |
| JP2024026464A (ja) | 2024-02-28 |
| TW202503239A (zh) | 2025-01-16 |
| EP4513155A3 (de) | 2025-04-23 |
| JP2023052650A (ja) | 2023-04-11 |
| US20240077360A1 (en) | 2024-03-07 |
| CN118129910A (zh) | 2024-06-04 |
| JP2020118477A (ja) | 2020-08-06 |
| KR102765003B1 (ko) | 2025-02-11 |
| EP3916367A1 (de) | 2021-12-01 |
| US20230147189A1 (en) | 2023-05-11 |
| TWI910848B (zh) | 2026-01-01 |
| TW202040108A (zh) | 2020-11-01 |
| US11828653B2 (en) | 2023-11-28 |
| EP4513155B1 (de) | 2025-10-29 |
Similar Documents
| Publication | Publication Date | Title |
|---|---|---|
| EP4513155B1 (de) | Spektrometrische vorrichtung und spektrometrisches verfahren | |
| JP7201868B2 (ja) | 分光測定装置および分光測定方法 | |
| US20250189453A1 (en) | Spectroscopic device, raman spectroscopic measurement device, and spectroscopic method | |
| JP7479584B1 (ja) | 半導体プロセス監視装置及び半導体プロセス監視方法 | |
| US10337919B2 (en) | Optical unit and spectrometer provided with same | |
| US20250341469A1 (en) | Spectroscopic device, raman spectroscopic measurement device, and spectroscopic method | |
| US20250258039A1 (en) | Spectroscopy device, raman spectroscopic measurement device, and spectroscopy method | |
| WO2024122134A1 (ja) | 半導体プロセス監視装置及び半導体プロセス監視方法 | |
| JP2025179474A (ja) | 分光測定装置および分光測定方法 | |
| TW202508299A (zh) | 光檢測裝置、膜厚計測裝置、半導體製程監視裝置及雜訊檢測方法 | |
| TW202508298A (zh) | 光檢測裝置、膜厚計測裝置、半導體製程監視裝置及雜訊檢測方法 | |
| CN120303531A (zh) | 膜厚测量装置及膜厚测量方法 |
Legal Events
| Date | Code | Title | Description |
|---|---|---|---|
| PUAI | Public reference made under article 153(3) epc to a published international application that has entered the european phase |
Free format text: ORIGINAL CODE: 0009012 |
|
| STAA | Information on the status of an ep patent application or granted ep patent |
Free format text: STATUS: REQUEST FOR EXAMINATION WAS MADE |
|
| 17P | Request for examination filed |
Effective date: 20250108 |
|
| AC | Divisional application: reference to earlier application |
Ref document number: 3916367 Country of ref document: EP Kind code of ref document: P |
|
| AK | Designated contracting states |
Kind code of ref document: A2 Designated state(s): AL AT BE BG CH CY CZ DE DK EE ES FI FR GB GR HR HU IE IS IT LI LT LU LV MC MK MT NL NO PL PT RO RS SE SI SK SM TR |
|
| REG | Reference to a national code |
Ref country code: DE Ref legal event code: R079 Free format text: PREVIOUS MAIN CLASS: G01J0003280000 Ipc: G01J0003360000 Ref document number: 602019077649 Country of ref document: DE |
|
| PUAL | Search report despatched |
Free format text: ORIGINAL CODE: 0009013 |
|
| AK | Designated contracting states |
Kind code of ref document: A3 Designated state(s): AL AT BE BG CH CY CZ DE DK EE ES FI FR GB GR HR HU IE IS IT LI LT LU LV MC MK MT NL NO PL PT RO RS SE SI SK SM TR |
|
| RIC1 | Information provided on ipc code assigned before grant |
Ipc: G01J 3/28 20060101ALI20250320BHEP Ipc: G01J 3/36 20060101AFI20250320BHEP |
|
| GRAP | Despatch of communication of intention to grant a patent |
Free format text: ORIGINAL CODE: EPIDOSNIGR1 |
|
| STAA | Information on the status of an ep patent application or granted ep patent |
Free format text: STATUS: GRANT OF PATENT IS INTENDED |
|
| RIC1 | Information provided on ipc code assigned before grant |
Ipc: G01J 3/28 20060101ALI20250603BHEP Ipc: G01J 3/36 20060101AFI20250603BHEP |
|
| INTG | Intention to grant announced |
Effective date: 20250613 |
|
| GRAS | Grant fee paid |
Free format text: ORIGINAL CODE: EPIDOSNIGR3 |
|
| GRAA | (expected) grant |
Free format text: ORIGINAL CODE: 0009210 |
|
| STAA | Information on the status of an ep patent application or granted ep patent |
Free format text: STATUS: THE PATENT HAS BEEN GRANTED |
|
| AC | Divisional application: reference to earlier application |
Ref document number: 3916367 Country of ref document: EP Kind code of ref document: P |
|
| AK | Designated contracting states |
Kind code of ref document: B1 Designated state(s): AL AT BE BG CH CY CZ DE DK EE ES FI FR GB GR HR HU IE IS IT LI LT LU LV MC MK MT NL NO PL PT RO RS SE SI SK SM TR |
|
| REG | Reference to a national code |
Ref country code: CH Ref legal event code: F10 Free format text: ST27 STATUS EVENT CODE: U-0-0-F10-F00 (AS PROVIDED BY THE NATIONAL OFFICE) Effective date: 20251029 Ref country code: GB Ref legal event code: FG4D |
|
| P01 | Opt-out of the competence of the unified patent court (upc) registered |
Free format text: CASE NUMBER: UPC_APP_8094_4513155/2025 Effective date: 20250926 |
|
| REG | Reference to a national code |
Ref country code: DE Ref legal event code: R096 Ref document number: 602019077649 Country of ref document: DE |
|
| REG | Reference to a national code |
Ref country code: IE Ref legal event code: FG4D |
|
| PGFP | Annual fee paid to national office [announced via postgrant information from national office to epo] |
Ref country code: NL Payment date: 20251126 Year of fee payment: 7 |
|
| REG | Reference to a national code |
Ref country code: NL Ref legal event code: FP |
|
| PGFP | Annual fee paid to national office [announced via postgrant information from national office to epo] |
Ref country code: DE Payment date: 20251126 Year of fee payment: 7 |
|
| PGFP | Annual fee paid to national office [announced via postgrant information from national office to epo] |
Ref country code: GB Payment date: 20251120 Year of fee payment: 7 |
|
| PGFP | Annual fee paid to national office [announced via postgrant information from national office to epo] |
Ref country code: FR Payment date: 20251124 Year of fee payment: 7 |
|
| PGFP | Annual fee paid to national office [announced via postgrant information from national office to epo] |
Ref country code: BE Payment date: 20251127 Year of fee payment: 7 |
|
| PG25 | Lapsed in a contracting state [announced via postgrant information from national office to epo] |
Ref country code: ES Free format text: LAPSE BECAUSE OF FAILURE TO SUBMIT A TRANSLATION OF THE DESCRIPTION OR TO PAY THE FEE WITHIN THE PRESCRIBED TIME-LIMIT Effective date: 20251029 |
|
| REG | Reference to a national code |
Ref country code: LT Ref legal event code: MG9D |
|
| PG25 | Lapsed in a contracting state [announced via postgrant information from national office to epo] |
Ref country code: NO Free format text: LAPSE BECAUSE OF FAILURE TO SUBMIT A TRANSLATION OF THE DESCRIPTION OR TO PAY THE FEE WITHIN THE PRESCRIBED TIME-LIMIT Effective date: 20260129 |
|
| PG25 | Lapsed in a contracting state [announced via postgrant information from national office to epo] |
Ref country code: AT Free format text: LAPSE BECAUSE OF FAILURE TO SUBMIT A TRANSLATION OF THE DESCRIPTION OR TO PAY THE FEE WITHIN THE PRESCRIBED TIME-LIMIT Effective date: 20251029 Ref country code: HR Free format text: LAPSE BECAUSE OF FAILURE TO SUBMIT A TRANSLATION OF THE DESCRIPTION OR TO PAY THE FEE WITHIN THE PRESCRIBED TIME-LIMIT Effective date: 20251029 Ref country code: FI Free format text: LAPSE BECAUSE OF FAILURE TO SUBMIT A TRANSLATION OF THE DESCRIPTION OR TO PAY THE FEE WITHIN THE PRESCRIBED TIME-LIMIT Effective date: 20251029 |
|
| REG | Reference to a national code |
Ref country code: AT Ref legal event code: MK05 Ref document number: 1852023 Country of ref document: AT Kind code of ref document: T Effective date: 20251029 |
|
| PG25 | Lapsed in a contracting state [announced via postgrant information from national office to epo] |
Ref country code: RS Free format text: LAPSE BECAUSE OF FAILURE TO SUBMIT A TRANSLATION OF THE DESCRIPTION OR TO PAY THE FEE WITHIN THE PRESCRIBED TIME-LIMIT Effective date: 20260129 |
|
| PG25 | Lapsed in a contracting state [announced via postgrant information from national office to epo] |
Ref country code: IS Free format text: LAPSE BECAUSE OF FAILURE TO SUBMIT A TRANSLATION OF THE DESCRIPTION OR TO PAY THE FEE WITHIN THE PRESCRIBED TIME-LIMIT Effective date: 20260228 |