EP4411349A1 - Reduction of stray light noise in optical raman probe sensors - Google Patents
Reduction of stray light noise in optical raman probe sensors Download PDFInfo
- Publication number
- EP4411349A1 EP4411349A1 EP23305149.9A EP23305149A EP4411349A1 EP 4411349 A1 EP4411349 A1 EP 4411349A1 EP 23305149 A EP23305149 A EP 23305149A EP 4411349 A1 EP4411349 A1 EP 4411349A1
- Authority
- EP
- European Patent Office
- Prior art keywords
- raman
- spectrum
- measurements
- noise
- signal acquisition
- Prior art date
- Legal status (The legal status is an assumption and is not a legal conclusion. Google has not performed a legal analysis and makes no representation as to the accuracy of the status listed.)
- Pending
Links
Images
Classifications
-
- G—PHYSICS
- G01—MEASURING; TESTING
- G01N—INVESTIGATING OR ANALYSING MATERIALS BY DETERMINING THEIR CHEMICAL OR PHYSICAL PROPERTIES
- G01N21/00—Investigating or analysing materials by the use of optical means, i.e. using sub-millimetre waves, infrared, visible or ultraviolet light
- G01N21/62—Systems in which the material investigated is excited whereby it emits light or causes a change in wavelength of the incident light
- G01N21/63—Systems in which the material investigated is excited whereby it emits light or causes a change in wavelength of the incident light optically excited
- G01N21/65—Raman scattering
-
- G—PHYSICS
- G01—MEASURING; TESTING
- G01J—MEASUREMENT OF INTENSITY, VELOCITY, SPECTRAL CONTENT, POLARISATION, PHASE OR PULSE CHARACTERISTICS OF INFRARED, VISIBLE OR ULTRAVIOLET LIGHT; COLORIMETRY; RADIATION PYROMETRY
- G01J3/00—Spectrometry; Spectrophotometry; Monochromators; Measuring colours
- G01J3/28—Investigating the spectrum
- G01J3/44—Raman spectrometry; Scattering spectrometry ; Fluorescence spectrometry
- G01J3/4412—Scattering spectrometry
-
- G—PHYSICS
- G01—MEASURING; TESTING
- G01N—INVESTIGATING OR ANALYSING MATERIALS BY DETERMINING THEIR CHEMICAL OR PHYSICAL PROPERTIES
- G01N2201/00—Features of devices classified in G01N21/00
- G01N2201/12—Circuits of general importance; Signal processing
Definitions
- Embodiments of the present disclosure relate to systems and methods to reduce stray light noise in optical Raman probe sensors.
- this monitoring may be done using Raman spectroscopy.
- Raman spectroscopy a laser is used to direct light at a specific wavelength toward a target molecule. A photon reaches a molecule and excites it. Once the photon excites the molecule, there are several possible results. The most common is that the excitation is temporary and the molecule returns to its initial energy state. In this mode, the photon is scattered or redirected due to the interaction with the molecule. Further, the wavelength of the photon is unchanged since none of its energy was absorbed by the molecule. This phenomenon is referred to as Rayleigh scattering and does not provide any information about the molecule being analyzed.
- the molecule is excited by the photon and moves to a different vibrational or rotational state. If that new state is a higher energy state than the original energy state, then the photon loses energy, which results in a lower frequency. In this way, the total amount of energy is conserved.
- This mode is referred to as Stokes Raman scattering.
- the Stokes Raman scattering and anti-Stokes Raman scattering may be used to generate a spectrum.
- This spectrum is usually displayed having a horizontal axis corresponding to wavenumber, which is typically defined as: 1 ⁇ 0 ⁇ 1 ⁇ 1 , where ⁇ 0 is the wavelength of the laser and ⁇ 1 is the wavelength of the Raman scattered light.
- the vertical axis is used to represent intensity.
- each molecule when excited, produces a unique spectrum that may be used to identify that molecule.
- the presence of different molecules may be determined using this approach.
- the percentage of Stokes-Raman scattering as compared to Rayleigh scattering is very low and highly sensitive to noise. For example, ambient light from the sun or interior lighting may alter the Raman spectrum.
- a system and method for quantifying the stray light that enters a Raman optical sensor and removes this from the Raman spectrum is disclosed.
- One or more background noise measurements are performed by the Raman analyzer wherein the laser is disabled during these background noise measurements.
- One or more traditional signal acquisition measurements are then performed. The results from the background noise measurements and the traditional signal acquisition measurement are then processed. This results in a clean spectrum, where the background noise has been significantly reduced.
- background noise measurements are performed before and after the traditional signal acquisition measurement and these background noise measurements are averaged.
- a method of measuring Raman scattering comprises performing one or more noise acquisition measurements using a Raman analyzer, wherein the one or more noise acquisition measurements are performed while a laser within the Raman analyzer is disabled; performing one or more Raman signal acquisition measurements to create a Raman spectrum, wherein the Raman signal acquisition measurement is performed while the laser within the Raman analyzer is enabled; averaging the one or more noise acquisition measurements to create an average background noise spectrum; and processing the average background noise spectrum and the Raman spectrum to create a clean Raman spectrum.
- the average background noise spectrum is subtracted from the Raman spectrum to create the clean Raman spectrum.
- more than one Raman signal acquisition measurement is performed and results from the more than one Raman signal acquisition measurements are averaged to create the Raman spectrum.
- at least one of the one or more noise acquisition measurements is performed before the Raman signal acquisition measurement.
- at least one of the one or more noise acquisition measurements is performed after the Raman signal acquisition measurement.
- more than one noise acquisition measurement is performed, and at least one of the noise acquisition measurements is performed before the Raman signal acquisition measurement and at least one of the noise acquisition measurements is performed after the Raman signal acquisition measurement.
- a system for measuring Raman scattering comprises an optical Raman probe sensor; a Raman analyzer, comprising an optical detector and a laser, the Raman analyzer in communication with the optical Raman probe sensor via a conduit; and a controller, wherein the controller: disables the laser and performs one or more noise acquisition measurements; enables the laser and performs one or more Raman signal acquisition measurements to generate a Raman spectrum; averages the one or more noise acquisition measurements to generate a noise spectrum; and processes the noise spectrum and the Raman spectrum to create a clean Raman spectrum.
- the controller subtracts the noise spectrum from the Raman spectrum to create the clean Raman spectrum.
- more than one Raman signal acquisition measurements are performed and the controller averages results from more than one Raman signal acquisition measurements to create the Raman spectrum.
- the controller performs at least one of the one or more noise acquisition measurements before the Raman signal acquisition measurement.
- the controller performs at least one of the one or more noise acquisition measurements after the Raman signal acquisition measurement.
- the controller performs more than one noise acquisition measurement, and at least one of the noise acquisition measurements is performed before the Raman signal acquisition measurement and at least one of the noise acquisition measurements is performed after the Raman signal acquisition measurement.
- Embodiments of the present disclosure describe the system and method for reducing stray light noise used in the generation of a Raman spectrum.
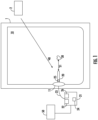
- FIG. 1 shows a representative bioreactor 1.
- the bioreactor 1 may be controlled by a bioreactor controller 2.
- the bioreactor controller 2 may control the various valves, spargers, impellers and other functions of the bioreactor 1.
- a bioreactor bag 10 is typically inserted in the bioreactor 1.
- the bioreactor bag 10 may have a plurality of ports to allow the introduction of various sensors, actuators, spargers or other mechanisms into the interior of the bioreactor bag 10.
- the optical Raman probe sensor 20 enters the interior of the bioreactor bag 10 through port 11.
- the optical Raman probe sensor 20 includes a tube with a sapphire window.
- the optical Raman probe sensor 20 also includes a connection thread that is compatible with bioreactors, such as PG13.5.
- the tube of the optical Raman probe sensor 20 has a maximum external diameter of 12 mm.
- the optical Raman probe sensor 20 is immersed in the material contained within the bioreactor bag 10.
- the optical Raman probe sensor 20 projects a laser beam along an optical axis 31.
- the laser beam passes through the tube, the sapphire window and into the bioreactor bag 10.
- the optical Raman probe sensor 20 also receives scattering light from a target 30, which may be a molecule or group of molecules. The scattering light travels along a collection field of view, and enters the tip of the optical Raman probe sensor 20.
- the optical Raman probe sensor 20 may include an optical assembly 25 of lenses and filters, to collect the optical signals from the target 30.
- the optical Raman probe sensor 20 is connected with a Raman analyzer 21, which is exterior to the bioreactor 1, using a conduit 23.
- the Raman analyzer 21 may include a laser 22, which generates a laser beam that travels through a conduit 23 to the optical Raman probe sensor 20. This conduit 23 may be a fiberoptic cable.
- the Raman analyzer 21 may include an optical detector 26, which may include a CCD or photodetector.
- the Raman analyzer 21 also includes a processing unit 24 to control the laser 22 and interpret the output from the optical detector 26.
- a controller 50 may be in communication with the Raman analyzer 21.
- the controller may include a processing unit and an associated memory device.
- the processing unit may be any suitable component, such as a microprocessor, embedded processor, an application specific circuit, a programmable circuit, a microcontroller, or another similar device.
- This memory device contains the instructions, which, when executed by the processing unit, enable the controller 50 to perform the functions described herein.
- This memory device may be a non-volatile memory, such as a FLASH ROM, an electrically erasable ROM or other suitable devices.
- the memory device may be a volatile memory, such as a RAM or DRAM, or any non-transitory computer readable storage media.
- the controller 50 may receive data from the Raman analyzer 21 and provide commands or instructions to the Raman analyzer 21. In the embodiment shown in FIG. 1 , the controller 50 is separate from the Raman analyzer 21. However, in other embodiments, these two components may be combined. In other embodiments, the controller 50 may transmit processed data to the bioreactor controller 2.
- ambient light 40 that enters the optical Raman probe sensor 20 may adversely the accuracy of the detection.
- This ambient light may be sunlight, moonlight, room lighting or other types of lighting.
- One way to address this is to quantify the amount of ambient light that enters the optical Raman probe sensor 20 and remove this background noise component from the Raman spectrum.
- the Raman analyzer 21 enables a laser 22 that is disposed in the Raman analyzer 21.
- Light from the laser 22 travels to the optical Raman probe sensor 20 via the conduit 23.
- the light from the laser 22 causes molecules in the optical axis 31 of the laser 22 to become excited, producing Rayleigh scattering, Stokes Raman scattering and anti-Stokes Raman scattering.
- the data from the optical Raman probe sensor 20 is then transmitted to the optical detector 26 disposed within the Raman analyzer 21, which may generate the Raman spectrum.
- This process may be referred to as a Raman signal acquisition measurement and the result of this process may be referred to as a Raman spectrum.
- the Raman analyzer 21 does not enable the laser 22.
- data from the optical Raman probe sensor 20 is transmitted to the Raman analyzer 21, which may create the Raman spectrum.
- any signal received by the optical detector 26 in the Raman analyzer 21 through the optical Raman probe sensor 20 is the result of background noise.
- this process is referred to as a background noise acquisition measurement and the result of this process may be referred to a background noise spectrum.
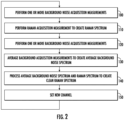
- FIG. 2 shows a flowchart illustrating the operation of the controller 50 and the Raman analyzer 21.
- one or more background noise acquisition measurements may be performed.
- the number of background noise acquisition measurements may be as large as 100. In other embodiments, a smaller number of background noise acquisition measurements may be performed. As noted above, this process is performed while the laser 22 is disabled.
- one or more Raman acquisition measurements are performed. As described above, this involves enabling the laser 22 and detecting the emitted optical signals using the optical detector 26.
- the Raman analyzer 21 may then create a Raman spectrum from the output of the optical detector 26.
- a plurality of Raman acquisition measurements are performed to create the Raman spectrum.
- 10 or more Raman acquisition measurements are performed.
- one or more background noise acquisition measurements may be performed after the Raman signal acquisition measurement is performed.
- the number of background noise acquisition measurements may be as large as 100. In other embodiments, a smaller number of background noise acquisition measurements may be performed. In other embodiments, no background noise acquisition measurements may be performed after Raman acquisition measurement.
- the background noise spectrums obtained from the background noise acquisition measurements may be averaged together and used to create an average background noise spectrum.
- background noise spectrums are generated from background noise acquisition measurements taken before the Raman signal acquisition measurement and background noise acquisition measurements taken after the Raman signal acquisition measurement.
- background noise acquisition measurements are only performed before or after the Raman signal acquisition measurement.
- one of Box 100 or Box 120 may be omitted.
- the average background noise spectrum and the Raman spectrum are processed to create a clean Raman spectrum, which has reduced background noise.
- the average background noise spectrum is subtracted from the Raman spectrum to create the clean Raman spectrum.
- other denoising algorithms may utilize the background noise spectrums and the Raman spectrum to create the clean Raman spectrum.
- the operations described in Boxes 130 and 140 may be performed using the controller 50 or a different controller.
- a different controller that is part of the same network as the Raman analyzer 21 may be used to perform these operations.
- the new channel is set, as shown in Box 150, and the sequence is repeated.
- the clean Raman spectrum can be used in many ways.
- the clean Raman spectrum may be processed and analyzed by mathematical advanced tools in order to determine the composition of the medium contained in the bioreactor bag 10.
- the optical Raman probe sensor 20 is disposed in glass bioreactors or in plastic bioreactor bags that are not fully opaque to ambient light.
- the ambient light may affect the results.
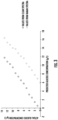
- concentrations of glucose from 0 to 13 g/L, were added to a bioreactor. At each concentration, Raman measurements were performed. A first set of the Raman measurements were performed with ambient light entering the bioreactor. These Raman measurements were then processed in the traditional manner, resulting in the data points in FIG. 3 labelled "Data from Raman Spectra". These data points are the predicted glucose concentration based on the Raman spectra.
Landscapes
- Physics & Mathematics (AREA)
- Spectroscopy & Molecular Physics (AREA)
- Health & Medical Sciences (AREA)
- General Physics & Mathematics (AREA)
- Chemical & Material Sciences (AREA)
- Life Sciences & Earth Sciences (AREA)
- Nuclear Medicine, Radiotherapy & Molecular Imaging (AREA)
- Analytical Chemistry (AREA)
- Biochemistry (AREA)
- General Health & Medical Sciences (AREA)
- Immunology (AREA)
- Pathology (AREA)
- Investigating, Analyzing Materials By Fluorescence Or Luminescence (AREA)
Abstract
Description
- Embodiments of the present disclosure relate to systems and methods to reduce stray light noise in optical Raman probe sensors.
- In many applications, such as bioprocessing applications, it is important to carefully and accurately monitor the composition of materials. For example, in a bioreactor, it may be important to monitor the amounts of various molecules, such as glucose, lactate, glutamine, ammonium and others.
- In many situations, this monitoring may be done using Raman spectroscopy. In Raman spectroscopy, a laser is used to direct light at a specific wavelength toward a target molecule. A photon reaches a molecule and excites it. Once the photon excites the molecule, there are several possible results. The most common is that the excitation is temporary and the molecule returns to its initial energy state. In this mode, the photon is scattered or redirected due to the interaction with the molecule. Further, the wavelength of the photon is unchanged since none of its energy was absorbed by the molecule. This phenomenon is referred to as Rayleigh scattering and does not provide any information about the molecule being analyzed.
- In another mode, the molecule is excited by the photon and moves to a different vibrational or rotational state. If that new state is a higher energy state than the original energy state, then the photon loses energy, which results in a lower frequency. In this way, the total amount of energy is conserved. This mode is referred to as Stokes Raman scattering.
- If that new state is a lower energy state than the original energy state, then the photon gains energy, which results in a higher frequency. This mode is referred to as anti-Stokes Raman scattering.
- The Stokes Raman scattering and anti-Stokes Raman scattering may be used to generate a spectrum. This spectrum is usually displayed having a horizontal axis corresponding to wavenumber, which is typically defined as:

- Importantly, each molecule, when excited, produces a unique spectrum that may be used to identify that molecule. Thus, the presence of different molecules may be determined using this approach.
- The percentage of Stokes-Raman scattering as compared to Rayleigh scattering is very low and highly sensitive to noise. For example, ambient light from the sun or interior lighting may alter the Raman spectrum.
- Therefore, it would be advantageous if there were a system and method for reducing the effect of stray light noise that enters an optical Raman probe sensor on the Raman spectrum.
- A system and method for quantifying the stray light that enters a Raman optical sensor and removes this from the Raman spectrum is disclosed. One or more background noise measurements are performed by the Raman analyzer wherein the laser is disabled during these background noise measurements. One or more traditional signal acquisition measurements are then performed. The results from the background noise measurements and the traditional signal acquisition measurement are then processed. This results in a clean spectrum, where the background noise has been significantly reduced. In some embodiments, background noise measurements are performed before and after the traditional signal acquisition measurement and these background noise measurements are averaged.
- According to one embodiment, a method of measuring Raman scattering is disclosed. The method comprises performing one or more noise acquisition measurements using a Raman analyzer, wherein the one or more noise acquisition measurements are performed while a laser within the Raman analyzer is disabled; performing one or more Raman signal acquisition measurements to create a Raman spectrum, wherein the Raman signal acquisition measurement is performed while the laser within the Raman analyzer is enabled; averaging the one or more noise acquisition measurements to create an average background noise spectrum; and processing the average background noise spectrum and the Raman spectrum to create a clean Raman spectrum. In some embodiments, the average background noise spectrum is subtracted from the Raman spectrum to create the clean Raman spectrum. In some embodiments, more than one Raman signal acquisition measurement is performed and results from the more than one Raman signal acquisition measurements are averaged to create the Raman spectrum. In some embodiments, at least one of the one or more noise acquisition measurements is performed before the Raman signal acquisition measurement. In some embodiments, at least one of the one or more noise acquisition measurements is performed after the Raman signal acquisition measurement. In some embodiments, more than one noise acquisition measurement is performed, and at least one of the noise acquisition measurements is performed before the Raman signal acquisition measurement and at least one of the noise acquisition measurements is performed after the Raman signal acquisition measurement.
- According to another embodiment, a system for measuring Raman scattering is disclosed. The system comprises an optical Raman probe sensor; a Raman analyzer, comprising an optical detector and a laser, the Raman analyzer in communication with the optical Raman probe sensor via a conduit; and a controller, wherein the controller: disables the laser and performs one or more noise acquisition measurements; enables the laser and performs one or more Raman signal acquisition measurements to generate a Raman spectrum; averages the one or more noise acquisition measurements to generate a noise spectrum; and processes the noise spectrum and the Raman spectrum to create a clean Raman spectrum. In some embodiments, the controller subtracts the noise spectrum from the Raman spectrum to create the clean Raman spectrum. In some embodiments, more than one Raman signal acquisition measurements are performed and the controller averages results from more than one Raman signal acquisition measurements to create the Raman spectrum. In some embodiments, the controller performs at least one of the one or more noise acquisition measurements before the Raman signal acquisition measurement. In some embodiments, the controller performs at least one of the one or more noise acquisition measurements after the Raman signal acquisition measurement. In some embodiments, the controller performs more than one noise acquisition measurement, and at least one of the noise acquisition measurements is performed before the Raman signal acquisition measurement and at least one of the noise acquisition measurements is performed after the Raman signal acquisition measurement.
- For a better understanding of the present disclosure, reference is made to the accompanying drawings, which are incorporated herein by reference and in which:
-
FIG. 1 illustrates a bioreactor that includes a Raman probe sensor; -
FIG. 2 shows the sequence of operations to create the clean Raman spectrum; and -
FIG. 3 shows the effect that the disclosed method has on the resulting Raman spectrum. - Embodiments of the present disclosure describe the system and method for reducing stray light noise used in the generation of a Raman spectrum.
- In many applications, such as bioprocessing applications, it is important to carefully and accurately monitor the materials within the bioreactor.
-
FIG. 1 shows a representative bioreactor 1. The bioreactor 1 may be controlled by abioreactor controller 2. Thebioreactor controller 2 may control the various valves, spargers, impellers and other functions of the bioreactor 1. - A
bioreactor bag 10 is typically inserted in the bioreactor 1. Thebioreactor bag 10 may have a plurality of ports to allow the introduction of various sensors, actuators, spargers or other mechanisms into the interior of thebioreactor bag 10. In this illustration, the opticalRaman probe sensor 20 enters the interior of thebioreactor bag 10 throughport 11. The opticalRaman probe sensor 20 includes a tube with a sapphire window. The optical Ramanprobe sensor 20 also includes a connection thread that is compatible with bioreactors, such as PG13.5. In some embodiments, the tube of the opticalRaman probe sensor 20 has a maximum external diameter of 12 mm. The opticalRaman probe sensor 20 is immersed in the material contained within thebioreactor bag 10. The opticalRaman probe sensor 20 projects a laser beam along anoptical axis 31. The laser beam passes through the tube, the sapphire window and into thebioreactor bag 10. The opticalRaman probe sensor 20 also receives scattering light from atarget 30, which may be a molecule or group of molecules. The scattering light travels along a collection field of view, and enters the tip of the opticalRaman probe sensor 20. The opticalRaman probe sensor 20 may include anoptical assembly 25 of lenses and filters, to collect the optical signals from thetarget 30. - The optical
Raman probe sensor 20 is connected with aRaman analyzer 21, which is exterior to the bioreactor 1, using aconduit 23. TheRaman analyzer 21 may include alaser 22, which generates a laser beam that travels through aconduit 23 to the opticalRaman probe sensor 20. Thisconduit 23 may be a fiberoptic cable. TheRaman analyzer 21 may include anoptical detector 26, which may include a CCD or photodetector. TheRaman analyzer 21 also includes aprocessing unit 24 to control thelaser 22 and interpret the output from theoptical detector 26. - A
controller 50 may be in communication with theRaman analyzer 21. The controller may include a processing unit and an associated memory device. The processing unit may be any suitable component, such as a microprocessor, embedded processor, an application specific circuit, a programmable circuit, a microcontroller, or another similar device. This memory device contains the instructions, which, when executed by the processing unit, enable thecontroller 50 to perform the functions described herein. This memory device may be a non-volatile memory, such as a FLASH ROM, an electrically erasable ROM or other suitable devices. In other embodiments, the memory device may be a volatile memory, such as a RAM or DRAM, or any non-transitory computer readable storage media. - The
controller 50 may receive data from theRaman analyzer 21 and provide commands or instructions to theRaman analyzer 21. In the embodiment shown inFIG. 1 , thecontroller 50 is separate from theRaman analyzer 21. However, in other embodiments, these two components may be combined. In other embodiments, thecontroller 50 may transmit processed data to thebioreactor controller 2. - As noted above, Stokes Raman scattering occurs much less frequently than Rayleigh scattering, and is consequently very sensitive to noise. Therefore,
ambient light 40 that enters the opticalRaman probe sensor 20 may adversely the accuracy of the detection. This ambient light may be sunlight, moonlight, room lighting or other types of lighting. One way to address this is to quantify the amount of ambient light that enters the opticalRaman probe sensor 20 and remove this background noise component from the Raman spectrum. - In normal operation, the
Raman analyzer 21 enables alaser 22 that is disposed in theRaman analyzer 21. Light from thelaser 22 travels to the opticalRaman probe sensor 20 via theconduit 23. The light from thelaser 22 causes molecules in theoptical axis 31 of thelaser 22 to become excited, producing Rayleigh scattering, Stokes Raman scattering and anti-Stokes Raman scattering. The light that is then received by theoptical assembly 25 of the opticalRaman probe sensor 20. The data from the opticalRaman probe sensor 20 is then transmitted to theoptical detector 26 disposed within theRaman analyzer 21, which may generate the Raman spectrum. This process may be referred to as a Raman signal acquisition measurement and the result of this process may be referred to as a Raman spectrum. - In another mode, the
Raman analyzer 21 does not enable thelaser 22. However, as before, data from the opticalRaman probe sensor 20 is transmitted to theRaman analyzer 21, which may create the Raman spectrum. In this mode, any signal received by theoptical detector 26 in theRaman analyzer 21 through the opticalRaman probe sensor 20 is the result of background noise. Thus, this process is referred to as a background noise acquisition measurement and the result of this process may be referred to a background noise spectrum. - These two processes may be combined to generate a clean Raman spectrum.
- Specifically,
FIG. 2 shows a flowchart illustrating the operation of thecontroller 50 and theRaman analyzer 21. First, as shown inBox 100, one or more background noise acquisition measurements may be performed. In certain embodiments, the number of background noise acquisition measurements may be as large as 100. In other embodiments, a smaller number of background noise acquisition measurements may be performed. As noted above, this process is performed while thelaser 22 is disabled. - Next, as shown in
Box 110, one or more Raman acquisition measurements are performed. As described above, this involves enabling thelaser 22 and detecting the emitted optical signals using theoptical detector 26. TheRaman analyzer 21 may then create a Raman spectrum from the output of theoptical detector 26. In some embodiments, a plurality of Raman acquisition measurements are performed to create the Raman spectrum. In some embodiments, 10 or more Raman acquisition measurements are performed. - Next, as shown in
Box 120, one or more background noise acquisition measurements may be performed after the Raman signal acquisition measurement is performed. In certain embodiments, as was done with the background noise acquisition measurement that were performed before the Raman signal acquisition measurement, the number of background noise acquisition measurements may be as large as 100. In other embodiments, a smaller number of background noise acquisition measurements may be performed. In other embodiments, no background noise acquisition measurements may be performed after Raman acquisition measurement. - Next, as shown in
Box 130, the background noise spectrums obtained from the background noise acquisition measurements may be averaged together and used to create an average background noise spectrum. In certain embodiments, background noise spectrums are generated from background noise acquisition measurements taken before the Raman signal acquisition measurement and background noise acquisition measurements taken after the Raman signal acquisition measurement. In other embodiments, background noise acquisition measurements are only performed before or after the Raman signal acquisition measurement. In these embodiments, one ofBox 100 orBox 120 may be omitted. - In
Box 140, the average background noise spectrum and the Raman spectrum are processed to create a clean Raman spectrum, which has reduced background noise. In certain embodiments, the average background noise spectrum is subtracted from the Raman spectrum to create the clean Raman spectrum. In other embodiments, other denoising algorithms may utilize the background noise spectrums and the Raman spectrum to create the clean Raman spectrum. - The operations described in
Boxes controller 50 or a different controller. For example, a different controller that is part of the same network as theRaman analyzer 21 may be used to perform these operations. - If there are multiple channels that are being analyzed, the new channel is set, as shown in
Box 150, and the sequence is repeated. - The clean Raman spectrum can be used in many ways. For example, the clean Raman spectrum may be processed and analyzed by mathematical advanced tools in order to determine the composition of the medium contained in the
bioreactor bag 10. - The embodiments described above in the present application may have many advantages.
- In many applications, the optical
Raman probe sensor 20 is disposed in glass bioreactors or in plastic bioreactor bags that are not fully opaque to ambient light. As a result, when Raman spectra are generated, the ambient light may affect the results. In one experiment, varying concentrations of glucose, from 0 to 13 g/L, were added to a bioreactor. At each concentration, Raman measurements were performed. A first set of the Raman measurements were performed with ambient light entering the bioreactor. These Raman measurements were then processed in the traditional manner, resulting in the data points inFIG. 3 labelled "Data from Raman Spectra". These data points are the predicted glucose concentration based on the Raman spectra. Note that there is a large offset between the actual glucose concentration and the glucose concentration predicted based on the Raman spectra. Additionally, at each concentration, the sequence shown inFIG. 2 was performed, resulting in clean Raman spectra. The glucose concentrations derived from these clean Raman spectra are represented by the data points labelled "Data from Clean Spectra". Note that the predicted glucose concentration based on the clean spectra is nearly identical to the actual glucose concentration. Thus, this technique is effective in reducing the effects of background noise. - The present disclosure is not to be limited in scope by the specific embodiments described herein. Indeed, other various embodiments of and modifications to the present disclosure, in addition to those described herein, will be apparent to those of ordinary skill in the art from the foregoing description and accompanying drawings. Thus, such other embodiments and modifications are intended to fall within the scope of the present disclosure. Furthermore, although the present disclosure has been described herein in the context of a particular implementation in a particular environment for a particular purpose, those of ordinary skill in the art will recognize that its usefulness is not limited thereto and that the present disclosure may be beneficially implemented in any number of environments for any number of purposes. Accordingly, the claims set forth below should be construed in view of the full breadth and spirit of the present disclosure as described herein.
Claims (12)
- A method of measuring Raman scattering, comprising:performing one or more noise acquisition measurements using a Raman analyzer, wherein the one or more noise acquisition measurements are performed while a laser within the Raman analyzer is disabled;performing one or more Raman signal acquisition measurements to create a Raman spectrum, wherein the Raman signal acquisition measurement is performed while the laser within the Raman analyzer is enabled;averaging the one or more noise acquisition measurements to create an average background noise spectrum; andprocessing the average background noise spectrum and the Raman spectrum to create a clean Raman spectrum.
- The method of claim 1, wherein the average background noise spectrum is subtracted from the Raman spectrum to crate the clean Raman spectrum.
- The method of claim 1, wherein more than one Raman signal acquisition measurement is performed and results from the more than one Raman signal acquisition measurements are averaged to create the Raman spectrum.
- The method of claim 1, wherein at least one of the one or more noise acquisition measurements is performed before the Raman signal acquisition measurement.
- The method of claim 1, wherein at least one of the one or more noise acquisition measurements is performed after the Raman signal acquisition measurement.
- The method of claim 1, wherein more than one noise acquisition measurement is performed, and at least one of the noise acquisition measurements is performed before the Raman signal acquisition measurement and at least one of the noise acquisition measurements is performed after the Raman signal acquisition measurement.
- A system for measuring Raman scattering, comprising:an optical Raman probe sensor;a Raman analyzer, comprising an optical detector and a laser, the Raman analyzer in communication with the optical Raman probe sensor via a conduit; anda controller, wherein the controller:disables the laser and performs one or more noise acquisition measurements;enables the laser and performs one or more Raman signal acquisition measurements to generate a Raman spectrum;averages the one or more noise acquisition measurements to generate a noise spectrum; andprocesses the noise spectrum and the Raman spectrum to create a clean Raman spectrum.
- The system of claim 7, wherein the controller subtracts the noise spectrum from the Raman spectrum to create the clean Raman spectrum.
- The system of claim 7, wherein more than one Raman signal acquisition measurements are performed and the controller averages results from the more than one Raman signal acquisition measurements to create the Raman spectrum.
- The system of claim 7, wherein the controller performs at least one of the one or more noise acquisition measurements before the Raman signal acquisition measurement.
- The system of claim 7, wherein the controller performs at least one of the one or more noise acquisition measurements after the Raman signal acquisition measurement.
- The system of claim 7, wherein the controller performs more than one noise acquisition measurement, and at least one of the noise acquisition measurements is performed before the Raman signal acquisition measurement and at least one of the noise acquisition measurements is performed after the Raman signal acquisition measurement.
Priority Applications (5)
| Application Number | Priority Date | Filing Date | Title |
|---|---|---|---|
| EP23305149.9A EP4411349A1 (en) | 2023-02-03 | 2023-02-03 | Reduction of stray light noise in optical raman probe sensors |
| JP2025544766A JP2026504418A (en) | 2023-02-03 | 2024-02-02 | Reduction of stray light noise in optical Raman probe sensors |
| PCT/EP2024/052590 WO2024161000A1 (en) | 2023-02-03 | 2024-02-02 | Reduction of stray light noise in optical raman probe sensors |
| KR1020257028332A KR20250136909A (en) | 2023-02-03 | 2024-02-02 | Reducing stray light noise in optical Raman probe sensors |
| CN202480010233.1A CN120641735A (en) | 2023-02-03 | 2024-02-02 | Reduction of stray light noise in optical Raman probe sensors |
Applications Claiming Priority (1)
| Application Number | Priority Date | Filing Date | Title |
|---|---|---|---|
| EP23305149.9A EP4411349A1 (en) | 2023-02-03 | 2023-02-03 | Reduction of stray light noise in optical raman probe sensors |
Publications (1)
| Publication Number | Publication Date |
|---|---|
| EP4411349A1 true EP4411349A1 (en) | 2024-08-07 |
Family
ID=85321316
Family Applications (1)
| Application Number | Title | Priority Date | Filing Date |
|---|---|---|---|
| EP23305149.9A Pending EP4411349A1 (en) | 2023-02-03 | 2023-02-03 | Reduction of stray light noise in optical raman probe sensors |
Country Status (5)
| Country | Link |
|---|---|
| EP (1) | EP4411349A1 (en) |
| JP (1) | JP2026504418A (en) |
| KR (1) | KR20250136909A (en) |
| CN (1) | CN120641735A (en) |
| WO (1) | WO2024161000A1 (en) |
Citations (6)
| Publication number | Priority date | Publication date | Assignee | Title |
|---|---|---|---|---|
| US8306780B2 (en) * | 2009-01-26 | 2012-11-06 | Exelis Inc. | Data quality and ancillary data checking for Raman sensor |
| US20140271372A1 (en) * | 2013-03-14 | 2014-09-18 | Memc Electronic Materials, Inc. | Gas decomposition reactor feedback control using raman spectrometry |
| WO2019080013A1 (en) * | 2017-10-25 | 2019-05-02 | 深圳达闼科技控股有限公司 | Raman detection method and apparatus, storage medium, and electronic device |
| US20200049627A1 (en) * | 2018-08-07 | 2020-02-13 | Synaptive Medical (Barbados) Inc. | Dynamic raman signal acquisition system, method and apparatus |
| RU2717160C1 (en) * | 2019-09-19 | 2020-03-18 | Российская Федерация, от имени которой выступает ФОНД ПЕРСПЕКТИВНЫХ ИССЛЕДОВАНИЙ | Method for determining proteins using giant raman scattering using cryosols of plasmon nanoparticles |
| WO2020148671A1 (en) | 2019-01-18 | 2020-07-23 | Ap2E | Resonant optical cavity system with optical feedback, suitable for detecting traces of gas by raman spectroscopy |
Family Cites Families (1)
| Publication number | Priority date | Publication date | Assignee | Title |
|---|---|---|---|---|
| JPS576561B2 (en) * | 1974-05-07 | 1982-02-05 |
-
2023
- 2023-02-03 EP EP23305149.9A patent/EP4411349A1/en active Pending
-
2024
- 2024-02-02 JP JP2025544766A patent/JP2026504418A/en active Pending
- 2024-02-02 CN CN202480010233.1A patent/CN120641735A/en active Pending
- 2024-02-02 WO PCT/EP2024/052590 patent/WO2024161000A1/en not_active Ceased
- 2024-02-02 KR KR1020257028332A patent/KR20250136909A/en active Pending
Patent Citations (7)
| Publication number | Priority date | Publication date | Assignee | Title |
|---|---|---|---|---|
| US8306780B2 (en) * | 2009-01-26 | 2012-11-06 | Exelis Inc. | Data quality and ancillary data checking for Raman sensor |
| US20140271372A1 (en) * | 2013-03-14 | 2014-09-18 | Memc Electronic Materials, Inc. | Gas decomposition reactor feedback control using raman spectrometry |
| WO2019080013A1 (en) * | 2017-10-25 | 2019-05-02 | 深圳达闼科技控股有限公司 | Raman detection method and apparatus, storage medium, and electronic device |
| US20200049627A1 (en) * | 2018-08-07 | 2020-02-13 | Synaptive Medical (Barbados) Inc. | Dynamic raman signal acquisition system, method and apparatus |
| WO2020148671A1 (en) | 2019-01-18 | 2020-07-23 | Ap2E | Resonant optical cavity system with optical feedback, suitable for detecting traces of gas by raman spectroscopy |
| US20220065778A1 (en) * | 2019-01-18 | 2022-03-03 | Ap2E | Resonant optical cavity system with optical feedback, suitable for detecting traces of gas by raman spectroscopy |
| RU2717160C1 (en) * | 2019-09-19 | 2020-03-18 | Российская Федерация, от имени которой выступает ФОНД ПЕРСПЕКТИВНЫХ ИССЛЕДОВАНИЙ | Method for determining proteins using giant raman scattering using cryosols of plasmon nanoparticles |
Also Published As
| Publication number | Publication date |
|---|---|
| KR20250136909A (en) | 2025-09-16 |
| JP2026504418A (en) | 2026-02-05 |
| CN120641735A (en) | 2025-09-12 |
| WO2024161000A1 (en) | 2024-08-08 |
Similar Documents
| Publication | Publication Date | Title |
|---|---|---|
| CN102187203B (en) | Spectrometer, spectrometry, and spectrometry program | |
| CN202869961U (en) | Mobile reference light path device for water quality analysis meter | |
| KR101281105B1 (en) | The method of quantitative analysis for uranium in an aqueous solution | |
| US10895526B2 (en) | Measuring apparatus for analyzing a measuring medium | |
| CN103630522A (en) | Method for correcting and calibrating three-dimensional fluorescence data of colored soluble organic matters | |
| US20150198534A1 (en) | Methods for measuring concentrations of analytes in turbid solutions by applying turbidity corrections to raman observations | |
| CN119555661B (en) | Raman spectroscopy fluorescence baseline correction method and device | |
| CN118671049B (en) | Boric acid solution concentration spectrum self-calibration measurement method and system using Raman spectroscopy | |
| JP5351742B2 (en) | Method for measuring dust concentration in gas and operation method for combustion equipment | |
| CN104316510B (en) | A kind of uranic Raman spectrum analysis method | |
| EP4411349A1 (en) | Reduction of stray light noise in optical raman probe sensors | |
| JP2001033388A (en) | Method and device for measuring concentration of chlorophyll a | |
| JP4048139B2 (en) | Concentration measuring device | |
| JP6308857B2 (en) | Component concentration measuring device and method | |
| US20250377306A1 (en) | Reduction of stray light noise in optical raman probe sensors | |
| Wolfbeis et al. | Optical fibre titrations. Part 3. Construction and performance of a fluorimetric acid-base titrator with a blue LED as a light source | |
| CN202837182U (en) | Atomic fluorescence spectrophotometer optical system | |
| DE102014014414B4 (en) | Method and arrangement for hydrogen sensing | |
| CN114965325B (en) | Chloride ion detection method and device and computer readable storage medium | |
| JP3448135B2 (en) | Optical axis moving type fluorescence photometer and measurement method | |
| Fu et al. | Ultrawide range of concentration measurement assisted by fluorescence intensity distribution imaging | |
| US20180164212A1 (en) | Method and measurement apparatus for measuring suspension | |
| EP1790971A1 (en) | Method for cross interference correction for correlation spectroscopy | |
| US20250035601A1 (en) | Chemical analysis process in gas phase | |
| FI128736B (en) | Method and measurement apparatus for measuring suspension |
Legal Events
| Date | Code | Title | Description |
|---|---|---|---|
| PUAI | Public reference made under article 153(3) epc to a published international application that has entered the european phase |
Free format text: ORIGINAL CODE: 0009012 |
|
| STAA | Information on the status of an ep patent application or granted ep patent |
Free format text: STATUS: THE APPLICATION HAS BEEN PUBLISHED |
|
| AK | Designated contracting states |
Kind code of ref document: A1 Designated state(s): AL AT BE BG CH CY CZ DE DK EE ES FI FR GB GR HR HU IE IS IT LI LT LU LV MC ME MK MT NL NO PL PT RO RS SE SI SK SM TR |
|
| STAA | Information on the status of an ep patent application or granted ep patent |
Free format text: STATUS: REQUEST FOR EXAMINATION WAS MADE |
|
| 17P | Request for examination filed |
Effective date: 20250205 |
|
| GRAP | Despatch of communication of intention to grant a patent |
Free format text: ORIGINAL CODE: EPIDOSNIGR1 |
|
| STAA | Information on the status of an ep patent application or granted ep patent |
Free format text: STATUS: GRANT OF PATENT IS INTENDED |
|
| TPAC | Observations filed by third parties |
Free format text: ORIGINAL CODE: EPIDOSNTIPA |
|
| INTG | Intention to grant announced |
Effective date: 20260123 |
|
| GRAJ | Information related to disapproval of communication of intention to grant by the applicant or resumption of examination proceedings by the epo deleted |
Free format text: ORIGINAL CODE: EPIDOSDIGR1 |
|
| STAA | Information on the status of an ep patent application or granted ep patent |
Free format text: STATUS: REQUEST FOR EXAMINATION WAS MADE |
|
| STAA | Information on the status of an ep patent application or granted ep patent |
Free format text: STATUS: EXAMINATION IS IN PROGRESS |
|
| INTC | Intention to grant announced (deleted) | ||
| 17Q | First examination report despatched |
Effective date: 20260312 |