EP4151335A1 - Breakout prediction method, method for operating continuous casting apparatus, and breakout prediction device - Google Patents
Breakout prediction method, method for operating continuous casting apparatus, and breakout prediction device Download PDFInfo
- Publication number
- EP4151335A1 EP4151335A1 EP21826706.0A EP21826706A EP4151335A1 EP 4151335 A1 EP4151335 A1 EP 4151335A1 EP 21826706 A EP21826706 A EP 21826706A EP 4151335 A1 EP4151335 A1 EP 4151335A1
- Authority
- EP
- European Patent Office
- Prior art keywords
- breakout
- mold
- degree
- deviation
- thermometers
- Prior art date
- Legal status (The legal status is an assumption and is not a legal conclusion. Google has not performed a legal analysis and makes no representation as to the accuracy of the status listed.)
- Granted
Links
Images








Classifications
-
- B—PERFORMING OPERATIONS; TRANSPORTING
- B22—CASTING; POWDER METALLURGY
- B22D—CASTING OF METALS; CASTING OF OTHER SUBSTANCES BY THE SAME PROCESSES OR DEVICES
- B22D11/00—Continuous casting of metals, i.e. casting in indefinite lengths
- B22D11/04—Continuous casting of metals, i.e. casting in indefinite lengths into open-ended moulds
-
- B—PERFORMING OPERATIONS; TRANSPORTING
- B22—CASTING; POWDER METALLURGY
- B22D—CASTING OF METALS; CASTING OF OTHER SUBSTANCES BY THE SAME PROCESSES OR DEVICES
- B22D11/00—Continuous casting of metals, i.e. casting in indefinite lengths
- B22D11/16—Controlling or regulating processes or operations
-
- B—PERFORMING OPERATIONS; TRANSPORTING
- B22—CASTING; POWDER METALLURGY
- B22D—CASTING OF METALS; CASTING OF OTHER SUBSTANCES BY THE SAME PROCESSES OR DEVICES
- B22D11/00—Continuous casting of metals, i.e. casting in indefinite lengths
- B22D11/16—Controlling or regulating processes or operations
- B22D11/18—Controlling or regulating processes or operations for pouring
-
- B—PERFORMING OPERATIONS; TRANSPORTING
- B22—CASTING; POWDER METALLURGY
- B22D—CASTING OF METALS; CASTING OF OTHER SUBSTANCES BY THE SAME PROCESSES OR DEVICES
- B22D11/00—Continuous casting of metals, i.e. casting in indefinite lengths
- B22D11/16—Controlling or regulating processes or operations
- B22D11/18—Controlling or regulating processes or operations for pouring
- B22D11/181—Controlling or regulating processes or operations for pouring responsive to molten metal level or slag level
- B22D11/182—Controlling or regulating processes or operations for pouring responsive to molten metal level or slag level by measuring temperature
-
- B—PERFORMING OPERATIONS; TRANSPORTING
- B22—CASTING; POWDER METALLURGY
- B22D—CASTING OF METALS; CASTING OF OTHER SUBSTANCES BY THE SAME PROCESSES OR DEVICES
- B22D2/00—Arrangement of indicating or measuring devices, e.g. for temperature or viscosity of the fused mass
Definitions
- the present invention relates to a breakout prediction method, an operation method of a continuous casting machine, and a breakout prediction device.
- a continuous casting process in which molten steel is poured into a mold, the poured molten steel is cooled by the mold in which a water-cooling pipe is embedded to solidify the surface of the molten steel, a semi-solidified solid product is withdrawn from the lower portion of the mold by a drawing roll, and finally a completely solidified solid product is produced by spray cooling.
- improvement in productivity by high-speed casting is increasingly required.
- an increase in the casting speed causes a decrease in the thickness of the solidified shell of the solid product at the lower end of the mold and an uneven distribution of the thickness of the solidified shell.
- a socalled breakout may occur in which the solidified shell is broken to cause leakage of steel when a portion having a small thickness of the solidified shell exits the mold.
- a breakout occurs, a long down time occurs, and thus productivity is significantly deteriorated. Therefore, there is a demand for a breakout prediction method capable of accurately predicting occurrence of breakout while performing high-speed casting.
- a breakout prediction method for a countermeasure against a sticking breakout in which a solidified shell is stuck by a mold, it is known that a breakout is predicted by detecting that the solidified shell is stuck by the mold from a change in temperature measured by a temperature measuring device such as a thermocouple embedded in a copper plate.
- Patent Literature 1 discloses a method of monitoring a sticking breakout in which a plurality of temperature measuring devices is horizontally arranged below a molten metal surface of a mold of a continuous casting machine to form a temperature measuring array, the temperature measuring arrays are arranged in a plurality of stages in a casting direction, the temperature measuring devices arranged in the upper-stage temperature measuring array and the temperature measuring devices arranged in the lower-stage temperature measuring array, among any two stages of the plurality of stages, are arranged on the same vertical line, the measured values of the temperature measuring devices are transmitted to an arithmetic device, and it is determined that the sticking breakout occurs when both of the following conditions 1 and 2 are satisfied.
- Condition 1 In the upper-stage temperature measuring array and/or the lower-stage temperature measuring array, the measured values of the temperature measuring devices adjacent to each other increase and further decrease.
- Condition 2 The measured value of the lower-stage temperature measuring device arranged on the vertical line is higher than the measured value of the upper-stage temperature measuring device.
- Patent Literature 2 discloses a breakout prediction method including: a step of detecting a temperature of a mold by a plurality of thermometers embedded in the mold of a continuous casting machine and having sensitivity coefficients obtained; a step of defining a vector having a sensitivity coefficient of each of the plurality of thermometers as a component as a sensitivity coefficient vector and a vector having a detection value of each of the plurality of thermometers as a component as a detection temperature vector; a step of calculating the component of the detected temperature vector in a direction orthogonal to the sensitivity coefficient vector as a degree of deviation; a step of giving a first score to a thermometer in which the component of the degree of deviation exceeds a threshold; a step of defining a score vector by thermometer in which the first score is defined as a score by thermometer, and presence or absence of a score of each of the plurality of thermometers is defined as a component; a step of giving a second score to a central thermometer when scores are given to
- the method of monitoring the sticking breakout disclosed in Patent Literature 1 is configured to obtain the temperature change amount with respect to the time-series data of the detected temperature. Therefore, even if the detected temperature has changed due to a factor other than a sign of breakout, such as a change in the casting speed, there is a possibility of erroneous detection that a breakout may occur.
- the breakout prediction method disclosed in Patent Literature 2 defines the temperature measurement value itself as a detected temperature vector to calculate the degree of deviation. Therefore, at the time of non-steady operation such as changing the width of a solid product during operation, the degree of deviation increases due to a change in, for example, the casting width of molten steel with respect to the mold, and there is a possibility of erroneous detection that a breakout may occur.
- the present invention has been made in view of the above problems, and an object of the present invention is to provide a breakout prediction method, an operation method of a continuous casting machine, and a breakout prediction device capable of accurately predicting a breakout.
- a breakout prediction method includes: a step of inputting a dimension of a solid product withdrawn from a mold in a continuous casting machine; a step of detecting a temperature of the mold by a plurality of thermometers embedded in the mold; a step of executing interpolation processing on the detected temperatures detected by the plurality of thermometers according to the dimension of the solid product; a step of calculating, based on the temperatures calculated by executing the interpolation processing, a component in a direction orthogonal to an influence coefficient vector obtained by principal component analysis as a degree of deviation from during a normal operation in which a breakout has not occurred; and a step of predicting a breakout based on the degree of deviation.
- the step of executing the interpolation processing includes calculating a temperature by executing the interpolation processing on the detected temperature of each of the plurality of thermometers, at a center point of each of a plurality of calculation cells equally divided according to the dimension of the solid product.
- number of the calculation cells is kept constant even when the dimension of the solid product is changed.
- the step of calculating as the degree of deviation includes obtaining an average value of a temperature of each of the plurality of calculation cells located at a same distance from an upper end of the mold in a casting direction of a molten steel with respect to the mold, obtaining a difference from the average value for the temperature of each of the plurality of calculation cells, and calculating the degree of deviation from the obtained difference using the influence coefficient vector.
- the step of predicting the breakout includes predicting a breakout based on an adjacency of the calculation cell in which an absolute value of the degree of deviation exceeds a preset second threshold when a time change rate of the degree of deviation exceeds a preset first threshold.
- the step of predicting the breakout includes a step of giving a first score to the calculation cell in which the degree of deviation exceeds the second threshold, a step of calculating a second score from the first score based on the adjacency of the calculation cell to which the first score is given, and a step of predicting a breakout based on the second score.
- the influence coefficient vector is a sensitivity coefficient vector having a sensitivity coefficient of each of the plurality of thermometers as a component.
- an operation method of a continuous casting machine includes reducing a casting speed at which molten steel is poured into the mold when a breakout is predicted based on the breakout prediction method according to the above-described invention.
- a breakout prediction device includes: an input unit configured to input a dimension of a solid product withdrawn from a mold in a continuous casting machine; a plurality of thermometers embedded in the mold and configured to detect a temperature of the mold; an interpolation processing execution unit configured to execute interpolation processing on the detected temperatures detected by the plurality of thermometers according to the dimension of the solid product; a degree-of-deviation calculation unit configured to calculate, based on the temperatures calculated by executing the interpolation processing, a component in a direction orthogonal to an influence coefficient vector obtained by principal component analysis as a degree of deviation from during a normal operation in which a breakout has not occurred; and a breakout prediction unit configured to predict a breakout based on the degree of deviation.
- the breakout prediction method, the operation method of the continuous casting machine, and the breakout prediction device according to the present invention have an effect capable of accurately predicting a breakout.
- Embodiments of a breakout prediction method, an operation method of a continuous casting machine, and a breakout prediction device according to the present invention will be described below. Note that the present invention is not limited by the embodiments.
- FIG. 1 is a schematic diagram illustrating a schematic configuration of a continuous casting machine 1 according to the embodiment.
- the continuous casting machine 1 according to the embodiment includes a tundish 3 into which molten steel 2 is poured, a copper mold 5 that cools the molten steel 2 poured from the tundish 3 through an immersion nozzle 4, a plurality of solid product support rolls 7 that conveys a semi-solidified solid product 6 withdrawn from the mold 5, and a determination unit 20 that determines a sign phenomenon of breakout from a detected temperature of a thermometer 8 embedded in the mold 5.
- the present embodiment uses a thermocouple as the thermometer 8 but is not limited thereto.
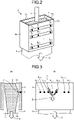
- FIG. 2 is a perspective view illustrating a schematic configuration of the mold 5 in which thermometers 8 1,1 to 8 m,n are embedded, in the continuous casting machine 1 according to the embodiment.
- the mold 5 includes a pair of long-side cooling plates 5a and a pair of short-side cooling plates 5b, and is formed in a substantially rectangular tubular shape penetrating in the vertical direction.
- a cooling water channel not illustrated is formed along the inner wall surface within the long-side cooling plate 5a and the short-side cooling plate 5b, and cooling water is circulated in the cooling water channel to cool the molten steel 2.
- thermometers 8 1,1 to 8 m,n are embedded within the long-side cooling plate 5a of the mold 5 at a predetermined depth from the outer wall surface of the long-side cooling plate 5a. Note that, in the following description, when the thermometers 8 1,1 to 8 m,n are not particularly distinguished from each other, the thermometers are also referred to simply as thermometers 8.
- the thermometers 8 1,1 to 8 m,n are arranged in three or more stages in a casting direction A, and firststage thermometers 8 1,1 to 8 1,n , second-stage thermometers 8 2,1 to 8 2,n , and n-th-stage thermometers 8 m,1 to 8 m,n are separately embedded on the same plane.
- the casting direction A is a direction in which the molten steel 2 is poured into the mold 5 from the tundish 3 through the immersion nozzle 4, and is the same direction as a direction in which the solid product 6 is withdrawn from the lower end of the mold 5.
- thermometers 8 may be arranged on at least one of the pair of long-side cooling plates 5a, at least one of the pair of short-side cooling plates 5b, or all of the pair of long-side cooling plates 5a and the pair of short-side cooling plates 5b among the pair of long-side cooling plates 5a and the pair of short-side cooling plates 5b of the mold 5.
- thermometers are arranged on all of the pair of long-side cooling plates 5a and the pair of short-side cooling plates 5b.
- the thermometers 8 can also be arranged in the mold 5 in a multi-stage arrangement of more than three stages or in a single-stage arrangement in the casting direction A.
- FIG. 3(a) is a diagram for explaining the state of the molten steel 2 and a solidified shell 10 in the mold 5 in a sign phenomenon of breakout.
- FIG. 3(b) is a diagram illustrating a state of a fractured portion 11 of the solidified shell 10 in the sign phenomenon of breakout.
- thermometers 8 m',1 to 8 m',n the detected temperatures of the thermometers 8 m',1 to 8 m',n become high. Then solidified shell 10 above the fractured portion 11 is then stuck by the mold 5 and continues to be cooled, and thus the detected temperatures of the thermometers 8 m',1 to 8 m',n monotonically decrease.
- the fractured portion 11 since the fractured portion 11 is propagated not only in the downward direction but also in the lateral direction, the fractured portion 11 expands in a V-shape as illustrated in FIG. 3(b) .
- the passage through the fractured portion 11 does not occur at the positions of the thermometers 8 m',1 to 8 m',n , and thus only a decrease in the detected temperatures of the thermometers 8 m',1 to 8 m',n is observed.
- FIG. 4(a) is the temperature distribution of the mold 5 at a moment when a seizure has occurred.
- FIG. 4(b) is a diagram illustrating the temperature distribution of the mold 5 after 10 seconds from the moment when a seizure has occurred. From the temperature distributions of the mold 5 illustrated in FIGS. 4(a) and 4(b) , respectively, it can be seen that the V-shaped high temperature portion is propagated in the downward direction and the lateral direction.
- the change in the temperature distribution of the mold 5 as described above can also be caused by a decrease in the casting speed, fluctuations in the molten metal surface level, and a change in the width of the solid product 6, for example.
- the mold temperature located at the same distance from the upper end of the mold 5 changes synchronously.
- the fluctuation of the mold temperature measured by the thermometers 8 positioned in the vicinity of both ends of the width of the solid product 6 becomes large.
- the evaluation value of the non-interlocking property of the estimated temperature at a plurality of locations where the interpolation processing has been executed according to the width of the solid product 6 is calculated, and the change rate of the evaluation value and the adjacency of the temperature change at the changed location are determined, thereby improving the prediction accuracy of the breakout.
- FIG. 5 is a flowchart illustrating an example of a procedure of the breakout prediction method according to the embodiment.
- the breakout prediction method illustrated in the flowchart is performed by the determination unit 20 illustrated in FIG. 1 .
- the determination unit 20 has at least the functions of an interpolation processing execution means, a degree-of-deviation calculation means, and a breakout prediction means in the present invention. Details of each step in FIG. 5 will be described below as appropriate.
- the determination unit 20 calculates in advance sensitivity coefficients for the thermometers 8 1,1 to 8 m,n during normal operation (hereinafter also referred to as a normal state) in which a breakout has not occurred (step S1).
- This sensitivity coefficient is calculated by using a temperature obtained by interpolation processing with a normal temperature actually measured by a thermometer as a reference such that the sensitivity coefficient can cope with a casting having a different width or failure of the thermometer as will be described below. Note that, since there is a possibility that the sensitivity coefficient changes due to a change in the surface state of the mold 5 through the operation, it is preferable to update the sensitivity coefficient at an appropriate time such as between castings.
- the determination unit 20 then continuously detects temperatures T 1,1 to T m,n of the mold 5 using the thermometers 8 1,1 to 8 m,n (step S2).
- the determination unit 20 then executes the interpolation processing of the temperature of the mold 5 on the detected temperatures of the thermometers 8 1,1 to 8 m,n , at the center points of calculation cells 12 1,1 to 12 k,p equally divided according to the dimensions of the solid product 6 to be withdrawn from the mold 5 (e.g., widths of the solid product 6 and thicknesses of the solid product 6) input by an operator through an input device not illustrated which is an input means such as a personal computer provided in the continuous casting machine 1 (step S3).
- Average bias removal is then performed on the temperatures T' 1,1 to T' k,p of the mold 5 obtained by the interpolation processing.
- the average values are obtained for the temperatures T' 1,1 to T' 1,p of the calculation cells 12 1,1 to 12 1,p and the temperatures T' 2,1 to T' 2,p and T' k,1 to T' k,p of the calculation cells 12 2,1 to 12 2,p , respectively, at the same distance from the upper end of the mold 5.
- step S4 The difference from the average value of the temperatures T' 1,1 to T' 1,p of the calculation cells 12 1,1 to 12 1,p and the difference from the average value of the temperatures T' 2,1 to T' 2,p of the calculation cells 12 2,1 to 12 2,p are then obtained (step S4).
- the determination unit 20 then calculates the degree of deviation from the difference from the obtained average value using the sensitivity coefficient (step S5).
- the sensitivity coefficient vector which is a vector having the sensitivity coefficients, which are influence coefficients, as components, represents a direction indicating an average behavior of the temperatures of the calculation cells obtained by the above interpolation processing for the thermometers 8 1,1 to 8 m,n during normal operation.
- a component parallel to the direction of the sensitivity coefficient vector is a component of the average behavior
- a component in a direction orthogonal to the direction of the sensitivity coefficient vector is a component of the degree of deviation from the average behavior.
- the determination unit 20 determines a breakout prediction based on the adjacent state of the calculation cell 12 whose absolute degree of deviation exceeds the threshold X (step S6).
- the time change rate of the degree of deviation represents a rate (degree) at which the absolute value of the degree of deviation changes in a predetermined time (per unit time). If it is determined that the breakout is not predicted (No in step S6), the determination unit 20 proceeds to step S2. On the other hand, if it is determined that the breakout has been predicted (Yes in step S6), the determination unit 20 automatically reduces the casting speed to a predetermined speed (step S7).
- the determination unit 20 predicts the breakout, the casting speed is sufficiently reduced, so that the solidified shell 12 having a sufficient thickness is formed in the mold 5 even at the location where a seizure occurs, and thus the breakout can be avoided.
- the determination unit 20 reduces the casting speed to a predetermined value, and then returns the processing routine.
- FIG. 6 is a diagram illustrating a correlation between the detected temperatures of the thermometers 8 1,1 to 8 m,n in a normal state in which a breakout does not occur.
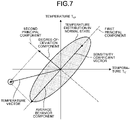
- FIG. 7 is a diagram illustrating a correlation between the detected temperatures of the thermometers 8 1,1 to 8 m,n when a sign such as seizure leading to breakout occurs. Note that, for the sake of simplicity, FIGS. 6 and 7 illustrate the case of two thermometers 8 i,j1 and 8 i,j2 located at the same distance from the upper end of the mold 5 in the casting direction A.
- the detected temperatures of the thermometer 8 i,j1 and the thermometer 8 i,j2 in the normal state are distributed in a range close to a broken line (a line inclined at 45 degrees to the right in the example illustrated in FIG. 6 ) indicating the direction of a sensitivity coefficient vector which is a vector having a sensitivity coefficient as a component.
- a broken line a line inclined at 45 degrees to the right in the example illustrated in FIG. 6
- the detected temperature T i,j2 detected by the thermometer B i,j2 also increases.
- the detected temperature T i,j1 detected by the thermometer 8 i,j1 decreases
- the detected temperature T i,j2 detected by the thermometer B i,j2 also decreases.
- thermometer 8 i,j1 and the thermometer 8 i,j2 have a correlation in the normal state is as follows. For example, when the casting speed of the continuous casting machine 1 is higher, the solid product 6 is withdrawn before the solidified shell 10 sufficiently grows, and thus the solidified shell 10 becomes thinner. As a result, the thermal resistance decreases and the temperature of the molten steel 2 is easily transmitted to the thermometer 8 i,j1 and the thermometer B i,j2 .
- the solidified shell 10 is withdrawn after the solidified shell sufficiently grows, so that the solidified shell 10 becomes thicker and the thermal resistance increases, and the temperature of the molten steel 2 is hardly transmitted to the thermometer 8 i,j1 and the thermometer B i,j2 . Since these tendencies are common to all the thermometers 8 1,1 to 8 m,n , the detected temperatures of the thermometers 8 1,1 to 8 m,n in the normal state are distributed in a range close to the broken line indicating the direction of the sensitivity coefficient vector in a shape close to an ellipse.
- thermometers 8 1,1 to 8 m,n are generally not constant because how easily the temperature of the molten steel 2 is transmitted differs for each of the thermometers 8 1,1 to 8 m,n . Therefore, the inclination of the sensitivity coefficient vector illustrated in FIG. 6 may vary depending on the installation locations of the thermometers 8 1,1 to 8 m,n with respect to the mold 5, variations in construction, and others.
- thermometer 8 i,j1 and the thermometer 8 i,j2 have a correlation in the normal state can be considered to be, in addition to the above, the flow of the molten steel 2 in the mold 5, the fluctuations of the molten metal surface, and others.
- most of the sensitivity coefficients of the thermometers 8 1,1 to 8 m,n are contributed by the overall temperature change of the mold 5 accompanying the increase and decrease of the above casting speed. Therefore, in order to take more various phenomena of the continuous casting process into consideration in the sensitivity coefficient, it is necessary to remove the overall temperature change of the mold 5 accompanying the increase and decrease of the casting speed as the average bias.
- thermometers 8 1,1 to 8 m,n there is a method of obtaining an average value T ave of all of the detected temperatures T 1,1 to T m,n detected by the thermometers 8 1,1 to 8 m,n and obtaining a difference between each of the detected temperatures T 1,1 to T m,n and the average value T ave .
- thermometers 8 1,1 to 8 i,n located at the same distance from the upper end of the mold 5 in the casting direction A, and obtaining the difference between each of the detected temperatures T i,1 to T i,n and the average value T i,ave for each thermometer 8 located at the same distance.
- a method of using principal component analysis can be considered.
- a method of experimentally obtaining how easily the temperature of the molten steel 2 in each of the thermometers 8 1,1 to 8 m,n is transmitted when the overall temperature changes due to fluctuations in the molten metal surface or others can be considered.
- the detected temperatures of the thermometers 8 i,j1 and B i,j2 at the time of occurrence of a sign such as seizure leading to breakout are distributed at positions away from a broken line (a line inclined at 45 degrees to the right in the example illustrated in FIG. 7 ) indicating the direction of the sensitivity coefficient vector.
- thermometer 8 i,j1 decreases at the thermometer 8 i,j1 close to the position of the fractured portion 11 of the solidified shell 10, and a detected temperature T i,j1+1 and a detected temperature T i,j1-1 of a thermometer 8 i,ji+1 and a thermometer 8 i,j1-1 , which are located on both sides of the thermometer 8 i,j1 , decrease after a short delay.
- the occurrence of breakout can be determined based on the degree of deviation of the detected temperatures T 1,1 to T m,n of the thermometers 8 1,1 to 8 m,n from the broken line indicating the direction of the sensitivity coefficient vector.
- the components in the direction orthogonal to the sensitivity coefficient vector in the temperature vector which is a vector having the detected temperatures T 1,1 to T m,n of the thermometers 8 1,1 to 8 m,n as components are calculated as the degree of deviation, and the occurrence of breakout can be determined based on the degree of deviation.
- the degree-of-deviation component which is components in a direction orthogonal to the sensitivity coefficient vector is calculated in the temperature vectors having the detected temperatures of the thermometer 8 i,j1 and the thermometer 8 i,j2 as components.
- the occurrence of breakout is determined based on the calculated degree-of-deviation component.
- the direction of the sensitivity coefficient vector is the same as the direction of the first principal component of the temperature distribution in the normal state
- the direction orthogonal to the direction of the sensitivity coefficient vector is the same as the direction of the second principal component of the temperature distribution in the normal state.
- FIG. 8(a) is a diagram illustrating a relationship between detected temperatures T m1,n1 to T m1,n1+18 of thermometers 8 m1,n1 to 8 m1,n1+18 and temperatures T' m1,n1 to T' m1,n1+18 at which the interpolation processing has been executed in a case where the width (casting width) of the solid product 6 withdrawn from the lower end of the mold 5 is wide.
- FIG. 8(a) is a diagram illustrating a relationship between detected temperatures T m1,n1 to T m1,n1+18 of thermometers 8 m1,n1 to 8 m1,n1+18 and temperatures T' m1,n1 to T' m1,n1+18 at which the interpolation processing has been executed in a case where the width (casting width) of the solid product 6 withdrawn from the lower end of the mold 5 is wide.
- thermometers 8 m1,n1 to 8 m1,n1+18 are arranged at positions at the same distance from the upper end of the mold 5 in the casting direction A.
- the temperatures T' m1,n1 to T' m1,n1+18 are estimated temperatures of the mold 5 calculated by executing interpolation processing on the detected temperatures T m1,n1 to T m1,n1+18 of the thermometers 8 m1,n1 to 8 m1,n1+18 , at the center points of the calculation cells 12 m1,n1 to 12 m1,n1+18 equally divided according to the widths of the solid product 6. Note that an interpolation processing method will be described below.
- thermometer 8 m1,n1+7 the temperature detection of a thermometer 8 m1,n1+7 , a thermometer 8 m1,n1+11 , a thermometer 8 m1,n1+12 , and a thermometer 8 m1,n1+16 that detect a detected temperature T m1,n1+7 , a detected temperature T m1,n1+11 , a detected temperature T m1,n1+12 , and a detected temperature T m1,n1+16 , respectively, is defective.
- thermometer 8 Even in the case of including the thermometer 8 whose temperature detection is defective as described above, if the detected temperatures T m1,n1 to T m1,n1+18 themselves are used for prediction of breakout, there is a possibility that the detected temperatures deviate from the sensitivity coefficient vector and are erroneously detected as a sign of breakout occurrence. On the other hand, at the temperatures T' m1,n1 to T' m1,n1+18 at which the interpolation processing has been executed, even when the thermometer 8 whose temperature detection is defective is included, the risk of erroneous detection of occurrence of a sign leading to breakout can be reduced by using the estimated temperature of the mold 5 in the section where the temperature detection is defective.
- FIG. 9 is a diagram illustrating a positional relationship between the thermometers 8 i,1 to 8 i,j and calculation cells 12 i,1 to 12 i,j located at the same distance from the upper end of the mold 5.
- the calculation cells 12 i,1 to 12 i,j are obtained by equally dividing a section (a section sandwiched between the pair of short-side cooling plates 5b in the width direction of the mold 5) corresponding to the width of the solid product 6 in the long-side cooling plate 5a by a constant number of cells with respect to the thermometers 8 i,1 to 8 i,j located at the same distance from the upper end of the mold 5 in the long-side cooling plate 5a of the mold 5.
- the detected temperatures detected by the thermometers 8 i,1 to 8 i,j are linearly interpolated to calculate the estimated temperature of the mold 5 (long-side cooling plate 5a) at the position of the center point of each of the calculation cells 12 i,1 to 12 i,j .
- the number of calculation cells 12 for the interpolation processing may be the same as or different from the number of thermometers 8 in the vertical and horizontal directions, but is constant regardless of fluctuations in the casting width during casting.
- the interpolation processing described above can be applied to a case where the sensitivity coefficient vector is obtained by using the principal component analysis and a case where the degree of deviation is calculated.
- the principal component analysis is performed using the temperature subjected to interpolation processing instead of the actual detected temperature.
- the temperature vector having the same number of points can be used, so that the principal component analysis can be performed including data having different widths.
- the degree of deviation can also be calculated using the influence coefficient vector calculated based on the temperature obtained by interpolating the detected temperature. Therefore, it is possible to predict the breakout of different solid product widths based on a unified standard. Further, even when the solid product width is changed during casting, it is also possible to reduce the risk of erroneous detection related to the occurrence of a sign leading to breakout.
- FIG. 10(a) is a diagram illustrating a time-series change in the absolute value of the degree of deviation in a case where a seizure has occurred.
- FIG. 10(b) is a diagram illustrating a time-series change in the time change rate of the degree of deviation in the case where a seizure has occurred.
- FIG. 11(a) is a diagram illustrating a time-series change in the absolute value of the degree of deviation in a case where a seizure has not occurred.
- FIG. 11(b) is a diagram illustrating a time-series change in the time change rate of the degree of deviation in the case where a seizure has not occurred.
- the absolute value of the degree of deviation rapidly increases at a certain time during operation.
- the absolute value of the degree of deviation is constantly large during operation.
- the sensitivity coefficient calculated based on the temperature subjected to interpolation processing from the detected temperatures of the thermometers 8 1,1 to 8 m,n deviates from a value previously determined due to a factor such as a change in the surface shape of the mold 5, there is a possibility that the absolute value of the degree of deviation is constantly large even if an abnormality such as seizure does not occur as illustrated in FIG. 11(a) . Therefore, as illustrated in FIGS. 10(a) and 11(a) , when a single threshold X is provided for the absolute value of the degree of deviation, it is difficult to discriminate the presence or absence of the occurrence of seizure which is a sign leading to breakout.
- FIG. 10(a) A seizure, which is a sign leading to breakout, suddenly occurs, and the fractured portion 11 of the solidified shell 10 is propagated in the downward and lateral directions of the mold 5. Therefore, as illustrated in FIG. 10(a) , the absolute value of the degree of deviation when a seizure occurs rapidly increases at a certain time during operation. Therefore, as illustrated in FIG. 10(b) , the time change rate of the degree of deviation rapidly increases.
- FIG. 11(a) even if an abnormality such as seizure does not occur, when the absolute value of the degree of deviation is constantly large during operation, the time change rate of the degree of deviation does not rapidly increase as illustrated in FIG. 11(b) . Therefore, as illustrated in FIGS. 10(b) and 11(b) , providing a single threshold Y for the time change rate of the degree of deviation facilitates to discriminate the presence or absence of the occurrence of seizure which is a sign leading to breakout.
- FIG. 12 is a diagram illustrating an example of a determination method of adjacency in a case where the calculation cell 12 that executes the interpolation processing is arranged in one stage (calculation cells 12 1,1 to 12 1,p ).
- FIG. 12 illustrates an example of a determination method in the lateral adjacency of the calculation cells 12 1,1 to 12 1,p located at the same distance from the upper end of the mold 5 in the casting direction A. Note that, in the determination method of adjacency the present example illustrated in FIG. 12 , it is assumed that the time change rate of the degree of deviation exceeds the threshold Y.
- one point is given as a score by calculation cell, which is a first score, to the calculation cell 12 in which the absolute value of the degree of deviation exceeds the preset threshold X as described above, among the calculation cells 12 1,1 to 12 1,p .
- zero point is given as a score by calculation cell to the calculation cell 12 in which the absolute value of the degree of deviation does not exceed the threshold X, among the calculation cells 12 1,1 to 12 1,p .
- a vector obtained by shifting the score by calculation cell to one preceding calculation cell 12 is defined as a forward shift vector
- a vector obtained by shifting the score by calculation cell to one succeeding calculation cell 12 is defined as a backward shift vector.
- a vector obtained by multiplying the elements of the forward shift vector and the backward shift vector is defined as an adjacent product vector.
- the absolute values of the degrees of deviation of the calculation cell 12 1,3 , the calculation cell 12 1,4 , and the calculation cell 12 1,5 among the calculation cells 12 1,1 to 12 1,p exceed the set threshold X, so that one points are given to the calculation cell 12 1,3 , the calculation cell 12 1,4 , and the calculation cell 12 1,5 as a score by calculation cell (first score) .
- zero points are given to the other calculation cell 12 1,1 , the calculation cell 12 1,2 , and the calculation cells 12 1,6 to 12 1,p as a score by calculation cell (first score).
- a vector in which these calculation cell scores (first scores) are arranged is (0, 0, 1, 1, 1, 1, 0,..., 0, 0, 0).
- the forward shift belt is (0, 1, 1, 1, 0, 0,..., 0, 0, 0) and the backward shift vector is (0, 0, 0, 1, 1, 1,..., 0, 0, 0).
- An adjacent product vector obtained by multiplying the elements of the forward shift vector and the backward shift vector is (0, 0, 0, 1, 0, 0,..., 0, 0, 0). Therefore, it can be seen that, when there are three adjacent calculation cells 12 that exceed the threshold X, the score (second score) of the central calculation cell 12 1,4 of the three adjacent calculation cells 12 1,3 , 12 1,4 , and 12 1,5 that exceeds the threshold X is one point, and the scores (second scores) of the other calculation cells 12 1,1 to 12 1,3 and calculation cells 12 1,5 to 12 1,p are zero points.
- the determination method of adjacency described with reference to FIG. 12 can determine that a sign such as seizure leading to breakout occurs if any element of the adjacent product vector is 1.
- a vector obtained by shifting the score by calculation cell to one preceding calculation cell 12 is defined as a forward shift vector and a vector obtained by shifting the score by calculation cell to one succeeding calculation cell 12 is defined as a backward shift vector, thereby obtaining the adjacent product vector of the three adjacent calculation cells 12, but the determination method is not limited thereto.
- a vector obtained by shifting the score by calculation cell to one or more preceding calculation cell 12 may be defined as a forward shift vector and a vector obtained by shifting the score by calculation cell to one or more succeeding calculation cell 12 may be defined as a backward shift vector.
- the number by which the score by calculation cell is shifted to a succeeding calculation cell 12 to obtain a backward shift vector should be the same as the number by which the score by calculation cell is shifted to a preceding calculation cell 12 to obtain a forward shift vector.
- a vector obtained by multiplying the elements of the forward shift vector and the backward shift vector obtained as described above may be defined as an adjacent product vector.
- a vector obtained by shifting the score by calculation cell to three preceding calculation cell 12 is defined as a forward shift vector
- a vector obtained by shifting the score by calculation cell to three succeeding calculation cell 12 is defined as a backward shift vector. It is determined that a sign such as seizure leading to breakout occurs, if any element of the adjacent product vector is 1 by multiplying the elements of the forward shift vector and the backward shift vector and calculating an adjacent product vector of seven adjacent calculation cells 12 to obtain a second score. Thus, the occurrence of a sign leading to breakout can be determined with higher accuracy, and thus the breakout can be predicted with high accuracy.
- the above determination method of adjacency can be expanded.
- FIG. 13 is a diagram illustrating a determination method of determining that the condition of adjacency is satisfied when the calculation cells 12 are arranged in two stages of upper and lower stages (calculation cells 12 1,1 to 12 1,p and calculation cells 12 2,1 to 12 2,p ) in the casting direction A (vertical direction), and a score is acquired in the calculation cell 12 2,i corresponding to three adjacent points in the upper-stage calculation cells 12 1,1 to 12 1,p and one of the three adjacent points of the upper-stage calculation cells in the lower-stage calculation cells 12 2,1 to 12 2,p .
- the method first determines the adjacency in the upper-stage calculation cells 12 1,1 to 12 1,p by using the score (first score) by calculation cell indicating whether or not the absolute value of the degree of deviation exceeds the threshold X for the upper-stage calculation cells 12 1,1 to 12 1,p , and calculates the upper-stage adjacent product vector.
- FIG. 13 is an example of a case where the absolute values of the degrees of deviation of the calculation cell 12 1,3 , the calculation cell 12 1,4 , and the calculation cell 12 1,5 exceed the threshold X in the upper-stage calculation cells 12 1,1 to 12 1,p , and the upper-stage adjacent product vector is (0, 0, 0, 1, 0,0,..., 0, 0, 0).
- a method of obtaining the upper-stage adjacent product vector is the same as the method of obtaining the adjacent product vector described with reference to FIG. 12 , and thus a detailed description thereof will be omitted here.
- the lower-stage calculation cells 12 2,1 to 12 2,p then calculates the sum of the score vector by calculation cell, and the elements of the forward shift vector and the backward shift vector, and sets the score of the calculation cell 12 2,1 to 12 2,p to one point if any one of the calculation cells has a score.
- a vector obtained by arranging these scores is defined as a lower-stage adjacent sum vector.
- a vector obtained by multiplying the elements of the upper-stage adjacent product vector and the lower-stage adjacent sum vector is then defined as an upper/lower adjacent product vector.
- it is determined that adjacency is established if any of the elements of the upper/lower adjacent product vector has a score (second score) of one.
- the example illustrated in FIG. 13 is a case where the absolute value of the degree of deviation of the calculation cell 12 2,3 exceeds the threshold X among the lower-stage calculation cells 12 2,1 to 12 2,p , and the lower-stage adjacent sum vector is (0, 1, 1, 1, 0, 0,..., 0, 0, 0). Since the upper/lower adjacent product vector is (0, 0, 0, 1, 0, 0,..., 0, 0, 0) and there is an element scored one point as the second score, it can be determined that adjacency is established.
- the determination of adjacency allows to determine the position where a seizure has occurred in the mold 5.
- Increasing the number of stages of the thermometers 8 in the casting direction A allows to grasp a state in which the fractured portion 11 is longitudinally propagated in the casting direction A by a phenomenon in which the determination of adjacency is propagated in the casting direction A, when a seizure leading to breakout occurs.
- the determination method of adjacency described with reference to FIG. 13 can determine that a sign such as seizure leading to breakout occurs if any element of the upper/lower adjacent product vector is 1.
- the arrangement positions of the calculation cells 12 1,1 to 12 k,p in the mold 5 are not taken into consideration, but the thermometers 8 1,1 to 8 m,n arranged on the long-side cooling plate 5a and the short-side cooling plate 5b of the mold 5 and arranged on the front surface side and the back surface side of the mold 5 execute interpolation processing respectively and separately, and the second score is calculated based on the adjacency state of the calculation cells 12 1,1 to 12 k,p for each surface, whereby more accurate discrimination can be performed.
- the number of adjacent points for obtaining the adjacent product vector and the adjacent sum vector is not limited to three but may be changed.
- the phenomenon of breakout in the mold 5 in a continuous casting process is manifested not only in lateral propagation but also in a change in temperature behavior from upstream to downstream in the casting direction A (from top to bottom of the mold 5).
- the fractured portion 11 of the solidified shell 12 moves downward while repeating a phenomenon in which the mold 5 and the molten steel 2 come into contact with each other due to some factor to cause seizure, the solidified shell 12 is stuck by the mold 5, and further seizure occurs at the fractured portion 11 of the solidified shell 12, which is generated directly under the seizure because the molten steel 2 is withdrawn from the lower portion of the mold 5, when the mold 5 and the molten steel 2 come into contact with each other.
- the logical product of the adjacent sum vectors in each stage is calculated to determine the adjacency in the upper and lower stages (the occurrence state of the same phenomenon in adjacent places). Therefore, it is not necessary for all of the plurality of thermometers 8 and the plurality of calculation cells 12 to be arranged at the same distance from the upper end of the mold 5 in the casting direction A.
- FIG. 14 is a graph of time-series detection data in a case where a breakout has been predicted by the breakout prediction method according to the embodiment of the present invention (the method of the present invention).
- a time t 1 is a moment when a breakout has been predicted by the breakout prediction method according to the embodiment of the present invention.
- a time t 2 is a moment when a breakout has been predicted by the conventional breakout prediction method.
- the conventional breakout prediction method is a method of predicting a breakout when the detected temperature of the upper-stage thermometer 8 in the thermometer 8 arranged in two stage is lower than the detected temperature of the lower-stage thermometer 8 for a certain period of time.
- the breakout is predicted, thereby starting the control for reducing the casting speed to a predetermined value.
- the use of the breakout prediction method according to the embodiment of the present invention can predict the breakout at an earlier timing than the conventional breakout prediction method in which the temperature change amount is obtained with respect to the time-series data of the detected temperature.
- Table 1 below illustrates results obtained when the breakout prediction method according to the embodiment of the present invention (the method of the present invention) is applied to past breakout prediction cases. Note that, in Table 1 below, Case 1 and Case 5 are cases where a breakout has occurred, and Case 2 to Case 4 are cases where a breakout has not occurred. In Table 1 below, "correct detection” refers to a case where a breakout has occurred, in which the occurrence of a sign leading to breakout has been correctly detected, and thus the occurrence of breakout has been correctly predicted.
- over-detection refers to a case where a breakout has not occurred, in which the occurrence of a sign leading to breakout has been over-detected (erroneous detection), and thus the occurrence of breakout has been erroneously predicted.
- non-detection refers to a case where a breakout has not occurred, in which the occurrence of a sign leading to breakout has not been detected, and the occurrence of breakout has not been predicted.
- Table 1 Conventional method Method of present invention Case 1 Correct detection Correct detection Case 2 Over-detection Non-detection Case 3 Over-detection Non-detection Case 4 Over-detection Non-detection Case 5 Correct detection Correct detection
- the occurrence of all signs leading to breakout can be correctly detected and the occurrence of breakout can be correctly predicted for past cases where a breakout has occurred, and the over-detection (erroneous detection) which has occurred in the conventional method does not occur at all for past cases where a breakout has not occurred.
- the present invention can provide a breakout prediction method, an operation method of a continuous casting machine, and a breakout prediction device capable of accurately predicting a breakout.
Landscapes
- Engineering & Computer Science (AREA)
- Mechanical Engineering (AREA)
- Continuous Casting (AREA)
Abstract
Description
- The present invention relates to a breakout prediction method, an operation method of a continuous casting machine, and a breakout prediction device. Background
- Conventionally, as an operation method of a continuous casting machine, there is known a continuous casting process in which molten steel is poured into a mold, the poured molten steel is cooled by the mold in which a water-cooling pipe is embedded to solidify the surface of the molten steel, a semi-solidified solid product is withdrawn from the lower portion of the mold by a drawing roll, and finally a completely solidified solid product is produced by spray cooling. In the continuous casting process, improvement in productivity by high-speed casting is increasingly required. On the other hand, an increase in the casting speed causes a decrease in the thickness of the solidified shell of the solid product at the lower end of the mold and an uneven distribution of the thickness of the solidified shell. As a result, a socalled breakout may occur in which the solidified shell is broken to cause leakage of steel when a portion having a small thickness of the solidified shell exits the mold. When a breakout occurs, a long down time occurs, and thus productivity is significantly deteriorated. Therefore, there is a demand for a breakout prediction method capable of accurately predicting occurrence of breakout while performing high-speed casting.
- As a breakout prediction method, for a countermeasure against a sticking breakout in which a solidified shell is stuck by a mold, it is known that a breakout is predicted by detecting that the solidified shell is stuck by the mold from a change in temperature measured by a temperature measuring device such as a thermocouple embedded in a copper plate.
- For example,
Patent Literature 1 discloses a method of monitoring a sticking breakout in which a plurality of temperature measuring devices is horizontally arranged below a molten metal surface of a mold of a continuous casting machine to form a temperature measuring array, the temperature measuring arrays are arranged in a plurality of stages in a casting direction, the temperature measuring devices arranged in the upper-stage temperature measuring array and the temperature measuring devices arranged in the lower-stage temperature measuring array, among any two stages of the plurality of stages, are arranged on the same vertical line, the measured values of the temperature measuring devices are transmitted to an arithmetic device, and it is determined that the sticking breakout occurs when both of the followingconditions - Condition 1: In the upper-stage temperature measuring array and/or the lower-stage temperature measuring array, the measured values of the temperature measuring devices adjacent to each other increase and further decrease.
- Condition 2: The measured value of the lower-stage temperature measuring device arranged on the vertical line is higher than the measured value of the upper-stage temperature measuring device.
-
Patent Literature 2 discloses a breakout prediction method including: a step of detecting a temperature of a mold by a plurality of thermometers embedded in the mold of a continuous casting machine and having sensitivity coefficients obtained; a step of defining a vector having a sensitivity coefficient of each of the plurality of thermometers as a component as a sensitivity coefficient vector and a vector having a detection value of each of the plurality of thermometers as a component as a detection temperature vector; a step of calculating the component of the detected temperature vector in a direction orthogonal to the sensitivity coefficient vector as a degree of deviation; a step of giving a first score to a thermometer in which the component of the degree of deviation exceeds a threshold; a step of defining a score vector by thermometer in which the first score is defined as a score by thermometer, and presence or absence of a score of each of the plurality of thermometers is defined as a component; a step of giving a second score to a central thermometer when scores are given to each thermometer and a thermometer adjacent to each thermometer, in the score vector by thermometer; and a step of detecting occurrence of a sign of breakout by the second score. -
- Patent Literature 1:
JP 2017-154155 A - Patent Literature 2:
JP 5673100 B2 - However, the method of monitoring the sticking breakout disclosed in
Patent Literature 1 is configured to obtain the temperature change amount with respect to the time-series data of the detected temperature. Therefore, even if the detected temperature has changed due to a factor other than a sign of breakout, such as a change in the casting speed, there is a possibility of erroneous detection that a breakout may occur. - The breakout prediction method disclosed in
Patent Literature 2 defines the temperature measurement value itself as a detected temperature vector to calculate the degree of deviation. Therefore, at the time of non-steady operation such as changing the width of a solid product during operation, the degree of deviation increases due to a change in, for example, the casting width of molten steel with respect to the mold, and there is a possibility of erroneous detection that a breakout may occur. - The present invention has been made in view of the above problems, and an object of the present invention is to provide a breakout prediction method, an operation method of a continuous casting machine, and a breakout prediction device capable of accurately predicting a breakout.
- To solve the above-described problem and achieve the object, a breakout prediction method according to the present invention includes: a step of inputting a dimension of a solid product withdrawn from a mold in a continuous casting machine; a step of detecting a temperature of the mold by a plurality of thermometers embedded in the mold; a step of executing interpolation processing on the detected temperatures detected by the plurality of thermometers according to the dimension of the solid product; a step of calculating, based on the temperatures calculated by executing the interpolation processing, a component in a direction orthogonal to an influence coefficient vector obtained by principal component analysis as a degree of deviation from during a normal operation in which a breakout has not occurred; and a step of predicting a breakout based on the degree of deviation.
- Moreover, in the above-described breakout prediction method according to the present invention, the step of executing the interpolation processing includes calculating a temperature by executing the interpolation processing on the detected temperature of each of the plurality of thermometers, at a center point of each of a plurality of calculation cells equally divided according to the dimension of the solid product.
- Moreover, in the above-described breakout prediction method according to the present invention, number of the calculation cells is kept constant even when the dimension of the solid product is changed.
- Moreover, in the above-described breakout prediction method according to the present invention, the step of calculating as the degree of deviation includes obtaining an average value of a temperature of each of the plurality of calculation cells located at a same distance from an upper end of the mold in a casting direction of a molten steel with respect to the mold, obtaining a difference from the average value for the temperature of each of the plurality of calculation cells, and calculating the degree of deviation from the obtained difference using the influence coefficient vector.
- Moreover, in the above-described breakout prediction method according to the present invention, the step of predicting the breakout includes predicting a breakout based on an adjacency of the calculation cell in which an absolute value of the degree of deviation exceeds a preset second threshold when a time change rate of the degree of deviation exceeds a preset first threshold.
- Moreover, in the above-described breakout prediction method according to the present invention, the step of predicting the breakout includes a step of giving a first score to the calculation cell in which the degree of deviation exceeds the second threshold, a step of calculating a second score from the first score based on the adjacency of the calculation cell to which the first score is given, and a step of predicting a breakout based on the second score.
- Moreover, in the above-described breakout prediction method according to the present invention, the influence coefficient vector is a sensitivity coefficient vector having a sensitivity coefficient of each of the plurality of thermometers as a component.
- Moreover, an operation method of a continuous casting machine according to the present invention includes reducing a casting speed at which molten steel is poured into the mold when a breakout is predicted based on the breakout prediction method according to the above-described invention.
- Moreover, a breakout prediction device according to the present invention includes: an input unit configured to input a dimension of a solid product withdrawn from a mold in a continuous casting machine; a plurality of thermometers embedded in the mold and configured to detect a temperature of the mold; an interpolation processing execution unit configured to execute interpolation processing on the detected temperatures detected by the plurality of thermometers according to the dimension of the solid product; a degree-of-deviation calculation unit configured to calculate, based on the temperatures calculated by executing the interpolation processing, a component in a direction orthogonal to an influence coefficient vector obtained by principal component analysis as a degree of deviation from during a normal operation in which a breakout has not occurred; and a breakout prediction unit configured to predict a breakout based on the degree of deviation.
- The breakout prediction method, the operation method of the continuous casting machine, and the breakout prediction device according to the present invention have an effect capable of accurately predicting a breakout.
-
-
FIG. 1 is a schematic diagram illustrating a schematic configuration of a continuous casting machine according to an embodiment. -
FIG. 2 is a perspective view illustrating a schematic configuration of a mold in which a thermometer is embedded, in the continuous casting machine according to the embodiment. -
FIG. 3(a) is a diagram for explaining the state of the molten steel and the solidified shell in the mold in a sign phenomenon of breakout.FIG. 3(b) is a diagram illustrating a state of a fractured portion of the solidified shell in the sign phenomenon of breakout. -
FIG. 4(a) is the temperature distribution of the mold at a moment when a seizure has occurred.FIG. 4(b) is a diagram illustrating the temperature distribution of the mold after 10 seconds from the moment when a seizure has occurred. -
FIG. 5 is a flowchart illustrating an example of a procedure of a breakout prediction method according to the embodiment. -
FIG. 6 is a diagram illustrating a correlation between detected temperatures of thermometers in a normal state in which a breakout does not occur. -
FIG. 7 is a diagram illustrating a correlation between the detected temperatures of the thermometers when a sign such as seizure leading to breakout occurs. -
FIG. 8(a) is a diagram illustrating a relationship between the detected temperatures of the thermometers and the temperatures at which the interpolation processing has been executed in a case where the width of the solid product withdrawn from the lower end of the mold is wide.FIG. 8(b) is a diagram illustrating a relationship between the detected temperatures of the thermometers and the temperatures at which the interpolation processing has been executed in a case where the width of the solid product withdrawn from the lower end of the mold is narrow. -
FIG. 9 is a diagram illustrating a positional relationship between the thermometers and calculation cells located at the same distance from the upper end of the mold. -
FIG. 10(a) is a diagram illustrating a time-series change in an absolute value of a degree of deviation in a case where a seizure has occurred.FIG. 10(b) is a diagram illustrating a time-series change in the time change rate of the degree of deviation in the case where a seizure has occurred. -
FIG. 11(a) is a diagram illustrating a time-series change in the absolute value of the degree of deviation in a case where a seizure has not occurred.FIG. 11(b) is a diagram illustrating a time-series change in the time change rate of the degree of deviation in the case where a seizure has not occurred. -
FIG. 12 is a diagram illustrating an example of a determination method of adjacency in a case where the calculation cell that executes the interpolation processing is arranged in one stage. -
FIG. 13 is a diagram illustrating a determination method of determining that the condition of adjacency is satisfied when the calculation cells are arranged in two stages of upper and lower stages in the casting direction, and a score is acquired in a calculation cell corresponding to three adjacent points in the upper-stage calculation cells and one of the three adjacent points of the upper-stage calculation cells in the lower-stage calculation cells. -
FIG. 14 is a graph of time-series detection data in a case where a breakout has been predicted by the breakout prediction method according to the embodiment of the present invention. - Embodiments of a breakout prediction method, an operation method of a continuous casting machine, and a breakout prediction device according to the present invention will be described below. Note that the present invention is not limited by the embodiments.
-
FIG. 1 is a schematic diagram illustrating a schematic configuration of acontinuous casting machine 1 according to the embodiment. As illustrated inFIG. 1 , thecontinuous casting machine 1 according to the embodiment includes a tundish 3 into whichmolten steel 2 is poured, acopper mold 5 that cools themolten steel 2 poured from the tundish 3 through animmersion nozzle 4, a plurality of solidproduct support rolls 7 that conveys a semi-solidifiedsolid product 6 withdrawn from themold 5, and adetermination unit 20 that determines a sign phenomenon of breakout from a detected temperature of athermometer 8 embedded in themold 5. Note that the present embodiment uses a thermocouple as thethermometer 8 but is not limited thereto. -
FIG. 2 is a perspective view illustrating a schematic configuration of themold 5 in whichthermometers 81,1 to 8m,n are embedded, in thecontinuous casting machine 1 according to the embodiment. As illustrated inFIG. 2 , themold 5 includes a pair of long-side cooling plates 5a and a pair of short-side cooling plates 5b, and is formed in a substantially rectangular tubular shape penetrating in the vertical direction. A cooling water channel not illustrated is formed along the inner wall surface within the long-side cooling plate 5a and the short-side cooling plate 5b, and cooling water is circulated in the cooling water channel to cool themolten steel 2. - The
thermometers 81,1 to 8m,n are embedded within the long-side cooling plate 5a of themold 5 at a predetermined depth from the outer wall surface of the long-side cooling plate 5a. Note that, in the following description, when thethermometers 81,1 to 8m,n are not particularly distinguished from each other, the thermometers are also referred to simply asthermometers 8. InFIG. 2 , thethermometers 81,1 to 8m,n are arranged in three or more stages in a casting direction A, andfirststage thermometers 81,1 to 81,n, second-stage thermometers 82,1 to 82,n, and n-th-stage thermometers 8m,1 to 8m,n are separately embedded on the same plane. In the present embodiment, the casting direction A is a direction in which themolten steel 2 is poured into themold 5 from thetundish 3 through theimmersion nozzle 4, and is the same direction as a direction in which thesolid product 6 is withdrawn from the lower end of themold 5. - Note that the arrangement of the
thermometers 8 illustrated inFIG. 2 is merely an example for explaining the present invention, and thethermometers 8 may be arranged on at least one of the pair of long-side cooling plates 5a, at least one of the pair of short-side cooling plates 5b, or all of the pair of long-side cooling plates 5a and the pair of short-side cooling plates 5b among the pair of long-side cooling plates 5a and the pair of short-side cooling plates 5b of themold 5. Of the arrangements described above, it is preferable that thermometers are arranged on all of the pair of long-side cooling plates 5a and the pair of short-side cooling plates 5b. Thethermometers 8 can also be arranged in themold 5 in a multi-stage arrangement of more than three stages or in a single-stage arrangement in the casting direction A. - The sign phenomenon of breakout will now be described.
FIG. 3(a) is a diagram for explaining the state of themolten steel 2 and a solidifiedshell 10 in themold 5 in a sign phenomenon of breakout.FIG. 3(b) is a diagram illustrating a state of a fracturedportion 11 of the solidifiedshell 10 in the sign phenomenon of breakout. - As illustrated in
FIGS. 3(a) and 3(b) , in the sign phenomenon of breakout, a seizure occurs in themold 5 due to some factor, and the solidifiedshell 10 is stuck by themold 5. On the other hand, since thesolid product 6 is withdrawn from the lower end of themold 5 in the same direction as the casting direction A illustrated inFIG. 3(b) , the fracturedportion 11 of the solidifiedshell 10 is generated directly under the seizure. At the fracturedportion 11 of the solidifiedshell 10, themold 5 and themolten steel 2 come into contact with each other, and further seizure occurs. While the above phenomenon is repeated, the fracturedportion 11 of the solidifiedshell 10 moves downward, and the solidifiedshell 10 above the fracturedportion 11 becomes thicker. Finally, when the fracturedportion 11 passes through the lower end of themold 5, themolten steel 2 leaks from the fracturedportion 11 and a breakout occurs. - Note that the
molten steel 2 and themold 5 are in contact with each other at the fracturedportion 11, and thus the temperature of themold 5 locally rises. Therefore, for example, as indicated by an arrow B inFIG. 3(b) , when the fracturedportion 11 moving downward passes through the arrangement positions ofthermometers 8m',1 to 8m',n, the detected temperatures of thethermometers 8m',1 to 8m',n become high. Then solidified shell 10 above the fracturedportion 11 is then stuck by themold 5 and continues to be cooled, and thus the detected temperatures of thethermometers 8m',1 to 8m',n monotonically decrease. On the other hand, since the fracturedportion 11 is propagated not only in the downward direction but also in the lateral direction, the fracturedportion 11 expands in a V-shape as illustrated inFIG. 3(b) . Note that, when the fracturedportion 11 of the solidifiedshell 10 occurs at a position lower than thethermometers 8m',1 to 8m',n, the passage through the fracturedportion 11 does not occur at the positions of thethermometers 8m',1 to 8m',n, and thus only a decrease in the detected temperatures of thethermometers 8m',1 to 8m',n is observed. -
FIG. 4(a) is the temperature distribution of themold 5 at a moment when a seizure has occurred.FIG. 4(b) is a diagram illustrating the temperature distribution of themold 5 after 10 seconds from the moment when a seizure has occurred. From the temperature distributions of themold 5 illustrated inFIGS. 4(a) and 4(b) , respectively, it can be seen that the V-shaped high temperature portion is propagated in the downward direction and the lateral direction. - The change in the temperature distribution of the
mold 5 as described above can also be caused by a decrease in the casting speed, fluctuations in the molten metal surface level, and a change in the width of thesolid product 6, for example. In the case of a decrease in the casting speed or fluctuations in the molten metal surface level, the mold temperature located at the same distance from the upper end of themold 5 changes synchronously. On the other hand, in the case where the casting width at the time of pouring themolten steel 2 into themold 5 during operation, in other words, the width of thesolid product 6 withdrawn from the lower end of themold 5 is changed, the fluctuation of the mold temperature measured by thethermometers 8 positioned in the vicinity of both ends of the width of thesolid product 6 becomes large. - Therefore, in the breakout prediction method according to the embodiment, the evaluation value of the non-interlocking property of the estimated temperature at a plurality of locations where the interpolation processing has been executed according to the width of the
solid product 6 is calculated, and the change rate of the evaluation value and the adjacency of the temperature change at the changed location are determined, thereby improving the prediction accuracy of the breakout. The breakout prediction method according to the embodiment based on the above technical concept will be described in detail below. -
FIG. 5 is a flowchart illustrating an example of a procedure of the breakout prediction method according to the embodiment. The breakout prediction method illustrated in the flowchart is performed by thedetermination unit 20 illustrated inFIG. 1 . Note that thedetermination unit 20 has at least the functions of an interpolation processing execution means, a degree-of-deviation calculation means, and a breakout prediction means in the present invention. Details of each step inFIG. 5 will be described below as appropriate. - In the breakout prediction method according to the embodiment, the
determination unit 20 calculates in advance sensitivity coefficients for thethermometers 81,1 to 8m,n during normal operation (hereinafter also referred to as a normal state) in which a breakout has not occurred (step S1). This sensitivity coefficient is calculated by using a temperature obtained by interpolation processing with a normal temperature actually measured by a thermometer as a reference such that the sensitivity coefficient can cope with a casting having a different width or failure of the thermometer as will be described below. Note that, since there is a possibility that the sensitivity coefficient changes due to a change in the surface state of themold 5 through the operation, it is preferable to update the sensitivity coefficient at an appropriate time such as between castings. Thedetermination unit 20 then continuously detects temperatures T1,1 to Tm,n of themold 5 using thethermometers 81,1 to 8m,n (step S2). Thedetermination unit 20 then executes the interpolation processing of the temperature of themold 5 on the detected temperatures of thethermometers 81,1 to 8m,n, at the center points ofcalculation cells 121,1 to 12k,p equally divided according to the dimensions of thesolid product 6 to be withdrawn from the mold 5 (e.g., widths of thesolid product 6 and thicknesses of the solid product 6) input by an operator through an input device not illustrated which is an input means such as a personal computer provided in the continuous casting machine 1 (step S3). Average bias removal is then performed on the temperatures T'1,1 to T'k,p of themold 5 obtained by the interpolation processing. In other words, in the temperatures T'1,1 to T'k,p of themold 5 obtained by the interpolation processing, the average values are obtained for the temperatures T'1,1 to T'1,p of thecalculation cells 121,1 to 121,p and the temperatures T'2,1 to T'2,p and T'k,1 to T'k,p of thecalculation cells 122,1 to 122,p, respectively, at the same distance from the upper end of themold 5. The difference from the average value of the temperatures T'1,1 to T'1,p of thecalculation cells 121,1 to 121,p and the difference from the average value of the temperatures T'2,1 to T'2,p of thecalculation cells 122,1 to 122,p are then obtained (step S4). Thedetermination unit 20 then calculates the degree of deviation from the difference from the obtained average value using the sensitivity coefficient (step S5). - The sensitivity coefficient vector, which is a vector having the sensitivity coefficients, which are influence coefficients, as components, represents a direction indicating an average behavior of the temperatures of the calculation cells obtained by the above interpolation processing for the
thermometers 81,1 to 8m,n during normal operation. In the vector having the difference from the average value as a component, a component parallel to the direction of the sensitivity coefficient vector is a component of the average behavior, and a component in a direction orthogonal to the direction of the sensitivity coefficient vector is a component of the degree of deviation from the average behavior. - When the calculated time rate of change of the degree of deviation exceeds the threshold Y, the
determination unit 20 then determines a breakout prediction based on the adjacent state of thecalculation cell 12 whose absolute degree of deviation exceeds the threshold X (step S6). Note that the time change rate of the degree of deviation represents a rate (degree) at which the absolute value of the degree of deviation changes in a predetermined time (per unit time). If it is determined that the breakout is not predicted (No in step S6), thedetermination unit 20 proceeds to step S2. On the other hand, if it is determined that the breakout has been predicted (Yes in step S6), thedetermination unit 20 automatically reduces the casting speed to a predetermined speed (step S7). As described above, when thedetermination unit 20 predicts the breakout, the casting speed is sufficiently reduced, so that the solidifiedshell 12 having a sufficient thickness is formed in themold 5 even at the location where a seizure occurs, and thus the breakout can be avoided. Thedetermination unit 20 reduces the casting speed to a predetermined value, and then returns the processing routine. - The sensitivity coefficient used in the breakout prediction method according to the embodiment will now be described with respect to a case where the detected temperatures of the
thermometers 81,1 to 8m,n are used first.FIG. 6 is a diagram illustrating a correlation between the detected temperatures of thethermometers 81,1 to 8m,n in a normal state in which a breakout does not occur.FIG. 7 is a diagram illustrating a correlation between the detected temperatures of thethermometers 81,1 to 8m,n when a sign such as seizure leading to breakout occurs. Note that, for the sake of simplicity,FIGS. 6 and7 illustrate the case of twothermometers mold 5 in the casting direction A. - As illustrated in
FIG. 6 , the detected temperatures of thethermometer 8i,j1 and thethermometer 8i,j2 in the normal state are distributed in a range close to a broken line (a line inclined at 45 degrees to the right in the example illustrated inFIG. 6 ) indicating the direction of a sensitivity coefficient vector which is a vector having a sensitivity coefficient as a component. When the detected temperature Ti,j1 detected by thethermometer 8i,j1 increases, the detected temperature Ti,j2 detected by the thermometer Bi,j2 also increases. On the other hand, when the detected temperature Ti,j1 detected by thethermometer 8i,j1 decreases, the detected temperature Ti,j2 detected by the thermometer Bi,j2 also decreases. - As described above, the reason why the
thermometer 8i,j1 and thethermometer 8i,j2 have a correlation in the normal state is as follows. For example, when the casting speed of thecontinuous casting machine 1 is higher, thesolid product 6 is withdrawn before the solidifiedshell 10 sufficiently grows, and thus the solidifiedshell 10 becomes thinner. As a result, the thermal resistance decreases and the temperature of themolten steel 2 is easily transmitted to thethermometer 8i,j1 and the thermometer Bi,j2. On the other hand, as the casting speed is slower, the solidifiedshell 10 is withdrawn after the solidified shell sufficiently grows, so that the solidifiedshell 10 becomes thicker and the thermal resistance increases, and the temperature of themolten steel 2 is hardly transmitted to thethermometer 8i,j1 and the thermometer Bi,j2. Since these tendencies are common to all thethermometers 81,1 to 8m,n, the detected temperatures of thethermometers 81,1 to 8m,n in the normal state are distributed in a range close to the broken line indicating the direction of the sensitivity coefficient vector in a shape close to an ellipse. However, the sensitivity coefficients of thethermometers 81,1 to 8m,n are generally not constant because how easily the temperature of themolten steel 2 is transmitted differs for each of thethermometers 81,1 to 8m,n. Therefore, the inclination of the sensitivity coefficient vector illustrated inFIG. 6 may vary depending on the installation locations of thethermometers 81,1 to 8m,n with respect to themold 5, variations in construction, and others. - The reason why the
thermometer 8i,j1 and thethermometer 8i,j2 have a correlation in the normal state can be considered to be, in addition to the above, the flow of themolten steel 2 in themold 5, the fluctuations of the molten metal surface, and others. However, most of the sensitivity coefficients of thethermometers 81,1 to 8m,n are contributed by the overall temperature change of themold 5 accompanying the increase and decrease of the above casting speed. Therefore, in order to take more various phenomena of the continuous casting process into consideration in the sensitivity coefficient, it is necessary to remove the overall temperature change of themold 5 accompanying the increase and decrease of the casting speed as the average bias. - As a method of removing the average bias, for example, there is a method of obtaining an average value Tave of all of the detected temperatures T1,1 to Tm,n detected by the
thermometers 81,1 to 8m,n and obtaining a difference between each of the detected temperatures T1,1 to Tm,n and the average value Tave. As another method of removing the average bias, for example, there is a method of obtaining an average value Ti,ave of the detected temperatures Ti,1 to Ti,n detected by thethermometers 81,1 to 8i,n located at the same distance from the upper end of themold 5 in the casting direction A, and obtaining the difference between each of the detected temperatures Ti,1 to Ti,n and the average value Ti,ave for eachthermometer 8 located at the same distance. - As one method of obtaining a sensitivity coefficient vector which is an influence coefficient vector, a method of using principal component analysis can be considered. As another method, for example, a method of experimentally obtaining how easily the temperature of the
molten steel 2 in each of thethermometers 81,1 to 8m,n is transmitted when the overall temperature changes due to fluctuations in the molten metal surface or others can be considered. - On the other hand, as illustrated in
FIG. 7 , the detected temperatures of thethermometers 8i,j1 and Bi,j2 at the time of occurrence of a sign such as seizure leading to breakout are distributed at positions away from a broken line (a line inclined at 45 degrees to the right in the example illustrated inFIG. 7 ) indicating the direction of the sensitivity coefficient vector. This is because, when a seizure leading to breakout occurs, the detected temperature Ti,j1 decreases at thethermometer 8i,j1 close to the position of the fracturedportion 11 of the solidifiedshell 10, and a detected temperature Ti,j1+1 and a detected temperature Ti,j1-1 of athermometer 8i,ji+1 and athermometer 8i,j1-1, which are located on both sides of thethermometer 8i,j1, decrease after a short delay. - From the above consideration, it can be seen that the occurrence of breakout can be determined based on the degree of deviation of the detected temperatures T1,1 to Tm,n of the
thermometers 81,1 to 8m,n from the broken line indicating the direction of the sensitivity coefficient vector. In other words, it can be seen that the components in the direction orthogonal to the sensitivity coefficient vector in the temperature vector which is a vector having the detected temperatures T1,1 to Tm,n of thethermometers 81,1 to 8m,n as components are calculated as the degree of deviation, and the occurrence of breakout can be determined based on the degree of deviation. - For example, in
FIGS. 6 and7 , the degree-of-deviation component which is components in a direction orthogonal to the sensitivity coefficient vector is calculated in the temperature vectors having the detected temperatures of thethermometer 8i,j1 and thethermometer 8i,j2 as components. The occurrence of breakout is determined based on the calculated degree-of-deviation component. Note that, inFIGS. 6 and7 , the direction of the sensitivity coefficient vector is the same as the direction of the first principal component of the temperature distribution in the normal state, and the direction orthogonal to the direction of the sensitivity coefficient vector is the same as the direction of the second principal component of the temperature distribution in the normal state. - However, if the detected temperatures T1,1 to Tm,n themselves are used for prediction of breakout, there is a possibility that the occurrence of breakout is erroneously predicted (erroneously detected) in a non-steady state such as when the casting width at the time of pouring the
molten steel 2 into themold 5, in other words, the width of thesolid product 6 withdrawn from the lower end of themold 5 is changed during operation, even though a sign leading to breakout has not occurred. -
FIG. 8(a) is a diagram illustrating a relationship between detected temperatures Tm1,n1 to Tm1,n1+18 ofthermometers 8m1,n1 to 8m1,n1+18 and temperatures T'm1,n1 to T'm1,n1+18 at which the interpolation processing has been executed in a case where the width (casting width) of thesolid product 6 withdrawn from the lower end of themold 5 is wide.FIG. 8(b) is a diagram illustrating a relationship between detected temperatures Tm1,n1 to Tm1,n1+18 ofthermometers 8m1,n1 to 8m1,n1+18 and temperatures T'm1,n1 to T'm1,n1+18 at which the interpolation processing has been executed in a case where the width (casting width) of thesolid product 6 withdrawn from the lower end of themold 5 is narrow. Note that, inFIGS. 8(a) and 8(b) , thethermometers 8m1,n1 to 8m1,n1+18 are arranged at positions at the same distance from the upper end of themold 5 in the casting direction A. The temperatures T'm1,n1 to T'm1,n1+18 are estimated temperatures of themold 5 calculated by executing interpolation processing on the detected temperatures Tm1,n1 to Tm1,n1+18 of thethermometers 8m1,n1 to 8m1,n1+18, at the center points of thecalculation cells 12m1,n1 to 12m1,n1+18 equally divided according to the widths of thesolid product 6. Note that an interpolation processing method will be described below. - In the case where the casting width is changed during casting and the state is changed from
FIG. 8(a) to FIG. 8(b) , when attention is paid to the detected temperatures Tm1,n1 to Tm1,n1+18 of thethermometers 8m1,n1 to 8m1,n1+18, only a detected temperature Tm1,n1+3 and a detected temperature Tm1,n1+15 have a large temperature change, and the other detected temperatures do not have a significant temperature change. Therefore, in the cases illustrated inFIGS. 8 (a) and 8 (b) , if the detected temperatures Tm1,n1 to Tm1,n1+18 themselves are used for prediction of breakout, there is a possibility that the detected temperatures deviate from the sensitivity coefficient vector and are erroneously detected as occurrence of a sign leading to breakout. - On the other hand, in the case where the casting width is changed during casting and the state is changed from
FIG. 8(a) to FIG. 8(b) , when attention is paid to the temperatures T'm1,n1 to T'm1,n1+18 at which, even when the dimension of thesolid product 6 is changed, the number of calculation cells 12 (the number of cells) is kept constant and the interpolation processing has been executed, the temperature change of the temperatures T'm1,n1 to T'm1,n1+18 is small. Therefore, in the cases illustrated inFIGS. 8(a) and 8 (b) , by using the temperatures T'm1,n1 to T'm1,n1+18 at which interpolation processing has been executed for prediction of breakout, it is possible to reduce the risk of erroneous detection of occurrence of a sign leading to breakout. - In
FIGS. 8(a) and 8(b) , the temperature detection of athermometer 8m1,n1+7, athermometer 8m1,n1+11, athermometer 8m1,n1+12, and athermometer 8m1,n1+16 that detect a detected temperature Tm1,n1+7, a detected temperature Tm1,n1+11, a detected temperature Tm1,n1+12, and a detected temperature Tm1,n1+16, respectively, is defective. Even in the case of including thethermometer 8 whose temperature detection is defective as described above, if the detected temperatures Tm1,n1 to Tm1,n1+18 themselves are used for prediction of breakout, there is a possibility that the detected temperatures deviate from the sensitivity coefficient vector and are erroneously detected as a sign of breakout occurrence. On the other hand, at the temperatures T'm1,n1 to T'm1,n1+18 at which the interpolation processing has been executed, even when thethermometer 8 whose temperature detection is defective is included, the risk of erroneous detection of occurrence of a sign leading to breakout can be reduced by using the estimated temperature of themold 5 in the section where the temperature detection is defective. - The interpolation processing method will now be described.
FIG. 9 is a diagram illustrating a positional relationship between thethermometers 8i,1 to 8i,j andcalculation cells 12i,1 to 12i,j located at the same distance from the upper end of themold 5. - As illustrated in
FIG. 9 , thecalculation cells 12i,1 to 12i,j are obtained by equally dividing a section (a section sandwiched between the pair of short-side cooling plates 5b in the width direction of the mold 5) corresponding to the width of thesolid product 6 in the long-side cooling plate 5a by a constant number of cells with respect to thethermometers 8i,1 to 8i,j located at the same distance from the upper end of themold 5 in the long-side cooling plate 5a of themold 5. The detected temperatures detected by thethermometers 8i,1 to 8i,j are linearly interpolated to calculate the estimated temperature of the mold 5 (long-side cooling plate 5a) at the position of the center point of each of thecalculation cells 12i,1 to 12i,j. Note that the number ofcalculation cells 12 for the interpolation processing may be the same as or different from the number ofthermometers 8 in the vertical and horizontal directions, but is constant regardless of fluctuations in the casting width during casting. - The interpolation processing described above can be applied to a case where the sensitivity coefficient vector is obtained by using the principal component analysis and a case where the degree of deviation is calculated. In this case, the principal component analysis is performed using the temperature subjected to interpolation processing instead of the actual detected temperature. Even when the solid product width is changed, the temperature vector having the same number of points can be used, so that the principal component analysis can be performed including data having different widths. Thus, it is not necessary to obtain a different influence coefficient for each width, and the influence coefficient vector can be determined including data having different solid product widths. The degree of deviation can also be calculated using the influence coefficient vector calculated based on the temperature obtained by interpolating the detected temperature. Therefore, it is possible to predict the breakout of different solid product widths based on a unified standard. Further, even when the solid product width is changed during casting, it is also possible to reduce the risk of erroneous detection related to the occurrence of a sign leading to breakout.
- The determination of breakout prediction will now be described.
FIG. 10(a) is a diagram illustrating a time-series change in the absolute value of the degree of deviation in a case where a seizure has occurred.FIG. 10(b) is a diagram illustrating a time-series change in the time change rate of the degree of deviation in the case where a seizure has occurred.FIG. 11(a) is a diagram illustrating a time-series change in the absolute value of the degree of deviation in a case where a seizure has not occurred.FIG. 11(b) is a diagram illustrating a time-series change in the time change rate of the degree of deviation in the case where a seizure has not occurred. - In
FIG. 10(a) , the absolute value of the degree of deviation rapidly increases at a certain time during operation. On the other hand, inFIG. 11(a) , the absolute value of the degree of deviation is constantly large during operation. When the sensitivity coefficient calculated based on the temperature subjected to interpolation processing from the detected temperatures of thethermometers 81,1 to 8m,n deviates from a value previously determined due to a factor such as a change in the surface shape of themold 5, there is a possibility that the absolute value of the degree of deviation is constantly large even if an abnormality such as seizure does not occur as illustrated inFIG. 11(a) . Therefore, as illustrated inFIGS. 10(a) and11(a) , when a single threshold X is provided for the absolute value of the degree of deviation, it is difficult to discriminate the presence or absence of the occurrence of seizure which is a sign leading to breakout. - A seizure, which is a sign leading to breakout, suddenly occurs, and the fractured
portion 11 of the solidifiedshell 10 is propagated in the downward and lateral directions of themold 5. Therefore, as illustrated inFIG. 10(a) , the absolute value of the degree of deviation when a seizure occurs rapidly increases at a certain time during operation. Therefore, as illustrated inFIG. 10(b) , the time change rate of the degree of deviation rapidly increases. On the other hand, as illustrated inFIG. 11(a) , even if an abnormality such as seizure does not occur, when the absolute value of the degree of deviation is constantly large during operation, the time change rate of the degree of deviation does not rapidly increase as illustrated inFIG. 11(b) . Therefore, as illustrated inFIGS. 10(b) and11(b) , providing a single threshold Y for the time change rate of the degree of deviation facilitates to discriminate the presence or absence of the occurrence of seizure which is a sign leading to breakout. - A description will now be given of a determination method of determining, when the absolute value of the degree of deviation calculated from the sensitivity coefficient vector exceeds a preset threshold X in a case where the time change rate of the degree of deviation exceeds the threshold Y, the adjacency of the
calculation cell 12 having exceeded the threshold X. -
FIG. 12 is a diagram illustrating an example of a determination method of adjacency in a case where thecalculation cell 12 that executes the interpolation processing is arranged in one stage (calculation cells 121,1 to 121,p). In other words,FIG. 12 illustrates an example of a determination method in the lateral adjacency of thecalculation cells 121,1 to 121,p located at the same distance from the upper end of themold 5 in the casting direction A. Note that, in the determination method of adjacency the present example illustrated inFIG. 12 , it is assumed that the time change rate of the degree of deviation exceeds the threshold Y. - In the determination method of adjacency of the present example, first, one point is given as a score by calculation cell, which is a first score, to the
calculation cell 12 in which the absolute value of the degree of deviation exceeds the preset threshold X as described above, among thecalculation cells 121,1 to 121,p. On the other hand, zero point is given as a score by calculation cell to thecalculation cell 12 in which the absolute value of the degree of deviation does not exceed the threshold X, among thecalculation cells 121,1 to 121,p. With respect to the vector of the score by calculation cell, a vector obtained by shifting the score by calculation cell to one precedingcalculation cell 12 is defined as a forward shift vector, and a vector obtained by shifting the score by calculation cell to one succeedingcalculation cell 12 is defined as a backward shift vector. Further, a vector obtained by multiplying the elements of the forward shift vector and the backward shift vector is defined as an adjacent product vector. When the adjacent product vector defined as described above is calculated, if there are threeadjacent calculation cells 12 in which the absolute value of the degree of deviation exceeds the threshold X, the score of thecentral calculation cell 12 of the threeadjacent calculation cells 12 is one point, and the score of theother calculation cells 12 is zero point, and this score is define as a second score. - Specifically, referring to the example illustrated in
FIG. 12 , inFIG. 12 , the absolute values of the degrees of deviation of thecalculation cell 121,3, thecalculation cell 121,4, and thecalculation cell 121,5 among thecalculation cells 121,1 to 121,p exceed the set threshold X, so that one points are given to thecalculation cell 121,3, thecalculation cell 121,4, and thecalculation cell 121,5 as a score by calculation cell (first score) . On the other hand, zero points are given to theother calculation cell 121,1, thecalculation cell 121,2, and thecalculation cells 121,6 to 121,p as a score by calculation cell (first score). A vector in which these calculation cell scores (first scores) are arranged is (0, 0, 1, 1, 1, 0,..., 0, 0, 0). The forward shift belt is (0, 1, 1, 1, 0, 0,..., 0, 0, 0) and the backward shift vector is (0, 0, 0, 1, 1, 1,..., 0, 0, 0). An adjacent product vector obtained by multiplying the elements of the forward shift vector and the backward shift vector is (0, 0, 0, 1, 0, 0,..., 0, 0, 0). Therefore, it can be seen that, when there are threeadjacent calculation cells 12 that exceed the threshold X, the score (second score) of thecentral calculation cell 121,4 of the threeadjacent calculation cells other calculation cells 121,1 to 121,3 andcalculation cells 121,5 to 121,p are zero points. - Therefore, the determination method of adjacency described with reference to
FIG. 12 can determine that a sign such as seizure leading to breakout occurs if any element of the adjacent product vector is 1. - Note that, in
FIG. 12 , a vector obtained by shifting the score by calculation cell to one precedingcalculation cell 12 is defined as a forward shift vector and a vector obtained by shifting the score by calculation cell to one succeedingcalculation cell 12 is defined as a backward shift vector, thereby obtaining the adjacent product vector of the threeadjacent calculation cells 12, but the determination method is not limited thereto. In other words, according to the set number of cells in thecalculation cell 12, a vector obtained by shifting the score by calculation cell to one or morepreceding calculation cell 12 may be defined as a forward shift vector and a vector obtained by shifting the score by calculation cell to one or more succeedingcalculation cell 12 may be defined as a backward shift vector. Note that, in this case, the number by which the score by calculation cell is shifted to a succeedingcalculation cell 12 to obtain a backward shift vector should be the same as the number by which the score by calculation cell is shifted to a precedingcalculation cell 12 to obtain a forward shift vector. A vector obtained by multiplying the elements of the forward shift vector and the backward shift vector obtained as described above may be defined as an adjacent product vector. - For example, a vector obtained by shifting the score by calculation cell to three preceding
calculation cell 12 is defined as a forward shift vector, and a vector obtained by shifting the score by calculation cell to three succeedingcalculation cell 12 is defined as a backward shift vector. It is determined that a sign such as seizure leading to breakout occurs, if any element of the adjacent product vector is 1 by multiplying the elements of the forward shift vector and the backward shift vector and calculating an adjacent product vector of sevenadjacent calculation cells 12 to obtain a second score. Thus, the occurrence of a sign leading to breakout can be determined with higher accuracy, and thus the breakout can be predicted with high accuracy. - Further, even when the
calculation cells 12 for performing the interpolation processing are configured in two or more stages in the casting direction A, the above determination method of adjacency can be expanded. -
FIG. 13 is a diagram illustrating a determination method of determining that the condition of adjacency is satisfied when thecalculation cells 12 are arranged in two stages of upper and lower stages (calculation cells 121,1 to 121,p andcalculation cells 122,1 to 122,p) in the casting direction A (vertical direction), and a score is acquired in thecalculation cell 122,i corresponding to three adjacent points in the upper-stage calculation cells 121,1 to 121,p and one of the three adjacent points of the upper-stage calculation cells in the lower-stage calculation cells 122,1 to 122,p. - The method first determines the adjacency in the upper-
stage calculation cells 121,1 to 121,p by using the score (first score) by calculation cell indicating whether or not the absolute value of the degree of deviation exceeds the threshold X for the upper-stage calculation cells 121,1 to 121,p, and calculates the upper-stage adjacent product vector. -
FIG. 13 is an example of a case where the absolute values of the degrees of deviation of thecalculation cell 121,3, thecalculation cell 121,4, and thecalculation cell 121,5 exceed the threshold X in the upper-stage calculation cells 121,1 to 121,p, and the upper-stage adjacent product vector is (0, 0, 0, 1, 0,0,..., 0, 0, 0). Note that a method of obtaining the upper-stage adjacent product vector is the same as the method of obtaining the adjacent product vector described with reference toFIG. 12 , and thus a detailed description thereof will be omitted here. - The lower-
stage calculation cells 122,1 to 122,p then calculates the sum of the score vector by calculation cell, and the elements of the forward shift vector and the backward shift vector, and sets the score of thecalculation cell 122,1 to 122,p to one point if any one of the calculation cells has a score. A vector obtained by arranging these scores is defined as a lower-stage adjacent sum vector. A vector obtained by multiplying the elements of the upper-stage adjacent product vector and the lower-stage adjacent sum vector is then defined as an upper/lower adjacent product vector. Finally, it is determined that adjacency is established if any of the elements of the upper/lower adjacent product vector has a score (second score) of one. - The example illustrated in
FIG. 13 is a case where the absolute value of the degree of deviation of thecalculation cell 122,3 exceeds the threshold X among the lower-stage calculation cells 122,1 to 122,p, and the lower-stage adjacent sum vector is (0, 1, 1, 1, 0, 0,..., 0, 0, 0). Since the upper/lower adjacent product vector is (0, 0, 0, 1, 0, 0,..., 0, 0, 0) and there is an element scored one point as the second score, it can be determined that adjacency is established. - The determination of adjacency allows to determine the position where a seizure has occurred in the
mold 5. Increasing the number of stages of thethermometers 8 in the casting direction A allows to grasp a state in which the fracturedportion 11 is longitudinally propagated in the casting direction A by a phenomenon in which the determination of adjacency is propagated in the casting direction A, when a seizure leading to breakout occurs. - Therefore, the determination method of adjacency described with reference to
FIG. 13 can determine that a sign such as seizure leading to breakout occurs if any element of the upper/lower adjacent product vector is 1. - Note that, in the above description of the present embodiment, the arrangement positions of the
calculation cells 121,1 to 12k,p in themold 5 are not taken into consideration, but thethermometers 81,1 to 8m,n arranged on the long-side cooling plate 5a and the short-side cooling plate 5b of themold 5 and arranged on the front surface side and the back surface side of themold 5 execute interpolation processing respectively and separately, and the second score is calculated based on the adjacency state of thecalculation cells 121,1 to 12k,p for each surface, whereby more accurate discrimination can be performed. The number of adjacent points for obtaining the adjacent product vector and the adjacent sum vector is not limited to three but may be changed. - The phenomenon of breakout in the
mold 5 in a continuous casting process is manifested not only in lateral propagation but also in a change in temperature behavior from upstream to downstream in the casting direction A (from top to bottom of the mold 5). In other words, the fracturedportion 11 of the solidifiedshell 12 moves downward while repeating a phenomenon in which themold 5 and themolten steel 2 come into contact with each other due to some factor to cause seizure, the solidifiedshell 12 is stuck by themold 5, and further seizure occurs at the fracturedportion 11 of the solidifiedshell 12, which is generated directly under the seizure because themolten steel 2 is withdrawn from the lower portion of themold 5, when themold 5 and themolten steel 2 come into contact with each other. For thecalculation cells 12 in the upper and lower two stages, the logical product of the adjacent sum vectors in each stage is calculated to determine the adjacency in the upper and lower stages (the occurrence state of the same phenomenon in adjacent places). Therefore, it is not necessary for all of the plurality ofthermometers 8 and the plurality ofcalculation cells 12 to be arranged at the same distance from the upper end of themold 5 in the casting direction A. -
FIG. 14 is a graph of time-series detection data in a case where a breakout has been predicted by the breakout prediction method according to the embodiment of the present invention (the method of the present invention). Note that, inFIG. 14 , a time t1 is a moment when a breakout has been predicted by the breakout prediction method according to the embodiment of the present invention. InFIG. 14 , a time t2 is a moment when a breakout has been predicted by the conventional breakout prediction method. Note that the conventional breakout prediction method is a method of predicting a breakout when the detected temperature of the upper-stage thermometer 8 in thethermometer 8 arranged in two stage is lower than the detected temperature of the lower-stage thermometer 8 for a certain period of time. At time t2, the breakout is predicted, thereby starting the control for reducing the casting speed to a predetermined value. - As illustrated in
FIG. 14 , the use of the breakout prediction method according to the embodiment of the present invention can predict the breakout at an earlier timing than the conventional breakout prediction method in which the temperature change amount is obtained with respect to the time-series data of the detected temperature. - Table 1 below illustrates results obtained when the breakout prediction method according to the embodiment of the present invention (the method of the present invention) is applied to past breakout prediction cases. Note that, in Table 1 below,
Case 1 andCase 5 are cases where a breakout has occurred, andCase 2 toCase 4 are cases where a breakout has not occurred. In Table 1 below, "correct detection" refers to a case where a breakout has occurred, in which the occurrence of a sign leading to breakout has been correctly detected, and thus the occurrence of breakout has been correctly predicted. In Table 1 below, "over-detection" refers to a case where a breakout has not occurred, in which the occurrence of a sign leading to breakout has been over-detected (erroneous detection), and thus the occurrence of breakout has been erroneously predicted. In Table 1 below, "non-detection" refers to a case where a breakout has not occurred, in which the occurrence of a sign leading to breakout has not been detected, and the occurrence of breakout has not been predicted.Table 1 Conventional method Method of present invention Case 1 Correct detection Correct detection Case 2 Over-detection Non-detection Case 3 Over-detection Non-detection Case 4 Over-detection Non-detection Case 5 Correct detection Correct detection - As can be seen from Table 1, according to the breakout prediction method of the embodiment of the present invention, the occurrence of all signs leading to breakout can be correctly detected and the occurrence of breakout can be correctly predicted for past cases where a breakout has occurred, and the over-detection (erroneous detection) which has occurred in the conventional method does not occur at all for past cases where a breakout has not occurred.
- The present invention can provide a breakout prediction method, an operation method of a continuous casting machine, and a breakout prediction device capable of accurately predicting a breakout.
-
- 1
- CONTINUOUS CASTING MACHINE
- 2
- MOLTEN STEEL
- 3
- TUNDISH
- 4
- IMMERSION NOZZLE
- 5
- MOLD
- 6
- SOLID PRODUCT
- 7
- SOLID PRODUCT SUPPORT ROLL
- 8
- THERMOMETER
- 10
- SOLIDIFIED SHELL
- 11
- FRACTURED PORTION
- 20
- DETERMINATION UNIT
Claims (9)
- A breakout prediction method comprising:a step of inputting a dimension of a solid product withdrawn from a mold in a continuous casting machine;a step of detecting a temperature of the mold by a plurality of thermometers embedded in the mold;a step of executing interpolation processing on the detected temperatures detected by the plurality of thermometers according to the dimension of the solid product;a step of calculating, based on the temperatures calculated by executing the interpolation processing, a component in a direction orthogonal to an influence coefficient vector obtained by principal component analysis as a degree of deviation from during a normal operation in which a breakout has not occurred; anda step of predicting a breakout based on the degree of deviation.
- The breakout prediction method according to claim 1, wherein the step of executing the interpolation processing includes
calculating a temperature by executing the interpolation processing on the detected temperature of each of the plurality of thermometers, at a center point of each of a plurality of calculation cells equally divided according to the dimension of the solid product. - The breakout prediction method according to claim 2, wherein number of the calculation cells is kept constant even when the dimension of the solid product is changed.
- The breakout prediction method according to claim 2 or 3, wherein the step of calculating as the degree of deviation includesobtaining an average value of a temperature of each of the plurality of calculation cells located at a same distance from an upper end of the mold in a casting direction of a molten steel with respect to the mold,obtaining a difference from the average value for the temperature of each of the plurality of calculation cells, andcalculating the degree of deviation from the obtained difference using the influence coefficient vector.
- The breakout prediction method according to claim 4, wherein the step of predicting the breakout includes
predicting a breakout based on an adjacency of the calculation cell in which an absolute value of the degree of deviation exceeds a preset second threshold when a time change rate of the degree of deviation exceeds a preset first threshold. - The breakout prediction method according to claim 5, wherein the step of predicting the breakout includesa step of giving a first score to the calculation cell in which the degree of deviation exceeds the second threshold,a step of calculating a second score from the first score based on the adjacency of the calculation cell to which the first score is given, anda step of predicting a breakout based on the second score.
- The breakout prediction method according to any one of claims 1 to 6, wherein the influence coefficient vector is a sensitivity coefficient vector having a sensitivity coefficient of each of the plurality of thermometers as a component.
- An operation method of a continuous casting machine, the method comprising
reducing a casting speed at which molten steel is poured into the mold when a breakout is predicted based on the breakout prediction method according to any one of claims 1 to 7. - A breakout prediction device comprising:an input unit configured to input a dimension of a solid product withdrawn from a mold in a continuous casting machine;a plurality of thermometers embedded in the mold and configured to detect a temperature of the mold;an interpolation processing execution unit configured to execute interpolation processing on the detected temperatures detected by the plurality of thermometers according to the dimension of the solid product;a degree-of-deviation calculation unit configured to calculate, based on the temperatures calculated by executing the interpolation processing, a component in a direction orthogonal to an influence coefficient vector obtained by principal component analysis as a degree of deviation from during a normal operation in which a breakout has not occurred; anda breakout prediction unit configured to predict a breakout based on the degree of deviation.
Applications Claiming Priority (2)
| Application Number | Priority Date | Filing Date | Title |
|---|---|---|---|
| JP2020105070 | 2020-06-18 | ||
| PCT/JP2021/015092 WO2021256063A1 (en) | 2020-06-18 | 2021-04-09 | Breakout prediction method, method for operating continuous casting apparatus, and breakout prediction device |
Publications (3)
| Publication Number | Publication Date |
|---|---|
| EP4151335A1 true EP4151335A1 (en) | 2023-03-22 |
| EP4151335A4 EP4151335A4 (en) | 2023-04-19 |
| EP4151335B1 EP4151335B1 (en) | 2025-06-25 |
Family
ID=78001414
Family Applications (1)
| Application Number | Title | Priority Date | Filing Date |
|---|---|---|---|
| EP21826706.0A Active EP4151335B1 (en) | 2020-06-18 | 2021-04-09 | Breakout prediction method, operation method of continuous casting machine, and breakout prediction device |
Country Status (5)
| Country | Link |
|---|---|
| US (1) | US11925974B2 (en) |
| EP (1) | EP4151335B1 (en) |
| JP (1) | JP6950860B1 (en) |
| KR (1) | KR102736184B1 (en) |
| CN (1) | CN115715239B (en) |
Families Citing this family (5)
| Publication number | Priority date | Publication date | Assignee | Title |
|---|---|---|---|---|
| CN114653914B (en) * | 2021-12-30 | 2023-12-29 | 白居冰 | Crystallizer steel leakage early warning method based on morphological reconstruction and electronic device |
| JP7838545B2 (en) * | 2023-08-31 | 2026-04-01 | Jfeスチール株式会社 | Anomaly detection method |
| JP7704314B1 (en) * | 2023-09-27 | 2025-07-08 | Jfeスチール株式会社 | Breakout prediction method and continuous casting machine operation method |
| CN117150937B (en) * | 2023-10-31 | 2023-12-26 | 北京适创科技有限公司 | Die temperature prediction method, device, equipment and storage medium |
| CN118371667B (en) * | 2024-06-21 | 2024-09-13 | 暗物智能科技(广州)有限公司 | Multi-mode fused aluminum leakage detection method and related device |
Family Cites Families (20)
| Publication number | Priority date | Publication date | Assignee | Title |
|---|---|---|---|---|
| JPS5673100U (en) | 1979-11-08 | 1981-06-16 | ||
| JPS6044163A (en) * | 1983-08-19 | 1985-03-09 | Nippon Steel Corp | Method for predicting breakout in continuous casting |
| SU1279744A1 (en) | 1985-05-28 | 1986-12-30 | Научно-Производственное Объединение По Автоматизации Черной Металлургии "Черметавтоматика" | Method of forecasting metal breakthroughs in continuous casting process |
| SU1366282A1 (en) | 1986-05-11 | 1988-01-15 | Краматорский Научно-Исследовательский И Проектно-Технологический Институт Машиностроения | Mould for continuous casting of metals |
| JP3035688B2 (en) | 1993-12-24 | 2000-04-24 | トピー工業株式会社 | Breakout prediction system in continuous casting. |
| JP4105839B2 (en) * | 2000-02-28 | 2008-06-25 | 新日本製鐵株式会社 | In-mold casting abnormality detection method in continuous casting |
| JP2001287001A (en) | 2000-04-05 | 2001-10-16 | Yaskawa Electric Corp | Breakout prediction method and breakout prediction system in continuous casting equipment |
| JP2001287004A (en) | 2000-04-11 | 2001-10-16 | Nkk Corp | Composite pipe and method for producing the same |
| CA2414167A1 (en) | 2002-12-12 | 2004-06-12 | Dofasco Inc. | Method and online system for monitoring continuous caster start-up operation and predicting start cast breakouts |
| WO2009107865A1 (en) * | 2008-02-28 | 2009-09-03 | Jfeスチール株式会社 | Method for detecting breakouts in continuous casting and an apparatus therefor, breakout prevention apparatus, method for estimating solidification shell thickness and an apparatus therefor, and a continuous casting method for steel |
| JP5375622B2 (en) * | 2010-01-14 | 2013-12-25 | 新日鐵住金株式会社 | Breakout prediction method for continuous casting |
| CN101941060A (en) * | 2010-09-19 | 2011-01-12 | 河北钢铁股份有限公司唐山分公司 | Crystallizer thermography real-time display method based on multirow actual measurement thermocouple temperature |
| JP5673100B2 (en) | 2010-12-28 | 2015-02-18 | Jfeスチール株式会社 | Breakout prediction method |
| CN105328155B (en) * | 2015-10-08 | 2017-09-08 | 东北电力大学 | A kind of bleed-out visual feature forecasting procedure based on improvement neutral net |
| JP6421774B2 (en) | 2016-03-02 | 2018-11-14 | Jfeスチール株式会社 | Restraint breakout monitoring device and monitoring method using the same |
| CN107096899B (en) * | 2017-05-17 | 2018-09-11 | 安徽工业大学 | A kind of crystallizer bleedout prediction electric thermo system that logic-based judges |
| CN108469313B (en) * | 2018-04-16 | 2019-06-14 | 大连理工大学 | Detection method of abnormal temperature area of mold copper plate based on cellular automata |
| JP7091901B2 (en) | 2018-07-17 | 2022-06-28 | 日本製鉄株式会社 | Casting condition determination device, casting condition determination method, and program |
| CN109396375B (en) | 2018-12-11 | 2019-09-27 | 大连理工大学 | A Mold Breakout Prediction Method Based on Eigenvector and Hierarchical Clustering |
| CN110523941B (en) * | 2019-08-06 | 2023-03-17 | 中冶南方连铸技术工程有限责任公司 | Continuous casting bonding bleed-out multistage risk control method and control device |
-
2021
- 2021-04-09 US US18/009,909 patent/US11925974B2/en active Active
- 2021-04-09 EP EP21826706.0A patent/EP4151335B1/en active Active
- 2021-04-09 KR KR1020227043790A patent/KR102736184B1/en active Active
- 2021-04-09 CN CN202180042296.1A patent/CN115715239B/en active Active
- 2021-04-09 JP JP2021537031A patent/JP6950860B1/en active Active
Also Published As
| Publication number | Publication date |
|---|---|
| BR112022025427A2 (en) | 2023-01-24 |
| CN115715239B (en) | 2025-12-02 |
| EP4151335A4 (en) | 2023-04-19 |
| KR102736184B1 (en) | 2024-12-02 |
| US11925974B2 (en) | 2024-03-12 |
| JP6950860B1 (en) | 2021-10-13 |
| JPWO2021256063A1 (en) | 2021-12-23 |
| EP4151335B1 (en) | 2025-06-25 |
| CN115715239A (en) | 2023-02-24 |
| US20230226600A1 (en) | 2023-07-20 |
| KR20230010724A (en) | 2023-01-19 |
Similar Documents
| Publication | Publication Date | Title |
|---|---|---|
| EP4151335B1 (en) | Breakout prediction method, operation method of continuous casting machine, and breakout prediction device | |
| JP5673100B2 (en) | Breakout prediction method | |
| EP3167976B1 (en) | Molten steel flow-state estimating method and flow-state estimating device | |
| JP6358215B2 (en) | Method and apparatus for determining surface defects of continuous cast slab, and method for manufacturing steel slab using the surface defect determination method | |
| JP5407987B2 (en) | Method for detecting longitudinal cracks in slabs | |
| TWI820423B (en) | Casting leakage prediction method, continuous casting machine operating method, and casting leakage prediction device | |
| RU2813046C1 (en) | Method for predicting breakthrough, method of operating continuous casting machine and device for breakthrough prediction | |
| JPH01210160A (en) | Method for predicting longitudinal crack in continuous casting | |
| JP7704314B1 (en) | Breakout prediction method and continuous casting machine operation method | |
| JP5906814B2 (en) | Method and apparatus for predicting constraining breakout in continuous casting equipment | |
| BR112022025427B1 (en) | BREAKOUT PREDICTION METHOD, CONTINUOUS CASTING MACHINE OPERATION METHOD AND BREAKOUT PREDICTION DEVICE | |
| JP7816056B2 (en) | Control equipment and continuous steel casting method | |
| JP6119807B2 (en) | Method and apparatus for determining surface defects of continuous cast slab, and method for producing steel slab using the surface defect determination method | |
| JPH0775766B2 (en) | Method for detecting vertical crack in slab in continuous casting | |
| JP6358199B2 (en) | Method and apparatus for determining surface defects of continuous cast slab, and method for producing steel slab using the surface defect determination method | |
| JP5482418B2 (en) | Breakout prediction method | |
| RU2843550C2 (en) | Method for determining the moment of continuous steel casting beginning, method for operating a continuous steel casting installation, method for manufacturing a slab workpiece, a determining device, a system for determining the beginning of continuous steel casting and a terminal display device | |
| CN114850420A (en) | Method and device for predicting longitudinal cracks in slabs | |
| JP7715982B2 (en) | Method for detecting defects in slabs during continuous casting | |
| EP4442387A1 (en) | Continuous casting start timing determination method, continuous casting facility operation method, slab manufacturing method, determining device, continuous casting start determination system, and display terminal device | |
| JP7014203B2 (en) | Estimating method of crater end position of cast slab in continuous casting and its equipment | |
| JP2025066491A (en) | Anomaly detection device, anomaly detection method, and program | |
| JPH0446658A (en) | Device for predicting breakout in continuous casting apparatus | |
| KR20250056428A (en) | continuous casting mold and thermocouple location method for inspecting molten steel flow | |
| JP2026017809A (en) | Apparatus for estimating state inside a mold, method for estimating state inside a mold, and program |
Legal Events
| Date | Code | Title | Description |
|---|---|---|---|
| STAA | Information on the status of an ep patent application or granted ep patent |
Free format text: STATUS: THE INTERNATIONAL PUBLICATION HAS BEEN MADE |
|
| PUAI | Public reference made under article 153(3) epc to a published international application that has entered the european phase |
Free format text: ORIGINAL CODE: 0009012 |
|
| STAA | Information on the status of an ep patent application or granted ep patent |
Free format text: STATUS: REQUEST FOR EXAMINATION WAS MADE |
|
| 17P | Request for examination filed |
Effective date: 20221213 |
|
| AK | Designated contracting states |
Kind code of ref document: A1 Designated state(s): AL AT BE BG CH CY CZ DE DK EE ES FI FR GB GR HR HU IE IS IT LI LT LU LV MC MK MT NL NO PL PT RO RS SE SI SK SM TR |
|
| A4 | Supplementary search report drawn up and despatched |
Effective date: 20230322 |
|
| RIC1 | Information provided on ipc code assigned before grant |
Ipc: B22D 11/16 20060101AFI20230316BHEP |
|
| DAV | Request for validation of the european patent (deleted) | ||
| DAX | Request for extension of the european patent (deleted) | ||
| STAA | Information on the status of an ep patent application or granted ep patent |
Free format text: STATUS: EXAMINATION IS IN PROGRESS |
|
| 17Q | First examination report despatched |
Effective date: 20240425 |
|
| GRAP | Despatch of communication of intention to grant a patent |
Free format text: ORIGINAL CODE: EPIDOSNIGR1 |
|
| STAA | Information on the status of an ep patent application or granted ep patent |
Free format text: STATUS: GRANT OF PATENT IS INTENDED |
|
| RIC1 | Information provided on ipc code assigned before grant |
Ipc: B22D 11/18 20060101ALI20250107BHEP Ipc: B22D 11/04 20060101ALI20250107BHEP Ipc: B22D 11/16 20060101AFI20250107BHEP |
|
| INTG | Intention to grant announced |
Effective date: 20250116 |
|
| GRAS | Grant fee paid |
Free format text: ORIGINAL CODE: EPIDOSNIGR3 |
|
| GRAA | (expected) grant |
Free format text: ORIGINAL CODE: 0009210 |
|
| STAA | Information on the status of an ep patent application or granted ep patent |
Free format text: STATUS: THE PATENT HAS BEEN GRANTED |
|
| AK | Designated contracting states |
Kind code of ref document: B1 Designated state(s): AL AT BE BG CH CY CZ DE DK EE ES FI FR GB GR HR HU IE IS IT LI LT LU LV MC MK MT NL NO PL PT RO RS SE SI SK SM TR |
|
| REG | Reference to a national code |
Ref country code: GB Ref legal event code: FG4D |
|
| REG | Reference to a national code |
Ref country code: CH Ref legal event code: EP |
|
| REG | Reference to a national code |
Ref country code: CH Ref legal event code: EP |
|
| REG | Reference to a national code |
Ref country code: IE Ref legal event code: FG4D |
|
| REG | Reference to a national code |
Ref country code: DE Ref legal event code: R096 Ref document number: 602021033020 Country of ref document: DE |
|
| REG | Reference to a national code |
Ref country code: SE Ref legal event code: TRGR |
|
| PG25 | Lapsed in a contracting state [announced via postgrant information from national office to epo] |
Ref country code: FI Free format text: LAPSE BECAUSE OF FAILURE TO SUBMIT A TRANSLATION OF THE DESCRIPTION OR TO PAY THE FEE WITHIN THE PRESCRIBED TIME-LIMIT Effective date: 20250625 |
|
| REG | Reference to a national code |
Ref country code: LT Ref legal event code: MG9D |
|
| PG25 | Lapsed in a contracting state [announced via postgrant information from national office to epo] |
Ref country code: GR Free format text: LAPSE BECAUSE OF FAILURE TO SUBMIT A TRANSLATION OF THE DESCRIPTION OR TO PAY THE FEE WITHIN THE PRESCRIBED TIME-LIMIT Effective date: 20250926 Ref country code: NO Free format text: LAPSE BECAUSE OF FAILURE TO SUBMIT A TRANSLATION OF THE DESCRIPTION OR TO PAY THE FEE WITHIN THE PRESCRIBED TIME-LIMIT Effective date: 20250925 |
|
| PG25 | Lapsed in a contracting state [announced via postgrant information from national office to epo] |
Ref country code: BG Free format text: LAPSE BECAUSE OF FAILURE TO SUBMIT A TRANSLATION OF THE DESCRIPTION OR TO PAY THE FEE WITHIN THE PRESCRIBED TIME-LIMIT Effective date: 20250625 |
|
| PG25 | Lapsed in a contracting state [announced via postgrant information from national office to epo] |
Ref country code: HR Free format text: LAPSE BECAUSE OF FAILURE TO SUBMIT A TRANSLATION OF THE DESCRIPTION OR TO PAY THE FEE WITHIN THE PRESCRIBED TIME-LIMIT Effective date: 20250625 |
|
| PG25 | Lapsed in a contracting state [announced via postgrant information from national office to epo] |
Ref country code: RS Free format text: LAPSE BECAUSE OF FAILURE TO SUBMIT A TRANSLATION OF THE DESCRIPTION OR TO PAY THE FEE WITHIN THE PRESCRIBED TIME-LIMIT Effective date: 20250925 |
|
| PG25 | Lapsed in a contracting state [announced via postgrant information from national office to epo] |
Ref country code: LV Free format text: LAPSE BECAUSE OF FAILURE TO SUBMIT A TRANSLATION OF THE DESCRIPTION OR TO PAY THE FEE WITHIN THE PRESCRIBED TIME-LIMIT Effective date: 20250625 |
|
| REG | Reference to a national code |
Ref country code: NL Ref legal event code: MP Effective date: 20250625 |
|
| PG25 | Lapsed in a contracting state [announced via postgrant information from national office to epo] |
Ref country code: NL Free format text: LAPSE BECAUSE OF FAILURE TO SUBMIT A TRANSLATION OF THE DESCRIPTION OR TO PAY THE FEE WITHIN THE PRESCRIBED TIME-LIMIT Effective date: 20250625 |
|
| PG25 | Lapsed in a contracting state [announced via postgrant information from national office to epo] |
Ref country code: PT Free format text: LAPSE BECAUSE OF FAILURE TO SUBMIT A TRANSLATION OF THE DESCRIPTION OR TO PAY THE FEE WITHIN THE PRESCRIBED TIME-LIMIT Effective date: 20251027 |
|
| PG25 | Lapsed in a contracting state [announced via postgrant information from national office to epo] |
Ref country code: IS Free format text: LAPSE BECAUSE OF FAILURE TO SUBMIT A TRANSLATION OF THE DESCRIPTION OR TO PAY THE FEE WITHIN THE PRESCRIBED TIME-LIMIT Effective date: 20251025 |
|
| PG25 | Lapsed in a contracting state [announced via postgrant information from national office to epo] |
Ref country code: SM Free format text: LAPSE BECAUSE OF FAILURE TO SUBMIT A TRANSLATION OF THE DESCRIPTION OR TO PAY THE FEE WITHIN THE PRESCRIBED TIME-LIMIT Effective date: 20250625 |
|
| PG25 | Lapsed in a contracting state [announced via postgrant information from national office to epo] |
Ref country code: CZ Free format text: LAPSE BECAUSE OF FAILURE TO SUBMIT A TRANSLATION OF THE DESCRIPTION OR TO PAY THE FEE WITHIN THE PRESCRIBED TIME-LIMIT Effective date: 20250625 |
|
| PG25 | Lapsed in a contracting state [announced via postgrant information from national office to epo] |
Ref country code: PL Free format text: LAPSE BECAUSE OF FAILURE TO SUBMIT A TRANSLATION OF THE DESCRIPTION OR TO PAY THE FEE WITHIN THE PRESCRIBED TIME-LIMIT Effective date: 20250625 |
|
| PG25 | Lapsed in a contracting state [announced via postgrant information from national office to epo] |
Ref country code: EE Free format text: LAPSE BECAUSE OF FAILURE TO SUBMIT A TRANSLATION OF THE DESCRIPTION OR TO PAY THE FEE WITHIN THE PRESCRIBED TIME-LIMIT Effective date: 20250625 |
|
| PG25 | Lapsed in a contracting state [announced via postgrant information from national office to epo] |
Ref country code: SK Free format text: LAPSE BECAUSE OF FAILURE TO SUBMIT A TRANSLATION OF THE DESCRIPTION OR TO PAY THE FEE WITHIN THE PRESCRIBED TIME-LIMIT Effective date: 20250625 |
|
| PG25 | Lapsed in a contracting state [announced via postgrant information from national office to epo] |
Ref country code: ES Free format text: LAPSE BECAUSE OF FAILURE TO SUBMIT A TRANSLATION OF THE DESCRIPTION OR TO PAY THE FEE WITHIN THE PRESCRIBED TIME-LIMIT Effective date: 20250625 |
|
| PG25 | Lapsed in a contracting state [announced via postgrant information from national office to epo] |
Ref country code: DK Free format text: LAPSE BECAUSE OF FAILURE TO SUBMIT A TRANSLATION OF THE DESCRIPTION OR TO PAY THE FEE WITHIN THE PRESCRIBED TIME-LIMIT Effective date: 20250625 |
|
| PG25 | Lapsed in a contracting state [announced via postgrant information from national office to epo] |
Ref country code: IT Free format text: LAPSE BECAUSE OF FAILURE TO SUBMIT A TRANSLATION OF THE DESCRIPTION OR TO PAY THE FEE WITHIN THE PRESCRIBED TIME-LIMIT Effective date: 20250625 |
|
| PGFP | Annual fee paid to national office [announced via postgrant information from national office to epo] |
Ref country code: TR Payment date: 20260327 Year of fee payment: 6 |
|
| PLBE | No opposition filed within time limit |
Free format text: ORIGINAL CODE: 0009261 |
|
| STAA | Information on the status of an ep patent application or granted ep patent |
Free format text: STATUS: NO OPPOSITION FILED WITHIN TIME LIMIT |
|
| REG | Reference to a national code |
Ref country code: CH Ref legal event code: L10 Free format text: ST27 STATUS EVENT CODE: U-0-0-L10-L00 (AS PROVIDED BY THE NATIONAL OFFICE) Effective date: 20260507 |