EP4009032A1 - Capteur de particules avec discrimination interférente - Google Patents
Capteur de particules avec discrimination interférente Download PDFInfo
- Publication number
- EP4009032A1 EP4009032A1 EP21203006.8A EP21203006A EP4009032A1 EP 4009032 A1 EP4009032 A1 EP 4009032A1 EP 21203006 A EP21203006 A EP 21203006A EP 4009032 A1 EP4009032 A1 EP 4009032A1
- Authority
- EP
- European Patent Office
- Prior art keywords
- sensor
- detector
- source
- medium
- light
- Prior art date
- Legal status (The legal status is an assumption and is not a legal conclusion. Google has not performed a legal analysis and makes no representation as to the accuracy of the status listed.)
- Withdrawn
Links
- 239000002245 particle Substances 0.000 title claims abstract description 222
- 238000005259 measurement Methods 0.000 claims description 189
- 230000003287 optical effect Effects 0.000 claims description 132
- 238000010521 absorption reaction Methods 0.000 claims description 52
- 238000000034 method Methods 0.000 abstract description 156
- 238000009826 distribution Methods 0.000 abstract description 35
- 230000035945 sensitivity Effects 0.000 abstract description 35
- 238000002835 absorbance Methods 0.000 abstract description 19
- 230000002829 reductive effect Effects 0.000 abstract description 17
- 230000002452 interceptive effect Effects 0.000 abstract description 16
- 238000013507 mapping Methods 0.000 abstract description 10
- 239000000725 suspension Substances 0.000 abstract description 5
- 239000002609 medium Substances 0.000 description 200
- 239000000835 fiber Substances 0.000 description 143
- 239000002028 Biomass Substances 0.000 description 125
- 238000000926 separation method Methods 0.000 description 80
- 240000004808 Saccharomyces cerevisiae Species 0.000 description 65
- 235000014680 Saccharomyces cerevisiae Nutrition 0.000 description 65
- 238000001514 detection method Methods 0.000 description 60
- 239000000523 sample Substances 0.000 description 41
- 210000004027 cell Anatomy 0.000 description 36
- 239000000463 material Substances 0.000 description 32
- 230000035515 penetration Effects 0.000 description 32
- 230000006870 function Effects 0.000 description 29
- 239000013307 optical fiber Substances 0.000 description 27
- 238000012360 testing method Methods 0.000 description 27
- XLYOFNOQVPJJNP-UHFFFAOYSA-N water Substances O XLYOFNOQVPJJNP-UHFFFAOYSA-N 0.000 description 26
- 230000005587 bubbling Effects 0.000 description 25
- 230000000694 effects Effects 0.000 description 25
- 238000013019 agitation Methods 0.000 description 24
- 239000007789 gas Substances 0.000 description 24
- 230000005855 radiation Effects 0.000 description 19
- 238000012937 correction Methods 0.000 description 18
- 230000008901 benefit Effects 0.000 description 17
- 230000003247 decreasing effect Effects 0.000 description 15
- 238000012544 monitoring process Methods 0.000 description 15
- FAPWRFPIFSIZLT-UHFFFAOYSA-M Sodium chloride Chemical compound [Na+].[Cl-] FAPWRFPIFSIZLT-UHFFFAOYSA-M 0.000 description 12
- 239000011521 glass Substances 0.000 description 11
- 239000012925 reference material Substances 0.000 description 11
- 230000004044 response Effects 0.000 description 11
- 230000007423 decrease Effects 0.000 description 10
- 238000012545 processing Methods 0.000 description 10
- 108090000623 proteins and genes Proteins 0.000 description 10
- 102000004169 proteins and genes Human genes 0.000 description 9
- NRTOMJZYCJJWKI-UHFFFAOYSA-N Titanium nitride Chemical compound [Ti]#N NRTOMJZYCJJWKI-UHFFFAOYSA-N 0.000 description 8
- 230000009286 beneficial effect Effects 0.000 description 8
- 238000005253 cladding Methods 0.000 description 8
- 239000012530 fluid Substances 0.000 description 8
- 239000007788 liquid Substances 0.000 description 8
- 244000005700 microbiome Species 0.000 description 8
- 239000004033 plastic Substances 0.000 description 8
- 229920003023 plastic Polymers 0.000 description 8
- 230000003595 spectral effect Effects 0.000 description 8
- 239000010935 stainless steel Substances 0.000 description 8
- 229910001220 stainless steel Inorganic materials 0.000 description 8
- 230000008859 change Effects 0.000 description 7
- 238000001228 spectrum Methods 0.000 description 7
- 238000003756 stirring Methods 0.000 description 7
- 238000007654 immersion Methods 0.000 description 6
- 230000007246 mechanism Effects 0.000 description 6
- 102000009027 Albumins Human genes 0.000 description 5
- 108010088751 Albumins Proteins 0.000 description 5
- 239000011248 coating agent Substances 0.000 description 5
- 238000000576 coating method Methods 0.000 description 5
- 239000000470 constituent Substances 0.000 description 5
- 239000007787 solid Substances 0.000 description 5
- 230000009466 transformation Effects 0.000 description 5
- 238000012935 Averaging Methods 0.000 description 4
- 241000588724 Escherichia coli Species 0.000 description 4
- 238000009825 accumulation Methods 0.000 description 4
- QVGXLLKOCUKJST-UHFFFAOYSA-N atomic oxygen Chemical compound [O] QVGXLLKOCUKJST-UHFFFAOYSA-N 0.000 description 4
- 230000005540 biological transmission Effects 0.000 description 4
- 238000004891 communication Methods 0.000 description 4
- 230000001419 dependent effect Effects 0.000 description 4
- 238000010790 dilution Methods 0.000 description 4
- 239000012895 dilution Substances 0.000 description 4
- 230000004907 flux Effects 0.000 description 4
- 230000012010 growth Effects 0.000 description 4
- 238000005286 illumination Methods 0.000 description 4
- 238000004519 manufacturing process Methods 0.000 description 4
- 238000002156 mixing Methods 0.000 description 4
- 239000000203 mixture Substances 0.000 description 4
- 229910052760 oxygen Inorganic materials 0.000 description 4
- 239000001301 oxygen Substances 0.000 description 4
- 230000010287 polarization Effects 0.000 description 4
- 230000008569 process Effects 0.000 description 4
- 238000003672 processing method Methods 0.000 description 4
- 238000005070 sampling Methods 0.000 description 4
- 238000012795 verification Methods 0.000 description 4
- ZVWKZXLXHLZXLS-UHFFFAOYSA-N zirconium nitride Chemical compound [Zr]#N ZVWKZXLXHLZXLS-UHFFFAOYSA-N 0.000 description 4
- 241000894006 Bacteria Species 0.000 description 3
- 229910000530 Gallium indium arsenide Inorganic materials 0.000 description 3
- RTAQQCXQSZGOHL-UHFFFAOYSA-N Titanium Chemical compound [Ti] RTAQQCXQSZGOHL-UHFFFAOYSA-N 0.000 description 3
- 238000004458 analytical method Methods 0.000 description 3
- 239000012736 aqueous medium Substances 0.000 description 3
- 239000012620 biological material Substances 0.000 description 3
- 238000004113 cell culture Methods 0.000 description 3
- 238000006243 chemical reaction Methods 0.000 description 3
- 230000002596 correlated effect Effects 0.000 description 3
- 230000000875 corresponding effect Effects 0.000 description 3
- 239000000499 gel Substances 0.000 description 3
- 230000003993 interaction Effects 0.000 description 3
- 230000000670 limiting effect Effects 0.000 description 3
- 230000000116 mitigating effect Effects 0.000 description 3
- 239000013618 particulate matter Substances 0.000 description 3
- 239000012071 phase Substances 0.000 description 3
- 239000000243 solution Substances 0.000 description 3
- 239000010936 titanium Substances 0.000 description 3
- 229910052719 titanium Inorganic materials 0.000 description 3
- 229910052720 vanadium Inorganic materials 0.000 description 3
- CURLTUGMZLYLDI-UHFFFAOYSA-N Carbon dioxide Chemical compound O=C=O CURLTUGMZLYLDI-UHFFFAOYSA-N 0.000 description 2
- 229920000148 Polycarbophil calcium Polymers 0.000 description 2
- XUIMIQQOPSSXEZ-UHFFFAOYSA-N Silicon Chemical compound [Si] XUIMIQQOPSSXEZ-UHFFFAOYSA-N 0.000 description 2
- 101150093559 TRIM2 gene Proteins 0.000 description 2
- 241000700605 Viruses Species 0.000 description 2
- 210000004102 animal cell Anatomy 0.000 description 2
- 238000003556 assay Methods 0.000 description 2
- 230000002238 attenuated effect Effects 0.000 description 2
- 230000010261 cell growth Effects 0.000 description 2
- 238000011109 contamination Methods 0.000 description 2
- 230000001276 controlling effect Effects 0.000 description 2
- 230000008878 coupling Effects 0.000 description 2
- 238000010168 coupling process Methods 0.000 description 2
- 238000005859 coupling reaction Methods 0.000 description 2
- 238000013461 design Methods 0.000 description 2
- 238000009630 liquid culture Methods 0.000 description 2
- 230000014759 maintenance of location Effects 0.000 description 2
- 239000002105 nanoparticle Substances 0.000 description 2
- 238000010606 normalization Methods 0.000 description 2
- 238000005457 optimization Methods 0.000 description 2
- 230000005693 optoelectronics Effects 0.000 description 2
- 238000012856 packing Methods 0.000 description 2
- 229920000515 polycarbonate Polymers 0.000 description 2
- 229920000139 polyethylene terephthalate Polymers 0.000 description 2
- 239000005020 polyethylene terephthalate Substances 0.000 description 2
- 229920000642 polymer Polymers 0.000 description 2
- 238000012552 review Methods 0.000 description 2
- 238000012883 sequential measurement Methods 0.000 description 2
- 229910052710 silicon Inorganic materials 0.000 description 2
- 239000010703 silicon Substances 0.000 description 2
- 239000000779 smoke Substances 0.000 description 2
- 230000000087 stabilizing effect Effects 0.000 description 2
- BQCIDUSAKPWEOX-UHFFFAOYSA-N 1,1-Difluoroethene Chemical compound FC(F)=C BQCIDUSAKPWEOX-UHFFFAOYSA-N 0.000 description 1
- QCVGEOXPDFCNHA-UHFFFAOYSA-N 5,5-dimethyl-2,4-dioxo-1,3-oxazolidine-3-carboxamide Chemical compound CC1(C)OC(=O)N(C(N)=O)C1=O QCVGEOXPDFCNHA-UHFFFAOYSA-N 0.000 description 1
- 102000002322 Egg Proteins Human genes 0.000 description 1
- 108010000912 Egg Proteins Proteins 0.000 description 1
- 241000233866 Fungi Species 0.000 description 1
- 229920006370 Kynar Polymers 0.000 description 1
- 239000004425 Makrolon Substances 0.000 description 1
- 239000004809 Teflon Substances 0.000 description 1
- 229920006362 Teflon® Polymers 0.000 description 1
- 229910052770 Uranium Inorganic materials 0.000 description 1
- 238000000862 absorption spectrum Methods 0.000 description 1
- 230000001154 acute effect Effects 0.000 description 1
- 230000001464 adherent effect Effects 0.000 description 1
- 229910052782 aluminium Inorganic materials 0.000 description 1
- XAGFODPZIPBFFR-UHFFFAOYSA-N aluminium Chemical compound [Al] XAGFODPZIPBFFR-UHFFFAOYSA-N 0.000 description 1
- 230000003321 amplification Effects 0.000 description 1
- 230000003698 anagen phase Effects 0.000 description 1
- 230000035559 beat frequency Effects 0.000 description 1
- 235000013405 beer Nutrition 0.000 description 1
- 230000006399 behavior Effects 0.000 description 1
- 239000002551 biofuel Substances 0.000 description 1
- 230000015572 biosynthetic process Effects 0.000 description 1
- 238000004364 calculation method Methods 0.000 description 1
- 229910002092 carbon dioxide Inorganic materials 0.000 description 1
- 239000001569 carbon dioxide Substances 0.000 description 1
- 230000001413 cellular effect Effects 0.000 description 1
- 210000000991 chicken egg Anatomy 0.000 description 1
- 230000001010 compromised effect Effects 0.000 description 1
- 238000010276 construction Methods 0.000 description 1
- 238000002425 crystallisation Methods 0.000 description 1
- 230000008025 crystallization Effects 0.000 description 1
- 238000011161 development Methods 0.000 description 1
- 230000018109 developmental process Effects 0.000 description 1
- 230000003467 diminishing effect Effects 0.000 description 1
- 230000009977 dual effect Effects 0.000 description 1
- 235000014103 egg white Nutrition 0.000 description 1
- 230000005284 excitation Effects 0.000 description 1
- 238000002474 experimental method Methods 0.000 description 1
- 238000013213 extrapolation Methods 0.000 description 1
- 238000000855 fermentation Methods 0.000 description 1
- 238000005187 foaming Methods 0.000 description 1
- 238000003306 harvesting Methods 0.000 description 1
- 230000006872 improvement Effects 0.000 description 1
- 239000010954 inorganic particle Substances 0.000 description 1
- 230000001678 irradiating effect Effects 0.000 description 1
- 238000011005 laboratory method Methods 0.000 description 1
- 230000002045 lasting effect Effects 0.000 description 1
- 239000007791 liquid phase Substances 0.000 description 1
- 239000006194 liquid suspension Substances 0.000 description 1
- 229920002521 macromolecule Polymers 0.000 description 1
- 239000012092 media component Substances 0.000 description 1
- QSHDDOUJBYECFT-UHFFFAOYSA-N mercury Chemical compound [Hg] QSHDDOUJBYECFT-UHFFFAOYSA-N 0.000 description 1
- 229910052751 metal Inorganic materials 0.000 description 1
- 239000002184 metal Substances 0.000 description 1
- 230000000813 microbial effect Effects 0.000 description 1
- 239000008267 milk Substances 0.000 description 1
- 235000013336 milk Nutrition 0.000 description 1
- 210000004080 milk Anatomy 0.000 description 1
- 238000012986 modification Methods 0.000 description 1
- 230000004048 modification Effects 0.000 description 1
- 230000003121 nonmonotonic effect Effects 0.000 description 1
- 238000003199 nucleic acid amplification method Methods 0.000 description 1
- 239000003960 organic solvent Substances 0.000 description 1
- 230000036961 partial effect Effects 0.000 description 1
- 230000002093 peripheral effect Effects 0.000 description 1
- 239000004417 polycarbonate Substances 0.000 description 1
- -1 polyethylene terephthalate Polymers 0.000 description 1
- 238000006116 polymerization reaction Methods 0.000 description 1
- 238000007781 pre-processing Methods 0.000 description 1
- 238000011002 quantification Methods 0.000 description 1
- 238000004445 quantitative analysis Methods 0.000 description 1
- 230000009467 reduction Effects 0.000 description 1
- 238000000611 regression analysis Methods 0.000 description 1
- 238000011160 research Methods 0.000 description 1
- 239000011780 sodium chloride Substances 0.000 description 1
- 239000008279 sol Substances 0.000 description 1
- 239000002904 solvent Substances 0.000 description 1
- 238000003860 storage Methods 0.000 description 1
- 239000000126 substance Substances 0.000 description 1
- 238000010408 sweeping Methods 0.000 description 1
- 230000001360 synchronised effect Effects 0.000 description 1
- 239000012780 transparent material Substances 0.000 description 1
- 238000009966 trimming Methods 0.000 description 1
- WFKWXMTUELFFGS-UHFFFAOYSA-N tungsten Chemical compound [W] WFKWXMTUELFFGS-UHFFFAOYSA-N 0.000 description 1
- 229910052721 tungsten Inorganic materials 0.000 description 1
- 239000010937 tungsten Substances 0.000 description 1
- 238000007740 vapor deposition Methods 0.000 description 1
Images


Classifications
-
- G—PHYSICS
- G01—MEASURING; TESTING
- G01N—INVESTIGATING OR ANALYSING MATERIALS BY DETERMINING THEIR CHEMICAL OR PHYSICAL PROPERTIES
- G01N15/00—Investigating characteristics of particles; Investigating permeability, pore-volume or surface-area of porous materials
- G01N15/06—Investigating concentration of particle suspensions
-
- G—PHYSICS
- G01—MEASURING; TESTING
- G01N—INVESTIGATING OR ANALYSING MATERIALS BY DETERMINING THEIR CHEMICAL OR PHYSICAL PROPERTIES
- G01N21/00—Investigating or analysing materials by the use of optical means, i.e. using sub-millimetre waves, infrared, visible or ultraviolet light
- G01N21/17—Systems in which incident light is modified in accordance with the properties of the material investigated
- G01N21/47—Scattering, i.e. diffuse reflection
- G01N21/49—Scattering, i.e. diffuse reflection within a body or fluid
- G01N21/51—Scattering, i.e. diffuse reflection within a body or fluid inside a container, e.g. in an ampoule
-
- C—CHEMISTRY; METALLURGY
- C12—BIOCHEMISTRY; BEER; SPIRITS; WINE; VINEGAR; MICROBIOLOGY; ENZYMOLOGY; MUTATION OR GENETIC ENGINEERING
- C12M—APPARATUS FOR ENZYMOLOGY OR MICROBIOLOGY; APPARATUS FOR CULTURING MICROORGANISMS FOR PRODUCING BIOMASS, FOR GROWING CELLS OR FOR OBTAINING FERMENTATION OR METABOLIC PRODUCTS, i.e. BIOREACTORS OR FERMENTERS
- C12M41/00—Means for regulation, monitoring, measurement or control, e.g. flow regulation
- C12M41/30—Means for regulation, monitoring, measurement or control, e.g. flow regulation of concentration
- C12M41/36—Means for regulation, monitoring, measurement or control, e.g. flow regulation of concentration of biomass, e.g. colony counters or by turbidity measurements
-
- G—PHYSICS
- G01—MEASURING; TESTING
- G01N—INVESTIGATING OR ANALYSING MATERIALS BY DETERMINING THEIR CHEMICAL OR PHYSICAL PROPERTIES
- G01N15/00—Investigating characteristics of particles; Investigating permeability, pore-volume or surface-area of porous materials
- G01N15/06—Investigating concentration of particle suspensions
- G01N15/075—Investigating concentration of particle suspensions by optical means
Definitions
- Methods and devices for accurately measuring particulate concentrations in a suspension e.g. biomass in a liquid cell culture, that may include moving interfering objects, such as bubbles, and stationary interfering objects, such as immersed sensors.
- Measurements of particle concentration are made, e.g., by detection of near infrared (NIR) back-scattered light.
- Detected signals can be related to, e.g., particle concentration, biomass, or standard O.D. 600 nm values.
- Measurement of particle concentration is important in many industrial and research applications. For example, monitoring cell density (e.g. biomass) in liquid cell cultures is used: to determine the growth phase or rate; as a feedback signal for adjusting growth conditions (e.g. dissolved oxygen, pH, media constituents); and/or as an indicator of when to induce expression of genes, harvest cells, or inoculate cells into a larger media volume.
- growth conditions e.g. dissolved oxygen, pH, media constituents
- the growth rate of many cultures, particularly microbial organisms e.g. yeast, bacteria
- the culture of such organisms is often performed in vessels (e.g.
- biomass monitoring techniques take advantage of the scattering of light by cells.
- one of the most common laboratory techniques for monitoring cell growth is to extract a sample, dilute it, and measure it's absorbance (e.g. at 600 nm) in a fixed path length (e.g. 1 cm) cell in a spectrophotometer.
- Absorbance is typically limited to about 0.5 in order to remain in the linear range of Beer's Law.
- the measured absorbance multiplied by the dilution factor is referred to as the optical density (e.g. "OD(600nm)", and used as an indication of biomass.
- this technique has numerous limitations: it requires opening the culture, with the attendant risk of contamination; the dilution step is subject to volumetric error; the extracted sample is expended, of particular concern in small volume cultures; and it is labor-intensive.
- An optical sensor for accurately measuring the concentration of particles suspended in a medium while mitigating interference from other objects in the medium consists of one or more light sources and one or more detectors contained in a housing.
- the light sources and detectors are selected to emit and detect light in a spectral region that is substantially absorbed by the medium, thereby confining the measurement to a restricted volume within the medium.
- statistical measures of the central value and distribution of the detected light signal are combined to provide discrimination between particle types. Additionally described are methods and devices for accurately determining the particle concentration over a wide range of particle concentrations.
- Methods of the invention can include selecting the source wavelength to have a mean absorption path length in the medium that is substantially greater than the separation between the central optical axes of the light source and detector at the interface with the medium, while at the same time being substantially smaller than the distance between the optical interface with the medium and the nearest potentially interfering stationary object falling within the emission cone of the light source.
- the medium is aqueous and the suspended particle to be measured is biological (i.e. cells, micro-organisms, etc.)
- selection of source wavelength(s) having sufficient absorbance by water so that the emitted light is substantially attenuated before interacting with non-biological objects in the container prevents these objects from influencing measurement of the biological particles.
- the source-detector separation By also selecting the source-detector separation to be substantially less than the mean absorption path length, a wide range of sensitivity to changes in biological particle concentration is allowed.
- the medium includes more than one type of particle, and discrimination between the particle types is enabled.
- the detection bandwidth and measurement volume are restricted so that signal fluctuations due to a second particle type of particle are observed, whereas the signal due to a first particle type is substantially constant at a given concentration.
- the medium is aqueous and the first particle type is a biological particle and the second particle type is a gas bubble.
- the measurement volume and detection bandwidth are selected so that the fluctuations due to gas bubbles are detected as the number or size of the bubbles within the measurement field varies.
- the biological particles within the same measurement volume may be substantially smaller and more numerous than the gas bubbles, so that the detected fluctuations due to the biological particles is substantially less than that of the bubbles.
- the detected signals as characterized according to their central value.
- the method for determining the central value has reduced sensitivity to outliers compared to the mean. Examples of such methods are the median, mode, and trimmed mean. Such methods may provide the ability to discriminate between different particle types, particularly in situations where the particle types have different signal distributions.
- the detected signals are further characterized according to their distribution. The central value and distribution estimates may be combined to determine the concentration of a particle type, while being substantially insensitive to the concentration of another particle type.
- the methods can further include a means of detecting the position or orientation of the sensor relative to the container, or providing means of reducing the sensitivity of the measurement result to variations in the thickness of the window.
- the method can include providing means of detecting the position and orientation of the sensor relative to the container.
- one or more position switches can provide means to determine the position or orientation of the sensor relative to the container.
- one or more capacitance switches can provide a means to determine the position or orientation of the sensor relative to the container.
- the capacitance switches can be used to determine that a sufficient volume of medium is present in the vicinity of the sensor for a particle concentration measurement to be made accurately.
- the position or orientation can be determined using optical components, such as a light source and detector.
- radiation sources and sensors are positioned symmetrically about their counterpart.
- at least two sources can be positioned symmetrically with respect to a detector component, or vice versa.
- Such devices can reduce inconsistent detections or detect positioning errors during analysis of a sample.
- the two symmetrically positioned optical elements can provide a means of determining whether sufficient medium is present in order to make an accurate measurement of particle concentration.
- Comparison of the two or more measurements may also provide a means of detecting obstructions or interferences at or near the optical interface. For example a stationary bubble or debris in the vicinity of the optical elements may have different effect on the measurements at different locations. Such comparison may be useful for excluding or reducing the influence of measurements made under conditions where such interferents are present.
- the radiation is detected as back-scattered light and the result is converted to an optical density readout.
- absorbing components of the medium being analyzed include water.
- a means for subtracting a measurement of blank media from a measurement of media containing particulate matter.
- coefficients can be input or determined relating detected signals to the particle concentration measurement.
- it is beneficial to provide a means of checking for or correcting for proper instrument performance e.g., by providing duplicate measurements, measurements from different light paths, comparison to standard references, comparison to controls, etc.
- a guide for guiding the sensor into a desired alignment with the container.
- the guide includes a U or V-shaped feature in one dimension and a substantially flat feature in a second dimension, e.g., to align the sensor relative to the axis of a sample container.
- spring force is used to hold the guide against the sensor.
- the guide is located on the opposite side of the container from the sensor, so that multiple different container sizes may be automatically accommodated.
- the senor consists of at least one near-infrared laser light source emitting near 1550 nm, and at least one optical reflectance detector.
- the sensor is held against the wall of a vessel, such as a test tube, containing cells or microorganisms suspended in an aqueous medium.
- Laser light is directed through the wall of the vessel into the medium and is scattered by the cells or microorganisms.
- the 1550 nm light is partially absorbed by water in the medium.
- the relationship between Optical Density and the reflectance signal measured by the sensor is stored as a calibration in the instrument, which may vary according to the type of cell or microorganism being grown in the medium.
- a baseline offset is provided to allow compensation for the contribution of the medium to the measured Optical Density.
- the radiation source emits light at a frequency ranging from about 650 nm to 2200 nm, from 700 nm to 2000 nm, from 800 nm to 1800 nm, from 1000 nm to 1600 nm, or about 1500 nm.
- the source provides light radiation in the infrared wavelengths.
- the source provides radiation ranging between 1150 nm and 1350 nm.
- the source emits light at a wavelength between 920 and 1150 nm, or between 350 and 1900 nm.
- a second reflectance or scatter detector is arranged symmetrically with respect to a first reflectance detector, as a means to determine proper sensor positioning. Comparison of the processed signals from the two detectors ensures that the measurement is being made from within a sufficient depth of fluid to provide accurate determination of particle concentration, and that interfering objects are not present at or near interface between the sensor and container.
- additional detectors are spaced at a different distance from the laser to extend the linear range of response to changes in particle concentration.
- the reflectance detectors are held at the end of apertures constructed from a material, which is strongly absorptive of light emitted by the source.
- the optic axes of the laser and reflectance detectors may be oriented parallel to each other, and the divergence and collection angles restricted, so as to minimize sensitivity to vessel wall thickness and restrict the measurement volume within the medium.
- the senor includes at least one position detector.
- the position detector(s) on the sensor face provide a means of determining when proper sensor positioning has been achieved, and can also be used to trigger a measurement and to help determine whether a measurement has been successfully completed.
- the position sensor includes at least one position switch.
- the position sensor includes at least one capacitance sensor.
- the capacitance sensor is used to determine whether sufficient medium is present in the vessel in proximity to the sensor in order for an accurate measurement to be collected.
- the position sensing is performed using optical components.
- the concentration is reported as an Optical Density (OD) such as would be reported by a spectrophotometer at a particular wavelength (e.g., 600 nm) through a 1 cm path length cell containing a dilute solution of the medium, after multiplication by the dilution factor.
- OD Optical Density
- the concentration is reported as standard turbidity units (e.g., NFUs), dry or wet weight per volume (e.g., g/mL), cells counts per volume (e.g., cell/mL), or any user-defined value, related to particle concentration.
- the type of units in which the result is reported is user-selectable.
- the light scatter by particles in the methods can be detected by any appropriate type of detector.
- detection can be by a photomultiplier tube, photodiode, or photodiode array.
- at least one of the detectors employs silicon in active detector area of its sensor.
- at least one of the detectors employs InGaAs in its active area.
- the illumination source in the methods can be any appropriate means, such as, e.g., a laser, a tungsten lamp, mercury vapor lamp, LED, diode lasers and/or the like.
- a monitoring diode is built into the illumination source, and is used to compensate for changes in radiant flux emitted by the source, e.g., a laser monitoring detector is used to directly measure the output of the laser, providing a means of compensating for intensity variation such as may be caused by temperature fluctuations.
- a bar code scanner is built into the device and used to track the measurements, e.g., the identification of samples.
- it can be useful to have information transferred wirelessly, e.g., the measured particle concentration can be wirelessly transferred to an ancillary or peripheral device.
- a concentration of at least one type of particle in a medium is determined by positioning a sensor next to a container holding the medium, passing radiation originating from at least one source through the container wall into the medium that substantially absorbs the radiation, detecting with at least one detector a signal relating to radiation reflected from within said medium back through the container wall, and relating the detected radiation signals to the concentration of a particle in the medium.
- the inventions include devices for detecting and measuring the concentration of particles in a container.
- the device for determining the concentration of at least one type of particle in a medium includes, e.g., a housing containing a sensor, including at least one radiation source and at least one radiation detector positioned to collect source radiation scattered by particles within said medium, wherein the radiation emitted by the source is substantially absorbed by the medium.
- the device further comprises a controller for controlling the radiation sources, and for measuring at least one of the signals corresponding to the portion of radiation detected by one of the detectors that originated from the radiation sources.
- the device typically also includes a processor configured to relate at least one of the signals to a concentration of at least one type of particle.
- the device sensor can be configured to be well-adapted to taking measurements from any number of different containers or vessels.
- the sensor housing can be attached to a disposable fermentor, bioreactor, flask, bottle, bag, or tube.
- the sensor housing can be affixed to a vessel, providing the capability of making multiple measurements without the need for reapplication of the sensor to the vessel. Multiple sensors can be interfaced with the same controller.
- the sensor housing is designed to be disposable.
- Radiation sources or detectors can be fiber optical components optically linked to electro-optical components that are physically separated from said housing.
- fiber optics are used to convey light between the sensor and electro-optical components.
- fiber optics splitters and/or switchers are used to multiplex the electro-optical components between multiple fibers.
- the device can be configured to take particle concentration measurements.
- the time required for measurement of particle concentration is three seconds or less.
- the measurement time is variable, as determined by a metric related to measurement accuracy.
- signals are combined from source-detector pairs with at least two different separation distances.
- at least two of the radiation sources have substantially different emission wavelengths.
- the source wavelengths can be selected according to the separation between the source-detector pairs.
- the senor is immersed in the medium.
- the materials comprising the sensor face include glass.
- the glass is curved so as to discourage the accumulation of objects on the exposed surface.
- the use of a glass face, particularly with a curved shape discourages the accumulation of gas bubbles or debris on the exposed surface.
- the materials comprising the sensor face include stainless steel that has been coated with a material, such as titanium or zirconium nitride, that discourages the accumulation of bubbles or biological material on the sensor surface.
- fiber optics are used to aid in the transport of light from the light source(s) and to the detector(s). This may allow the optical components to be positioned remotely from the point of optical interface with the medium.
- the sensors described herein include some embodiments in which the light source and detector are physically located within the sensor ("free-space embodiments"), and other embodiments in which the light source and detector are located outside of the sensor, and light is conveyed to and from the sensor through the use of fiber optics, which may include single fibers or bundles of fibers (“fiber-optic embodiments").
- fiber optics which may include single fibers or bundles of fibers.
- an "absorption coefficient" of a medium is the negative of the logarithm of the ratio of light transmitted through the medium to the light transmitted in the absence of the medium, divided by the path length travelled through the medium.
- an "detection cone" of a detector is the cone of detection rays surrounding the central optical axis of the detector at which the detected intensity is half that detected at the central optical axis.
- an "emission cone" of a light source is the cone of emission rays surrounding the central optical axis of the light source at which the light source intensity is half that at that the central optical axis.
- a "mean absorption path length" in a medium is the inverse of the absorption coefficient of the medium.
- a “sensor” of the methods and devices is a device component comprising at least one light source-detector pair in functional association.
- modulated means to vary the amplitude, frequency, or phase of a light source.
- substantially refers to largely or predominantly, but not necessarily entirely, that which is specified.
- biomass refers to the concentration of biological material, such as cells or microorganisms. What is meant here and elsewhere in the patent application by “concentration” is the number of a type of particle, weight of a type of material, or volume of a type of material found in a given volume or weight of a medium.
- the method(s) and instrument(s) of the present invention may also find application in liquid suspensions of solids other than biomass as well as in solutions.
- the particulate content in milk, the rate of polymerization in a chemical system or the turbidity of water may be measured by application of the method(s) and/or instrument(s) of the present invention.
- the present invention may be utilized to determine the amount of gas in a liquid phase, such as the concentration of gas bubbles in a liquid medium.
- the attenuation of radiation by absorption may be used to measure the concentration of components dissolved in solution, by application of the present invention.
- the method and instruments of the present invention may also be useable in the gas phase.
- the amount or concentration of a specific component of the effluent gas may be measured by application of the present invention.
- the present invention may be used to measure the particulate content of a gas for the purpose of smoke or fire detection.
- the present invention may be used to measure the concentration of a particular component of a gas, such as the concentration of carbon dioxide in a mixture of gases or the density of fog or smoke in the flight path of an airplane.
- the method(s) and/or instrument(s) of the present invention may be utilized to monitor materials in the solid state and to monitor transformation of materials between states.
- the present invention may be used to monitor the conversion of a liquid to the solid state, such as gel formation, or crystallization.
- a liquid to the solid state such as gel formation, or crystallization.
- the present methods are generally directed to techniques of illuminating a particulate suspension and determining the particulate concentration in correlation to the amount of back- scattered light. Methods for reducing or avoiding the influence of potential interferents are also provided.
- sources of interference may include objects submerged within the medium, such as other sensors, agitators, sparge tubes, and stirring baffles, as well as the wall of the container holding the medium.
- Another source of interference may be the presence of one or more additional particle types, such as bubbles, or un-dissolved media constituents.
- the methods comprise using an optical sensor to determine the concentration of particles in a liquid medium held within a container.
- the medium is irradiated with a light source in the sensor.
- the light source has an emission wavelength that is absorbed by the medium, as characterized by a mean absorption path length.
- the sensor also includes one or more detectors that detect source light scattered by particles in the medium.
- the spatial separation between the central optical axes of the light source and detector at the optical interface with the medium is substantially less than the mean absorption path length.
- the distance between the optical interface with the medium and the nearest potentially interfering stationary object falling within the emission cone of the light source is substantially greater than the mean absorption path length.
- the nearest stationary object can be considered not to include a container wall on the container side through which the media is being illuminated and/or detected. The detected light is then correlated to the concentration of particles in the medium.
- absorption of the source light by water may influence the mean absorption path length (1/ ⁇ ⁇ ).
- the mean absorption path length will in turn influence the maximum optical penetration depth - the maximum depth into the medium that the source may penetrate before being attenuated below the detection limit.
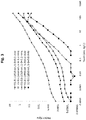
- the source wavelength consists of infrared light that is absorbed by the medium. An example of the influence of the infrared light source wavelength on the optical penetration depth is provided in Example 1 and depicted in Figure 2 .
- the penetration depth is limited to about 6 mm.
- the penetration depth is about 30 mm. Note that the penetration depth is also influenced to some extent by the source-detector separation, but in this example the choice of source wavelength has a stronger influence.
- the maximum optical penetration depth is also influenced by the particle concentration in the medium, with the penetration depth typically decreasing with increasing particle concentration, such as shown in Figure 2 .
- the maximum optical penetration can alternately be considered as the minimum allowable distance between the optical interface of the sensor with the medium and any potentially interfering objects in the vessel containing the medium (which may include the vessel itself).
- mean absorption path length multiples of about 4, 5, and 7, respectively for source wavelengths of 980, 1310, and 1550 nm, are appropriate for selecting the minimum distance to potentially interfering objects in the medium, when it is desired to determine particle concentration in the lowest concentration range.
- This path length multiplier can be decreased if the range of biomass concentrations to be measured is restricted to a higher concentration range.
- an appropriate multiplier may be in the range of 3-5 or 1-3, respectively.
- a collar is placed on an immersible probe to aid the user in achieving a pre-determined depth in the vessel during assembly of the probe onto the vessel.
- the position of this collar is adjustable, according to the vessel size being used. The collar position is pre-set during manufacturer for use on a particular vessel type but may be adjusted by the user for other vessel types.
- markings are provided on the probe to indicate the collar position that is most appropriate for particular vessels types or sizes.
- the choice of the source-detector separation can have a strong influence on the range of particle concentration that is measureable.
- the sensor By configuring the sensor so that the separation between the light source and detector is small compared to the mean absorption path length in the medium, a wide range of particle concentrations may be measureable with the same source-detector pair. Further, the linearity of the measured reflectance signal may be increased by keeping the source-detector separation small. Measurements at two source wavelengths (1310 and 1550 nm) and several source-detector separations (-0.2, ⁇ 1, and ⁇ 3 mm) are described in Example 2.
- the range of sensitivity to changes in biomass concentration was limited compared to those configurations where the source-detector separation was selected to be substantially less than the mean absorption path length (e.g. S 1-D1 or S2-D1).
- the source-detector separation in order to achieve the widest range of biomass sensitivity, it will be beneficial to select the source-detector separation to be at least two times smaller than the mean absorption path length. In other embodiments even higher factors may be beneficial.
- the configurations showing the widest range of sensitivity to biomass changes, Sl-Dl and S2-D1 had source-detector separations that were, respectively, 30 and 4 times smaller than the mean absorption path length.
- the method comprises determining the concentration in a medium of a first particle type in the presence of a second particle type.
- the method includes the steps of passing light originating from a first light source into the medium, and detecting a first light signal originating from the first light source that was reflected from within the medium.
- a first statistical measure is computed that is related to the central value of the signal, wherein the statistical measure has reduced dependence on outliers compared to the mean of the signal.
- the first statistical measure is then used to determine the concentration of the first particle type in the medium, with substantially reduced dependence of the concentration of the second particle type compared to that obtained by using the mean as the statistical measure.
- Examples of statistical measures with reduced dependence on outliers compared to the mean include the trimmed mean, mode, and median.
- the trimmed mean is computed by sorting the data, discarding upper and lower ranges of the sorted data, and computing the mean of the remaining points.
- the trimming percentage may vary according to the application, but as an example, the upper and lower quartile of the data may be discarded ("25% trimmed mean") before computing the mean.
- the mode may be computed as a single mode or as multiple modes. In such cases, the mode value that is selected may depend on the application. In many applications the minimum mode value in a multi-mode distribution is selected. In many applications the number of bins in the histogram used to compute the mode may also be variable.
- the number of bins may be adjusted according different statistical estimates of the distribution and central value of the data.
- one method for determining the number of bins is to divide the full range by the interquartile range with appropriate scaling and offsetting.
- the interquartile range is the difference between the values of the data points at the 25 th and 75 th percentiles of a sorted data set.
- Example 4 An example of the reduced dependence of biomass estimation on the influence of bubbles based on statistical measures other than the mean is provided in Example 4.
- the data depicted in Figures 5d and 5e were collected over a wide range of yeast concentrations, agitation rates, and sparge (bubbling) rates. Each different biomass concentration is depicted with a different symbol.
- Comparison of the mean values in Figure 5d with the median values in Figure 5e make it evident that the median value at each biomass is less affected by changes in agitation and sparging, than is the mean value. This is particularly evident in the low biomass range ( ⁇ 1 g/L). For example compare the range of mean values observed at a biomass value of 0.2 g/L in Figure 5d , to the range of median values for the same biomass in Figure 5e .
- the method determines the concentration in a medium of a first particle type in the presence of a second particle type.
- the method includes the steps of passing light originating from a first light source into the medium, and detecting a first light signal originating from the first light source that was reflected from within the medium. Next, a first statistical measure is computed that is related to the central value of the signal, and a second statistical measure is computed that is related to the distribution of the signal. The first and second statistical measures are then combined to determine the concentration of the first particle type in the medium, and is substantially independent of the concentration of the second particle type.
- Examples of statistical measures related to the central value of the signal include the mean, trimmed mean, mode, and median.
- Examples of statistical measures related to the distribution of the signal include the standard deviation, range, interquartile range, mean absolute deviation, median absolute deviation, and mode absolute deviation. Examples of the reduced dependence of biomass estimation on the influence of bubbles based on combining statistical measures of the distribution and central value are provided in Example 4.
- Figure 5e depicts the median absolute deviation plotted versus the median signal over a wide range of biomass concentrations, agitation rates, and sparging rates. The points at each biomass level are well clustered on the plot, so that the biomass can be distinguished despite the influence of bubbles.
- Measurement of biomass that is substantially independent of bubble influence can therefore be accomplished by mapping of the biomass range onto a plot of signal distribution and central value.
- this mapping consists of a series of lines used to characterize each biomass value.
- one or more analytical functions are empirically derived that characterize the biomass as a function of the central value and distribution.
- two analytical functions are empirically derived, one that characterizes the slope and another that characterizes the intercept of the lines through each biomass value.
- the mapping is used to generate an estimate of the "bubble-free" reflectance.
- the calibration consists of a series of lines in MAD-Median space. As shown in Figure 15 , the lines can be extrapolated above and/or below the calibration measurements, in order to accommodate measurements slightly beyond the bounds of the original calibration.
- the calibration is stored in instrument memory and is applied to new measurements by locating the nearest 2 calibration lines on the map to the new measurement and interpolating between them to create a line on the map that intersects with the new measurement. By tracing the interpolated line down to it's minimum median value, the "bubble-free reflectance" is thereby determined.
- This minimum median reflectance can be either the minimum of the extrapolated line, or the minimum of the un-extrapolated line. In a preferred embodiment, the minimum of the un-extrapolated line is used.
- the bubble calibration map is more accurately represented by a series of curves.
- the bubble-free reflectance is determined by tracing the curve down to the minimum median reflectance, in analogous fashion to the procedure described for linear mapping.
- the curve is represented by a polynomial function.
- the bubble calibration consists of a contour map in median-MAD space, and the bubble-free reflectance is determined by interpolating between the contours nearest to the measured median and MAD values, and determining the minimum median reflectance of the resultant contour.
- the concentration in a medium of a first particle type is determined in the presence of a second particle type, with the detection bandwidth and the measurement volume selected so that light reflected from the medium allows signal fluctuations from the second particle type to be resolved, whereas the signal due to the first particle type is substantially constant at a given concentration. By separating the signal fluctuations from the constant signal, the concentration of the first particle type is determined.
- the medium is aqueous
- the first particle type is biomass.
- the second particle type includes gas bubbles.
- the gas bubbles are room air, oxygen-enriched air, or a controlled mixture of gases.
- the medium may be agitated at variable speeds which may also have the result of introducing bubbles into the medium.
- the number and size of the bubbles suspended in the medium may be affected by the rate of agitation as well as the concentration of other particles suspended in the medium.
- the second particle type includes un-dissolved media constituents.
- bio-fermentation processes optimized to break down cellulosic materials. The present invention provides methods for distinguishing the live biomass that is breaking down the material from the material itself.
- Example 3 The effect of air bubbles on measurements of optical reflectance in a liquid biomass culture is described in Example 3.
- the number of gas bubbles within the measurement volume is kept low enough so that statistical variation is readily observable.
- the biomass (yeast) particles used in this example were much smaller and more numerous than the bubble particles, so that statistical variation due to the biomass particles was low.
- Figures 4a and 4c are measurements at the same biomass concentration (25 g/L yeast) with bubbling off and high, respectively.
- Power spectra of reflectance amplitude vs frequency show that in order to resolve the variation due to bubbles moving in and out of the measurement volume, a detection of bandwidth of at least about 250 Hz or higher is necessary, in this example.
- the bandwidth necessary to resolve the particles may be lower, such as 100 Hz.
- bandwidths as low as 10 Hz may suffice.
- the measurement volume necessary to resolve statistical fluctuations due to the second particle type will also vary according to the particle type. Measurement volumes in the range of 1 ⁇ L to 1 L may allow bubble fluctuations to be observed.
- Table 0 summarizes the maximum measurement volumes for the sensor depicted in Figure la. The maximum measurement volumes were estimated from the experimentally measured maximum penetration depths (Example 1). As can be seen in Table 0, the measurement volumes vary strongly according to the source wavelength and the scattering properties of the medium, and more weakly according to the source-detector spacing. The maximum measurement volumes in Table 0 range between 4 ⁇ L. and 200 mL. Bubble discrimination was found to be more effective when employing source wavelengths at 1310 and 1550 nm than at 980 nm.
- the measurement volume is most critical when the concentration of the first particle type is low.
- the measurement volume can balloon to large volumes, unless a source wavelength is chosen that is strongly absorbed by the medium.
- a source wavelength is chosen that is strongly absorbed by the medium.
- Table 1 shows that the maximum measurement volume is nearly 1 L when the biomass (i.e. scatter) is low.
- the measurement volume can easily exceed 1 L.
- the number of bubbles within the volume can be large enough so that it is difficult to observe fluctuations in the number of bubbles as a function of time. In contrast, more effective bubble discrimination is observed at low biomass, when a strongly absorbing source wavelength is selected.
- the absorbance of the source by water limits the maximum measurement volume to about 20 mL, even when the biomass (i.e. scattering) is low. Yet further restriction in the measurement volume is achieved at 1550 nm, where the measurement volume is limited to about 100 ⁇ L. Such a small measurement volume makes it easier to capture fluctuations as bubbles move in and out of the optical field.
- the light is infrared
- the container is a culture flask
- the media is aqueous
- the particles are cells.
- the light source and detector are typically arranged in a sensor housing across a surface and aligned so the light is transmitted in a path describing an acute angle from the direction of detector detection (e.g., optical axis of a conical detection zone for the detector).
- the senor is directly immersed in the medium, such as described in Examples 1-5 and 8.
- the sensor is positioned outside of the container ("non-invasive"), such as described in Examples 6 and 7.
- methods are provided to minimize or eliminate the detection of reflections from the surface of the container itself ("specular reflections").
- Such methods include increasing the separation between the source and detector and limiting the numerical and physical aperture of the source and detector.
- Example 6 describes optimization of sensor geometry according to the thickness of the container wall. Referring to Figure 8 and Table 6, source-detector overlap through a container wall of thickness, T, was optimized by varying the physical apertures (D 1 and D 2 ), numerical apertures (NA 1 and NA2), and separation (Y) between the source and detector.
- Example 7 describes experimental findings for one such sensor, designed for making non-invasive measurements through the 1 mm thick wall of a plastic vessel.
- specular reflections are minimized through the use of crossed polarizers.
- a first linear polarizer is positioned in front of the light source, and a second linear polarizer is positioned in front of the detector.
- the first and second linear polarizers are oriented so that their polarization axes are substantially perpendicular. In this manner, light undergoing a single reflection (such as specular reflections) will be blocked by the second linear polarizer, whereas light that undergoes multiple reflections and is thereby de-polarized (“diffuse reflections”), will partially pass through the second linear polarizer.
- a single polarizing beam splitter is used to accomplish the polarization discrimination.
- Figure 10c depicts one such embodiment, in which the source light, 1, passes through the polarizing beam splitter, 4, on its way to the sample.
- Light reflected back from the vessel wall that retains its original polarization state will pass back through the polarizing beam splitter, 4, avoiding detection.
- light that is depolarized such as by multiple reflections from particles suspended in the medium, will be partially-reflected by the polarizing beam splitter, 4, allowing it to reach the detector, 2.
- the container of media is typically a container designed to hold or store media, but not typically a container normally employed to function with spectroscopic equipment in, e.g., a quantitative analysis.
- the containers in the present methods are typically, e.g., a shaker flask, a T-flask, a centrifuge tube, a test tube, a roller bottle, a fermentor, a bioreactor, a stir flask, a carboy, a bag, a media bottle, a multiwell plate, a petri dish, a syringe, a pipette and/or the like.
- the container is not a cuvette (e.g., from a spectrophotometer or fluorometer) and is not a spectroscopic flow cell (e.g., from an assay device).
- the light wavelength is typically an infrared (IR) wavelength. This is because IR wavelengths are well scattered by particles typically of interest and such wavelengths are substantially absorbed by shallow depths of water, with the benefits described above.
- the light source wavelength in the methods can also depend to some extent on the optical qualities of the container wall in a particular instance. Other useful ranges of light source wavelengths range from less than 650 nm to more than 2000 nm, from about 700 nm to about 1500 nm, from 800 nm to about 1300 nm. In certain embodiments the preferred wavelength is about 1550 nm.
- the light sources emits light between 1150 and 1350 nm, between 920 and 1150 nm, between 1350 and 1900 nm or about 1500 nm.
- other optimum interrogation wavelengths are available, e.g., wherein the particles of interest scatter the light well, and the solvent limits penetration of the light to desired shallow depths.
- the light source and detector are mounted in a device sensor with their objective aperture in a common plane and directed in substantially the same direction.
- the light source and detector are arranged so that light emanating from the light source is scattered by particles in the media and returned to the detector describing an angle of from less than 5 degrees to 45 degrees, from 10 degrees to 35, from 15 degrees to 30 degrees or about 25 degrees.
- the light source may radiate light in, e.g., a beam or cone, and the detection zone visible to the detector can be described by, e.g., a cylinder or cone.
- the optical axis of the light source and the optical axis of the detector detection zone are substantially parallel.
- the axes can converge or diverge from each other at an angle ranging from about 1 degree to 45 degrees, from 3 degrees to 30 degrees, from 5 degrees to 20 degrees or about 10 degrees.
- the particles detected in the methods can be any of interest, e.g., in a reasonably uniform suspension.
- the particles of interest are typically from the fields of materials science or biological sciences.
- Typical particles of interest in the present methods include, e.g., bacteria, fungi, animal cells, plant cells, polymer particles, nanoparticles, sol gels, proteins, viruses, and the like.
- the methods include means of positioning and confirming the position of a light-detector sensor system in relation to the container and media of interest. Uniform and optimal positioning of the sensor can be important to the precision, accuracy, sensitivity and consistency of particle concentration measurements in the methods. Position sensors and alignment guides of the inventive devices are discussed at length below.
- the methods include provision of two or more detectors in functional relation to one or more light sources.
- positioning of the sensor, uniformity of the media components, uniformity of the media depth and uniformity of the container wall can be suggested by comparison of signals returned from two or more detectors at different positions.
- the detectors can be positioned symmetrically or asymmetrically relative to the light source.
- two symmetrically positioned detectors elements can be positioned to provide a means of determining whether sufficient medium is present in order to make an accurate measurement of particle concentration.
- Comparison of two symmetrically positioned detectors can also provide a means of identifying nearby interferences. For example, a bubble residing on the sensor may interfere with the optical measurement, but will typically interfere to a different extent with two symmetrically placed detectors.
- the reflectance from a nearby object in a bioreactor such as an impeller, sparge tube, baffle, or another sensor may cause interference with the sensor measurement.
- disagreement between the reflectance measured by the two or more symmetrically placed detectors leads to an error message being reported to the user that the sensor or probe needs to be repositioned.
- two or more sources having different emission wavelengths may be combined within the same sensor.
- Fiber optic embodiments of such sensors are depicted in Figures 1a and 1b .
- Free-space (i.e. non-fiber-optic) embodiments are depicted in Figures 10b and lOd.
- the combining of the multiple source wavelengths may provide the benefit of: (1) extending the measurement range of particle concentrations, (2) improving the discrimination against a second particle type, (3) providing a means of determining whether sufficient medium is present in order to make accurate measurement of particle concentration, and/or (4) allowing particle concentration to be determined over a wider range of medium volumes.
- the two of more source wavelengths have different mean absorption path lengths in the medium.
- first and second source wavelengths are provided at 1310 and 1550 nm, respectively, and the sensor is used to measure biomass, and bubbles may also be present as a potential interferent to the measurement. Due to the longer mean absorption path length in water, the measurement volume at 1310 nm will be greater than that at 1550 nm. As a result, the measurement sensitivity at low biomass may be better at 1310 nm, whereas at 1550 nm the high range sensitivity linearity may be better (for example, see Figure 3 ).
- 1310 nm may provide better data clustering in the low biomass range, whereas 1550 nm may be better in the medium to high range (compare Figures 5e and 5f ). Measurements made at 1310 nm will have a maximum penetration depth of about 30 mm, whereas at 1550 nm the depth will be limited to about 6 mm (see Figure 2 ). Disagreement of two separate biomass concentration measurements based on the 2 source wavelengths, may therefore be indicative of insufficient fluid being present or the presence of an interfering object in front of the sensor. In other applications, the measurement-volume may be selected by the instrument operator, so that the appropriate source wavelength is used for the measurement.
- the associated signal can be correlated with other useful parameters such as optical density (OD) values or particle concentration.
- the methods can optionally be used to quantitate the amounts of the particles of interest present in the sample. For example, in one class of embodiments, an intensity of a signal scattered back to the detector is measured and correlated (e.g., through a standard formula determined through regression analysis) with a quantity of the corresponding particles of interest present. The standard formula can then be used to calculate an unknown amount of particles in a sample based on the output signal intensity for that sample. Demonstrations of converting reflectance signal intensity into biomass (dry cell weight) are provided in Examples 7-9.
- the light source can be monitored with a sensor that feeds back to the controller, which instructs compensating changes in radiant flux emitted by the light source, thus stabilizing the light irradiation.
- An example of laser feedback control is provided in Example 7.
- Another way to enhance the accuracy of particle concentrations in the methods is to take a blank reading of media without particles and subtracting the blank reading from a measurement of the media containing the particle.
- samples can be identified and tracked employing components of the inventive device acting as a bar code scanner.
- the light source can be a laser and light reflected back to the detector during a sweeping motion across a bar code decal can be detected and interpreted by the processor to identify a sample.
- the devices of the invention are generally directed to one or more light sources paired with one or more sensors arranged to interrogate a sample of particles in a medium, with the sensor either immersed directly in the medium, or positioned to measure through the walls from one side of a container.
- the devices for determining the concentration of particles in a medium can include a housing containing a sensor, a light source in the sensor, a detector in the sensor positioned to detect a signal of source light wavelengths scattered by particles within the medium, and a processor configured to correlate the detected signal to the concentration of particles.
- the light wavelength emitted by the source is selected to be absorbed without overly extensive penetration into the medium.
- the device typically comprises a controller configured to measure the detected signals and to control the light sources.
- the light source of the device is modulated in amplitude and/or frequency. In such a case, accuracy can be enhanced wherein the detector reading frequency is different from the light interrogation frequency, e.g., thus avoiding problematic beat frequencies, and other interference.
- the detector signals measurement rate is at least 4-fold, 10-fold or 100-fold, or more different (preferably greater), than the modulation rate of the light source.
- a quadrature slope correction may be employed as part of a detector demodulation algorithm.
- Typical vessels containing media and subject to particle concentration readings by the devices of the invention include, e.g., shaker flasks, a T-flasks, centrifuge tubes, test tubes, roller bottles, fermentors, bioreactors, stir flasks, carboys, media bags, media bottles, multiwell plates, petri dishes, syringes, pipettes and the like.
- the sensors of the devices can have complex arrangements of one or more light sources paired with one or more detectors. For example, signals can be combined from two or more paired source-detectors with two different source-detector separations.
- the light source or detectors can be fiber optical components, which are optically linked to electro-optical components that are physically separated from the housing, wherein the device further comprises one or more additional detectors in functional relation to the light source.
- the device can include a second light source with a light wavelength different from the light wavelength of the first light source, e.g., to selectively detect a different particle type or compliment a different container or media.
- the light source wavelength can be selected according to the separation between the source and the detector, e.g., to tailor the light path length to the expected particle density or media absorbance.
- the device is configured to provide particular desired characteristics, For example, the device controller can be configured to collect detected signals at least every 0.10 seconds, thereby allowing measurement of variation in the amount of medium or particles in front of the sensor as it varies over time.
- the processor can be configured to distinguish signals depending on an amount of medium present at the container.
- the processor can be configured to correlate a ratio of signals collected in the presence of different amounts of media sample to the particle concentration.
- the light source and detector are both directed in the same direction. In many embodiments, the source and detector are aligned within 1 degree, 2 degrees, 5 degrees, 10 degrees, 20 degrees or 30 degrees of each other.
- a sensor housing, 6, holds one or more optical fibers, 5, and provides apertures into and out of the sensor.
- the numerical aperture of the optical fiber may be selected to limit the divergence of the light source and/or the collection cone of the detectors.
- the same optical fiber, 5, is used both to deliver the source light and to collect the light for detection.
- a beam splitter may be used to combine and separate the source and detection light.
- a fiber splitter (e.g. 2x1 branching) is used to combine and separate the source and detection light.
- each fiber is coupled to a separate detector.
- the use of detection at multiple distances from the source fiber may allow the range of biomass to be extended.
- the detector fibers may be symmetrically located around the source fiber. By comparing the results from the multiple detectors, the presence of interfering objects, or the absence of sufficient fluid in front of the sensor may be determined. In this manner, the use of multiple symmetrically-located and separately-detected fibers may allow for improved measurement accuracy and/or rejection of inaccurate results.
- the fiber optic embodiment depicted in Figure 1 ie offers the benefit of easy and reproducible manufacture.
- a single hole may be made with a diameter just sufficient to accommodate the three fibers in a close-packed triangular arrangement.
- the separation between the source and detector fibers may be adjusted by selecting fibers having different cladding diameters, or by leaving the fiber buffer layer in place, so that it determines the close-packed diameter.
- three fibers with 200/220/239 mm core/cladding/buffer diameters (such as Polymicro part number FIP200220240) are used.
- the fiber buffer is left in place during assembly, and the radius of the hole made to accommodate the three fibers has a radius of approximately 520 ⁇ .
- provision of the light source and detection are accomplished without the use of optical fibers.
- such free-space embodiments may be used either non-invasively (i.e. measuring through the wall of the vessel), or invasively (i.e. immersed in the medium).
- FIGs 10a-d Several free-space embodiments are depicted in Figures 10a-d .
- the source and detector are directed to and from the measurement medium through the use of mirrors, 3a-c.
- the use of a two-sided right-angle mirror e.g. 3b in Figure 10a
- the embodiment depicted in Figure 10b further includes a dichroic beam splitter, 4, for combining the two light sources, 1a and 1b, into a single beam, with high efficiency.
- the free- space embodiment depicted in Figure 10c employs a beam splitter, 4, to combine the source and detection beams.
- the advantage of this arrangement is that the source and detection beams can be overlapped to the extent desired. Further, by using a polarizing beam splitter, the detection of specular reflections from the vessel wall may be minimized, in applications where the sensor is used for non-invasive measurements.
- the embodiment depicted in Figure lOd is an extension of that depicted in Figure 10c , to include a second overlapped source wavelength.
- a laser monitoring detector provides a signal for measuring and/or controlling the laser radiant flux.
- the laser is directed into the medium either directly, or through a wall or aperture ("window") of a vessel into a medium.
- the vessel window should be at least partially transparent to light at the laser wavelength.
- Suitable vessels include flasks, bottles, tubes, fermentors, and bioreactors with window material made from such optically transparent materials as plastic (e.g. polyethylene terephthalate (PET), polycarbonate (PC)), or glass.
- PET polyethylene terephthalate
- PC polycarbonate
- the preferred embodiment described here is especially well-suited for thin-walled ( ⁇ 6 mm thick) vessels, such as is typically found in laboratory shake flasks, roller bottles, and tubes.
- the optical fibers are close-packed, so that the source-detector separation is determined by the diameter of the cladding, or if the buffer is left intact, by the diameter of the buffer.
- both the source and detection fiber have a core and cladding diameter of 0.2 and 0.22 mm, respectively, and a numerical aperture of 0.22. The fibers are close-packed, with the center-to-center distance between the laser and each detector approximately 0.22 mm, as determined by the fiber diameter (with cladding).
- the center-to-center distance between the source and each detector fiber is approximately 0.22 mm and the numerical aperture of the fibers is 0.22.
- the numerical aperture of the fiber limits the full angle of the emission and detection cones to about 25 degrees in air, or about 19 degrees in water.
- Many other combinations of fiber diameters and numerical apertures could be used, depending on the desired measurement volume. For example, by selecting fiber with numerical aperture of 0.11, the angle of the detection and emission cones would be reduced to about 9 degrees in water, thereby substantially reducing the measurement volume.
- the close-packing diameter is determined by the fiber buffer diameter.
- the buffer is left in place during manufacture of the probe, thereby increasing the source-detector separation while still having the simplicity of a close-packed arrangement.
- the source detector separation will be increased to 0.239 mm from 0.22 mm, by keeping the buffer intact.
- One potential advantage of this increase in source-detector separation is that sensitivity to dirt or fouling at the sensor tip may be reduced.
- the laser wavelength is chosen so that it is partially absorbed by the medium itself.
- Water being the principle constituent of all cell media and relatively invariant in concentration, is an ideal candidate for providing this partial absorption of the light source.
- the absorption by the medium needs to be low enough so that the light has a chance to scatter from cells in the medium and return to the detectors before being absorbed.
- the absorption needs to be high enough so that light scattered from the cells and then reflected by the vessel wall, objects external to the vessel, or non-cellular objects within the vessel, has a low probability of returning to a location within the vessel from which it can enter the detector apertures before being absorbed by the medium.
- the mean absorption path length of the medium at the source wavelength will determine the maximum distance between the source and reflectance detectors at which the reflectance signal will be detectable.
- the source-detector separation should be kept less than a factor of about ten times the mean absorption path length in order to be detectable.
- the factor should be kept less than about 5, less than about 2, or in many applications less than about 1.
- the mean absorption path length in water is about 6 mm.
- the source-detector separation should be less than about 30 mm, less than about 12 mm, or for many applications less than about 6 mm.
- the mean absorption path length in water is 0.8 mm. Signals at 1550 nm become difficult to detect at source-detector separations greater than about 8 mm, and the source-detector separation is optimally kept below 4 mm, about 1.6 mm, or in many applications, less than about 0.8 mm.
- the effect of the source-detector separation on the range of sensitivity to particle concentration changes should also be considered in many applications of the present invention.
- the selection of one or more source-detector separations optimized for measurement of particle concentrations in particular concentration ranges has been described in prior art (e.g. US Patent 8,603,772 ).
- the unexpected finding of the present invention is that by selecting the source-detector separation to be substantially less than the mean absorption path length in the medium, the range of sensitivity to particle concentration can be greatly extended.
- the source-detector separation should be kept less than the mean absorption path length, by a factor of about one half (1/2), a factor of about one fourth (1/4), or a factor of about one tenth (1/10) times.
- the experimentally observed (red squares in Figure 3 ) range of sensitivity to changes in biomass is about two orders of magnitude (from about 1 to 100 g/L yeast concentration).
- the range of sensitivity to changes in biomass is extended to about four orders of magnitude (from about 0.02 to 200 g/L yeast concentration).
- a similar pattern is observed with the source wavelength set to 1310 nm.
- the range of sensitivity to biomass change is limited to about two orders of magnitude (from about 0.1 to 10 g/L yeast dry cell weight, data not shown).
- the range of sensitivity to biomass change increases to about 3 (0.05 to 50 g/L), about 4 (0.01 to 100 g/L), and more than 6 (about 0.0001 to 200 g/L) orders of magnitude, respectively.
- the impact of the sensor geometry on sensitivity to window back-reflections may also need to be considered. If the source emission cone overlaps with the detection cone within the window, there is a potential for interference of light reflected from the inner wall of the window ("specular reflection"), with the desired light emanating from reflections off of particles within the medium (“diffuse reflection"). In general, increasing the source-detector separation and decreasing the emission and detection cone angles will lead to decreased interference due to specular reflections.
- the selection of the optimal source-detector geometry may require a careful balance.
- the minimum source-detector separation that still avoids significant interference from specular reflection is selected.
- other factors that may be varied to minimize the effect of specular reflections include: (1) the source and detection diameters, (2) the source and detection numerical apertures, (3) the central angle of incidence of the source and detector beams relative to the window surface, and (4) the relative polarization of the source and detected beams.
- Example 6 (below) describes the optimization of the sensor geometry based on 2 of these factors, fiber diameter and numerical aperture, in a sensor consisting of a single source and detection fiber, such as depicted in Figure 8 , that is interfaced to a vessel having wall thickness, T.
- Configuration 1 in Table 6 corresponds to the case where the window thickness, T, is zero: the sensor is directly immersed in the medium. This configuration was experimentally tested, as described in Examples 1-5.
- the model predicts that this can be done while still substantially avoiding specular reflections (Z > 0). Since this optical model neglects the effects of scattering and multiple reflections within the window, in some applications it may prove beneficial to further separate the overlap of the source and detector beams within the window. This could be accomplished by decreasing the diameter and/or numerical aperture of the source and/or detector fibers.
- Configuration 2 describes the case where the diameter of both the source and detector fibers is decreased from 0.2 to 0.1 mm.
- configurations 6-10 in Table 6, where the diameter of the source fiber (0.1 mm) is chosen to be half that of the detection fiber (0.2 mm), and several different numerical apertures (0.22-0.48) are compared.
- configurations 7-10 are predicted to offer the benefit of reduced sensitivity to specular reflections (higher values of Z).
- Configurations 11-16 provide examples of optimizing the sensor geometry for several other window thicknesses.
- Example 7 Experimental results for a specific sensor embodiment designed for making noninvasive biomass measurements through a 1 mm thick plastic vessel wall are described in Example 7.
- This sensor employs a single-mode (approximately 0.01 mm core) fiber for the source light at 1330 nm and a 0.2 mm core multi-mode fiber for detection.
- the source-detector separation of 0.7 mm (center to center) provides sufficient discrimination against specular reflection from the vessel wall while still enabling linear biomass detection over more than 3 orders of magnitude (see Figure 17 ).
- Use of a single mode fiber for the source provides high transmission efficiency of the 1330 nm laser diode, while allowing a low-cost fiber splitter to be used to deliver the light to multiple sensors simultaneously.
- the angle of the central optical axes of the source and detection beams relative to the vessel window may also be adjusted to help reduce the influence of specular reflections on the measured signal.
- the face of the sensor e.g. component 7 in Figure 11a
- the extent of tilt may be selected according to the numerical aperture and/or separation of the source and/or detectors, and/or the window thickness.
- a tilt angle of at least the half-angle determined by the numerical aperture may substantially reduce the effect of specular reflections.
- tilt angles of at least twice, at least 3 times, or least five times the half-angle of the numerical aperture are selected.
- the half-angle of the numerical aperture will be about 8 degrees.
- selecting a tilt angle of the sensor face, 7, relative to the surface of the window of at least 8 degrees will substantially reduce the influence of specular reflections on the measurement.
- Further increases in the tilt angle to at least 16 degrees, at least 24 degrees, or at least 40 degrees may further enable the rejection of specular reflections in many applications.
- tilting of the optical axes of the source and detector are achieved by tilting the components themselves, or by tilting the optical fiber through which the light is transmitted, rather than simply tilting the surface of the sensor relative to the window surface.
- the source and detector optical axes may be tilted independently, to further optimize the rejection of specular reflections in favor of diffuse reflections emanating from the medium.
- the composition of the sensor housing may be chosen so as to minimize interaction with the medium or the particles suspended in the medium.
- the sensor housing may be constructed from stainless steel, for example stainless steel type 316 L may be suitable for applications.
- the surface of the housing may also be polished in order to minimize the potential for interactions with the medium. For example, a surface polish specification of N5 ( ⁇ 0.4 ⁇ ), may be suitable when the medium contains biomass.
- the sensor housing may be constructed from glass.
- the adhesion of materials on or near the optical face of the sensor is minimized or eliminated in some embodiments of the present invention through the selection of particular sensor face materials, the surface polish and coating of the materials, and/or the shape of the materials.
- the tip of the sensor is coated with titanium or zirconium nitride.
- the effect of such a coating may be to reduce or prevent adhesion of gas bubbles and/or biological material such as cells or protein, to the surface of the sensor.
- Reduced bubble adhesion to titanium nitride coated stainless steel compared to uncoated stainless steel is demonstrated below in Example 12.
- Zirconium nitride is known to have similar properties to titanium nitride but has the benefit that it can be applied (e.g.
- the tip of the sensor is constructed from glass.
- the surface of the sensor is rounded. The rounding of the surface, may further aid in the reduction of adherent particles.
- the front face of the sensor may be covered with a face plate that protects the sensor from the environment in which it is operated.
- the face plate should be constructed from a material that is transmissive to light emitted by the laser.
- the face plate may be absorptive to light at wavelengths other than the laser emission wavelength.
- An example of a suitable material for the face plate is Edmund Optic part number NT 43-954, which is transmissive to near infrared light but absorptive to visible light.
- a gasket is used to prevent the sensor from sliding easily against the vessel surface. When pressed against a vessel wall, the gasket may also be used to create a seal that prevents materials from occluding or affecting the optical measurement.
- surrounding the face plate is a gasket groove used to contain the gasket. The gasket groove helps to prevent the gasket from moving and possibly obstructing the face plate.
- a material with a stable reflectance is provided for the purpose of checking, and if necessary correcting, the sensor performance.
- suitable materials for this purpose are Kynar and Teflon.
- the expected reading may be stored in instrument memory or written on the standard itself. If the actual sensor reading does not agree with the expected reading, in one embodiment correction factors are applied to the reflectance measurement to bring it back into agreement. These correction factors may then be stored and applied to subsequent readings.
- sensor embodiments designed to be immersed in a medium it may be desirable, in some applications, to be able to perform the sensor verification and/or calibration step while the sensor is immersed in the medium.
- the sensor when the sensor is immersed in a medium for growth of biomass that has been sterilized to prevent growth of undesired organisms, the sensor may need to be sterilized along with the vessel, precluding its subsequent removal, without jeopardizing the culture to contamination.
- Sensor embodiments designed to allow the calibration/verification step to occur without the need to remove the sensor from the medium are depicted in Figures 12a through 12c .
- the scattering reference material, 13 is attached to the sensor using a support shaft, 14, that traverses the interior of the sensor housing, 6.
- a turning handle, 15, attached to the support shaft allows the user to rotate the reference material into and out of the optical path of the sensor.
- Figures 12a and 12b depict embodiments with flat and rounded sensor faces, 7, with the scattering reference material positioned for a verification/calibration measurement.
- Figure 12c depicts the same embodiment as 12b, but with the scattering reference material rotated out of the optical path, so that scattering can be measured from particles in the medium in which the sensor is immersed.
- the sensor embodiments depicted in Figures 12a-c may have the added benefit of providing a mechanism by which interfering material may be cleared from the front of the sensor face.
- interfering material may be cleared from the front of the sensor face.
- the scattering reference material may function as a wiper, so that one or more passes of the scattering material across the face of the sensor, may serve to clean it.
- the scattering reference may be used to remove the bubbles from the sensor face.
- the senor is an immersible sensor employing fiber optics to transmit light between a base unit which contains the electro-optical components (e.g. light sources and detectors) and the point of measurement in a medium.
- a memory device such as a 1-wire EEPROM, provides a convenient means for storing sensor calibration coefficients and settings.
- the memory device may be located within the sensor housing, or within the connector on the sensor.
- the connector is a hybrid electro-optical connector that provides a mechanism for simultaneously connecting the fiber optic and electrical (e.g. memory device) components, within a single connector.
- Such connectors are commercially available (e.g. F7 connectors made by Lemo: http://intra.lemo.ch/catal.og//ROW/UK English/f7 contacts.pdf ).
- a timing scheme for driving 2 lasers and reading one or more detectors in a sensor of the present invention is depicted in Figure 9 .
- the 2 laser sources are each driven at 1 KHz with a square wave pulse having 25% duty cycle.
- the relative phase of the lasers is fixed so that the "on" period of the 2 laser pulses are separated by about 1/6 ⁇ of a millisecond, to avoid any potential interference.
- the one or more detectors are each read continuously at a rate of about 60 kHz, that is synchronized with the laser drive pulses. Dark periods (where both lasers are turned off) are used to measure contaminating light levels (e.g. ambient light), which can then be subtracted from the signals measured while the lasers are on, if necessary.
- contaminating light levels e.g. ambient light
- FIG. 13a through 13c An embodiment of the invention, designed for measuring particle concentration in test tubes or other small vessels is depicted in Figures 13a through 13c .
- the test tube, 8, is held in place on one side by a rear support, 9, that has a V or U- shape in one dimension and is substantially flat in a second dimension, so that it can stably accommodate test tubes having a range of diameters.
- the rear support is held on a sliding rail, 10, that travels in a direction perpendicular to the tangent of the test tube surface that is closest to the center of the V or U shape in the rear support.
- the rear support is urged against the wall of the test tube by a spring, 11, that links the rear support and the base, 16, of the test tube reader.
- the sensor face includes a light source emitting at approximately 1550 nm, and two symmetrically-placed detectors.
- the laser and detectors are positioned along a line that is parallel with the flat surface of the test tube.
- the detectors are equally spaced from the light source, with the center-to-center source-detector spacing between about 0.1 and 3 mm, for example about 0.8 mm.
- fiber optics to convey the light between the optical elements (e.g. laser and detectors) and the sensor face.
- an aperture, 12 is provided in which the end of the test tube may be placed.
- the choice of source wavelength will in part determine the minimum tube diameter on which accurate measurements of particle concentration may be made.
- the minimum tube diameter will be about 6 mm, for measurements at low particle concentration (smaller tubes could be measured at higher concentration).
- Selection of a source wavelength having a higher absorbance than 1550 nm in the medium will allow accurate measurement in tube diameters smaller than 6 mm.
- a stop is provided on the rail, which limits the motion of the rear support so that test tubes having a diameter smaller than a chosen value will not be accommodated by the holder.
- the stop may be positioned so that tubes having a diameter smaller than about 6 mm will not be held securely between the sensor face and the rear support.
- at least one contact sensor is provided, either on the sensor face or on the rear support, or both, that detects whether the test tube is being held firmly between the sensor face and rear support. Measurement is prevented unless the position sensor(s) are engaged. In this manner, measurement on tubes below the minimum diameter is prevented.
- the contact sensor also provides a mechanism for automating the measurement process: engagement of the contact sensor may provide a trigger signal to commence measurement.
- the contact sensor comprises at least one mechanical switch, which may be activated by contact pressure.
- the position switches may be located on a printed circuit board within the body of the sensor.
- Many suitable position switches are available, but one example is manufactured by Omron Electronic Components: part number B3U-1000P-B. This switch requires only 0.15 mm of travel with 150 grams of force in order to be activated, and has a conveniently small footprint (2.5 x 3.0 x 1.6 mm).
- a narrow rod may be used to span the distance between the position switch and front of the sensor.
- One or more o-rings on the rod may be used to seal the cavity against moisture. This arrangement allows an inexpensive non-waterproof position switch to be used, while still providing protection of the instrument in wet environments.
- the position sensing is provided by one or more capacitance sensors.
- the capacitance sensors may further be selected and positioned so that they are only activated when sufficient medium is present beneath the surface of the window being measured.
- the position sensing is provided by one or more pairs of light sources and detectors. These source-detector pairs may be angled towards each other to detect surface (specular) reflections. The source divergence and detector acceptance angles are restricted so that only when the vessel surface 103 is in the desired orientation relative to the sensor, will a threshold level of surface reflection be detected.
- the apparatus is designed so that sensor face, 7, interfaces near the bottom of the test tube, so that tubes containing only a small amount of medium may still be accurately measured.
- the use of 2 symmetrically placed detectors around the source provides a method for determining whether sufficient medium is in front of the sensor face for accurate measurement, as further described in US Patent 8,405,033 .
- only a single detector is employed.
- a mechanism is provided for mixing the tube contents, either prior to and/or during the optical measurement.
- the mixing mechanism is a shaker, such as a vortex mixer, that interfaces with the bottom of the tube.
- the mixing is automatically initiated prior to the optical measurement to make sure that all particles are suspended and well-mixed, the mixer is turned off, and then the optical measurement commences.
- the shaker may provide the benefit of dislodging bubbles from the sides of the tube, that may potentially interfere with the optical measurement.
- a delay time is provided between the mixing period and the optical measurement, in order to allow bubbles to escape from the fluid.
- a magnetic stir bar is placed inside the tube, and a magnetically-coupled stirrer is provided near the bottom of the tube.
- the position of the laser(s) and detector(s) may be interchanged with each other while still maintaining the essential sensor functionality.
- the single source fiber, 5b could be replaced with a detector, and the detection fibers replaced by two ( Figure 11c ) or more ( Figure 11d ) source fibers.
- the lasers may be turned on at different times, or be modulated at different frequencies.
- the detected signals due to the two different sources are compared, in an equivalent fashion to the manner in which the two detected signals emanating from the single source are compared when employed by the sensors depicted in Figures 1a-b , 11c-e , and 18 .
- additional lasers and/or detectors are added so that there are source-detector pairs at multiple separation distances.
- One such embodiment is depicted in Figure 1 1c, where optical fiber, 5a, is coupled to a light source, and the 2 remaining fibers, 5b and 5c, are coupled to detectors.
- Detection fibers 5b and 5c may be separately detected and combined to extend the linear range response to particle concentration.
- Optimal combinations of source-detector distances for achieving wide linear response to particle concentration, and algorithms for combining the signals from the different source-detector pairs are described in Patent Application US 20090075248 , which is included here by reference.
- the laser modulation is varied according to the size of the measured reflectance signal detected from the sample.
- the amplitude of the laser modulation (“modulation depth") is increased until a desired reflectance value has been obtained, or a maximum modulation depth has been reached. In this manner the dynamic range of the measurement may be extended, for example allowing a wider range of particle concentrations to be accurately determined.
- an analog band-pass filter is added to the detector amplification electronics, that selectively amplifies signals at the frequency of the laser modulation, while attenuating signals outside of the band-pass range.
- the reflectance signal is log-transformed twice and related to a singly log-transformed quantity related to particle concentration, such as optical density.
- This relation may be a linear transformation, higher order polynomial transformation, or other transformation, such as described above.
- One advantage of some such embodiments is that the relationship between the twice log-transformed reflectance signal to the singly log-transformed particle concentration is linear over a wide range of particle concentrations. After the linear transformation, the signal is inverse log transformed, in order to be representative of particle concentration.
- a light sources emitting in the vicinity of 13101330, or 1550 nm are described.
- light sources emitting in many other spectral regions will also be suitable in the present invention.
- the absorbance spectrum of water contains multiple bands in the near infrared spectral region, with generally increasing absorbance peaks with increasing wavelength.
- the spectral region may be selected according to the desired optical depth of penetration, with suitable spectral regions generally increasing in wavelength as the optical depth of penetration is decreased. For example, in applications requiring an optical depth of penetration in the range of 1-10 cm, the 900-1150 nm spectral region is well suited.
- Water absorbance in this region ranges between about 0.06 and 1.0 cm -1 , corresponding to a range of mean absorbance path lengths from 1 to 16 cm.
- One advantage of working in this spectral region is that numerous commercial sources are available, and inexpensive low-noise detectors with Silicon active areas may be employed.
- a source in the vicinity of 1550 nm is employed. Such sources have been extensively developed within the telecommunications industry.
- the strong water absorbance in this spectral region (12 cm -1 ) makes it well suited for short optical penetration depths, such as in the mm range, particularly about 6 mm or less.
- multiple source wavelengths are employed in the same sensor, with different source wavelengths providing different optical penetration depths, so that the sensor can automatically adapt according to the available fluid depth in front of the sensor.
- the physical separation and orientation between sources and detectors are used to diminish the influence of surface (specular) reflections on the measurement in favor of diffuse reflections from particles within a medium.
- additional or alternative methods are used for reducing the influence of specular reflections. Examples of such methods include: (1) the use of crossed-polarizers, (2) Angling of the source and/or detectors, (3) high frequency (e.g. GHz) modulation and detection, (4) the use of short light pulses and high speed detection, and (5) photo-acoustic measurement, where an acoustic detector is used to detect and depth-resolve a light pulse.
- a laser diode light source is described.
- many other light sources could be substituted for the laser diode without substantially modifying the essential features of the invention including: vertical cavity surface emitting lasers (VCSELs), light emitting diodes (LEDs), resonant cavity light emitting diodes, solid state lasers (e.g. Nd-YAG), and gas lasers (e.g. HeNe).
- VCSELs vertical cavity surface emitting lasers
- LEDs light emitting diodes
- resonant cavity light emitting diodes e.g. Nd-YAG
- gas lasers e.g. HeNe
- Example 1 Optical Penetration Depth as a Function of Source Wavelength and Source-Detector Separation.
- An immersible fiber optic sensor was constructed and used to investigate the maximum optical depth of penetration of light into an aqueous scattering medium.
- the body of the sensor was constructed from a hollow aluminum tube, 25 cm long, with 18 mm outer diameter.
- the end face of the sensor was constructed from black ABS, with holes drilled to guide placement of optical fibers.
- Optical fibers were positioned flush with the outer sensor face, glued into the place, and optically polished, resulting in a smooth, continuous external surface.
- the arrangement of the optical fiber on the end face of the sensor is depicted in Figure 1a .
- S1-S3, and D1 are 200/220 ⁇ diameter core/cladding fibers with 0.22 NA.
- D2 and D3 consist of 550/600 ⁇ diameter core fibers with 0.22 NA.
- S1-S3 are positioned so that they are close-packed along a line.
- the 7 fibers comprising D3 are 6-around-1 close-packed.
- Laser diode light sources with three different wavelengths were coupled to three of the fibers: 980 nm (S1), 1310 nm (S2), and 1550 nm (S3). All sources were laser diodes operating at room temperature, modulated at 1 kHz with 25% duty cycle and peak power of 1-10 mW.
- the detector fibers (D1-D3) were each coupled into separate 1 mm InGaAs detectors.
- the detector amplifiers passed frequencies from DC to 100 kHz, and the gains were set between 1.6 ⁇ 10 3 and 1.6 ⁇ 10 4 V/mW (the lower gain setting was necessary to avoid signal saturation at biomass higher than about 50 g/L).
- the detector signals were digitized with 16 bit resolution at a sampling rate of 100 kHz using a commercial multi-function data acquisition board (National Instrument USB-6341).
- the sensor was suspended in a 1 L glass beaker, filled with Baker's yeast (Red Star Active Dry Yeast) suspended into 0.9% aqueous NaCl, at seven logarithmically spaced concentrations between 0.1 and 100 g/L.
- a mirror was placed at the bottom of the beaker, parallel to and directly below the optical face of the sensor. The distance between the front face of the sensor and the front face of the mirror was measured. This distance was increased until the signal dropped below the noise floor, and was recorded as the optical penetration depth.
- Figure 2 summarizes the measurements of optical penetration depth as a function of yeast concentration for several different source-detector pairs.
- the penetration depth depends strongly on the source wavelength, and more weakly on the distance separating the source and detector fibers.
- the penetration depth determines the minimum fluid depth required for an accurate back-scattering measurement.
- Water absorbance is weakest at the 980 nm (S1) source wavelength, and the optical penetration at low biomass is in the range of 65 to 90 mm.
- S2 At 1310 nm (S2), where the water absorbance is between that at 980 and 1550 nm, the penetration depth at low biomass is about 30 mm.
- S3 With a 1550 nm source (S3) the penetration depth is limited to about 6 mm.
- the penetration depth decreases for all source wavelengths, so that by 100 g/L the penetration depth is 10 mm or less in all cases.
- Example 2 The same apparatus as in Example 1 was used to measure the back-reflectance signal as a function of biomass, but with the fiber optic connections re-configured as shown in Figure 1b . Only the 1310 and 1550 nm sources were used, so that the third linearly close-packed fiber could be connected to a detector. Note that the three other detection fibers / fiber bundles have been re-numbered accordingly.
- the sensor was immersed in a 12 L Magnferm (NBS) fermentor containing about 10 L of media.
- the media consisted of 0.9% saline with dry active yeast (Red Star) suspended at 23 different concentrations ranging from 0.1 mg/L to 200 g/L, in a geometric series, with series factor 2.
- the fermentor was agitated at 400 RPM, and was not bubbled.
- Each measurement consisted of 10 seconds of data acquisition (1 ⁇ 10 6 total data points were collected on each data channel).
- Figure 3 shows that in the absence of bubbling, by minimizing the separation between the source and detector (Sl-Dl and S3-D1), it is possible to measure a monotonic change in back-scattering amplitude over an extremely wide range of biomass: 0.1 mg/L to 200 g/L, or more than 6 orders of magnitude of biomass.
- This unexpected result demonstrates that it is not necessary to use multiple source-detector separations to achieve a wide range of biomass sensitivity.
- the sensor size can be greatly reduced, compared to existing commercially available immersible biomass sensors.
- both the 1310 and 1550 nm sources are capable of measuring biomass over a very wide range, although the 1310 nm source produced a more linear response with biomass.
- the biomass measured at 2 different depths could be compared, providing a means of rejecting measurements contaminated by reflections from non-biological objects or for which insufficient fluid is present in front of the sensor.
- Example 2 The same apparatus and methods as used in Example 2 were used to collect measurement over a wide range of different agitation rates (0, 200, 400, 600, 800, and 900 RPM) and air bubbling (0, 4, 8, 12, and 16 LPM). Due to the high viscosity of the medium at very high biomass, bubbles take longer to escape from the medium than at lower biomass, so that bubbles constitute a higher fraction of the medium with increasing biomass. For example, with the agitation and sparge set to their maximum values, at a biomass of 100 g/L, bubbles constituted 54% of the total volume, whereas at 10 g/L biomass, bubbles only made up 7% of the total volume.
- a histogram of the data ( Figure 4b ) shows that the distribution is reasonably symmetrical, so that the mean (0.455), median (0.453), and mode (0.451) are all in close agreement.
- the distribution becomes highly asymmetrical, so that the mean (0.483) is significantly different from the median (0.466) and mode (0.461). Note that the deviations induced by bubbles are both positive and negative-going.
- the asymmetrical skewing of the signal due to bubbling generally increases as the yeast concentration decreases.
- Figures 4e-h show the signals measured at 0.4 g/L yeast concentration under conditions of no bubbling ( Figure 4e-f ) and high bubbling ( Figures 4g-h ).
- Table 1 the mean signal increases by 77% as a result of the bubbling, whereas other measures of central value that are less dependent on outliers, such as the trimmed mean, median, and mode, are less dependent on sparge rate.
- Table 1 Dependence of central signal value on bubbling rate File Name Yeast Cone.
- the central value of each data set was estimated by 4 methods: (1) mean, (2) median, (3) mode, and (4) trimmed mean.
- the trimmed mean was computed by first sorting the data, then discarding the upper and lower quartile of the data, and computing the mean of the remaining points.
- the number of bins in the histogram used to compute the mode was generated by dividing the full range by the interquartile range, multiplying by a factor between 3 and 30, and adding a term between 5 and 25.
- the distribution of each set was estimated by 6 methods: (1) range, (2) standard deviation, (3) interquartile range, (4) mean absolute deviation, (5) median absolute deviation, and (6) mode absolute deviation.
- the interquartile range was computed by sorting the data and then computing the difference between the values of the data points at the 25th and 75th percentiles.
- Figures 4a-h It is apparent from Figures 4a-h that bubbling has a dramatic effect on the signal distribution. Measurement of the signal distribution in combination with measurement of the central value, was found to provide an effective means of diminishing or eliminating the effect of bubbles on the reported biomass.
- Figure 5a shows a plot of the Standard Deviation versus the Mean determined using the S1-D4 pair (1310 nm source, S-D separation 6.7 mm). Each yeast level in the figure is represented with a different symbol and color; the displayed yeast range was limited to 0.1 to 25 g/L. The multiple points at each yeast concentration represent measurements collected under different sparge and agitation conditions, with the data points collected under the highest bubbling and agitation rates generally appearing at the upper right of the figure.
- Additional variable data processing steps included: (1) averaging of all data points within each laser pulse, (2) decimating the data by factors of 2-8, and (3) truncating the data sets by factors of 2-16.
- Decimation was performed by averaging D adjacent data points, where the decimation factor is D.
- Truncation was performed by dividing the number of data samples, N, by the truncation factor M, and keeping only the first N/M samples in the data set.
- Decimation and truncation were always performed after averaging of the data points within each laser pulse. When both decimation and truncation were performed on the same data set, decimation was performed first.
- the fiber immersion sensor results indicate that the widest biomass range and best biomass clustering across different bubbling conditions are obtained with the Source-Detector separation minimized (e.g., close-packed optical fibers).
- the Source-Detector separation minimized e.g., close-packed optical fibers.
- an intervening layer of glass or plastic the container wall
- the effect of this intervening layer on the source-detector overlap was modeled, with the approximation that the mean optical depth corresponds to the point of overlap of rays with maximum divergence from and to the center axis of the source and detector fibers, respectively.
- Configuration 1 in Table 6 corresponds to an immersion sensor, for which the source (D1) and detector (D2) fibers both have 0.2 mm core diameters and numerical apertures of 0.22.
- the wall thickness, T was set to 0, and the edge-to-edge separation between the source and detector fiber cores, Y was set to 0.04 mm (closest-packing allowed for a fiber cladding diameter of 0.22 mm).
- the resulting source-detector overlap depth, X, within the medium, is 0.71 mm. All other configurations in Table 6 correspond to non-invasive measurements through a wall with thickness, T.
- the overlap depth, X was fixed at 0.71, and the resultant edge-to-edge separation between the fiber cores, Y, was determined.
- the closest point of intersection between the source and detector fiber cones, Z, within the container wall was also determined.
- a negative value of Z indicates that the source and detector cones will overlap within the container wall, with the result that back (specular) reflections could be observed from the wall-medium interface.
- the wall thickness is 2.1 mm.
- Example 7 Non-Invasive Fiber Optic Sensor for a Plastic Vessel.
- a fiber optic ferrule as depicted in Figure 14 , was designed and constructed for making measurements through the bottom of a 1 mm thick clear plastic vessel. Vessels constructed from both Makrolon and Luran materials were tested.
- Source light was provided by a 1330 nm, 30 mW diode laser (Applied Optoelectronics, part number 01-05-1182 DFB-1330-BF-25-CW-SA-N182) with a single mode fiber output that was split into 16 equal channels by a single mode fiber optic splitter (Neptec OS, Inc., part number SCSMDWCM).
- the light source penetration depth at this wavelength is limited to about 25 mm by water absorbance, allowing accurate reflectance measurements at low biomass even in shallow fluid depths.
- the sixteen fiber channels provide simultaneous light source excitation for up to sixteen fiber optic ferrules.
- the light source fibers both in the splitter and in the ferrule
- the detection fibers were 200 ⁇ core multi-mode fibers (ThorLabs, part number FG200LC).
- the use of single mode optical fiber for source light conveyance has the benefit of lower cost for the fiber optic splitter compared to a multi-mode fiber splitter, as well as reducing the amount of specular reflectance from the vessel for a given source-detector separation and window thickness, compared to multi-mode fiber.
- the use of multi-mode optical fiber for detection allows capture of the diffusely reflected source light over a relatively large surface area, resulting in much higher collection efficiency compared to that provided by single mode fiber.
- the detection fibers were individually detected, amplified, and multiplexed into a single analog-to-digital converter (ADC), as further described in Example 11.
- ADC analog-to-digital converter
- the multiplexing helps to reduce the overall system cost for monitoring multiple vessels simultaneously.
- the laser was modulated at approximately 781 Hz with a 75% duty cycle.
- the ADC output consisted of 16-bit integers streaming at a rate of 50 kHz.
- a Proportion-Integral-Derivative (PID) control loop was used to maintain the laser output power at the desired level by using the signal from a built-in laser monitoring diode as a feedback signal read by the microprocessor.
- PID Proportion-Integral-Derivative
- Each measurement consisted of 2040 laser pulses (series lasting about 2.6 seconds). The first three points in the "laser off and “laser on” periods were discarded and all remaining points were averaged and the resultant laser off signal was subtracted from the laser on signal to provide a demodulated reflectance signal.
- ADC Analog-to-Digital Converter
- / was selected to be 2. This process is repeated until the ADC counts fall below T3.
- T1 300 in Table 2
- the laser power is increased if it is not already at a maximum allowed value. If the laser power is already at the maximum allowed value then the detector gain is increased. This process is repeated until the ADC counts are raised above T1. If the ADC counts fall between T1 and a second threshold, T2 (16,000 in Table 7), then the detector gain is maintained, but the laser power is increased by factors off, until the ADC counts exceed T2.
- the sensitivity ranging was only activated when at least n sequential measurements indicated the need for adjustment, where n was set to 3.
- n could be decreased or increased depending on the amount of measurement noise.
- This scheme greatly increases the dynamic range of the instrument, as is necessary in many applications, such as biomass measurements ranging over many orders of magnitude of biomass.
- the median and median absolute deviation (MAD) of the demodulated reflectance signal were computed in two stages, as described in Example 5, above.
- the detector gain and laser power were automatically varied in order to keep the signals within a desired range of amplitudes.
- the median and MAD signals were normalized by the detector gain and laser power at which they were measured. Table 7.
- Laser Power and Detector Gain Ranging Scheme ADC Counts Laser Power Detector Gain 65536 Decrease if detector gain is at minimum Decrease if not at minimum Decrease if detector gain is at minimum Decrease if not at minimum 40000 Decrease if detector gain is at minimum Decrease if not at minimum 39999 Maintain Maintain ... Maintain Maintain 16000 Maintain Maintain 15999 Increase if not at maximum Maintain ... Increase if not at maximum Maintain 300 Increase if not at maximum Maintain 299 Increase if not at maximum Increase if laser is at maximum ... Increase if not at maximum Increase if laser is at maximum 0 Increase if not at maximum Increase if laser is at maximum
- the "bubble calibration" shown in Figure 15 was created by running 14 yeast concentrations under a variety of agitation and sparge conditions.
- a fixture was constructed to hold the fiber optic ferrule against the bottom of a 250 mL vessel.
- the vessel contained an agitator with two Rushton impellers, a sparge tube, and a pH probe.
- the yeast concentrations ranged between 0.02 and 200 g/L dry cell weight; the agitation rate was varied between 1000 and 4500 rpm; and the room-air sparging ranged between 0 and 2 VVM (volume of gas per volume of medium per minute).
- the markers shown in Figure 15 depict the measurements overlaid on which are linear fits.
- the agitation and sparge conditions were increased in 3 steps: (1) 1000 rpm, 0 VVM, (2) 2500 rpm, 1 VVM, and (3) 4000 rpm, 2 VVM.
- the agitation and sparge rate caused significant increases in the measured median reflectance at all yeast concentrations, but after "bubble correction" these effects were largely removed.
- Bubble-compensation has the effect of improving the correlation between the bubble-compensated reflectance and biomass. In many cases this relationship can be accurately characterized by a linear fit in log-log space, such as shown in Figure 17 . These data were collected on a 15 mL Luran vessel filled with 12 mL of media. The linear relationship between biomass and bubble-compensated reflectance holds over more than 3 orders of magnitude of biomass concentration.
- Example 8 Immersible Probe with Symmetrical Detectors.
- FIG. 18 Another example of accurate biomass conversion in the presence of strong potential interference from bubbles was demonstrated using an immersible fiber optic probe.
- Three 200/220 ⁇ core/cladding optical fibers were linearly close-packed, as depicted in Figure 18 .
- the center fiber was selected for the source, so that the two surrounding detection fibers were symmetrically positioned relative to the source.
- a 3 mW, 1310 nm diode laser (Xiamen Bely Communication Equip. Co., part number BLLD-RA-F3130B-1GR) was connected to the source fiber.
- the two detector fibers were connected to 1 mm diameter InGaAs detectors (Xiamen Bely Communication Equip. Co., part number BLPD-RA-1KAR-B).
- a bandpass interference filter centered near 1310 nm was added in front of the detector element, to discriminate against ambient light.
- Both the laser and detectors included fiber optic connectors, simplifying the coupling between the fibers and opto-electronic components.
- the stainless steel exterior of the probe was coated with titanium nitride ("TiN"). This coating was found to reduce the adhesion of bubbles to the probe surface, as described in Example 12.
- TiN titanium nitride
- the curvature of the sensor face was also found to be effective at discouraging bubble adhesion.
- Comparison of the reflectance measured by the two symmetrically-placed detectors was found to be an effective method of eliminating measurements where interference was present. For example, by setting a threshold for agreement between the two detectors, measurements made during periods where one or more bubbles were present at the sensor tip could be easily rejected.
- the response of the two detectors was normalized to each other using a quadratic polynomial correction in log-log space to the median reflectance measured by each detector over a wide range of biomass under conditions of no sparging and moderate agitation. This type of correction was also found to be effective at compensating for manufacturing differences between different sensors. Changes in optical coupling efficiency over time could be corrected with a linear correction based on measurements of a material having fixed reflectance properties.
- the probe was immersed in a 250 mL glass vessel containing 200 mL of media, dual Rushton impellers, a sparge tube, metal baffles, and several other probes (temperature, pH, dissolved oxygen).
- the tip of the probe was held at least 3 cm from the bottom of the vessel during all measurements.
- a bubble calibration was collected, following a similar process to that described in Example 7, except that additional measurements were collected at low biomass (to 0.001 g/L dry cell weight of yeast).
- the bubble calibration was tested under conditions of low and high bubbling, with the result shown in Figure 19 . Under both bubbling conditions, the concentration prediction error was less than 5% over more than 4 orders of magnitude of biomass (yeast dry cell weight 0.01-200 g/L).
- the bubble calibration collected using yeast in Example 8 was applied without modification to subsequent measurements on a culture of escherichia coli.
- the bubble-correction was effective over at least 4 orders of magnitude of biomass ( E. coli dry cell weight), despite the large difference in the cell size and shape of the organism used to generate the bubble calibration (saccharomyces cerevisiae) and that used to test the bubble calibration (e. coli).
- This result demonstrates that the bubble correction method is not limited to the particular organism used to generate the bubble calibration.
- Micro-organisms are frequently genetically engineered to express a particular protein of interest.
- Albumin chicken egg white, Science Lab Supplies, part number C1210-30G
- Three yeast concentrations were tested: 0.2, 2, and 20 g/L dry cell weight.
- up to three levels of relative albumin concentration were tested: 1%, 5%, and 10%.
- the addition of albumin to the media resulted in greatly increased bubble retention under some conditions. As shown in Figure 21 , this increased bubble retention resulted in a non-linear shape to the MAD-Median mapping at the highest albumin concentrations.
- a non-linear mapping may therefore be more effective than linear mapping.
- at least a 2 nd order polynomial fit is used for the bubble calibration, thereby extending the calibration to compensate for the types of extreme foaming that can be observed in the presence of high protein concentrations.
- Example 11 Electrical Schematic for Single Sensor and Multiplexing Systems.
- a schematic for an example embodiment of an electrical system of the present invention is shown in Figure 22 .
- a microprocessor U6 provides timing control of a laser LD1 and two detectors, PD1 and PD2.
- Digital laser control signals from the microprocessor are converted into an analog signal (voltage) by U4, switched between high and low states by U3, and converted to currents by U2:1 and U2:2 to power the laser.
- a laser monitoring diode is amplified by Ul and provided as a feedback to the microprocessor.
- the signals from the two detectors, PD1 and PD2 are first trans-impedance amplified by U7 and U10, and then further amplified with variable gain amplifiers U8 and U11.
- the gain level is controlled by digital communication between the microprocessor and gain switches U16 and U18.
- the amplified detector signals are digitized by analog-to-digital converters, U9 and U12.
- the microprocessor uses digital signals to compute median and MAD reflectance results, and applies corrections, normalizations, and calibrations, using stored coefficients.
- the coefficients that are most relevant to sensor performance are stored in a memory device within the sensor (J1, "1-wire EEPROM").
- the microprocessor brings the measured reflectance signals into an optimal range by varying both the laser power and the detector gain.
- Communication between the microprocessor and other devices e.g. a personal computer
- USB Universal Serial Bus
- FIG. 23 A high-level schematic for a multiplexed embodiment of the present invention is depicted in Figure 23 .
- a single laser is split using a fiber optic splitter, providing light for multiple sensors simultaneously.
- the reflected source light captured by the detection fibers in the ferrules is individually detected and amplified, and then routed through a multiplexer before analog-to-digital (ADC) conversion.
- ADC analog-to-digital
- Example 8 Several probes were constructed of identical design to that described in Example 8, except that the titanium nitride coating was omitted, so that the outer surface of the probe tip surrounding the optical fibers was bare polished stainless steel instead of titanium nitride coated stainless steel. Testing was performed by immersing both uncoated and coated probes in the same plastic 250 mL bioreactor vessel filled with medium. Five yeast concentrations (0, 0.1, 1, 10, and 100 g/L) were tested under conditions of fixed 2 vvm room air sparging and variable agitation (500, 1500, and 2500 rpm) using a Rushton type impeller. Laser driving and data acquisition were as described in Example 8.
- the typical device for measuring the concentration of particles in a media includes, e.g., one or more light sources to interrogate the media, one or more light detectors, a container holding media with one or more particle types.
- the light sources can emit light at one frequency, or in a range of frequencies, in a direction characterized by the optical axis (e.g., center of an illumination cone).
- the detectors can detect along an optical axis along which light is received into the detector.
- Functional combinations of particle concentration assay devices can include several combinations of elements.
- devices can include one light source and one detector; one light source and two detectors, two light sources and one detector, one light source and three detectors, one light source and four detectors, two light sources (having different emission wavelengths) and two detectors. Any of the above combinations can be used to analyze a media in a container (through a wall transparent to the light source wavelength(s)) or the detector and/or light source can be immersed in the media for interrogation and detection.
- any of the above combinations can be used in combination with media containing one type of particle (e.g., a biologic cell) or two or more types of particles (e.g., gas bubbles, macromolecule aggregates, and/or relatively large inorganic particles).
- media containing one type of particle e.g., a biologic cell
- two or more types of particles e.g., gas bubbles, macromolecule aggregates, and/or relatively large inorganic particles.
- Any of the above combinations can be used in combination with alternate alignments of detector and/or light source central optical axes, such as parallel light/detector axes, converging light/detector axes, normal incident optical axis at the optical interface with media, and/or tilted orientation of light axis and/or detector axis at the media optical interface.
Landscapes
- Chemical & Material Sciences (AREA)
- Physics & Mathematics (AREA)
- Health & Medical Sciences (AREA)
- Life Sciences & Earth Sciences (AREA)
- Analytical Chemistry (AREA)
- Biochemistry (AREA)
- General Health & Medical Sciences (AREA)
- General Physics & Mathematics (AREA)
- Immunology (AREA)
- Pathology (AREA)
- Dispersion Chemistry (AREA)
- Investigating Or Analysing Materials By Optical Means (AREA)
Applications Claiming Priority (3)
| Application Number | Priority Date | Filing Date | Title |
|---|---|---|---|
| US201461982087P | 2014-04-21 | 2014-04-21 | |
| EP15783749.3A EP3134719B1 (fr) | 2014-04-21 | 2015-04-20 | Capteur de particules avec discrimination d'agents perturbateurs |
| PCT/US2015/026702 WO2015164274A1 (fr) | 2014-04-21 | 2015-04-20 | Capteur de particules avec discrimination d'agents perturbateurs |
Related Parent Applications (1)
| Application Number | Title | Priority Date | Filing Date |
|---|---|---|---|
| EP15783749.3A Division EP3134719B1 (fr) | 2014-04-21 | 2015-04-20 | Capteur de particules avec discrimination d'agents perturbateurs |
Publications (1)
| Publication Number | Publication Date |
|---|---|
| EP4009032A1 true EP4009032A1 (fr) | 2022-06-08 |
Family
ID=54321804
Family Applications (2)
| Application Number | Title | Priority Date | Filing Date |
|---|---|---|---|
| EP21203006.8A Withdrawn EP4009032A1 (fr) | 2014-04-21 | 2015-04-20 | Capteur de particules avec discrimination interférente |
| EP15783749.3A Active EP3134719B1 (fr) | 2014-04-21 | 2015-04-20 | Capteur de particules avec discrimination d'agents perturbateurs |
Family Applications After (1)
| Application Number | Title | Priority Date | Filing Date |
|---|---|---|---|
| EP15783749.3A Active EP3134719B1 (fr) | 2014-04-21 | 2015-04-20 | Capteur de particules avec discrimination d'agents perturbateurs |
Country Status (3)
| Country | Link |
|---|---|
| US (3) | US9752974B2 (fr) |
| EP (2) | EP4009032A1 (fr) |
| WO (1) | WO2015164274A1 (fr) |
Families Citing this family (23)
| Publication number | Priority date | Publication date | Assignee | Title |
|---|---|---|---|---|
| US10055959B1 (en) * | 2015-10-06 | 2018-08-21 | National Technology & Engineering Solutions Of Sandia, Llc | Systems and methods for intrusion detection using GHz beams |
| WO2018105062A1 (fr) * | 2016-12-07 | 2018-06-14 | オリンパス株式会社 | Dispositif de traitement d'image et procédé de traitement d'image |
| EP3568677A4 (fr) * | 2017-01-10 | 2020-10-21 | Photoswitch Biosciences, Inc. | Systèmes et procédés de détection |
| EP3612814A1 (fr) | 2017-04-20 | 2020-02-26 | Biomerieux, Inc | Instrument d'essai optique résistant au basculement |
| US11375390B2 (en) | 2017-07-21 | 2022-06-28 | Htc Corporation | Device and method of handling a measurement configuration and a reporting |
| CN107314960B (zh) * | 2017-08-15 | 2023-09-29 | 深圳大学 | 一种血细胞浓度传感器及其制备方法、测试装置 |
| US11788942B2 (en) * | 2017-12-15 | 2023-10-17 | Analog Devices, Inc. | Compact optical smoke detector system and apparatus |
| US20210024872A1 (en) * | 2018-02-12 | 2021-01-28 | Corning Incorporated | Remote monitoring system for cell culture |
| DE102018108323B4 (de) | 2018-04-09 | 2020-07-09 | Schott Ag | Vorrichtung zur Halterung einer bilderfassenden Einrichtung an einem Bioreaktor, Bioreaktor mit Vorrichtung zur Halterung einer bilderfassenden Einrichtung sowie Verfahren zur Vermehrung oder Kultivierung biologischen Materials |
| DE102018108325B4 (de) | 2018-04-09 | 2020-07-09 | Schott Ag | Sensoraufnahme für einen Bioreaktor sowie Bioreaktor mit Sensoraufnahme und Verfahren zur Vermehrung oder Kultivierung biologischen Materials |
| US10705001B2 (en) * | 2018-04-23 | 2020-07-07 | Artium Technologies, Inc. | Particle field imaging and characterization using VCSEL lasers for convergent multi-beam illumination |
| EP3815066B1 (fr) * | 2018-06-29 | 2023-03-01 | Carrier Corporation | Dispositif de surveillance d'air polyvalent |
| EP3588057A1 (fr) * | 2018-06-29 | 2020-01-01 | Koninklijke Philips N.V. | Procédé de réduction de numération de particules de faux positifs d'un module de capteur de particules d'interférence |
| US10989645B2 (en) | 2018-08-11 | 2021-04-27 | Aber Instruments, Inc. | Non-invasive particle sensor using a multi-fiber connector |
| CN109086835B (zh) * | 2018-08-29 | 2019-10-15 | 丁柳朋 | 一种浊度数据处理系统 |
| JP2022536232A (ja) | 2018-10-01 | 2022-08-15 | ガスポロックス エービー | 容器中のガスの濃度を求めるためのシステムおよび方法 |
| USD920825S1 (en) | 2018-11-06 | 2021-06-01 | Analog Devices, Inc. | Smoke detector chamber |
| US10921367B2 (en) | 2019-03-06 | 2021-02-16 | Analog Devices, Inc. | Stable measurement of sensors methods and systems |
| US11796445B2 (en) | 2019-05-15 | 2023-10-24 | Analog Devices, Inc. | Optical improvements to compact smoke detectors, systems and apparatus |
| CN115003809A (zh) * | 2020-02-04 | 2022-09-02 | 美国西门子医学诊断股份有限公司 | 通过固态方法和设备的磁操纵 |
| EP4153972A1 (fr) | 2020-05-20 | 2023-03-29 | YSI, Inc. | Fluorimètre à balayage en fréquence |
| CN112213243A (zh) * | 2020-09-25 | 2021-01-12 | 桂林电子科技大学 | 扬尘程度检测系统、扬尘程度检测方法和计算机存储介质 |
| EP4200266A4 (fr) * | 2021-10-26 | 2023-11-15 | Total Biotecnologia Indústria e Comércio S.A. | Procédé industriel d'obtention d'une composition agricole constituée par solubilisation et micro-organismes de minéralisation du phosphore, et utilisation dans la production et l'optimisation de fertilisants minéraux, organominéraux et organiques |
Citations (7)
| Publication number | Priority date | Publication date | Assignee | Title |
|---|---|---|---|---|
| DE19611931A1 (de) * | 1996-03-27 | 1997-10-02 | Euroferm Ges Fuer Fermentation | Verfahren und Vorrichtung zur optischen Messung von Partikeln und Stoffen in Fluiden |
| US6573991B1 (en) * | 2000-04-26 | 2003-06-03 | Martin Paul Debreczeny | Self-compensating radiation sensor with wide dynamic range |
| US20050254055A1 (en) * | 2004-01-20 | 2005-11-17 | Hong Peng | Apparatus and method for monitoring biological cell culture |
| US7100462B2 (en) | 2004-03-05 | 2006-09-05 | Buglab Llc | Self adjusting sensor mounting device |
| US20090075248A1 (en) | 2007-07-28 | 2009-03-19 | Buglab Llc | Particle sensor with wide linear range |
| US20120194800A1 (en) * | 2010-07-30 | 2012-08-02 | Buglab Llc | Optical Sensor for Rapid Determination of Particulate Concentration |
| EP2579020A1 (fr) * | 2010-06-04 | 2013-04-10 | Toru Obata | Dispositif de mesure de particules de gel |
Family Cites Families (24)
| Publication number | Priority date | Publication date | Assignee | Title |
|---|---|---|---|---|
| US4110604A (en) * | 1976-11-04 | 1978-08-29 | Becton, Dickinson And Company | Particle density measuring system |
| SE452513B (sv) * | 1979-11-22 | 1987-11-30 | Svenska Traeforskningsinst | Forfarande och anordning for att bestemma koncentrationen av ett emne i partiklar burna av ett strommande medium |
| US5137693A (en) | 1990-07-30 | 1992-08-11 | Miles Inc. | Spring biased test tube holder |
| WO1994007123A1 (fr) | 1992-09-18 | 1994-03-31 | Tam Lisa A | Procede et dispositif de mesure de la densite de cellule dans des cultures microbiologiques et autres proprietes reflectometriques de liquides |
| JP3231134B2 (ja) | 1993-05-11 | 2001-11-19 | 住友化学工業株式会社 | 微粒子計測方法およびそのための装置 |
| US5532605A (en) * | 1994-10-27 | 1996-07-02 | Agr International, Inc. | Container inspection apparatus having diameter measuring means and associated method |
| US5632388A (en) | 1995-01-30 | 1997-05-27 | Forma Scientific, Inc. | Test tube rack assembly |
| EP0755654B1 (fr) | 1995-07-21 | 2000-03-22 | Becton, Dickinson and Company | Tube à essai pour la détermination de la vitesse de sédimentation des érythrocytes et agent tensioactif pour sa mise en oeuvre |
| US6582921B2 (en) * | 1996-07-29 | 2003-06-24 | Nanosphere, Inc. | Nanoparticles having oligonucleotides attached thereto and uses thereof |
| FI963388A (fi) * | 1996-08-30 | 1998-03-01 | Instrumentarium Oy | Väliaineiden spektroskooppisessa analysoinnissa käytettävän mittausanturin lisärakenne |
| WO1998020323A1 (fr) * | 1996-11-08 | 1998-05-14 | Purdue Research Foundation | Systeme et procede d'analyse de particules |
| NZ544103A (en) * | 2003-05-15 | 2010-10-29 | Xy Llc | Efficient haploid cell sorting for flow cytometer systems |
| US7132657B2 (en) * | 2004-02-09 | 2006-11-07 | Sensor Electronics Corporation | Infrared gas detector |
| JP2007527997A (ja) * | 2004-03-06 | 2007-10-04 | マイケル トレイナー, | 粒子のサイズおよび形状を決定する方法および装置 |
| US20080208511A1 (en) * | 2005-03-07 | 2008-08-28 | Michael Trainer | Methods and apparatus for determining characteristics of particles |
| DE102004031315A1 (de) * | 2004-06-29 | 2006-01-19 | Robert Bosch Gmbh | Mikrostrukturierter Infrarot-Sensor |
| EP1957982A2 (fr) * | 2005-12-05 | 2008-08-20 | Guava Technologies, Inc. | Characterisation d'analyse a base particulaire |
| CN101517394A (zh) * | 2006-09-20 | 2009-08-26 | 皇家飞利浦电子股份有限公司 | 用于感测粒子的传感器装置和方法 |
| ATE538377T1 (de) * | 2007-04-02 | 2012-01-15 | Acoustic Cytometry Systems Inc | Verfahren zur verbesserten analyse von in einem akustischen feld fokussierten zellen und partikeln |
| ES2416404T3 (es) * | 2008-04-02 | 2013-07-31 | Abbott Point Of Care, Inc. | Disolución en gradiente de auto-calibración en un ensayo de constituyentes y aparato de disolución en gradiente realizado en una muestra de película delgada |
| WO2010121381A1 (fr) * | 2009-04-21 | 2010-10-28 | The University Of British Columbia | Système et procédés pour la détection de particules |
| EP2747555A2 (fr) * | 2011-08-23 | 2014-07-02 | Ecologic Technologies Ltd. | Compositions pesticides et préparation pesticide |
| EP2594942A1 (fr) * | 2011-11-16 | 2013-05-22 | Koninklijke Philips Electronics N.V. | Espaceurs rigides longs pour améliorer les cinétiques de liaison dans les dosages immunologiques |
| US9664036B2 (en) * | 2013-10-09 | 2017-05-30 | Halliburton Energy Services, Inc. | Systems and methods for measuring downhole fluid characteristics in drilling fluids |
-
2015
- 2015-04-20 EP EP21203006.8A patent/EP4009032A1/fr not_active Withdrawn
- 2015-04-20 WO PCT/US2015/026702 patent/WO2015164274A1/fr active Application Filing
- 2015-04-20 EP EP15783749.3A patent/EP3134719B1/fr active Active
- 2015-04-20 US US14/691,421 patent/US9752974B2/en active Active
-
2017
- 2017-08-17 US US15/679,465 patent/US10054532B2/en active Active
-
2018
- 2018-07-24 US US16/043,633 patent/US10408730B2/en active Active
Patent Citations (9)
| Publication number | Priority date | Publication date | Assignee | Title |
|---|---|---|---|---|
| DE19611931A1 (de) * | 1996-03-27 | 1997-10-02 | Euroferm Ges Fuer Fermentation | Verfahren und Vorrichtung zur optischen Messung von Partikeln und Stoffen in Fluiden |
| US6573991B1 (en) * | 2000-04-26 | 2003-06-03 | Martin Paul Debreczeny | Self-compensating radiation sensor with wide dynamic range |
| US20050254055A1 (en) * | 2004-01-20 | 2005-11-17 | Hong Peng | Apparatus and method for monitoring biological cell culture |
| US7100462B2 (en) | 2004-03-05 | 2006-09-05 | Buglab Llc | Self adjusting sensor mounting device |
| US20090075248A1 (en) | 2007-07-28 | 2009-03-19 | Buglab Llc | Particle sensor with wide linear range |
| US8603772B2 (en) | 2007-07-28 | 2013-12-10 | Bug Lab LLC | Particle sensor with wide linear range |
| EP2579020A1 (fr) * | 2010-06-04 | 2013-04-10 | Toru Obata | Dispositif de mesure de particules de gel |
| US20120194800A1 (en) * | 2010-07-30 | 2012-08-02 | Buglab Llc | Optical Sensor for Rapid Determination of Particulate Concentration |
| US8405033B2 (en) | 2010-07-30 | 2013-03-26 | Buglab Llc | Optical sensor for rapid determination of particulate concentration |
Also Published As
| Publication number | Publication date |
|---|---|
| US10054532B2 (en) | 2018-08-21 |
| US9752974B2 (en) | 2017-09-05 |
| US20180045635A1 (en) | 2018-02-15 |
| WO2015164274A1 (fr) | 2015-10-29 |
| US20150300938A1 (en) | 2015-10-22 |
| EP3134719B1 (fr) | 2021-11-03 |
| US20190017914A1 (en) | 2019-01-17 |
| US10408730B2 (en) | 2019-09-10 |
| EP3134719A4 (fr) | 2018-01-03 |
| EP3134719A1 (fr) | 2017-03-01 |
Similar Documents
| Publication | Publication Date | Title |
|---|---|---|
| US10408730B2 (en) | Particle sensor with interferent discrimination | |
| US8405033B2 (en) | Optical sensor for rapid determination of particulate concentration | |
| CN105358958B (zh) | 用于分析液滴中所含样本的光学测量仪器和方法 | |
| KR102502983B1 (ko) | 소량의 액체 샘플의 광학 검사 장치 및 이를 위한 큐벳 | |
| US9540701B2 (en) | Apparatus and method for automated process monitoring and control with near infrared spectroscopy | |
| KR20230145526A (ko) | 물질 준비 평가 시스템 | |
| US6573991B1 (en) | Self-compensating radiation sensor with wide dynamic range | |
| US6803594B2 (en) | Measuring system for optically determining concentration of turbid liquid samples | |
| JP2008510169A (ja) | 光学的測定を血液培養瓶に対して行う装置 | |
| CN101308156B (zh) | 分析装置 | |
| US20050101025A1 (en) | Apparatus for proteins and nucleic acids analysis | |
| US20110058165A1 (en) | Sample cell for spectrometric analysis and method of use | |
| JP6490918B2 (ja) | タンパク質量の測定装置及び測定方法 | |
| JP6359274B2 (ja) | 複合型ゲル粒子検出器およびその動作方法並びにエンドトキシン濃度の測定方法 | |
| US10234386B2 (en) | Nephelometer | |
| US20240125695A1 (en) | Optical analysis system for analysing biological processes | |
| US20210115370A1 (en) | Disposable bioreactor and use thereof | |
| US20220034789A1 (en) | Non-invasive continuous in line antifouling of atr-mir spectroscopic sensors | |
| JP2016021956A (ja) | Atp量の測定装置及び測定方法並びに生菌数の測定装置及び測定方法 |
Legal Events
| Date | Code | Title | Description |
|---|---|---|---|
| PUAI | Public reference made under article 153(3) epc to a published international application that has entered the european phase |
Free format text: ORIGINAL CODE: 0009012 |
|
| STAA | Information on the status of an ep patent application or granted ep patent |
Free format text: STATUS: THE APPLICATION HAS BEEN PUBLISHED |
|
| AC | Divisional application: reference to earlier application |
Ref document number: 3134719 Country of ref document: EP Kind code of ref document: P |
|
| AK | Designated contracting states |
Kind code of ref document: A1 Designated state(s): AL AT BE BG CH CY CZ DE DK EE ES FI FR GB GR HR HU IE IS IT LI LT LU LV MC MK MT NL NO PL PT RO RS SE SI SK SM TR |
|
| STAA | Information on the status of an ep patent application or granted ep patent |
Free format text: STATUS: THE APPLICATION IS DEEMED TO BE WITHDRAWN |
|
| 18D | Application deemed to be withdrawn |
Effective date: 20221209 |