EP3969879B1 - Wasserverunreinigungsmessungen mit dynamischer lichtstreuung - Google Patents
Wasserverunreinigungsmessungen mit dynamischer lichtstreuung Download PDFInfo
- Publication number
- EP3969879B1 EP3969879B1 EP20804990.8A EP20804990A EP3969879B1 EP 3969879 B1 EP3969879 B1 EP 3969879B1 EP 20804990 A EP20804990 A EP 20804990A EP 3969879 B1 EP3969879 B1 EP 3969879B1
- Authority
- EP
- European Patent Office
- Prior art keywords
- size
- impurity
- polymer beads
- amount
- water
- Prior art date
- Legal status (The legal status is an assumption and is not a legal conclusion. Google has not performed a legal analysis and makes no representation as to the accuracy of the status listed.)
- Active
Links
Images


Classifications
-
- G—PHYSICS
- G01—MEASURING; TESTING
- G01N—INVESTIGATING OR ANALYSING MATERIALS BY DETERMINING THEIR CHEMICAL OR PHYSICAL PROPERTIES
- G01N15/00—Investigating characteristics of particles; Investigating permeability, pore-volume or surface-area of porous materials
- G01N15/02—Investigating particle size or size distribution
- G01N15/0205—Investigating particle size or size distribution by optical means
- G01N15/0211—Investigating a scatter or diffraction pattern
-
- G—PHYSICS
- G01—MEASURING; TESTING
- G01N—INVESTIGATING OR ANALYSING MATERIALS BY DETERMINING THEIR CHEMICAL OR PHYSICAL PROPERTIES
- G01N15/00—Investigating characteristics of particles; Investigating permeability, pore-volume or surface-area of porous materials
- G01N15/06—Investigating concentration of particle suspensions
-
- G—PHYSICS
- G01—MEASURING; TESTING
- G01N—INVESTIGATING OR ANALYSING MATERIALS BY DETERMINING THEIR CHEMICAL OR PHYSICAL PROPERTIES
- G01N15/00—Investigating characteristics of particles; Investigating permeability, pore-volume or surface-area of porous materials
- G01N15/10—Investigating individual particles
- G01N15/1012—Calibrating particle analysers; References therefor
-
- G—PHYSICS
- G01—MEASURING; TESTING
- G01N—INVESTIGATING OR ANALYSING MATERIALS BY DETERMINING THEIR CHEMICAL OR PHYSICAL PROPERTIES
- G01N33/00—Investigating or analysing materials by specific methods not covered by groups G01N1/00 - G01N31/00
- G01N33/18—Water
-
- C—CHEMISTRY; METALLURGY
- C02—TREATMENT OF WATER, WASTE WATER, SEWAGE, OR SLUDGE
- C02F—TREATMENT OF WATER, WASTE WATER, SEWAGE, OR SLUDGE
- C02F2103/00—Nature of the water, waste water, sewage or sludge to be treated
- C02F2103/02—Non-contaminated water, e.g. for industrial water supply
- C02F2103/04—Non-contaminated water, e.g. for industrial water supply for obtaining ultra-pure water
-
- C—CHEMISTRY; METALLURGY
- C02—TREATMENT OF WATER, WASTE WATER, SEWAGE, OR SLUDGE
- C02F—TREATMENT OF WATER, WASTE WATER, SEWAGE, OR SLUDGE
- C02F2103/00—Nature of the water, waste water, sewage or sludge to be treated
- C02F2103/34—Nature of the water, waste water, sewage or sludge to be treated from industrial activities not provided for in groups C02F2103/12 - C02F2103/32
- C02F2103/346—Nature of the water, waste water, sewage or sludge to be treated from industrial activities not provided for in groups C02F2103/12 - C02F2103/32 from semiconductor processing, e.g. waste water from polishing of wafers
-
- G—PHYSICS
- G01—MEASURING; TESTING
- G01N—INVESTIGATING OR ANALYSING MATERIALS BY DETERMINING THEIR CHEMICAL OR PHYSICAL PROPERTIES
- G01N15/00—Investigating characteristics of particles; Investigating permeability, pore-volume or surface-area of porous materials
- G01N15/06—Investigating concentration of particle suspensions
- G01N15/075—Investigating concentration of particle suspensions by optical means
-
- G—PHYSICS
- G01—MEASURING; TESTING
- G01N—INVESTIGATING OR ANALYSING MATERIALS BY DETERMINING THEIR CHEMICAL OR PHYSICAL PROPERTIES
- G01N15/00—Investigating characteristics of particles; Investigating permeability, pore-volume or surface-area of porous materials
- G01N2015/0042—Investigating dispersion of solids
- G01N2015/0053—Investigating dispersion of solids in liquids, e.g. trouble
-
- G—PHYSICS
- G01—MEASURING; TESTING
- G01N—INVESTIGATING OR ANALYSING MATERIALS BY DETERMINING THEIR CHEMICAL OR PHYSICAL PROPERTIES
- G01N15/00—Investigating characteristics of particles; Investigating permeability, pore-volume or surface-area of porous materials
- G01N15/02—Investigating particle size or size distribution
- G01N15/0205—Investigating particle size or size distribution by optical means
- G01N15/0211—Investigating a scatter or diffraction pattern
- G01N2015/0222—Investigating a scatter or diffraction pattern from dynamic light scattering, e.g. photon correlation spectroscopy
-
- G—PHYSICS
- G01—MEASURING; TESTING
- G01N—INVESTIGATING OR ANALYSING MATERIALS BY DETERMINING THEIR CHEMICAL OR PHYSICAL PROPERTIES
- G01N15/00—Investigating characteristics of particles; Investigating permeability, pore-volume or surface-area of porous materials
- G01N15/10—Investigating individual particles
- G01N15/1012—Calibrating particle analysers; References therefor
- G01N2015/1014—Constitution of reference particles
-
- H—ELECTRICITY
- H01—ELECTRIC ELEMENTS
- H01L—SEMICONDUCTOR DEVICES NOT COVERED BY CLASS H10
- H01L21/00—Processes or apparatus adapted for the manufacture or treatment of semiconductor or solid state devices or of parts thereof
- H01L21/67—Apparatus specially adapted for handling semiconductor or electric solid state devices during manufacture or treatment thereof; Apparatus specially adapted for handling wafers during manufacture or treatment of semiconductor or electric solid state devices or components ; Apparatus not specifically provided for elsewhere
- H01L21/67005—Apparatus not specifically provided for elsewhere
- H01L21/67011—Apparatus for manufacture or treatment
- H01L21/67017—Apparatus for fluid treatment
- H01L21/67028—Apparatus for fluid treatment for cleaning followed by drying, rinsing, stripping, blasting or the like
- H01L21/6704—Apparatus for fluid treatment for cleaning followed by drying, rinsing, stripping, blasting or the like for wet cleaning or washing
Definitions
- the presently presented technology refers in general to water impurity measurements.
- the washing of the wafers during the manufacturing process is the washing of the wafers during the manufacturing process. If the rinsing water contains impurities, these impurities can get stuck to the wafer surface and potentially destroy the structures. In general it is believed that the impurities in the rinsing water has to be smaller than the line width of the wafer structures in order not to introduce a too large reject ratio of the produced wafers.
- PES Photoelectron spectroscopy
- ESA Electron Spectroscopy for Chemical Analysis
- XPS X-ray Photoelectron Spectroscopy
- Scanning Electron Microscopy is method for imaging small features.
- a surface is scanned in a raster scan pattern with a focused beam of electrons.
- the electrons interact with atoms in the sample, producing various signals that contain information about the surface topography and possibly composition of the sample.
- the position of the beam is combined with the intensity of the detected signals to produce an image.
- SEM mode secondary electrons emitted by atoms excited by the electron beam are detected.
- the number of secondary electrons that can be detected, and thus the signal intensity depends, among other things, on specimen topography.
- SEM can achieve resolution better than 1 nanometer and can therefore be used to analyze the sizes of impurities provided as a dry sample.
- Dynamic Light Scattering is a tracking analysis method based on recording Brownian motion in a sample. Measurements for particles with sizes below 10 nm have been made. However, the concentrations of such particles have to be very high to accomplish measureable signals, which concentrations are several magnitudes higher than the requested purity levels for rinsing water in the semiconductor industries. Further methods including particle size measurements, mostly based on DLS, are disclosed in US 2017/074768 A1 , US 2009/323061 A1 , US 2016/202164 A1 , US 2009/079981 A1 and US 2013/122538 A1 .
- a method for verifying the water impurity in a semiconductor manufacturing process has to be fast enough for enabling fast detection of batches where water of deficient quality has been used. Such batches may then be rejected and the reason for the bad water quality can be investigated before additional batches are influenced.
- the method has to be sensitive to impurities down in the region of at least 5-20 nm, to be compatible with near future line widths.
- DSA Directed Self-Assembly
- a general object is to achieve a method for determining water impurity that is suitable to be used as an on-line verification method in manufacturing processes.
- a method for determining a degree of impurity of water comprises performing of a DLS analysis of a multitude of samples of a water to be tested. Each sample of the multitude of samples comprises added single-size polymer beads of a respective size and in a respective known amount. The method further comprises determining of a smallest size of the single-size polymer beads giving rise to a detectable signal, discernible over a background noise level, in a size distribution curve of the dynamic light scattering analysis. Likewise, a smallest amount of the single-size polymer of the determined smallest size giving rise to a detectable signal, discernible over the background noise level, in the size distribution curve of the dynamic light scattering analysis is determined. A degree of impurity of the water to be tested is assigned in dependence of the determined smallest size and the determined smallest amount of the single-size polymer.
- a method for impurity classifying of water used in a manufacturing process comprises performing of a determining of a degree of impurity of water according to the first aspect for a calibration water sample having a known degree of impurity corresponding to an impurity limit for the manufacturing process.
- a threshold size and a threshold amount of the single-size polymer beads are defined as the determined smallest size and the determined smallest amount of the single-size polymer, respectively, for the calibration water sample.
- a process water sample is obtained from water to be used in the manufacturing process.
- the threshold amount of the single-size polymer beads of the threshold size is added to the process water sample.
- a DLS analysis of the process water sample is performed with the single-size polymer beads added.
- the process water sample is classified to have an impurity level equal to or lower than the impurity limit if a signal is detectable, and the process water sample is classified to have an impurity level higher than the impurity limit if a signal is not detectable.
- DLS Dynamic Light Scattering
- DLS is based on the Brownian motion of dispersed particles. Particles dispersed in water move randomly in all directions and collide frequently with water molecules. The collisions involve a transfer, influencing the particle movement. Smaller particles are influenced more than larger particles. If all parameters which have an influence on particle movement are known, it is possible to determine the hydrodynamic diameter simply by measuring the speed of the particles.
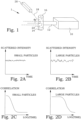
- FIG. 1 A simple sketch of a DLS analysis equipment 1 is illustrated in Figure 1 .
- a water sample 14 with dispersed or dissolved particles 22 is filled into a measurement volume, typically referred to as a cuvette 16.
- the cuvette 16 is illuminated by a laser 10 giving a light beam 12 of a well-defined single wavelength.
- the incident laser light gets scattered in all directions by dispersed or dissolved particles 22.
- the scattered light 18 is detected in a detector 20 at a certain angle ⁇ over time and this signal is used to determine the diffusion coefficient and the particle size by the Stokes-Einstein equation.
- D k B T 6 ⁇ R H , where D is the translational diffusion coefficient, measured in m 2 /s, i.e. the speed of the particles.
- k B is the Boltzmann constant, in m 2 kg/Ks 2
- T is the Temperature in K
- ⁇ is the viscosity in Pa s
- R H is the hydrodynamic radius, measured in m.
- a basic requirement for the Stokes-Einstein equation to be valid is that the movement of the particles needs to be a pure Brownian motion. If there is e.g. sedimentation in a measured sample, the movement is not random, which would lead to inaccurate results. In contrast, the lower size limit is defined by the signal-to-noise ratio. Small particles do not scatter much light, which leads to an insufficient measurement signal.
- FIGS 2A-B illustrate scattered intensity variations with time of a sample with small particles and a sample with large particles, respectively. Smaller particles show faster fluctuations, while larger particles show fluctuations of higher amplitudes.
- a self-correlation function is generated, describing the degree of similarities between intensity variations at different times. The correlation function thereby represents how long a particle is located at a same location within the water solution.
- An exponential decay of the correlation function means that the particles are moving. Thus, such a decay represents an indirect measure of the time that the particles need to change their relative positions.
- Figures 2C-D illustrate correlation functions corresponding to the intensity curves of Figures 2A and 2B , respectively. These calculations are typically plotted over a logarithmic time axis. Smaller particles show a faster decay of the correlation function.
- the hydrodynamic diameter i.e. a measure of the particle size, is then readily obtained by equation (1).
- the hydrodynamic diameter is in reality a measure of the hydrodynamic properties of the particle, and is intended to correspond to the hydrodynamic properties of a fully spherical particle.
- a particle having the same size, but another shape may therefore be assigned a slightly different hydrodynamic diameter.
- the hydrodynamic diameter is a good estimation of the real size of the particles.
- the correlation function gives information about the signal-to-noise ratio as well as on the presence of particles of different sizes.
- the correlation function should be smooth and with a single exponential decay.
- a non-linear baseline, e.g. including bumps indicates the presence of additional particles of other sizes. If there is not enough signal collected, the difference will be low and no meaningful correlation function can be generated. This might be the case, if very small particles are measured or the particle concentration is too low.
- a particle size distribution can be constructed, giving information about particles within the measured sample having different sizes.
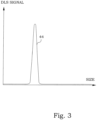
- Such a size distribution curve is schematically illustrated in Figure 3 , where a DLS signal representing the amount of particles is plotted as a function of the size. For a monodisperse sample, having a particles of a same size, a single peak appears. The width of the peak gives some information about how uniform the particle size is.
- the method would ideally give rise to multiple peaks in the size distribution curve.
- large particles have a much higher scattering cross-section than small particles, the possibilities to detect small particles among large particles are limited.
- the difference in size have to be large and the amount of small-sized particles have typically to be at least as large as for the large-sized particles.
- the correlation function does not show any distinct features and no distinct particle sizes can be determined in a size distribution curve. As mentioned above, this might be the case, if very small particles are measured or the particle concentration is too low. The size distribution curve will then only present a "background".
- the detection limit in terms of the amount of particles, depends to major extent on the existence of other particles in the sample, giving rise to a background noise level. In other words, the detection limit is dependent on the impurity of the liquid into which the particles are provided.
- beads of well-characterized sizes can be of different materials, such as metals, e.g. gold, or polymers, e.g. latex.
- metals e.g. gold
- polymers e.g. latex.
- beads having high light scattering cross-sections are not very useful, since even extremely low content of such beads gives rise to detectable signals.
- single-sized beads of polymers, typically latex have been used.
- a correlation database was built by the following process. It should, however, be noticed that the correlation can be expressed in other terms than through a database. However, basically the same type of relation data is used to establish a dependency between detection limits and impurity levels.
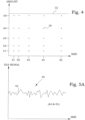
- a water sample to be tested is obtained and divided in a number of analysis volumes. Into each volume, a well-known amount of single-sized beads of a well-known size is added. This can for instance be performed according to the diagram of Figure 4 , where a number of analysis points 30 are illustrated. Here, 25 analysis volumes are used, each one corresponding to an analysis point 30, which have a unique pair of a size, selected from the set of S1-S5, and an amount, selected from the set of A1-A5. An amount limit 32 illustrated by a dotted line is a limit above which further analysis is believed not to be useful.
- the set of sizes is not necessarily equally spread over the size range, and may advantageously be selected with larger differences at larger sizes. Likewise, the set of amounts may also be provided in a non-equidistant manner. In a most general embodiment, the analysis points 30 may be spread over the amount/ size dimension in a non-regular manner.
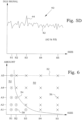
- FIG. 5A schematically illustrates a result from an analysis volume having single-sized beads of size S5 in an amount, sufficient to give a resolvable signal 44.
- Figure 5C schematically illustrates a result from an analysis volume having single-sized beads of size S4 in an amount, sufficient to give a resolvable signal 44.
- the amount of single-sized beads of size S3 is just enough to give a signal 44 that by a certain degree of significance can be distinguished from the background noise.
- a detectable signal 44 is thus a signal discernible over a background noise level 42 in the size distribution curve 40 of the DLS analysis.
- the detectable signal is a signal discernible over a background noise level at a size corresponding to the added single-size polymer beads.
- Figure 6 is a summary of one example of a measurement batch, where crosses 56 indicate measurements giving detectable signals and where circles 58 indicate measurements not giving any detectable signals from the single-sized beads.
- Two areas of the diagram can be defined, one area 50 where signals are present and one area 52 where the signals are concealed in the background. The shape and position of the boundary 54 between these two areas is characteristic for the particle content giving rise to the background. From this plot, a smallest size of the single-size polymer beads giving rise to a detectable signal in the DLS analysis can be found. In the present example, bead size S2 is such a smallest size. Also, a smallest amount of the single-size polymer of the determined smallest size giving rise to a detectable signal in the DLS analysis can be determined.
- the minimum amount giving a detectable signal for size S2 is A4.
- the pair of S2 and A4 gives a rough estimation of where the boundary 54 between the two areas 50, 52 is situated and can be used as a representation of the impurity content of the water.
- This DLS analysis is then preferably followed by e.g. a dry analysis of the same water sample.
- This analysis can e.g. be performed by ESCA or SEM. Such dry analysis will then establish the true impurity characterization of the sample.
- FIG. 7 illustrates a flow diagram of steps of an embodiment of a method for determining a degree of impurity of water.
- a DLS analysis is performed for a multitude of samples of a water to be tested. Each sample of the multitude of samples comprises added single-size polymer beads of a respective size and in a respective known amount. Preferred embodiments are presented further below.
- step 220 a smallest size of the single-size polymer beads giving rise to a detectable signal, discernible over a background noise level (42), in a size distribution curve (40) of the DLS analysis is determined.
- a smallest amount of the single-size polymer of the determined smallest size giving rise to a detectable signal, discernible over a background noise level (42), in a size distribution curve (40) of the DLS analysis is determined.
- a degree of impurity of said water to be tested is assigning in dependence of the determined smallest size and the determined smallest amount of the single-size polymer.
- the single-sized bead sizes and amounts for the samples can be spread out over the entire size/amount space of interest. This thus resembles the situation illustrated in Figure 6 .
- This approach may be convenient when the entire analysis is automated and where no intermediate analysis results are available before a next sample is to be analyzed.
- FIG 8 illustrates part steps of one embodiment of step 200.
- an amount of beads is added to a water sample.
- the size of the beads is the largest one of the available set of bead sizes.
- the amount of beads is preferably selected to be the lowest used amount. In other words, the first sample is placed in the lower right corner of an amount/size diagram.
- a DLS analysis is performed on the water sample.
- step 206 If it in step 206 is concluded that there is a detectable signal, the process continues to step 208, where a new reduced bead size is selected. The process then returns back to step 202, where a new water sample is prepared with the new reduced bead size.
- the amount of beads in this new sample is the same as in the previous one. If the amount is the lowest used amount, the choice is obvious. Also, if the previous bead size was tested also at a lower amount, but did not give rise to any detectable signal, it is very likely that there will be no signal for such amount with a reduced bead size either.
- step 206 If it in step 206 is concluded that there is no detectable signal, the process continues to step 210, where it is determined if the maximum used amount of beads is reached. In other words, it is checked whether or not the amount limit is reached.
- step 210 If it in step 210 is concluded that the maximum used amount of beads is not yet reached, the process continues to step 212, where a new increased bead amount is selected. The process then returns back to step 202, where a new water sample is prepared with the new increased bead amount.
- a new sample can be prepared from an original water sample with the entire new amount of beads is added.
- step 210 If it in step 210 is concluded that the maximum used amount of beads is reached, the analysis is ended.
- the smallest size of the single-size polymer beads giving rise to a detectable signal in the DLS analysis is thus the second last bead size.
- the smallest amount of the single-size polymer of the determined smallest size giving rise to a detectable signal in the DLS analysis is thus the highest amount of the samples with the second last bead size.
- the process according to this embodiment can also be expressed as the following.
- the step of performing a DLS analysis of a multitude of samples of a water to be tested comprises a step a) in which an amount of single-size polymer beads of a first size is added to a water sample.
- a DLS analysis of the water sample is performed.
- the steps a) and b) are in a step c) repeated for successively increased amounts of single-size polymer beads of the first size until a detectable signal, discernible over a background noise level (42), of the single-size polymer beads is achieved in a size distribution curve (40) of the DLS analysis.
- an amount of single-size polymer beads of a second size is added to a water sample.
- the second size is smaller than the first size.
- steps a), b), c) are performed for the second size.
- steps d) and e) are repeated for successively smaller sizes of the single-size polymer beads until an amount of single-size polymer beads above a predetermined maximum amount does not give rise to any detectable signal of the single-size polymer beads in the DLS analysis.
- Figure 9 illustrates the process of this embodiment in an amount/size diagram.
- a first analyzed sample comprises an amount A1 of beads of size S5.
- This sample gives a detectable signal of the added beads.
- the next sample is therefore selected to have a smaller bead size S4, but with the same amount A1.
- This sample gives a detectable signal.
- the third sample comprises an amount A1 of beads of size S3. Now, no signal is detectable.
- the next sample is therefor given a higher amount A2 of S3 sized beads. Now, a detectable signal is again achieved.
- a next sample is prepared comprising an amount A2 of beads of size S2. No signal is detected. Neither an increase of the amount to A3 gives any detectable signal of the S2 sized beads.
- a signal is detected.
- a next sample is prepared comprising an amount A4 of beads of size S1.
- A5 corresponds to the maximum amount limit, the analysis is ended.
- the last measurement giving a detected bead signal is used for determining the smallest size and the smallest amount, in this case S2 and A4, respectively.
- the above method gives a full analysis of the degree of purity by help of the predetermined correlation with dry analysis results.
- Figure 10 illustrates a flow diagram of steps of an embodiment of a method for impurity classifying of water used in a manufacturing process.
- the method comprises two phases.
- a preparing phase determines the requested level of purity in terms of amounts and sizes of added beads.
- a verifying phase is the part of the method actually performed at the manufacturing process for verifying if the used water fulfills the purity requirements.
- the preparing phase is performed once, while the verifying phase is performed whenever a classification of the water quality is requested on-line.
- a calibration water sample is analyzed.
- the calibration water sample has a known degree of impurity corresponding to an impurity limit for the manufacturing process in which the water is intended to be used.
- a determination of a degree of impurity of water is performed according to any of the above discussed embodiments. In such determination, a smallest size and a smallest amount is obtained.
- a threshold size of the single-size polymer beads is defined to be equal to that smallest size obtained for the calibration water sample.
- a threshold amount of the single-size polymer beads is defined to be equal to that smallest amount obtained for the calibration water sample.
- the verifying phase begins with step 260, in which a process water sample from water to be used in the manufacturing process is obtained.
- step 262 the threshold amount of threshold sized single-size polymer beads is added to the process water sample.
- a DLS analysis of the process water sample with the single-size polymer beads added is performed in step 264.
- step 266 it is determined if the added single-size polymer beads give rise to a detectable signal, discernible over a background noise level, in said size distribution curve of the DLS analysis.
- the process water sample is classified to have an impurity level equal to or lower than the impurity limit if a signal is detectable.
- the process water sample is classified to have an impurity level higher than the impurity limit if a signal is not detectable.
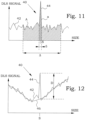
- FIG. 11 One way to detect whether or not a signal is present in a noisy background is illustrated in Figure 11 .
- the size S is the known size of the added beads.
- a narrow interval ⁇ and a broad interval ⁇ around the size S are selected.
- the total signal within these intervals is integrated, giving area measures a and A, respectively, of the areas under the signal.
- a ratio: R a ⁇ ⁇ A is calculated and compared to a threshold value R thres > 1. If the ratio is larger than the threshold, a detectable signal is determined to exist.
- a filtered background level 46 can be calculated and a standard deviation ⁇ of the original curve 42 around the filtered background level can be calculated.
Landscapes
- Chemical & Material Sciences (AREA)
- Life Sciences & Earth Sciences (AREA)
- Health & Medical Sciences (AREA)
- Physics & Mathematics (AREA)
- General Physics & Mathematics (AREA)
- Pathology (AREA)
- Analytical Chemistry (AREA)
- Biochemistry (AREA)
- General Health & Medical Sciences (AREA)
- Immunology (AREA)
- Dispersion Chemistry (AREA)
- Engineering & Computer Science (AREA)
- Medicinal Chemistry (AREA)
- Food Science & Technology (AREA)
- Condensed Matter Physics & Semiconductors (AREA)
- Manufacturing & Machinery (AREA)
- Computer Hardware Design (AREA)
- Microelectronics & Electronic Packaging (AREA)
- Power Engineering (AREA)
- Investigating Or Analysing Materials By Optical Means (AREA)
- Analysing Materials By The Use Of Radiation (AREA)
Claims (9)
- Verfahren zum Bestimmen des Verunreinigungsgrades von Wasser, das den folgenden Schritt umfasst:- Durchführen (200) einer dynamischen Lichtstreuungsanalyse einer Vielzahl von Proben von Wasser, das getestet werden soll,
dadurch gekennzeichnet, dassjede Probe der Vielzahl von Proben hinzugefügte Polymerkügelchen in Einzelgröße von jeweiliger Größe und in einer jeweils bekannten Menge umfasst;und ferner durch die folgenden Schritte gekennzeichnet:- Bestimmen (220) einer kleinsten Größe der Polymerkügelchen in Einzelgröße, die Anlass für ein detektierbares Signal (44) gibt, das über einen Grad eines Hintergrundrauschens (42) in einer Größenverteilungskurve (40) der dynamischen Lichtstreuungsanalyse wahrnehmbar ist;- Bestimmen (230) einer kleinsten Menge des Polymers in Einzelgröße von der bestimmten kleinsten Größe, die Anlass für ein detektierbares Signal (44) gibt, das über den Grad eines Hintergrundrauschens (42) in der Größenverteilungskurve (40) der dynamischen Lichtstreuungsanalyse wahrnehmbar ist;- Zuordnen (240) eines Verunreinigungsgrades von Wasser, das getestet werden soll, in Abhängigkeit von der bestimmten kleinsten Größe und von der bestimmten kleinsten Menge des Polymers in Einzelgröße. - Verfahren nach Anspruch 1, dadurch gekennzeichnet, dass der Schritt des Durchführens (200) einer dynamischen Lichtstreuungsanalyse einer Vielzahl von Proben von Wasser, das getestet werden soll, umfasst:- a) Zufügen (202) einer Menge an Polymerkügelchen in Einzelgröße einer ersten Größe zu einer Wasserprobe;- b) Durchführen (204) einer dynamischen Lichtstreuungsanalyse der Wasserprobe;- c) Wiederholen der Schritte a) und b) für aufeinanderfolgende erhöhte - Mengen (212) von Polymerkügelchen in Einzelgröße der ersten Größe so lange, bis ein detektierbares Signal (44), das über einen Grad eines Hintergrundrauschens (42) wahrnehmbar ist, von den Polymerkügelchen in Einzelgröße in der Größenverteilungskurve (40) der dynamischen Lichtstreuungsanalyse erzielt ist;- d) Zufügen einer Menge an Polymerkügelchen in Einzelgröße einer zweiten Größe zu einer Wasserprobe, wobei die zweite Größe kleiner als die erste Größe ist;- e) Durchführen der Schritte a), b) und c) für die zweite Größe; und- f) Wiederholen der Schritte d) und e) für aufeinanderfolgende kleinere Größen (208) der Polymerkügelchen in Einzelgröße so lange, bis eine Menge an Polymerkügelchen in Einzelgröße über einer vorgegebenen Maximalmenge keinen Anlass für irgendein detektierbares Signal (44), das über einen Grad eines Hintergrundrauschens (42) wahrnehmbar ist, von den Polymerkügelchen in Einzelgröße in der Größenverteilungskurve (40) der dynamischen Lichtstreuungsanalyse gibt.
- Verfahren nach Anspruch 1 oder 2, dadurch gekennzeichnet, dass das detektierbare Signal (44) ein Signal ist, das über einen Grad eines Hintergrundrauschens (42) in einer Größe (S) wahrnehmbar ist, die den zugefügten Polymerkügelchen in Einzelgröße entspricht.
- Verfahren nach einem der Ansprüche 1 bis 3, dadurch gekennzeichnet, dass die Größen der Polymerkügelchen in Einzelgröße ausgewählt sind aus einem vorgegebenen Satz von Größen.
- Verfahren nach einem der Ansprüche 1 bis 4, dadurch gekennzeichnet, dass die Polymerkügelchen in Einzelgröße Polymerkügelchen in dem Größenbereich von 5-400 nm umfassen.
- Verfahren nach einem der Ansprüche 1 bis 5, dadurch gekennzeichnet, dass die Polymerkügelchen in Einzelgröße Latexkügelchen in Einzelgröße sind.
- Verfahren nach einem der Ansprüche 1 bis 6, dadurch gekennzeichnet, dass der Schritt des Zuordnens eines Verunreinigungsgrades ein Wiederauffinden des Verunreinigungsgrades aus einer Datenbank umfasst, die die bestimmte kleinste Größe und die bestimmte kleinste Menge an dem Polymer in Einzelgröße mit den Ergebnissen von trockenen Wasserverunreinigungsanalysen korreliert.
- Verfahren nach einem der Ansprüche 1 bis 7, dadurch gekennzeichnet, dass der Verunreinigungsgrad eine typische Verunreinigungspartikelgröße und eine Anzahl von Verunreinigungspartikeln pro Volumeneinheit umfasst.
- Verfahren zum Klassifizieren von Verunreinigungen von Wasser, das in einem Herstellungsverfahren verwendet wird, gekennzeichnet durch die folgenden Schritte:- Durchführen (250) eines Bestimmens eines Verunreinigungsgrades von Wasser nach einem der Ansprüche 1 bis 8 für eine Kalibrierung einer Wasserprobe mit einem bekannten Verunreinigungsgrad, der einer Verunreinigungsgrenze für das Herstellungsverfahren entspricht;- Definieren (252) einer Schwellenwertgröße und einer Schwellenwertmenge der Polymerkügelchen in Einzelgröße als die bestimmte kleinste Größe und die bestimmte kleinste Menge des jeweiligen Polymers in Einzelgröße für die Kalibrierung der Wasserprobe;- Erhalten (260) einer Verfahrenswasserprobe aus dem Wasser, das in dem Herstellungsverfahren verwendet werden soll;- Zufügen (262) der Schwellenwertmenge der Polymerkügelchen in Einzelgröße der Schwellenwertgröße zu der Verfahrenswasserprobe;- Durchführen (264) einer dynamischen Lichtstreuungsanalyse der Verfahrenswasserprobe mit den hinzugefügten Polymerkügelchen in Einzelgröße;- Bestimmen (266), ob die hinzugefügten Polymerkügelchen in Einzelgröße Anlass für ein detektierbares Signal (44) geben, das über einen Grad eines Hintergrundrauschens (42) in der Größenverteilungskurve (40) der dynamischen Lichtstreuungsanalyse wahrnehmbar ist;- Klassifizieren (268) der Verfahrenswasserprobe, um einen Verunreinigungsgrad aufzuweisen, der gleich oder kleiner als die Verunreinigungsgrenze ist, wenn ein Signal (44) detektierbar ist, und ein Klassifizieren der Verfahrenswasserprobe, um einen Verunreinigungsgrad aufzuweisen, der höher als die Verunreinigungsgrenze ist, wenn ein Signal (44) nicht detektierbar ist.
Applications Claiming Priority (2)
| Application Number | Priority Date | Filing Date | Title |
|---|---|---|---|
| SE1950577A SE543406C2 (en) | 2019-05-15 | 2019-05-15 | Water impurity measurements with dynamic light scattering |
| PCT/SE2020/050492 WO2020231318A1 (en) | 2019-05-15 | 2020-05-14 | Water impurity measurements with dynamic light scattering |
Publications (4)
| Publication Number | Publication Date |
|---|---|
| EP3969879A1 EP3969879A1 (de) | 2022-03-23 |
| EP3969879A4 EP3969879A4 (de) | 2023-06-07 |
| EP3969879B1 true EP3969879B1 (de) | 2024-10-23 |
| EP3969879C0 EP3969879C0 (de) | 2024-10-23 |
Family
ID=73290312
Family Applications (1)
| Application Number | Title | Priority Date | Filing Date |
|---|---|---|---|
| EP20804990.8A Active EP3969879B1 (de) | 2019-05-15 | 2020-05-14 | Wasserverunreinigungsmessungen mit dynamischer lichtstreuung |
Country Status (8)
| Country | Link |
|---|---|
| US (1) | US12287267B2 (de) |
| EP (1) | EP3969879B1 (de) |
| JP (1) | JP7518096B2 (de) |
| KR (1) | KR102812833B1 (de) |
| CN (1) | CN114008439B (de) |
| CA (1) | CA3139935A1 (de) |
| SE (1) | SE543406C2 (de) |
| WO (1) | WO2020231318A1 (de) |
Families Citing this family (1)
| Publication number | Priority date | Publication date | Assignee | Title |
|---|---|---|---|---|
| CN116559401B (zh) * | 2023-07-11 | 2023-09-19 | 四川新环科技有限公司 | 一种水质检测方法 |
Family Cites Families (41)
| Publication number | Priority date | Publication date | Assignee | Title |
|---|---|---|---|---|
| US4794086A (en) * | 1985-11-25 | 1988-12-27 | Liquid Air Corporation | Method for measurement of impurities in liquids |
| JPH0663961B2 (ja) * | 1986-03-24 | 1994-08-22 | 日本科学工業株式会社 | 液中不純物測定方法とその測定装置 |
| US4830494A (en) * | 1986-07-10 | 1989-05-16 | Kowa Company Ltd. | Method and apparatus for measuring particles in a fluid |
| US5576827A (en) | 1994-04-15 | 1996-11-19 | Micromeritics Instrument Corporation | Apparatus and method for determining the size distribution of particles by light scattering |
| US10620105B2 (en) * | 2004-03-06 | 2020-04-14 | Michael Trainer | Methods and apparatus for determining characteristics of particles from scattered light |
| US10955327B2 (en) * | 2004-03-06 | 2021-03-23 | Michael Trainer | Method and apparatus for determining particle characteristics utilizing a plurality of beam splitting functions and correction of scattered light |
| US8705040B2 (en) * | 2004-03-06 | 2014-04-22 | Michael Trainer | Methods and apparatus for determining particle characteristics by measuring scattered light |
| WO2006132242A1 (ja) | 2005-06-09 | 2006-12-14 | Toss Ltd. | 超微小粒子の製造方法 |
| US20090323061A1 (en) | 2006-02-28 | 2009-12-31 | Lukas Novotny | Multi-color hetereodyne interferometric apparatus and method for sizing nanoparticles |
| US7935518B2 (en) | 2006-09-27 | 2011-05-03 | Alessandra Luchini | Smart hydrogel particles for biomarker harvesting |
| US7782459B2 (en) * | 2007-09-24 | 2010-08-24 | Process Metrix | Laser-based apparatus and method for measuring agglomerate concentration and mean agglomerate size |
| CA2630374A1 (en) * | 2007-10-03 | 2009-04-03 | The University Of Vermont And State Agricultural College | System and method for detecting and analyzing particles utilizing online light scattering and imaging techniques |
| EP2235501B1 (de) | 2008-01-15 | 2018-05-23 | Malvern Panalytical Limited | Lichtstreuungsmessungen mit Hilfe von simultaner Erkennung |
| US8272253B2 (en) * | 2008-01-22 | 2012-09-25 | Ct Associates, Inc. | Particle concentration measurement technology |
| DE102008024739B3 (de) | 2008-05-21 | 2009-12-31 | BAM Bundesanstalt für Materialforschung und -prüfung | Vorrichtung und Verfahren zur Analyse von Nanopartikeln mittels Kopplung von Feldfluss-Fraktionierung und Röntgenkleinwinkelstreuung |
| EP2304433A4 (de) | 2008-07-04 | 2011-08-03 | Canadian Blood Services | Dynamische lichtstreuung für in-vitro-tests von körperflüssigkeiten |
| US7738101B2 (en) | 2008-07-08 | 2010-06-15 | Rashid Mavliev | Systems and methods for in-line monitoring of particles in opaque flows |
| US20100179075A1 (en) | 2008-07-30 | 2010-07-15 | Life Technologies Corporation | Particles for use in supported nucleic acid ligation and detection sequencing |
| US20100031734A1 (en) | 2008-08-05 | 2010-02-11 | Nitto Denko Corporation | Method and system for detecting impurities in liquids |
| TW201017149A (en) | 2008-08-06 | 2010-05-01 | Invitrox Inc | Use of focused light scattering techniques in biological applications |
| CN101699265A (zh) | 2009-10-28 | 2010-04-28 | 上海理工大学 | 动态偏振光散射颗粒测量装置及测量方法 |
| GB2493391B (en) | 2011-08-05 | 2015-09-16 | Malvern Instr Ltd | Optical detection and analysis of particles |
| CN103398981B (zh) | 2013-08-22 | 2015-12-02 | 重庆大学 | 一种地沟油检测方法 |
| GB2520491A (en) | 2013-11-20 | 2015-05-27 | Malvern Instr Ltd | Improvements in or relating to calibration of instruments |
| EP4235151B1 (de) | 2014-01-31 | 2025-08-27 | The General Hospital Corporation | System und verfahren zur schätzung der mechanischen eigenschaften und der grösse von lichtstreuenden partikeln in materialien |
| KR101654461B1 (ko) * | 2014-02-24 | 2016-09-12 | 한양대학교 에리카산학협력단 | 표면 증강 라만 산란 기반 바이오센싱 및/또는 바이오이미지 측정용 그래핀 산화물에 의한 금속 나노입자 클러스터 구조의 sers 나노프로브 제조방법 |
| WO2015134139A1 (en) * | 2014-03-06 | 2015-09-11 | Life Technologies Corporation | Systems and methods for diagnosing a fluidics system and determining data processing settings for a flow cytometer |
| AT515577B1 (de) | 2014-03-12 | 2018-06-15 | Anton Paar Gmbh | Gemeinsamer Strahlungspfad zum Ermitteln von Partikel-information durch Direktbildauswertung und durch Differenzbildanalyse |
| EP3023770B1 (de) | 2014-11-21 | 2017-12-27 | Anton Paar GmbH | Bestimmung des Brechungsindexes einer Probe und der Teilchengröße von in der Probe enthaltenen Teilchen mittels einer Vorrichtung zur Messung der Lichtstreuung |
| WO2017051149A1 (en) | 2015-09-23 | 2017-03-30 | Malvern Instruments Limited | Particle characterisation |
| CN105203482B (zh) | 2015-09-23 | 2018-08-07 | 西南石油大学 | 疏水缔合聚合物分子量分布曲线的测定方法 |
| KR101832818B1 (ko) * | 2015-11-26 | 2018-02-28 | 한양대학교 에리카산학협력단 | 표면 증강 라만 산란 기반 바이오센싱 및/또는 바이오이미지 측정용 폴리에틸렌글리콜 접합 나노스케일 그래핀에 의해 유도된 금속 나노입자 클러스터 구조체 제조방법 |
| KR102619157B1 (ko) * | 2016-01-21 | 2023-12-28 | 도쿄엘렉트론가부시키가이샤 | 약액 공급 장치 및 도포 현상 시스템 |
| JP6953508B2 (ja) * | 2016-04-04 | 2021-10-27 | ベーリンガー インゲルハイム エルツェーファウ ゲゼルシャフト ミット ベシュレンクテル ハフツング ウント コンパニー コマンディトゲゼルシャフト | 製剤精製のリアルタイムモニタリング |
| JP6935644B2 (ja) | 2017-02-17 | 2021-09-15 | 国立大学法人東北大学 | 磁性体複合粒子およびその製造方法、並びに免疫測定用粒子 |
| WO2018175039A1 (en) * | 2017-03-20 | 2018-09-27 | Miller John F | Measuring electrophoretic mobility |
| JP6943657B2 (ja) | 2017-07-12 | 2021-10-06 | 株式会社堀場製作所 | 粒子分析装置、粒子分析システム、及び、粒子分析方法 |
| KR102632077B1 (ko) * | 2018-01-12 | 2024-02-01 | 후지필름 가부시키가이샤 | 약액, 약액의 제조 방법, 및 피검액의 분석 방법 |
| US11327007B2 (en) * | 2019-09-26 | 2022-05-10 | Fluidsens International Inc. | Compact and secure system and method for detecting particles in fluid |
| KR20230119638A (ko) * | 2020-12-17 | 2023-08-16 | 비온터 아게 | 액체 샘플 테스트 방법 |
| US11379966B1 (en) * | 2022-03-20 | 2022-07-05 | Alisha Iyer Jain | Impurity detection system in continually running water through machine vision software |
-
2019
- 2019-05-15 SE SE1950577A patent/SE543406C2/en unknown
-
2020
- 2020-05-14 JP JP2021566520A patent/JP7518096B2/ja active Active
- 2020-05-14 EP EP20804990.8A patent/EP3969879B1/de active Active
- 2020-05-14 CA CA3139935A patent/CA3139935A1/en active Pending
- 2020-05-14 WO PCT/SE2020/050492 patent/WO2020231318A1/en not_active Ceased
- 2020-05-14 US US17/610,092 patent/US12287267B2/en active Active
- 2020-05-14 KR KR1020217040687A patent/KR102812833B1/ko active Active
- 2020-05-14 CN CN202080031619.2A patent/CN114008439B/zh active Active
Also Published As
| Publication number | Publication date |
|---|---|
| KR102812833B1 (ko) | 2025-05-26 |
| EP3969879A4 (de) | 2023-06-07 |
| JP2022532573A (ja) | 2022-07-15 |
| EP3969879C0 (de) | 2024-10-23 |
| CN114008439A (zh) | 2022-02-01 |
| KR20220008877A (ko) | 2022-01-21 |
| SE1950577A1 (en) | 2020-11-16 |
| EP3969879A1 (de) | 2022-03-23 |
| US20220244159A1 (en) | 2022-08-04 |
| JP7518096B2 (ja) | 2024-07-17 |
| CA3139935A1 (en) | 2020-11-19 |
| CN114008439B (zh) | 2024-06-07 |
| SE543406C2 (en) | 2021-01-05 |
| US12287267B2 (en) | 2025-04-29 |
| WO2020231318A1 (en) | 2020-11-19 |
Similar Documents
| Publication | Publication Date | Title |
|---|---|---|
| US7483560B2 (en) | Method for measuring three dimensional shape of a fine pattern | |
| US20040099805A1 (en) | Electron microscope including apparatus for x-ray analysis and method of analyzing specimens using same | |
| EP3306653B1 (de) | Verfahren zur beurteilung eines halbleiterwafers | |
| JP2004516461A (ja) | 基板を検査するための方法及び装置 | |
| Crouzier et al. | A new method for measuring nanoparticle diameter from a set of SEM images using a remarkable point | |
| US6996492B1 (en) | Spectrum simulation for semiconductor feature inspection | |
| JP2019139912A (ja) | 検査システム、画像処理装置、および検査方法 | |
| Crouzier et al. | Influence of electron landing energy on the measurement of the dimensional properties of nanoparticle populations imaged by SEM | |
| EP3969879B1 (de) | Wasserverunreinigungsmessungen mit dynamischer lichtstreuung | |
| US7312446B2 (en) | Methods and systems for process monitoring using x-ray emission | |
| US6787770B2 (en) | Method of inspecting holes using charged-particle beam | |
| JP5533045B2 (ja) | 微細パターン測定方法及び微細パターン測定装置 | |
| US6784425B1 (en) | Energy filter multiplexing | |
| JP2024163060A (ja) | 測定されたeelsスペクトル内のイオン化エッジを確認してイオン化エッジの場所を見つける方法 | |
| US7365320B2 (en) | Methods and systems for process monitoring using x-ray emission | |
| US20030222215A1 (en) | Method for objective and accurate thickness measurement of thin films on a microscopic scale | |
| JPH08189896A (ja) | 表面異物検査装置及びそれを用いた表面異物分類方法 | |
| JP2006133019A (ja) | 透過電子顕微鏡又は走査型透過電子顕微鏡を用いた試料の分析方法及び分析装置 | |
| US7186977B2 (en) | Method for non-destructive trench depth measurement using electron beam source and X-ray detection | |
| CN115689980B (zh) | 在半导体样本中的侧向凹部测量 | |
| Buhr et al. | Traceable measurement of nanoparticle size using transmission scanning electron microscopy (TSEM) | |
| Xu et al. | Nanometer precision metrology of submicron Cu/SiO 2 interconnects using fluorescence and transmission X-ray microscopy | |
| CN120261325A (zh) | 使用电子束的加宽来确定层性质 | |
| Khvatkov et al. | Automated metrology for SEM calibration and CD line measurements using image analysis and SEM modeling methods | |
| Botton | Principles of Electron Energy Loss Spectroscopy and its Application to |
Legal Events
| Date | Code | Title | Description |
|---|---|---|---|
| STAA | Information on the status of an ep patent application or granted ep patent |
Free format text: STATUS: THE INTERNATIONAL PUBLICATION HAS BEEN MADE |
|
| PUAI | Public reference made under article 153(3) epc to a published international application that has entered the european phase |
Free format text: ORIGINAL CODE: 0009012 |
|
| STAA | Information on the status of an ep patent application or granted ep patent |
Free format text: STATUS: REQUEST FOR EXAMINATION WAS MADE |
|
| 17P | Request for examination filed |
Effective date: 20211207 |
|
| AK | Designated contracting states |
Kind code of ref document: A1 Designated state(s): AL AT BE BG CH CY CZ DE DK EE ES FI FR GB GR HR HU IE IS IT LI LT LU LV MC MK MT NL NO PL PT RO RS SE SI SK SM TR |
|
| DAV | Request for validation of the european patent (deleted) | ||
| DAX | Request for extension of the european patent (deleted) | ||
| REG | Reference to a national code |
Ref country code: HK Ref legal event code: DE Ref document number: 40072125 Country of ref document: HK |
|
| A4 | Supplementary search report drawn up and despatched |
Effective date: 20230511 |
|
| RIC1 | Information provided on ipc code assigned before grant |
Ipc: G01N 15/00 20060101ALI20230504BHEP Ipc: G01N 33/18 20060101ALI20230504BHEP Ipc: C02F 103/04 20060101ALI20230504BHEP Ipc: H01L 21/67 20060101ALI20230504BHEP Ipc: G01N 15/10 20060101ALI20230504BHEP Ipc: G01N 15/02 20060101ALI20230504BHEP Ipc: G01N 15/06 20060101AFI20230504BHEP |
|
| GRAP | Despatch of communication of intention to grant a patent |
Free format text: ORIGINAL CODE: EPIDOSNIGR1 |
|
| STAA | Information on the status of an ep patent application or granted ep patent |
Free format text: STATUS: GRANT OF PATENT IS INTENDED |
|
| RIC1 | Information provided on ipc code assigned before grant |
Ipc: G01N 33/18 20060101ALI20240506BHEP Ipc: C02F 103/04 20060101ALI20240506BHEP Ipc: H01L 21/67 20060101ALI20240506BHEP Ipc: G01N 15/00 20060101ALI20240506BHEP Ipc: G01N 15/10 20060101ALI20240506BHEP Ipc: G01N 15/0205 20240101ALI20240506BHEP Ipc: G01N 15/06 20060101AFI20240506BHEP |
|
| INTG | Intention to grant announced |
Effective date: 20240527 |
|
| GRAS | Grant fee paid |
Free format text: ORIGINAL CODE: EPIDOSNIGR3 |
|
| GRAA | (expected) grant |
Free format text: ORIGINAL CODE: 0009210 |
|
| STAA | Information on the status of an ep patent application or granted ep patent |
Free format text: STATUS: THE PATENT HAS BEEN GRANTED |
|
| AK | Designated contracting states |
Kind code of ref document: B1 Designated state(s): AL AT BE BG CH CY CZ DE DK EE ES FI FR GB GR HR HU IE IS IT LI LT LU LV MC MK MT NL NO PL PT RO RS SE SI SK SM TR |
|
| REG | Reference to a national code |
Ref country code: GB Ref legal event code: FG4D |
|
| REG | Reference to a national code |
Ref country code: CH Ref legal event code: EP |
|
| REG | Reference to a national code |
Ref country code: DE Ref legal event code: R096 Ref document number: 602020039983 Country of ref document: DE |
|
| REG | Reference to a national code |
Ref country code: IE Ref legal event code: FG4D |
|
| U01 | Request for unitary effect filed |
Effective date: 20241106 |
|
| U07 | Unitary effect registered |
Designated state(s): AT BE BG DE DK EE FI FR IT LT LU LV MT NL PT RO SE SI Effective date: 20241114 |
|
| PG25 | Lapsed in a contracting state [announced via postgrant information from national office to epo] |
Ref country code: IS Free format text: LAPSE BECAUSE OF FAILURE TO SUBMIT A TRANSLATION OF THE DESCRIPTION OR TO PAY THE FEE WITHIN THE PRESCRIBED TIME-LIMIT Effective date: 20250223 Ref country code: HR Free format text: LAPSE BECAUSE OF FAILURE TO SUBMIT A TRANSLATION OF THE DESCRIPTION OR TO PAY THE FEE WITHIN THE PRESCRIBED TIME-LIMIT Effective date: 20241023 |
|
| PG25 | Lapsed in a contracting state [announced via postgrant information from national office to epo] |
Ref country code: ES Free format text: LAPSE BECAUSE OF FAILURE TO SUBMIT A TRANSLATION OF THE DESCRIPTION OR TO PAY THE FEE WITHIN THE PRESCRIBED TIME-LIMIT Effective date: 20241023 |
|
| PG25 | Lapsed in a contracting state [announced via postgrant information from national office to epo] |
Ref country code: NO Free format text: LAPSE BECAUSE OF FAILURE TO SUBMIT A TRANSLATION OF THE DESCRIPTION OR TO PAY THE FEE WITHIN THE PRESCRIBED TIME-LIMIT Effective date: 20250123 |
|
| PG25 | Lapsed in a contracting state [announced via postgrant information from national office to epo] |
Ref country code: GR Free format text: LAPSE BECAUSE OF FAILURE TO SUBMIT A TRANSLATION OF THE DESCRIPTION OR TO PAY THE FEE WITHIN THE PRESCRIBED TIME-LIMIT Effective date: 20250124 |
|
| PG25 | Lapsed in a contracting state [announced via postgrant information from national office to epo] |
Ref country code: PL Free format text: LAPSE BECAUSE OF FAILURE TO SUBMIT A TRANSLATION OF THE DESCRIPTION OR TO PAY THE FEE WITHIN THE PRESCRIBED TIME-LIMIT Effective date: 20241023 |
|
| PG25 | Lapsed in a contracting state [announced via postgrant information from national office to epo] |
Ref country code: RS Free format text: LAPSE BECAUSE OF FAILURE TO SUBMIT A TRANSLATION OF THE DESCRIPTION OR TO PAY THE FEE WITHIN THE PRESCRIBED TIME-LIMIT Effective date: 20250123 |
|
| U20 | Renewal fee for the european patent with unitary effect paid |
Year of fee payment: 6 Effective date: 20250416 |
|
| PG25 | Lapsed in a contracting state [announced via postgrant information from national office to epo] |
Ref country code: SM Free format text: LAPSE BECAUSE OF FAILURE TO SUBMIT A TRANSLATION OF THE DESCRIPTION OR TO PAY THE FEE WITHIN THE PRESCRIBED TIME-LIMIT Effective date: 20241023 |
|
| PG25 | Lapsed in a contracting state [announced via postgrant information from national office to epo] |
Ref country code: SK Free format text: LAPSE BECAUSE OF FAILURE TO SUBMIT A TRANSLATION OF THE DESCRIPTION OR TO PAY THE FEE WITHIN THE PRESCRIBED TIME-LIMIT Effective date: 20241023 |
|
| PG25 | Lapsed in a contracting state [announced via postgrant information from national office to epo] |
Ref country code: CZ Free format text: LAPSE BECAUSE OF FAILURE TO SUBMIT A TRANSLATION OF THE DESCRIPTION OR TO PAY THE FEE WITHIN THE PRESCRIBED TIME-LIMIT Effective date: 20241023 |
|
| PLBE | No opposition filed within time limit |
Free format text: ORIGINAL CODE: 0009261 |
|
| STAA | Information on the status of an ep patent application or granted ep patent |
Free format text: STATUS: NO OPPOSITION FILED WITHIN TIME LIMIT |
|
| 26N | No opposition filed |
Effective date: 20250724 |