EP3753794A1 - Verfahren und vorrichtung zur überwachung der bremsleistung eines fahrzeugs - Google Patents
Verfahren und vorrichtung zur überwachung der bremsleistung eines fahrzeugs Download PDFInfo
- Publication number
- EP3753794A1 EP3753794A1 EP19181168.6A EP19181168A EP3753794A1 EP 3753794 A1 EP3753794 A1 EP 3753794A1 EP 19181168 A EP19181168 A EP 19181168A EP 3753794 A1 EP3753794 A1 EP 3753794A1
- Authority
- EP
- European Patent Office
- Prior art keywords
- brake
- vehicle
- sensor data
- brake performance
- wheel
- Prior art date
- Legal status (The legal status is an assumption and is not a legal conclusion. Google has not performed a legal analysis and makes no representation as to the accuracy of the status listed.)
- Pending
Links
- 238000000034 method Methods 0.000 title claims abstract description 50
- 238000012544 monitoring process Methods 0.000 title claims abstract description 19
- 238000004458 analytical method Methods 0.000 claims abstract description 40
- 239000000725 suspension Substances 0.000 claims abstract description 31
- 238000007619 statistical method Methods 0.000 claims abstract description 22
- 238000012360 testing method Methods 0.000 claims description 16
- 230000008859 change Effects 0.000 claims description 9
- 238000001914 filtration Methods 0.000 claims description 6
- 238000004590 computer program Methods 0.000 claims description 5
- 238000012545 processing Methods 0.000 claims description 5
- 238000007689 inspection Methods 0.000 description 17
- 230000001133 acceleration Effects 0.000 description 15
- 239000000523 sample Substances 0.000 description 14
- 238000005259 measurement Methods 0.000 description 13
- 238000013459 approach Methods 0.000 description 9
- 238000000611 regression analysis Methods 0.000 description 9
- 230000000694 effects Effects 0.000 description 7
- 238000009826 distribution Methods 0.000 description 6
- 230000006870 function Effects 0.000 description 6
- 230000008569 process Effects 0.000 description 6
- 230000009467 reduction Effects 0.000 description 6
- 239000013074 reference sample Substances 0.000 description 6
- 230000007423 decrease Effects 0.000 description 4
- 238000012417 linear regression Methods 0.000 description 4
- 238000012423 maintenance Methods 0.000 description 4
- 230000008901 benefit Effects 0.000 description 3
- 230000001419 dependent effect Effects 0.000 description 3
- 238000001514 detection method Methods 0.000 description 3
- 238000011156 evaluation Methods 0.000 description 3
- 238000012935 Averaging Methods 0.000 description 2
- 238000000540 analysis of variance Methods 0.000 description 2
- 230000007547 defect Effects 0.000 description 2
- 238000007781 pre-processing Methods 0.000 description 2
- 230000008439 repair process Effects 0.000 description 2
- 241000880493 Leptailurus serval Species 0.000 description 1
- ILVGMCVCQBJPSH-WDSKDSINSA-N Ser-Val Chemical compound CC(C)[C@@H](C(O)=O)NC(=O)[C@@H](N)CO ILVGMCVCQBJPSH-WDSKDSINSA-N 0.000 description 1
- 230000002159 abnormal effect Effects 0.000 description 1
- 230000009471 action Effects 0.000 description 1
- 238000001311 chemical methods and process Methods 0.000 description 1
- 230000001276 controlling effect Effects 0.000 description 1
- 238000007796 conventional method Methods 0.000 description 1
- 238000012937 correction Methods 0.000 description 1
- 230000008878 coupling Effects 0.000 description 1
- 238000010168 coupling process Methods 0.000 description 1
- 238000005859 coupling reaction Methods 0.000 description 1
- 238000013480 data collection Methods 0.000 description 1
- 238000013500 data storage Methods 0.000 description 1
- 230000002950 deficient Effects 0.000 description 1
- 230000006866 deterioration Effects 0.000 description 1
- 238000010586 diagram Methods 0.000 description 1
- 230000001747 exhibiting effect Effects 0.000 description 1
- 230000009474 immediate action Effects 0.000 description 1
- 230000007257 malfunction Effects 0.000 description 1
- 239000000463 material Substances 0.000 description 1
- 238000005457 optimization Methods 0.000 description 1
- 230000001105 regulatory effect Effects 0.000 description 1
- 230000004044 response Effects 0.000 description 1
- 238000012552 review Methods 0.000 description 1
- 238000005096 rolling process Methods 0.000 description 1
- 238000003860 storage Methods 0.000 description 1
- 238000012549 training Methods 0.000 description 1
- 238000012795 verification Methods 0.000 description 1
- 230000003442 weekly effect Effects 0.000 description 1
Images


Classifications
-
- B—PERFORMING OPERATIONS; TRANSPORTING
- B60—VEHICLES IN GENERAL
- B60T—VEHICLE BRAKE CONTROL SYSTEMS OR PARTS THEREOF; BRAKE CONTROL SYSTEMS OR PARTS THEREOF, IN GENERAL; ARRANGEMENT OF BRAKING ELEMENTS ON VEHICLES IN GENERAL; PORTABLE DEVICES FOR PREVENTING UNWANTED MOVEMENT OF VEHICLES; VEHICLE MODIFICATIONS TO FACILITATE COOLING OF BRAKES
- B60T17/00—Component parts, details, or accessories of power brake systems not covered by groups B60T8/00, B60T13/00 or B60T15/00, or presenting other characteristic features
- B60T17/18—Safety devices; Monitoring
- B60T17/22—Devices for monitoring or checking brake systems; Signal devices
- B60T17/221—Procedure or apparatus for checking or keeping in a correct functioning condition of brake systems
-
- B—PERFORMING OPERATIONS; TRANSPORTING
- B60—VEHICLES IN GENERAL
- B60T—VEHICLE BRAKE CONTROL SYSTEMS OR PARTS THEREOF; BRAKE CONTROL SYSTEMS OR PARTS THEREOF, IN GENERAL; ARRANGEMENT OF BRAKING ELEMENTS ON VEHICLES IN GENERAL; PORTABLE DEVICES FOR PREVENTING UNWANTED MOVEMENT OF VEHICLES; VEHICLE MODIFICATIONS TO FACILITATE COOLING OF BRAKES
- B60T8/00—Arrangements for adjusting wheel-braking force to meet varying vehicular or ground-surface conditions, e.g. limiting or varying distribution of braking force
- B60T8/17—Using electrical or electronic regulation means to control braking
- B60T8/172—Determining control parameters used in the regulation, e.g. by calculations involving measured or detected parameters
-
- B—PERFORMING OPERATIONS; TRANSPORTING
- B60—VEHICLES IN GENERAL
- B60T—VEHICLE BRAKE CONTROL SYSTEMS OR PARTS THEREOF; BRAKE CONTROL SYSTEMS OR PARTS THEREOF, IN GENERAL; ARRANGEMENT OF BRAKING ELEMENTS ON VEHICLES IN GENERAL; PORTABLE DEVICES FOR PREVENTING UNWANTED MOVEMENT OF VEHICLES; VEHICLE MODIFICATIONS TO FACILITATE COOLING OF BRAKES
- B60T8/00—Arrangements for adjusting wheel-braking force to meet varying vehicular or ground-surface conditions, e.g. limiting or varying distribution of braking force
- B60T8/32—Arrangements for adjusting wheel-braking force to meet varying vehicular or ground-surface conditions, e.g. limiting or varying distribution of braking force responsive to a speed condition, e.g. acceleration or deceleration
- B60T8/88—Arrangements for adjusting wheel-braking force to meet varying vehicular or ground-surface conditions, e.g. limiting or varying distribution of braking force responsive to a speed condition, e.g. acceleration or deceleration with failure responsive means, i.e. means for detecting and indicating faulty operation of the speed responsive control means
- B60T8/885—Arrangements for adjusting wheel-braking force to meet varying vehicular or ground-surface conditions, e.g. limiting or varying distribution of braking force responsive to a speed condition, e.g. acceleration or deceleration with failure responsive means, i.e. means for detecting and indicating faulty operation of the speed responsive control means using electrical circuitry
-
- G—PHYSICS
- G07—CHECKING-DEVICES
- G07C—TIME OR ATTENDANCE REGISTERS; REGISTERING OR INDICATING THE WORKING OF MACHINES; GENERATING RANDOM NUMBERS; VOTING OR LOTTERY APPARATUS; ARRANGEMENTS, SYSTEMS OR APPARATUS FOR CHECKING NOT PROVIDED FOR ELSEWHERE
- G07C5/00—Registering or indicating the working of vehicles
- G07C5/08—Registering or indicating performance data other than driving, working, idle, or waiting time, with or without registering driving, working, idle or waiting time
- G07C5/0808—Diagnosing performance data
-
- B—PERFORMING OPERATIONS; TRANSPORTING
- B60—VEHICLES IN GENERAL
- B60T—VEHICLE BRAKE CONTROL SYSTEMS OR PARTS THEREOF; BRAKE CONTROL SYSTEMS OR PARTS THEREOF, IN GENERAL; ARRANGEMENT OF BRAKING ELEMENTS ON VEHICLES IN GENERAL; PORTABLE DEVICES FOR PREVENTING UNWANTED MOVEMENT OF VEHICLES; VEHICLE MODIFICATIONS TO FACILITATE COOLING OF BRAKES
- B60T2260/00—Interaction of vehicle brake system with other systems
- B60T2260/06—Active Suspension System
-
- B—PERFORMING OPERATIONS; TRANSPORTING
- B60—VEHICLES IN GENERAL
- B60T—VEHICLE BRAKE CONTROL SYSTEMS OR PARTS THEREOF; BRAKE CONTROL SYSTEMS OR PARTS THEREOF, IN GENERAL; ARRANGEMENT OF BRAKING ELEMENTS ON VEHICLES IN GENERAL; PORTABLE DEVICES FOR PREVENTING UNWANTED MOVEMENT OF VEHICLES; VEHICLE MODIFICATIONS TO FACILITATE COOLING OF BRAKES
- B60T2270/00—Further aspects of brake control systems not otherwise provided for
- B60T2270/40—Failsafe aspects of brake control systems
- B60T2270/406—Test-mode; Self-diagnosis
-
- G—PHYSICS
- G07—CHECKING-DEVICES
- G07C—TIME OR ATTENDANCE REGISTERS; REGISTERING OR INDICATING THE WORKING OF MACHINES; GENERATING RANDOM NUMBERS; VOTING OR LOTTERY APPARATUS; ARRANGEMENTS, SYSTEMS OR APPARATUS FOR CHECKING NOT PROVIDED FOR ELSEWHERE
- G07C5/00—Registering or indicating the working of vehicles
- G07C5/008—Registering or indicating the working of vehicles communicating information to a remotely located station
Definitions
- the present invention relates to a method and an apparatus for monitoring a brake performance of a vehicle and, in particular, to a system and a vehicle dynamical control to predict maintenance for commercial vehicles including a trailer.
- Methods for monitoring a brake performance of a vehicle are known from GB 2 462 864 B , GB 2 531 391 B and GB 2 532 112 B .
- the braking control pressure and vehicle deceleration are measured at various moments during a braking event.
- the braking control pressures and vehicle decelerations are each classified into a set of ranges, and the number of values falling into a given range are counted.
- a value representing the quality of matching the tractor and trailer braking is calculated by dividing the average of the braking pressures with the average of the decelerations.
- GB 2 531 391 B and GB 2 532 112 B the braking control pressures and vehicle decelerations are measured at various points during a braking event.
- the deviation between the determined deceleration and the reference deceleration associated with the determined braking demand is determined and future brake events are estimated based on a trend analysis.
- the present invention relates to a method for monitoring a brake performance of a vehicle, in particular of a trailer of a commercial vehicle.
- the method includes: collecting of sensor data from various sensors, the sensor data are associated with brake events; determining at least one brake performance value using the sensor data based on at least two of the following analyses: (A) a suspension deflection analysis based on a comparison of deflections of wheel suspensions while braking; (B) a brake force loss analysis based on a comparison of wheel speed (or slip) values of different wheels; (C) a statistical analysis based on a regression.
- the method further includes detecting a malfunctioning of at least one brake of at least one wheel based on the determined at least one brake performance value.
- this method may further include an outputting of the results for display or alerting the driver (e.g. with respect of at least one brake performance value).
- the term regression may relate to a multiple or a simple/single regression. Embodiments may use the multiple regression instead of the simple regression, because the consideration of multiple parameters improves the statistical reliability. For example, a given parameter may for some reason be corrupt or the respective sensor may have encountered an error. It is understood that a multiple regression is more general than a single regression, because it may take into consideration multiple input parameters (that influence the outcome, i.e. the vehicle deceleration). Whereas the single regression analysis yields a one-dimensional curve representing the (linear) dependency on only one input parameter, the multiple regression analysis results in a hyperplane. Nevertheless, the single regression can be seen as a special limit of the multiple regression in that only one input parameter is used.
- a particular advantage of taking into consideration of plural analyses (A), (B), (C) relates to the achievable fault resistance. If for some reason one analysis provides a fault alert, this could be recognized. For example, if one of the brake performance values indicates a malfunctioning of at least one wheel brake, this result can first be verified by a second analysis before an conclusion is drawn (e.g. to issue an alert). Nevertheless, such fault alerts may be recorded in a log file for later inspection and review to find the cause of it.
- the defined three analyses (A), (B) and (C) are statistically independent, because they use different sensors or different (input) parameters so that there is no correlation between the obtained results. This is a particular advantage of embodiments over prior art results, because this increases significantly the reliability of the results.
- the statistical analysis includes one or more or all of the following steps:
- the reference sensor data may relate to reference brake events that may be taken during an inspection (e.g. a brake test on a designated brake tester) or immediately thereafter so that the resulting brake results can be assumed to be accurate.
- the sensor data collected during operation may be defined as sensor data taken for brake events under road conditions (during normal driving, i.e. not on a designated brake tester).
- These sensor data can be collected during predetermined time periods after a previous inspection or monitoring, wherein the predetermined time periods can be selected freely (e.g. within 3 days, 5 days, a week etc). However, they should result in a sample of brake events that is large enough to cover most of the relevant brake scenarios, but the time period should not be too long to have a chance to detect in time any brake failure.
- the ideal length of the time periods may vary, but can be find by an optimization (to find a compromise between both mentioned effects).
- the brake force loss analysis includes one or more or all of the following steps:
- One particular possibility would be to perform some or all of the method steps for all wheels that shall contribute to the braking on one side of an exemplary trailer. However, also a subset of the wheels can be taken into consideration for the method. It is also possible to consider the wheels on one or more axles, i. e. on both sides of the vehicle.
- the various sensors may include one or more height sensors for controlling one or more air bellows.
- the suspension deflection analysis includes one or more or all of the following steps:
- the method may include one or more or all of the following steps:
- each brake performance value may be compared with one or more thresholds to define a warning signal if one (weaker or lower) threshold is violated and/or an alarm if a second, stronger (or higher) threshold is violated.
- an alert is issued only if at least two thresholds (e.g. belonging to different brake performance values or to the same) are violated.
- the alert may be a weaker warning (e.g. an increasing decline of a brake) or a stronger alarm (e.g. a severe brake failure) and may be visualize to the driver (e.g. on a display to trigger an intermediate inspection) or at least stored in an error log file for later inspection.
- the method may include:
- the cornering may be detected using acceleration sensors that are sensible for lateral accelerations or yaw moments to detect the cornering.
- the vehicle is a trailer or a tractor or a vehicle combination and the collected sensor data are associated with wheels on one side or with wheels one or more axles of the vehicle.
- Embodiments of the present invention can, in particular, be implemented in electronic control unit (ECU) of an electronic brake system or implemented by software or a software module in any ECU. Therefore, embodiment relate also to a computer program having a program code for performing the method, when the computer program is executed on a processor. It is also possible that the evaluation is not performed within a control- or processing at the vehicle, but in a cloud or any kind for remote processing unit that is outside the vehicle. In addition, further embodiments relate to an loT (internet of things) device, which can be installed on a given vehicle.
- loT internet of things
- Embodiments relate further to an apparatus for monitoring a brake performance of a vehicle, in particular of a trailer of a commercial vehicle.
- the vehicle comprises various sensors for collecting sensor data associated to brake events.
- the apparatus includes a control unit configured to perform the following:
- control unit may further be configured to perform some or all steps of corresponding method.
- Embodiments relate further to a vehicle with an electronic brake system (EBS, TEBS) with an integrated apparatus as defined before.
- EBS electronic brake system
- TEBS electronic brake system
- a loss of brake performance is determined based on one or more analyses (A), (B), (C), wherein each analysis determine a brake performance value that can be compared with each other.
- This comparison offers the possibility to make an internal verification so that the likelihood of a failure can be double checked by the system.
- This results in a significant increase in the reliability since each approach is faced to appropriate influences effecting their accuracy which are mitigated by relying on the multiple approaches.
- the increase in the reliability is in particular achieved due to low cross-correlation of the different statistical analyses, which are based on very different data sets. Even if one data set shows an anomaly, it is extremely unlikely that the same anomaly occurs in the other approaches, because of the difference in the collected data.
- Fig. 1 depicts a flow chart of a method for monitoring a brake performance of a vehicle. The method comprises:
- This method may also be implemented by or on a computer.
- a person of skill in the art would readily recognize that various steps of the methods may be performed by programmed computers or any kind of processing unit.
- Embodiments are also intended to cover program storage devices, e.g., digital data storage media, which are machine or computer readable and encode machine-executable or computer-executable programs of instructions, wherein the instructions perform some or all of the acts of the described methods, when executed on the computer or processor.
- Fig. 2 illustrates a possible scenario for using the method according to embodiments.
- the brake performance value(s) BPV can be determined for the braking performance of some or each wheel and shall indicate an occurring malfunctioning of at least one of the wheel brakes of the vehicle (e.g. a trailer). Therefore, it will be used to monitor or estimate a future brake performance failure and can thus indicate a needed repair.
- the brake performance value BPV is above a particular selected first threshold TH1 (in Fig. 2 up to a first time t1).
- the brake performance value BPV drops below the first threshold TH1 indicating that a malfunctioning was detected that resulted in a steady decline of brake performance.
- an alert to schedule a service may be generated.
- the brake performance value BPV is again above the first threshold TH1 and will be further monitored continuously.
- trailers are to be checked in regular time intervals.
- the exemplary trailer can be checked during the normal safety inspection which, for example, is carried out based on the regulatory requirements (for example every 4 weeks or another period) to test and repair possible brake failures. If, however, the brake performance value BPV drops significantly below the first threshold TH1, an intermediate inspection may be needed. To detect such severe brake failures, a second threshold TH2 may be defined indicating that an immediate inspection/service is needed.
- the brake performance may be measured and recorded after each safety inspection. These results can be used as reference values. Although one could measure the brake performance already from a single measurement, the outcome is much more reliable if a statistical sample of brake events are collected to take into consideration allowable brake variations. For example, multiple braking events may be used to obtain a statistical sample of braking events which are supposed to have a normal distribution, for example at each, some or all wheels of the exemplary trailer. This reference sample can be used for a regression analysis to define the reference hyperplane, when using multiple regression, or a curve, when using a single, linear regression.
- the brake performance is determined over predefined time periods (e.g. on a weekly basis) by collecting brake events that define further samples that are to be compared with measured brake performance events for the reference sample taken after the inspection.
- the samples of brake events during normal operation e.g. the number of brake events, may be taken so that sufficient measure values are available.
- the samples should be not too large in order to ensure that a severe malfunctioning of the brake is immediately detected to initiate a needed inspection.
- the sample size may be within the region of 100 to 1000 brake events which are measured over a period of, e.g., one week or a couple of days.
- each of these samples are then compared with the reference sample which is taken immediately after the inspection in order to detect any brake performance loss during operation of the vehicle. This comparison is implemented by the mentioned statistical analysis. Ideally, the reference sample and the sample during normal operation are taken under equivalent situations and with more or less the same size.
- the brake performance value BPV can be based on different quantities.
- the brake performance value BPV may be related to a probability that the sample taken during normal operation of the vehicle has a sufficiently high statistical significance (high confidence level) with respect to the reference sample.
- the statistical significance, ⁇ is a measure to test a statistical (null) hypothesis whether or not it is very unlikely to have occurred given the null hypothesis. More precisely, the significance level can be defined as the probability of a sample rejecting the null hypothesis, given that it were true. The probability (p-value) of a result is the probability of obtaining the result and the difference (the deviation from the null hypothesis) is statistically significant when p ⁇ ⁇ .
- the significance level is chosen before data collection, and is typically set to 5% (implying a 95% confidence level) or much lower. The value can be selected freely, but should ensure the system does not generate too many false alerts.
- this statistical technique is used for testing if two populations of brake events are equal (hypothesis-test).
- the p-value describes the likelihood of this hypothesis. For example, they are equal for high p-value > 5 % and they are likely not equal for low p-value ⁇ 5 %.
- p-value can be taken as exemplary (pseudo) brake performance value BPV, wherein the smaller the p-value, the worse the brake performance (BP).
- the p-value gives no indication of the "direction" of the difference (the mean residual does) and no indication of the cause.
- there is also a risk of overfitting if sample size is small or does not include harsh brake events). Embodiments take also these effects into account.
- the statistical analysis may include one or more of the following steps:
- This statistical analysis can be separated into at least three main steps:
- Regression models describe the relationship between a response (output) variable and one or more predictor (input) variables. According to embodiments, a multiple linear regression with serval predictor variables will be used. Thus, the influence on vehicle deceleration occurred by the various parameters - beside the demand pressure - can be considered. For physical reasons, the brake performance can be influenced at least by the endurance brake, the drive train, the aerodynamic drag, the rolling resistance, the road gradient resistance, the coupling force between truck and trailer, vehicle load, ABS, ESP. These quantities can be considered as additional input variables for the regression analysis.
- the pad wear and temperature are of major interest and measurements at the wheel-end can capture those parameters. Also these parameters can be used as input variables for the regression analysis.
- the braking torque plays the most important role and offers high potentials in terms of monitoring the brake performance.
- there is a "bath-tube-diagram" describing a correlation between wear and temperature, showing a temperature range between 100 and 300 °C with a minimum of wear. At higher and lower temperatures, the wear increases significantly. Two main important scenarios can be mentioned. First, if the brake is not heated adequately during commissioning, appropriate chemical processes of the braking pad material cannot run sufficiently leading to a loss of brake performance.
- temperature signals may be considered with lower priority. It is understood that it is not needed to measure all parameters/quantities. Some of them (e.g. the braking torque, the temperature etc.) can also be estimated or determined or otherwise derived from (measured) parameters/quantities.
- the residuals are built between the to be tested brake events (brake applications) and the brake events of the reference data set.
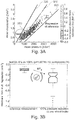
- Fig. 3A shows a result of the linear regression defining a reference curve 310.
- road braking events are shown that are distributed between road event limits 320.
- the reference curve 310 is based on data obtained, e.g., immediately after an inspection (e.g. a trailer inspection using a roller brake tester; RBT), where a sufficient brake performance is assumed.
- RBT roller brake tester
- the example shown in the Fig. 3A represents a linear regression based on public road measurements, since results of a multiple regression cannot be plotted in this way. It would give a hyperplane which can be depicted only for at most two input and one output parameter.
- Fig. 3A The statistical regression analysis of Fig. 3A relates the dependence of the mean deceleration as function of the mean pressure, wherein each dot relates to a braking event of a wheel.
- Fig. 3A further indicates the distance from the reference curve 310 as darkness/brightness of the brake events (dots). The more positive the deviation, the brighter is the brake event indicated. Similarly, the more negative the deviation the darker is the brake event indicated. In an ideal situation, the brake events at the separate wheels should lie close together near the reference curve 310.
- a significant pressure loss at least one wheel may be present. This relates in particular to crossing or fall below the lower limit 320. If the dots lay in-between the upper and lower limits 320, the brake performance is assumed to be correct.
- These residuals 330 can be taken from the statistical analysis of a given sample and by comparing the sample with the reference curve 310.
- the null hypothesis is thus that all tested brake events are random samples from the same population given by the reference brake events.
- the reference data may include the same number of braking events as the tested one and ensures satisfying brake performance. When a test result is deemed unlikely to have occurred by chance then it is statistically significant.
- the null-hypothesis can be rejected when its probability described by the p-value is below the pre-specified threshold of 5% (or another set value).
- the null-hypothesis when comparing the brake performance of reference brake events with further brake events during normal operation, the null-hypothesis would be that all brake applications have the same performance. Rejecting the null-hypothesis is taken to mean that the differences in observed brake performance between those observation groups are unlikely to be due to random deviations. Consequently, a loss of brake performance can be indicated.
- this test includes one or more of the following:
- the probability can be expressed, for example, by the p-value which in turn is bounded by the statistical significance level ⁇ or the confidence level (1- ⁇ ), which may by defined using the standard deviation of the normal distribution.
- a confidence level can be defined as 2 ⁇ , 3 ⁇ , 4 ⁇ etc. for the statement that both distributions originate from the same population, where ⁇ is the statistical standard deviation.
- the p-value describes the likelihood of this hypothesis and a high p-value > 5 % indicates an acceptable brake performance, whereas a low p-value ⁇ 5 % should give an alert for a loss of brake performance.
- the p-value may be used in this approach as a pseudo brake performance value (first brake performance value BPV1).
- first brake performance value BPV1 the worse the brake performance
- the p-value does not indicate the cause and direction of the failure, whether the failure is underbraking or overbraking.
- the nature of the p-value as a statistical value implies a risk of over- and underfitting depending on the appropriate sample size.
- Fig. 3B depicts a dependency of the residuals from a multiple regression curve for the example of a trailer which is loaded with 22 tons as a reference against a 100% pressure reduction measurement on one wheel of the test track (i.e. a total brake failure on one wheel).
- the sample includes 74 brake events.
- the reference measurement indicates a range of variations for the residuals from the multiple regression within ⁇ 0.1 m/s 2 (around a mean value of 0 for a given deceleration).
- the brake performance drops to a mean value of about -0.3 and with a significantly enlarged range of variations from 0 to about - 1 m/s 2 . Therefore, this large bandwidth of measured brake events is caused by the loss of pressure on one wheel.
- the p-value of approximately zero indicates this failure in the brake performance, since the brake performance compared to measurements does not belong to the reference data set. If the residuals of the measurements have a negative sign, the braking events relate to an under-braking, since they lay mostly under the regression curve. Therefore, a potential brake failure of the at least one wheel can be reliably detected by both values (a low p-value and negative residuals) confirming that the p-value in combination with the residuals can be used as reliable brake performance values BPV1.
- the process capability index (Cpk-value) can used as a viable brake performance value (which will also be denoted as BPV1).
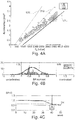
- This approach is based on the statutory requirements that the deceleration of the vehicle shall be limited by a compatibility band between an upper specific limit USL and a lower specific limit LSL, see Fig. 4A .
- the process capability index Cpk or process capability ratio is a statistical measure of process capability: the ability of a process to produce output within specification limits.
- the reference curve 310 could be again a given brake performance by the manufacturer (or be derived after an inspection). It could be the mean curve of the upper and lower limits USL, LSL of the compatibility band. Moreover, the compatibility band may be normalized in that braking points laying on the upper specific limit (USL) will be assigned to 1, analogous braking points on the lower specific limit (LSL) to -1 and braking point in the middle (reference curve 310) to 0 (nominal brake performance).
- Fig. 4B illustrates this idea, i.e. using the LSL and the USL from the given compatibility band as constant limits at +/-1.
- this allows to supervise the measured braking events by creating a histogram of them and then to calculate the appropriate normal distribution and check its situation (distance and movement) relative to the limits. If the histogram appears normal, then the standard deviation and mean can be used to create an approximate probability density function (pdf) with the parameter composed of pressure divided by the acceleration. Now the probability of braking events (observations) can be noted, wherein events below a given probability should indicate a braking failure.
- the Cpk-value is 0,57 (the distance to LSL).
- Fig. 4C shows a scenario of using this BPV1 as indicator of a brake performance.
- the BPV value is close to 1 (i.e. the Cpk value has not change much since the last inspection)
- the brake system at the different wheels is apparently operating correctly.
- the BPV start to deteriorate. This trend continues so that the BPV drops below a predefined threshold TH (e.g. 0,6 or 0,7) in the calendar week 40, which triggers an alert (e.g. given to the driver).
- a predefined threshold TH e.g. 0,6 or 0,7
- multiple thresholds can be used to indicate how severe the malfunctioning is (e.g. a dropping below a second, subsequent threshold may advice the driver to have an immediate maintenance).
- the brake performance may describe the braking of the whole vehicle combination of the truck and/or the trailer.
- control variables can be introduced to control sub-groups of larger sample of data to see whether they have a statistically significant effect on the measured deceleration/braking pressure variable.
- This part relates to a detecting a brake force loss on a wheel by comparing wheel speed or slip values of some or all wheels. The following wheels may be compared:
- axles of a trailer compared to some or all axles of a towing vehicle (tractor).
- the analysis of this part may include the following steps:
- the wheel speed raw signal may be analyzed in detail in order to determine potential differences in wheel speeds for specific brake applications. For this, all sensors data may be stored accordingly.
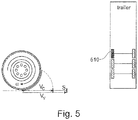
- Fig. 5 illustrates further the measurements, wherein on the right-hand side an exemplary trailer with six wheels and three axles are shown.
- one wheel 510 may exhibit a more or less severe pressure drop resulting in a braking loss on this side of the trailer. This failure can be detected by analyzing the slip value of the wheels.
- the unknown wheel speed Vc and vehicle velocity Vv can be obtained from corresponding speed sensors.
- the determined variance var can be used again to perform a statistical analysis whether or not a failure had occurred (e.g. var L is larger than a threshold value).
- a brake force loss is detected on one or more wheels by comparing the wheel speeds Vc of the left or right side with each other in order to supervise the symmetric brake force while braking. For this, all wheels may be sensed.
- a filtering may be conducted to exclude the influence of a cornering. Therefore, brake applications exceeding a given threshold of lateral acceleration (Ay) will be filtered out.
- Fig. 6 illustrates this filtering for a representation of braking events (dots) drawn depending on the slip variance for all six wheels (see Fig. 5 ) and the lateral acceleration Ay. It is apparent, a cornering vehicle will show lateral accelerations Ay and the corresponding brake events should be filtered to avoid false detections.
- the depicted brake events shall be filtered within a region around the zero lateral acceleration Ay so that only slip values s should be considered for the statistical analysis that are within a predetermined region of the lateral acceleration, for example Ay values of 0 ⁇ 500 or of 0 ⁇ 100 measured in mm/s 2 (or any other range dependent on the circumstances).
- the darker dots relate to brake events, which were simulated without pressure reduction whereas the brighter dots relate to a pressure reduction on one wheel. Therefore, the brake events about zero lateral acceleration (Ay ⁇ 0) are sufficient to detect a brake failure.
- the lateral accelerations Ay may be monitored by corresponding sensors and used for filtering of the determined slip values s of the vehicle such as a trailer.
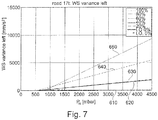
- Fig. 7 depicts this behavior for a trailer loaded with exemplary 17 tons of load with one wheel exhibiting a pressure drop.
- Fig. 7 shows the variance of slip values as function of the brake pressure for different scenarios of pressure failure on one wheel.
- a first curve 610 relate to a zero-pressure failure or at most 20% pressure failure, which are almost indistinguishable with respect to slip variance.
- a second curve 620 indicates the slip-variance for a 40% pressure reduction on one wheel on the left-hand side.
- the third curve 630 shows the determined slip-variance for a pressure reduction of 60%, whereas a forth curve 640 shows the dependence for a total pressure loss and a fifth curve 650 relates to a 80% pressure loss on a wheel on the left-hand side.
- this malfunctioning is detected by using one or more thresholds for the slip-variances, which can easily be detected for large brake pressure. If for example, the variance exceeds a first threshold value TH1 or a second threshold value TH2, an alert may be generated to indicate a potential failure. On the other hand, any slip-variations below the first threshold TH1 may be regarded as still acceptable or may have other reasons. In addition, according to further embodiments an alert is not trigger based on the single event exceeding this threshold. Instead, the statistical significance of the brake events may again be evaluated to ensure the reliability of the derived results.
- the curves in Fig. 7 may be derived as regression curves of calculated variances of each measurement, wherein the increased slope of the regression curves 610, ... , 650 represents an uneven brake distribution at the wheel end. With this regression curve, a potential defect of one wheel a loss of brake performance is very likely.
- embodiments evaluate the following quantities, which can also be recorded (e.g. for the next service inspection):
- the analysis of this part may include the following steps:
- Fig. 8 illustrates the suspension deflection analysis according to embodiments, wherein a change in a height H caused by a braking is detected and analyzed.
- This analysis can be performed on each wheel separately and Fig. 8 shows one exemplary wheel 710, which is suspended on a wheel arm 720 that couples rotatably to a frame 730 of the vehicle and couples to an air bellow 740.
- the height H of the air bellow 740 can be changed that causes a rotation of the wheel arm 720 about a rotational axis R.
- the height H of the air bellow 740 is thus a direct or indirect measure of a deflection of wheel arm 720.
- a height sensor (not shown) is arranged at the air bellow 740 or another position and is configured to measure the height H and thus the actuation level of the air bellow 740.
- the height sensor is configured to measure the actuation level of the air bellow 740 or the actual distance from the axle to the chassis (frame) and thus indirectly the height over ground. If the wheel 710 is braked, a braking force Fb acts between the wheel 710 and the ground and thus against the vehicle velocity V vehicle causing, due to the rotatable suspension, a torque or a vertical force which will decrease the height H.
- this deflection of the suspension arm 720 is likewise stronger so that the measurement of the height H can be used as an indicator how strong the brake force Fb acts on a particular wheel.
- the aim of this evaluation is to estimate the brake force ratio between the axles/wheels based on the deflection.
- the deflection forces Fzb and/or the braking force Fb can be compared between difference wheels to detect again a failure or malfunctioning of at least one wheel brake. Different brake forces acting at different wheels/axes can thus be detected and analysed based on the measured heights H.
- a third brake performance value BPV3 e.g. the deflection force Fzb
- a brake force Fb is acting on one or more wheels 710.
- a statistical analysis can be performed in that the brake actuations are measured using the height H of the air bellow sensors at each wheel and compare all wheels to enable a statistical analysis in the same way as for the analysis of part A or part B.
- the suspension deflection approach may include in particular one or more or all of the following steps/acts:
- the volume of the air bellow 740 in- or decreases, but the pressure in the air bellow 740 will be the same.
- the height H depends on the air volume, wherein the pressure is linear or proportional to the load of the trailer and the volume is linear to the height H.
- the electric leveling-control reacts much later and with increased tolerance and does not have an effect on this counter-force.
- the deflection at one or some or all individual axles can be measured and compared to each other, wherein the brake pressure at the brake(s) is measured in parallel. Besides the comparison, a learning algorithm based on the ratio between brake pressure and suspension deflection can be trained and monitored. This enables the detection of anomalies and defects (i.e. any kind of malfunctioning).
- embodiments may use further optional features/steps to further improve the results.
- further embodiments may also use median and ranges of pressure and acceleration.
- the averaging may reduce the noise and storage may points in a given range and places them into bins.
- a pre-processing can be implemented before the statistical methods are carried out.
- the brake events may include an averaging of the pressure and accelerations for a given time point.
- a speed vs. pressure graphs can be used to calculate the average braking pressure and deceleration for a given braking event.
- the pre-processing variables may be selected from:
- embodiments solve the objective to monitor the change of the brake performance by calculating brake performance values BPV (BPV1, BPV2, BPV3) having a same baseline and similar conditions. Otherwise the evaluation of the brake performance may yield false results.
- BPV brake performance values
- BPV1 BPV2, BPV3
- Advantageous embodiments may include at least some of the following steps/subject matters:
Landscapes
- Engineering & Computer Science (AREA)
- Transportation (AREA)
- Mechanical Engineering (AREA)
- Physics & Mathematics (AREA)
- General Physics & Mathematics (AREA)
- Valves And Accessory Devices For Braking Systems (AREA)
- Regulating Braking Force (AREA)
Priority Applications (1)
| Application Number | Priority Date | Filing Date | Title |
|---|---|---|---|
| EP19181168.6A EP3753794A1 (de) | 2019-06-19 | 2019-06-19 | Verfahren und vorrichtung zur überwachung der bremsleistung eines fahrzeugs |
Applications Claiming Priority (1)
| Application Number | Priority Date | Filing Date | Title |
|---|---|---|---|
| EP19181168.6A EP3753794A1 (de) | 2019-06-19 | 2019-06-19 | Verfahren und vorrichtung zur überwachung der bremsleistung eines fahrzeugs |
Publications (1)
| Publication Number | Publication Date |
|---|---|
| EP3753794A1 true EP3753794A1 (de) | 2020-12-23 |
Family
ID=66998300
Family Applications (1)
| Application Number | Title | Priority Date | Filing Date |
|---|---|---|---|
| EP19181168.6A Pending EP3753794A1 (de) | 2019-06-19 | 2019-06-19 | Verfahren und vorrichtung zur überwachung der bremsleistung eines fahrzeugs |
Country Status (1)
| Country | Link |
|---|---|
| EP (1) | EP3753794A1 (de) |
Cited By (4)
| Publication number | Priority date | Publication date | Assignee | Title |
|---|---|---|---|---|
| CN114537361A (zh) * | 2022-03-22 | 2022-05-27 | 中车制动系统有限公司 | 制动控制系统部件故障预测方法 |
| WO2022243156A1 (de) * | 2021-05-19 | 2022-11-24 | Robert Bosch Gmbh | Prognosevorrichtung und prognoseverfahren für zumindest eine bremssystemkomponente eines bremssystems eines eigenfahrzeugs |
| WO2022262999A1 (en) * | 2021-06-18 | 2022-12-22 | Volvo Truck Corporation | A method for assessing reliability of a brake assembly of a vehicle |
| WO2024083447A1 (de) * | 2022-10-18 | 2024-04-25 | Zf Cv Systems Global Gmbh | Verfahren zur überwachung der bremswirkung eines fahrzeugs, bremsensteuergerät, bremssystem und fahrzeug |
Citations (9)
| Publication number | Priority date | Publication date | Assignee | Title |
|---|---|---|---|---|
| US5707117A (en) * | 1996-07-19 | 1998-01-13 | General Motors Corporation | Active brake control diagnostic |
| WO1999006809A1 (en) * | 1997-07-29 | 1999-02-11 | Tom Lalor | Method and apparatus for determining vehicle brake effectiveness |
| US5892437A (en) * | 1995-08-21 | 1999-04-06 | University Of Washington | On-board brake warning device for air brake equipped vehicles |
| DE19745581A1 (de) * | 1997-10-15 | 1999-04-22 | Scania Cv Ab | Verfahren zur Bremskraftüberprüfung an einer Fahrzeugachse während der Fahrt |
| US20110066347A1 (en) * | 2009-09-11 | 2011-03-17 | Freescale Semiconductor, Inc. | Self monitoring braking system for vehicles |
| GB2462864B (en) | 2008-08-23 | 2012-05-23 | Haldex Brake Products Ltd | Method of and apparatus for monitoring the performance of a vehicle braking system |
| EP2468596A2 (de) * | 2010-12-21 | 2012-06-27 | Airbus Operations Limited | Verfahren zur Überwachung der Flugzeugbremsleistung und Vorrichtung zur Durchführung des Verfahrens |
| GB2532112B (en) | 2014-08-29 | 2017-02-22 | Axscend Ltd | Method and apparatus for monitoring operation of a vehicle braking system |
| EP3392107A2 (de) * | 2017-04-18 | 2018-10-24 | The Boeing Company | Bremsengesundheitsindikatorsysteme mit verwendung von eingangs- und ausgangsenergie |
-
2019
- 2019-06-19 EP EP19181168.6A patent/EP3753794A1/de active Pending
Patent Citations (10)
| Publication number | Priority date | Publication date | Assignee | Title |
|---|---|---|---|---|
| US5892437A (en) * | 1995-08-21 | 1999-04-06 | University Of Washington | On-board brake warning device for air brake equipped vehicles |
| US5707117A (en) * | 1996-07-19 | 1998-01-13 | General Motors Corporation | Active brake control diagnostic |
| WO1999006809A1 (en) * | 1997-07-29 | 1999-02-11 | Tom Lalor | Method and apparatus for determining vehicle brake effectiveness |
| DE19745581A1 (de) * | 1997-10-15 | 1999-04-22 | Scania Cv Ab | Verfahren zur Bremskraftüberprüfung an einer Fahrzeugachse während der Fahrt |
| GB2462864B (en) | 2008-08-23 | 2012-05-23 | Haldex Brake Products Ltd | Method of and apparatus for monitoring the performance of a vehicle braking system |
| US20110066347A1 (en) * | 2009-09-11 | 2011-03-17 | Freescale Semiconductor, Inc. | Self monitoring braking system for vehicles |
| EP2468596A2 (de) * | 2010-12-21 | 2012-06-27 | Airbus Operations Limited | Verfahren zur Überwachung der Flugzeugbremsleistung und Vorrichtung zur Durchführung des Verfahrens |
| GB2532112B (en) | 2014-08-29 | 2017-02-22 | Axscend Ltd | Method and apparatus for monitoring operation of a vehicle braking system |
| GB2531391B (en) | 2014-08-29 | 2018-05-16 | Axscend Ltd | Method and apparatus for monitoring operation of a vehicle braking system |
| EP3392107A2 (de) * | 2017-04-18 | 2018-10-24 | The Boeing Company | Bremsengesundheitsindikatorsysteme mit verwendung von eingangs- und ausgangsenergie |
Cited By (4)
| Publication number | Priority date | Publication date | Assignee | Title |
|---|---|---|---|---|
| WO2022243156A1 (de) * | 2021-05-19 | 2022-11-24 | Robert Bosch Gmbh | Prognosevorrichtung und prognoseverfahren für zumindest eine bremssystemkomponente eines bremssystems eines eigenfahrzeugs |
| WO2022262999A1 (en) * | 2021-06-18 | 2022-12-22 | Volvo Truck Corporation | A method for assessing reliability of a brake assembly of a vehicle |
| CN114537361A (zh) * | 2022-03-22 | 2022-05-27 | 中车制动系统有限公司 | 制动控制系统部件故障预测方法 |
| WO2024083447A1 (de) * | 2022-10-18 | 2024-04-25 | Zf Cv Systems Global Gmbh | Verfahren zur überwachung der bremswirkung eines fahrzeugs, bremsensteuergerät, bremssystem und fahrzeug |
Similar Documents
| Publication | Publication Date | Title |
|---|---|---|
| EP3753794A1 (de) | Verfahren und vorrichtung zur überwachung der bremsleistung eines fahrzeugs | |
| US6332354B1 (en) | Method and apparatus for determining vehicle brake effectiveness | |
| EP3431359B1 (de) | Verfahren, vorrichtung und programm zur auswertung des gleiszustands | |
| US6363331B1 (en) | Weight distribution monitor | |
| CN109572334B (zh) | 复合式胎压监测方法及胎压监测设备 | |
| US6539293B2 (en) | Method and device for monitoring bogies of multi-axle vehicles | |
| EP2326540B1 (de) | Verfahren und vorrichtung zur überwachung der leistung eines fahrzeugbremssystems | |
| EP3017972B1 (de) | Diagnostische radüberwachung | |
| CN103625459A (zh) | 汽车行车制动效能动态监测及报警系统 | |
| CN111140611B (zh) | 制动器摩擦片磨损预测方法、装置、车辆及存储介质 | |
| DE19613916A1 (de) | Verfahren und Vorrichtung zur Reifenüberwachung bei einem Fahrzeug | |
| CN104864006A (zh) | 使用esc系统的制动器摩擦衬垫磨损警报系统 | |
| EP3713780B1 (de) | Verfahren und system zur überwachung eines parameters im zusammenhang mit einem reifen während des fahrens eines fahrzeugs | |
| CN112469613A (zh) | 用于对车辆、车辆组件和行车道进行诊断和监控的方法和设备 | |
| CN114414023A (zh) | 传感器异常诊断方法及装置、存储介质 | |
| US20060116799A1 (en) | Method for monitoring chassis functions and chassis components | |
| US11691464B2 (en) | Methods for detecting and locating a thermal anomaly for a mounted assembly of a vehicle | |
| JP6533524B2 (ja) | 速度信号の乱れに基づいてアクスルモジュレータの装着位置を検査する方法、その方法を用いたブレーキシステム及び車両 | |
| KR20090115317A (ko) | 차량의 과적 및 부정계측 검출장치 | |
| AU2022241370A9 (en) | Systems and methods for determining angle of attack of a wheelset | |
| CA2297741C (en) | Method and apparatus for determining vehicle brake effectiveness | |
| KR102456621B1 (ko) | 공기입 타이어 모니터링 시스템 및 이를 이용한 공기입 타이어 모니터링 방법 | |
| CN111829649A (zh) | 车辆状态监测方法、噪音监测模块和车辆 | |
| KR101760456B1 (ko) | 과적차량 단속방법 | |
| EP3006234B1 (de) | Verfahren zur Beurteilung von abnormalem Laden von Fahrzeugen |
Legal Events
| Date | Code | Title | Description |
|---|---|---|---|
| PUAI | Public reference made under article 153(3) epc to a published international application that has entered the european phase |
Free format text: ORIGINAL CODE: 0009012 |
|
| STAA | Information on the status of an ep patent application or granted ep patent |
Free format text: STATUS: THE APPLICATION HAS BEEN PUBLISHED |
|
| AK | Designated contracting states |
Kind code of ref document: A1 Designated state(s): AL AT BE BG CH CY CZ DE DK EE ES FI FR GB GR HR HU IE IS IT LI LT LU LV MC MK MT NL NO PL PT RO RS SE SI SK SM TR |
|
| AX | Request for extension of the european patent |
Extension state: BA ME |
|
| STAA | Information on the status of an ep patent application or granted ep patent |
Free format text: STATUS: REQUEST FOR EXAMINATION WAS MADE |
|
| 17P | Request for examination filed |
Effective date: 20210623 |
|
| RBV | Designated contracting states (corrected) |
Designated state(s): AL AT BE BG CH CY CZ DE DK EE ES FI FR GB GR HR HU IE IS IT LI LT LU LV MC MK MT NL NO PL PT RO RS SE SI SK SM TR |
|
| STAA | Information on the status of an ep patent application or granted ep patent |
Free format text: STATUS: EXAMINATION IS IN PROGRESS |
|
| 17Q | First examination report despatched |
Effective date: 20221104 |
|
| GRAP | Despatch of communication of intention to grant a patent |
Free format text: ORIGINAL CODE: EPIDOSNIGR1 |
|
| STAA | Information on the status of an ep patent application or granted ep patent |
Free format text: STATUS: GRANT OF PATENT IS INTENDED |
|
| INTG | Intention to grant announced |
Effective date: 20240307 |