EP3563771A1 - Diagnostische ultraschallvorrichtung und steuerungsprogramm dafür - Google Patents
Diagnostische ultraschallvorrichtung und steuerungsprogramm dafür Download PDFInfo
- Publication number
- EP3563771A1 EP3563771A1 EP19168544.5A EP19168544A EP3563771A1 EP 3563771 A1 EP3563771 A1 EP 3563771A1 EP 19168544 A EP19168544 A EP 19168544A EP 3563771 A1 EP3563771 A1 EP 3563771A1
- Authority
- EP
- European Patent Office
- Prior art keywords
- strain
- elasticity index
- image data
- image
- diagnostic apparatus
- Prior art date
- Legal status (The legal status is an assumption and is not a legal conclusion. Google has not performed a legal analysis and makes no representation as to the accuracy of the status listed.)
- Withdrawn
Links
- 238000002604 ultrasonography Methods 0.000 claims abstract description 31
- 238000006243 chemical reaction Methods 0.000 claims abstract description 22
- 210000004185 liver Anatomy 0.000 claims description 19
- 239000002131 composite material Substances 0.000 claims description 12
- 239000000523 sample Substances 0.000 claims description 10
- 206010016654 Fibrosis Diseases 0.000 claims description 4
- 230000007882 cirrhosis Effects 0.000 claims description 4
- 208000019425 cirrhosis of liver Diseases 0.000 claims description 4
- 238000009826 distribution Methods 0.000 description 17
- 238000010586 diagram Methods 0.000 description 12
- 230000006870 function Effects 0.000 description 11
- 238000012986 modification Methods 0.000 description 9
- 230000004048 modification Effects 0.000 description 9
- 239000003086 colorant Substances 0.000 description 5
- 238000011156 evaluation Methods 0.000 description 5
- 210000004204 blood vessel Anatomy 0.000 description 4
- 201000010099 disease Diseases 0.000 description 4
- 208000037265 diseases, disorders, signs and symptoms Diseases 0.000 description 4
- 230000010349 pulsation Effects 0.000 description 4
- 230000005540 biological transmission Effects 0.000 description 2
- 230000000052 comparative effect Effects 0.000 description 2
- 208000019423 liver disease Diseases 0.000 description 2
- 230000006835 compression Effects 0.000 description 1
- 238000007906 compression Methods 0.000 description 1
- 238000001514 detection method Methods 0.000 description 1
- 238000002592 echocardiography Methods 0.000 description 1
- 239000004973 liquid crystal related substance Substances 0.000 description 1
- 238000000034 method Methods 0.000 description 1
- 239000004065 semiconductor Substances 0.000 description 1
Images


Classifications
-
- A—HUMAN NECESSITIES
- A61—MEDICAL OR VETERINARY SCIENCE; HYGIENE
- A61B—DIAGNOSIS; SURGERY; IDENTIFICATION
- A61B8/00—Diagnosis using ultrasonic, sonic or infrasonic waves
- A61B8/52—Devices using data or image processing specially adapted for diagnosis using ultrasonic, sonic or infrasonic waves
- A61B8/5292—Devices using data or image processing specially adapted for diagnosis using ultrasonic, sonic or infrasonic waves using additional data, e.g. patient information, image labeling, acquisition parameters
-
- A—HUMAN NECESSITIES
- A61—MEDICAL OR VETERINARY SCIENCE; HYGIENE
- A61B—DIAGNOSIS; SURGERY; IDENTIFICATION
- A61B8/00—Diagnosis using ultrasonic, sonic or infrasonic waves
- A61B8/48—Diagnostic techniques
- A61B8/485—Diagnostic techniques involving measuring strain or elastic properties
-
- A—HUMAN NECESSITIES
- A61—MEDICAL OR VETERINARY SCIENCE; HYGIENE
- A61B—DIAGNOSIS; SURGERY; IDENTIFICATION
- A61B8/00—Diagnosis using ultrasonic, sonic or infrasonic waves
- A61B8/08—Clinical applications
- A61B8/0833—Clinical applications involving detecting or locating foreign bodies or organic structures
- A61B8/085—Clinical applications involving detecting or locating foreign bodies or organic structures for locating body or organic structures, e.g. tumours, calculi, blood vessels, nodules
-
- A—HUMAN NECESSITIES
- A61—MEDICAL OR VETERINARY SCIENCE; HYGIENE
- A61B—DIAGNOSIS; SURGERY; IDENTIFICATION
- A61B8/00—Diagnosis using ultrasonic, sonic or infrasonic waves
- A61B8/46—Ultrasonic, sonic or infrasonic diagnostic devices with special arrangements for interfacing with the operator or the patient
- A61B8/461—Displaying means of special interest
- A61B8/463—Displaying means of special interest characterised by displaying multiple images or images and diagnostic data on one display
-
- A—HUMAN NECESSITIES
- A61—MEDICAL OR VETERINARY SCIENCE; HYGIENE
- A61B—DIAGNOSIS; SURGERY; IDENTIFICATION
- A61B8/00—Diagnosis using ultrasonic, sonic or infrasonic waves
- A61B8/52—Devices using data or image processing specially adapted for diagnosis using ultrasonic, sonic or infrasonic waves
- A61B8/5207—Devices using data or image processing specially adapted for diagnosis using ultrasonic, sonic or infrasonic waves involving processing of raw data to produce diagnostic data, e.g. for generating an image
-
- A—HUMAN NECESSITIES
- A61—MEDICAL OR VETERINARY SCIENCE; HYGIENE
- A61B—DIAGNOSIS; SURGERY; IDENTIFICATION
- A61B8/00—Diagnosis using ultrasonic, sonic or infrasonic waves
- A61B8/52—Devices using data or image processing specially adapted for diagnosis using ultrasonic, sonic or infrasonic waves
- A61B8/5215—Devices using data or image processing specially adapted for diagnosis using ultrasonic, sonic or infrasonic waves involving processing of medical diagnostic data
- A61B8/5223—Devices using data or image processing specially adapted for diagnosis using ultrasonic, sonic or infrasonic waves involving processing of medical diagnostic data for extracting a diagnostic or physiological parameter from medical diagnostic data
Definitions
- the present invention relates to an ultrasonic diagnostic apparatus which displays an elastic image indicative of the hardness or softness of a biological tissue in a subject, and a control program thereof
- An ultrasonic diagnostic apparatus which combines a normal B-mode image and an elastic image indicative of the hardness or softness of a biological tissue in a subject together and displays the result of combination, has been disclosed in, for example, Japanese Patent Publication No. 2007-282932 or the like.
- the elastic image is generated in the following manner, for example.
- a physical quantity related to the elasticity of the subject is first calculated based on echo signals obtained by transmitting ultrasound to the subject.
- the physical quantity is strain, for example.
- An elastic image comprised of a color corresponding to the elasticity is generated based on the calculated physical quantity and displayed.
- the invention made to solve the above problems is an ultrasonic diagnostic apparatus which is equipped with a physical quantity calculating unit which calculates a physical quantity related to elasticity of each part in a biological tissue, based on echo signals obtained by transmission/reception of ultrasound to and from the biological tissue, an elastic image data generating unit which generates elastic image data having information indicative of a display form corresponding to the physical quantity calculated by the physical quantity calculating unit, and a displayer which causes an elastic image having the display form corresponding to the physical quantity to be displayed on an ultrasound image of the biological tissue, based on the elastic image data.
- the elastic image data generating unit generates the elastic image data, based on information, the information being information in which the physical quantity and the information indicative of the display form are associated with each other, and in which the information indicative of the display form changes depending on a physical quantity in a prescribed range of physical quantities set in advance.
- the displayer displays an elasticity index image indicating an elasticity index indicative of a relative relationship between a typical value representative of a physical quantity in a region set to the ultrasound image and the prescribed range of physical quantities.
- an elasticity index image indicating an elasticity index indicative of a relative relationship between a typical value representative of a physical quantity in a region set to the ultrasound image and the prescribed range of physical quantities is displayed, the elasticity of a biological tissue can be shown in a quantified form. It is thus possible to recognize the elasticity of the biological tissue and properly perform the evaluation of a disease.
- FIGS. 1 through 8 A first embodiment will first be explained based on FIGS. 1 through 8 .
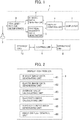
- An ultrasonic diagnostic apparatus 1 shown in FIG. 1 is equipped with an ultrasonic probe 2, a transmit-receive beamformer 3, a B-mode data generator 4, a physical quantity data generator 5, a display controller 6, a displayer 7, an operation unit 8, a controller 9 and a storage unit 10.
- the ultrasonic probe 2 transmits ultrasound to a subject and receives its echoes.
- the transmit-receive beamformer 3 drives the ultrasonic probe 2 under a predetermined scan condition to perform the scanning of the ultrasound every sound ray. Also, the transmit-receive beamformer 3 performs signal processing such as phasing-adding processing on each echo received by the ultrasonic probe 2. Echo data subjected to the signal processing by the transmit-receive beamformer 3 is outputted to the B-mode data generator 4 and the physical quantity data generator 5.
- the transmit-receive beamformer 3 is one example illustrative of an embodiment of transmit-receive beamformer in the present invention.
- the B-mode data generator 4 performs B-mode processing such as logarithmic compression processing, envelop detection processing or the like on the echo data outputted from the transmit-receive beamformer 3 to thereby generate B-mode data.
- the B-mode data may be stored in the storage unit 10.
- the physical quantity data generator 5 calculates a physical quantity related to the elasticity of each portion in the subject, based on the echo data outputted from the transmit-receive beamformer 3 to generate physical quantity data (physical quantity calculating function). As described in, for example, Japanese Unexamined Patent Publication No. 2008-126079 , the physical quantity data generator 5 sets correlation windows to echo data different in time on the same sound ray at one scanning surface. The physical quantity data generator 5 performs a correlation computation between the correlation windows to calculate a physical quantity related to the elasticity for each pixel, thereby generating physical quantity data corresponding to one frame. Accordingly, the physical quantity data corresponding to one frame is obtained from echo data corresponding to two frames, and an elastic image is generated as will be described later.
- the physical quantity data generator 5 calculates strain as the physical quantity related to the elasticity in the present embodiment. That is, the physical quantity data is data about the strain. In the present embodiment, as will be described later, strain is calculated by the deformation of the liver due to the pulsation of the heart or blood vessels.
- the physical quantity data generator 5 is one example illustrative of an embodiment of a physical quantity calculating unit in the present invention.
- the physical quantity calculating function is one example illustrative of an embodiment of a physical quantity calculating function in the present invention.
- the physical quantity data may be stored in the storage unit 10.
- the display controller 6 is inputted with the B-mode data from the B-mode data generator 4 and the physical quantity data from the physical quantity data generator 5. As shown in FIG. 2 , the display controller 6 has a B-mode image data generating unit 61, an elastic image data generating unit 62, an average value calculating unit 63, an elasticity index calculating unit 64, an elasticity index image generating unit 65, and an image display control unit 66.
- the B-mode image data generating unit 61 performs scan conversion based on a scan converter on the B-mode data to convert it to B-mode image data having information indicative of brightness corresponding to the signal intensity of each echo.
- the B-mode image data has information indicative of brightness of 256 levels of gray, for example.
- the elastic image data generating unit 62 converts the physical quantity data to information indicative of colors and performs scan conversion based on the scan converter to generate color elastic image data having information indicative of colors corresponding to strain (color elastic image data generating function).
- the elastic image data generating unit 62 brings physical quantity data into gradation and generates color elastic image data comprised of information indicative of colors assigned to respective gradations. The details thereof will be described later.
- the elastic image data generating unit 62 is one example illustrative of an embodiment of an elastic image data generating unit in the present invention.
- the color elastic image data is one example illustrative of an embodiment of elastic image data having information indicative of a display form corresponding to a physical quantity in the present invention.
- the information indicative of the display form is information indicative of each color in the present embodiment.
- the color elastic image data generating function is one example illustrative of an embodiment of an elastic image data generating function in the present invention.
- the average value calculating unit 63 calculates an average value Stav of strain calculated by the physical quantity data generating unit 5 in a region R (refer to FIG. 3 ) set to a B-mode image BI as will be described later.
- This average value Stav of strain is one example illustrative of an embodiment of a typical value representative of a physical quantity of a region in the present invention.
- the average value calculating unit 63 is one example illustrative of an embodiment of a typical value calculating unit in the present invention.
- the elasticity index calculating unit 64 calculates an elasticity index.
- the elasticity index is an index of the elasticity of a biological tissue in the region R.
- the elasticity index image generating unit 65 generates an elasticity index image indicative of the elasticity index calculated by the elasticity index calculating unit 64. The details thereof will be explained later.
- the elasticity index calculating unit 64 is one example illustrative of an embodiment of an elasticity index calculating unit in the present invention.
- the elasticity index image generating unit 65 is one example illustrative of an embodiment of an elasticity index image generating unit in the present invention.
- the image display control unit 66 combines the B-mode image data and the color elastic image data together and generates image data of a composite ultrasound image displayed on the displayer 7.
- the image display control unit 66 causes the displayer 7 to display the image data as a composite ultrasound image UI obtained by combining a B-mode image BI and an elastic image EI (refer to FIG. 3 ).
- the elastic image EI is displayed in the region R set to the B-mode image BI.
- the B-mode image data and the color elastic image data may be stored in the storage unit 10.
- the image data of the composite ultrasound image may be stored in the storage unit 10.
- the image display control unit 66 causes the displayer 7 to display an elasticity index image InI indicative of the elasticity index generated by the elasticity index image generating unit 65 along with the composite ultrasound image UI (refer to FIG. 3 ).
- the image display control unit 66 is one example illustrative of an embodiment of an image display control unit in the present invention and performs an image display control function in the present invention.
- the displayer 7 is comprised of, for example, an LCD (Liquid Crystal Display), a CRT (Cathode Ray Tube) or the like.
- the displayer 7 is one example illustrative of an embodiment of a displayer in the present invention.
- the operation unit 8 includes a keyboard and a pointing device (not shown) or the like for inputting instructions and information by an operator.
- the controller 9 is comprised of a CPU (Central Processing Unit).
- the controller 9 reads a control program stored in the storage unit 10 to execute functions at the respective parts of the ultrasonic diagnostic apparatus 1, starting with the physical quantity calculating function, the color elastic image data generating function and the image display control function.
- a control program stored in the storage unit 10 to execute functions at the respective parts of the ultrasonic diagnostic apparatus 1, starting with the physical quantity calculating function, the color elastic image data generating function and the image display control function.
- the storage unit 10 is, for example, an HDD (Hard Disk Drive), or a semiconductor memory such as a RAM (Random Access Memory), a ROM (Read Only Memory) or the like.
- HDD Hard Disk Drive
- RAM Random Access Memory
- ROM Read Only Memory
- the transmit-receive beamformer 3 causes the ultrasonic probe 2 to transmit ultrasound to a biological tissue of a subject.
- the ultrasound is transmitted to the liver of the subject by the ultrasonic probe 2.
- the transmit-receive beamformer 3 may cause the ultrasonic probe 2 to alternately transmit ultrasound for generating a B-mode image and ultrasound for generating an elastic image. Echo signals of ultrasound transmitted from the ultrasonic probe 2 are received by the ultrasonic probe 2.
- the liver is repeatedly deformed depending on the pulsation of the heart or blood vessels.
- a composite ultrasound image that has taken deformation as strain is generated based on echo signals obtained from the liver in which such deformation has been repeated.
- the B-mode data generator 4 generates B-mode data
- the physical quantity data generator 5 calculates strain to generate physical quantity data.
- the B-mode image data generating unit 61 generates B-mode image data, based on the B-mode data
- the elastic image data generating unit 62 generates color elastic image data, based on the physical quantity data.
- the image display control unit 66 causes the displayer 7 to display a composite ultrasound image UI in which a B-mode image BI based on the B-mode image data and an elastic image EI based on the color elastic image data are combined, as shown in FIG. 3 .
- the composite ultrasound image UI is a real-time image.
- the elastic image EI is displayed within a region R (shown in dots).
- the image display control unit 66 causes the displayer 7 to display the elasticity index image InI as shown in FIG. 3 .
- the elasticity index image InI includes an elasticity index graph G indicative of changes in elasticity index with time. The details thereof will be described later.
- the elastic image data generating unit 62 converts the physical quantity data to information indicative of colors (hereinafter called "color information"), based on a color conversion table TA to thereby generate the color elastic image data comprised of color information corresponding to a physical quantity.
- color information is one example illustrative of an embodiment of information indicative of a display form in the present invention.
- the color conversion table TA will be explained.
- the color conversion table TA can be shown in the graph shown in FIG. 4 , for example.
- the color conversion table TA shown in FIG. 4 takes the form of a graph having a slope part S1 and a horizontal part Hr.
- a predetermined range X of strain extending from zero to strain Stmax corresponds to the slope part S1.
- the color information is set so as to change stepwise depending on the strain.
- the gradation 0 is color information indicative of blue
- the gradation N is color information indicative of red
- the gradation N/2 being gradation in the middle between the gradation 0 and the gradation N is color information indicative of green.
- the color changes from blue to green between the gradation 0 and the gradation N/2
- the predetermined strain range X is one example illustrative of a predetermined range of physical quantities in the present invention.
- the maximum value Stmax of strain in the predetermined strain range X is converted to the gradation N. Strain greater than or equal to the maximum value Stmax is converted to the gradation N. That is, strain is converted to the gradation N at the horizontal part Hr. Thus, the strain greater than or equal to the maximum value Stmax is represented in the same color (e.g., red) at an elastic image.
- the predetermined strain range X is set in advance to a range of values of strain that the liver being targeted for the display of an elastic image can take according to the deformation of the liver due to the pulsation of the heart or blood vessels.
- the predetermined strain range X is set to such a range that it includes from the value of strain of the normal liver to the value of strain of a liver of cirrhosis.
- the elasticity index graph G is a graph indicative of time changes in elasticity index In.
- the elasticity index In indicates a relative relationship between the average value Stav of strain in the region R and the predetermined range X of strain. This relative relationship means a position relationship of the average value Stav to the predetermined strain range X.
- the elasticity index In indicates in which position the average value Stav exists with respect to the predetermined strain range X.
- the elasticity index In is a numeric value with a percent (%) as a unit. As shown in FIG. 5 , for example, when the average value Stav of strain is of the central value of the strain range X, the elasticity index In is 50%. It is able to recognize from such an elasticity index In in which position the average value Stav of strain exists within the strain range X. It is able to grasp whether the elasticity of the region is hard or soft.
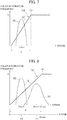
- reference numeral D1 indicates the distribution of strain in the region R.
- the strain distribution D1 is a distribution of strain in the region R at a given frame.
- a slope part S1' is set to a predetermined strain range X' on the basis of an average value Stav1 of strain in the strain distribution D1.
- the strain distribution D1 of FIG. 6 is taken as the normal liver, for example, the average value Stav1 is represented in green in an elastic image EI.
- a strain distribution D2 shown in FIG. 7 is a strain distribution about a liver hardened over its entirety
- a slope part S1' is set to a predetermined strain range X' on the basis of an average value Stav2 of strain in the strain distribution D2.
- the strain range to which the slope part S1 of the color conversion table TA is set is fixed to a predetermined strain range X.
- the elastic index In indicative of the average value being located in any position is calculated in the range X. Therefore, the elastic index In becomes different values between the liver hardened over its entirety like cirrhosis and the normal liver.
- an elastic index In1 of an average value Stav1 of strain in the strain distribution D1 (the same strain distribution as in FIG. 6 )
- an elastic index In2 of an average value Stav2 of strain in the strain distribution D2 become different values (In1>In2).
- the elasticity index In is calculated for each frame of the elastic image EI.
- the elasticity index image generating unit 65 generates an elasticity index graph G indicative of time changes in the elasticity index In.
- the elasticity index graph G is displayed on the displayer 7 by the image display control unit 66.
- the elasticity index image InI including the elasticity index graph G will be explained.
- the elasticity index image InI has a left line L1 (line), a right line R1, a zero point mark M, and an indication line F1 in addition to the elasticity index graph G.
- the elasticity index graph G is represented between the left line L1 and the right line R1. Between the left line L1 and the right line R1, the vertical direction indicates the size of an elasticity index In, and the horizontal direction indicates time.
- the zero point mark M means that the elasticity index In is 0%.
- the upper ends of the left line L1 and the right line R1 means that the elasticity index is 100%.
- a point of intersection of the indication line F1 and the elasticity index graph G indicates an elasticity index In of an elastic image EI displayed on the displayer 7 at present.
- the indication line F1 moves in the right direction with the elapse of time. With the movement of the indication line F1, the elasticity index graph G is updated.
- the elasticity index graph G since the elasticity index graph G is displayed, the elasticity of a biological tissue can be shown in a quantified form. It is able to recognize by the elasticity index graph G, time changes in the strain of the biological tissue, repeated according to the heart rate or the pulsation of blood vessels, for example. It is thus possible to perform the evaluation of a disease in detail.
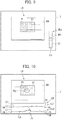
- an elasticity index bar Ba is displayed as the elasticity index image InI as shown in FIG. 9 .
- the elasticity index bar Ba is displayed at a part of which the background is black, and has a colored part Cl and a white part Wh.
- the length of the colored part Cl indicates the value of the elasticity index In. If the elasticity index In is 50%, for example, the colored part Cl becomes half of the overall length of the elasticity index bar Ba, and the white part Wh also becomes half of the overall length of the elasticity index bar Ba.
- the color thereof may be changed depending on the value of the elasticity index In.
- the colored part Cl may be blue.
- the colored part Cl may be green.
- the colored part Cl may be red.
- the elasticity of a biological tissue can be shown in a quantified form even by the display of the elasticity index bar Ba.
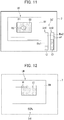
- a first region R1 is set to a B-mode image BI displayed on the displayer 7. Further, a second region R2 is set to within the first region R1.
- the image EI is displayed in the first region R1 including the second region R2.
- the second region R2 is set to a region that an operator takes interest in particularly within the first region R1.
- the elasticity index image generating unit 65 generates a first elasticity index graph G1 indicative of time changes in the first elasticity index In1. Also the elasticity index image generating unit 65 generates a second elasticity index graph G2 indicative of time changes in the second elasticity index In2.
- the image display control unit 66 causes the displayer 7 to display a first elasticity index image InI1 and a second elasticity index image InI2 as the elasticity index image InI as shown in FIG. 10 .
- the first elasticity index image InI1 includes the first elasticity index graph G1 indicative of the time changes in the first elasticity index In1.
- the second elasticity index image InI2 includes the second elasticity index graph G2 indicative of the time changes in the second elasticity index In2.
- the first elasticity index image InI1 and the second elasticity index image InI2 are identical in configuration to the elasticity index image InI of the first embodimemt, and their detailed description is therefore omitted.
- the first elasticity index graph G1 and the second elasticity index graph G2 are displayed with respect to the first region R1 and the second region R2, the elasticity of the biological tissue in the two regions can be displayed in the quantified form. Time changes in the strain of the biological tissue in the two regions can be recognized by the first elasticity index graph G1 and the second elasticity index graph G2. It is thus possible to perform the evaluation of a disease in detail.
- a first elasticity index bar Ba1 may be displayed as the first elasticity index image InI1
- a second elasticity index bar Ba2 may be displayed as the second elasticity index image InI2.
- the first elasticity index bar Ba1 is an image indicative of the value of the first elasticity index In1.
- the second elasticity index bar Ba2 is an image indicative of the value of the second elasticity index In2.
- the first elasticity index bar Ba1 and the second elasticity index bar Ba2 are identical in configuration to the elasticity index bar Ba in the modification of the first embodiment, and their detailed description is therefore omitted.
- the present invention has been described above by the respective embodiments, it is needless to say that the present invention can be changed in various ways within the scope that does not change the gist of the invention.
- the elasticity index In is taken as 100% where the average value Stav of strain becomes larger than the maximum value Stmax in the above embodiment
- the value obtained in each of the above equations (1), (2) and (3) may be defined as an elasticity index as it is. Accordingly, the value that exceeds 100% may be calculated as an elasticity index.
- the elasticity index image InI may be a numeric value indicative of the value of an elasticity index In as shown in FIG. 12 .
- the elasticity index image InI2 may be displayed only with respect to the region R2.
- the composite ultrasound image UI is not limited to the real-time image, but may be an image based on the data stored in the storage unit 10.
Landscapes
- Health & Medical Sciences (AREA)
- Life Sciences & Earth Sciences (AREA)
- Engineering & Computer Science (AREA)
- Medical Informatics (AREA)
- Surgery (AREA)
- Pathology (AREA)
- Radiology & Medical Imaging (AREA)
- Biophysics (AREA)
- Biomedical Technology (AREA)
- Heart & Thoracic Surgery (AREA)
- Physics & Mathematics (AREA)
- Molecular Biology (AREA)
- Nuclear Medicine, Radiotherapy & Molecular Imaging (AREA)
- Animal Behavior & Ethology (AREA)
- General Health & Medical Sciences (AREA)
- Public Health (AREA)
- Veterinary Medicine (AREA)
- Computer Vision & Pattern Recognition (AREA)
- Vascular Medicine (AREA)
- Physiology (AREA)
- Ultra Sonic Daignosis Equipment (AREA)
Applications Claiming Priority (3)
| Application Number | Priority Date | Filing Date | Title |
|---|---|---|---|
| JP2012182133A JP5879230B2 (ja) | 2012-08-21 | 2012-08-21 | 超音波診断装置及びその制御プログラム |
| EP13753744.5A EP2887880A1 (de) | 2012-08-21 | 2013-08-15 | Diagnostisches ultraschallgerät und steuerungsprogramm dafür |
| PCT/US2013/055052 WO2014031424A1 (en) | 2012-08-21 | 2013-08-15 | Ultrasonic diagnostic apparatus and control program thereof |
Related Parent Applications (1)
| Application Number | Title | Priority Date | Filing Date |
|---|---|---|---|
| EP13753744.5A Division EP2887880A1 (de) | 2012-08-21 | 2013-08-15 | Diagnostisches ultraschallgerät und steuerungsprogramm dafür |
Publications (1)
| Publication Number | Publication Date |
|---|---|
| EP3563771A1 true EP3563771A1 (de) | 2019-11-06 |
Family
ID=49080977
Family Applications (2)
| Application Number | Title | Priority Date | Filing Date |
|---|---|---|---|
| EP13753744.5A Ceased EP2887880A1 (de) | 2012-08-21 | 2013-08-15 | Diagnostisches ultraschallgerät und steuerungsprogramm dafür |
| EP19168544.5A Withdrawn EP3563771A1 (de) | 2012-08-21 | 2013-08-15 | Diagnostische ultraschallvorrichtung und steuerungsprogramm dafür |
Family Applications Before (1)
| Application Number | Title | Priority Date | Filing Date |
|---|---|---|---|
| EP13753744.5A Ceased EP2887880A1 (de) | 2012-08-21 | 2013-08-15 | Diagnostisches ultraschallgerät und steuerungsprogramm dafür |
Country Status (6)
| Country | Link |
|---|---|
| US (2) | US20150173719A1 (de) |
| EP (2) | EP2887880A1 (de) |
| JP (1) | JP5879230B2 (de) |
| KR (1) | KR20150045435A (de) |
| CN (1) | CN104768471B (de) |
| WO (1) | WO2014031424A1 (de) |
Families Citing this family (3)
| Publication number | Priority date | Publication date | Assignee | Title |
|---|---|---|---|---|
| US11138723B2 (en) * | 2016-07-22 | 2021-10-05 | Canon Medical Systems Corporation | Analyzing apparatus and analyzing method |
| KR102871021B1 (ko) * | 2020-03-12 | 2025-10-16 | 삼성메디슨 주식회사 | 초음파 진단 장치 및 그 동작방법 |
| CN117197024A (zh) * | 2022-05-31 | 2023-12-08 | 通用电气精准医疗有限责任公司 | 医学成像方法、装置以及系统 |
Citations (5)
| Publication number | Priority date | Publication date | Assignee | Title |
|---|---|---|---|---|
| EP1800603A1 (de) * | 2004-08-05 | 2007-06-27 | Hitachi Medical Corporation | Verfahren zur anzeige eines elastischen bilds und ultraschallgerät |
| JP2007282932A (ja) | 2006-04-19 | 2007-11-01 | Hitachi Medical Corp | 弾性画像生成方法及び超音波診断装置 |
| EP1880679A1 (de) * | 2005-05-09 | 2008-01-23 | Hitachi Medical Corporation | Ultraschallgerät und verfahren zur anzeige eines ultraschallbilds |
| JP2008126079A (ja) | 2006-11-22 | 2008-06-05 | General Electric Co <Ge> | 組織の弾力特性を計測するための直接式歪み推定器 |
| US20110054314A1 (en) * | 2009-08-26 | 2011-03-03 | Shunichiro Tanigawa | Ultrasonic diagnostic apparatus |
Family Cites Families (8)
| Publication number | Priority date | Publication date | Assignee | Title |
|---|---|---|---|---|
| US6749571B2 (en) * | 2002-09-19 | 2004-06-15 | Wisconsin Alumni Research Foundation | Method and apparatus for cardiac elastography |
| JP4314035B2 (ja) * | 2003-01-15 | 2009-08-12 | 株式会社日立メディコ | 超音波診断装置 |
| WO2005048847A1 (ja) * | 2003-11-21 | 2005-06-02 | Hitachi Medical Corporation | 超音波診断装置 |
| CN100518662C (zh) * | 2004-06-09 | 2009-07-29 | 株式会社日立医药 | 超声波诊断装置 |
| JP2007105400A (ja) * | 2005-10-17 | 2007-04-26 | Toshiba Corp | 超音波診断装置及び画像処理装置 |
| JP5535575B2 (ja) * | 2009-10-27 | 2014-07-02 | ジーイー・メディカル・システムズ・グローバル・テクノロジー・カンパニー・エルエルシー | 超音波診断装置 |
| JP5260602B2 (ja) * | 2010-06-11 | 2013-08-14 | ジーイー・メディカル・システムズ・グローバル・テクノロジー・カンパニー・エルエルシー | 超音波診断装置 |
| JP5373749B2 (ja) * | 2010-11-30 | 2013-12-18 | ジーイー・メディカル・システムズ・グローバル・テクノロジー・カンパニー・エルエルシー | 医用画像表示装置及びその制御プログラム |
-
2012
- 2012-08-21 JP JP2012182133A patent/JP5879230B2/ja active Active
-
2013
- 2013-08-15 KR KR20157003833A patent/KR20150045435A/ko not_active Ceased
- 2013-08-15 EP EP13753744.5A patent/EP2887880A1/de not_active Ceased
- 2013-08-15 CN CN201380044253.2A patent/CN104768471B/zh active Active
- 2013-08-15 WO PCT/US2013/055052 patent/WO2014031424A1/en not_active Ceased
- 2013-08-15 US US14/422,752 patent/US20150173719A1/en not_active Abandoned
- 2013-08-15 EP EP19168544.5A patent/EP3563771A1/de not_active Withdrawn
-
2019
- 2019-01-08 US US16/242,783 patent/US11064976B2/en active Active
Patent Citations (5)
| Publication number | Priority date | Publication date | Assignee | Title |
|---|---|---|---|---|
| EP1800603A1 (de) * | 2004-08-05 | 2007-06-27 | Hitachi Medical Corporation | Verfahren zur anzeige eines elastischen bilds und ultraschallgerät |
| EP1880679A1 (de) * | 2005-05-09 | 2008-01-23 | Hitachi Medical Corporation | Ultraschallgerät und verfahren zur anzeige eines ultraschallbilds |
| JP2007282932A (ja) | 2006-04-19 | 2007-11-01 | Hitachi Medical Corp | 弾性画像生成方法及び超音波診断装置 |
| JP2008126079A (ja) | 2006-11-22 | 2008-06-05 | General Electric Co <Ge> | 組織の弾力特性を計測するための直接式歪み推定器 |
| US20110054314A1 (en) * | 2009-08-26 | 2011-03-03 | Shunichiro Tanigawa | Ultrasonic diagnostic apparatus |
Also Published As
| Publication number | Publication date |
|---|---|
| JP2014039578A (ja) | 2014-03-06 |
| CN104768471A (zh) | 2015-07-08 |
| US20150173719A1 (en) | 2015-06-25 |
| WO2014031424A1 (en) | 2014-02-27 |
| KR20150045435A (ko) | 2015-04-28 |
| US20190142384A1 (en) | 2019-05-16 |
| JP5879230B2 (ja) | 2016-03-08 |
| EP2887880A1 (de) | 2015-07-01 |
| US11064976B2 (en) | 2021-07-20 |
| CN104768471B (zh) | 2017-12-26 |
Similar Documents
| Publication | Publication Date | Title |
|---|---|---|
| US8684931B2 (en) | Ultrasonic diagnostic apparatus for elasticity imaging | |
| US20110306884A1 (en) | Ultrasonic diagnostic apparatus | |
| US8948485B2 (en) | Ultrasonic diagnostic apparatus, ultrasonic image processing apparatus, ultrasonic image processing program, and ultrasonic image generation method | |
| EP1800603B1 (de) | Verfahren und vorrichtung zur anzeige eines elastischen bilds und ultraschallgerät | |
| US10143442B2 (en) | Ultrasonic diagnosis apparatus | |
| JP6290336B2 (ja) | 超音波診断装置 | |
| US20130158900A1 (en) | Ultrasonic diagnostic apparatus and evaluation calculation method | |
| US11064976B2 (en) | Ultrasonic diagnostic apparatus and control program thereof | |
| JP6358954B2 (ja) | 超音波診断装置 | |
| US20140051998A1 (en) | Ultrasound diagnostic apparatus and method for displaying an elastic image | |
| US20140155746A1 (en) | Ultrasound diagnostic apparatus and method for displaying elasticity image | |
| JP2009261520A (ja) | 超音波撮像装置 | |
| JP5229889B2 (ja) | 超音波診断装置 | |
| JP4899835B2 (ja) | 超音波映像システム | |
| JP5922521B2 (ja) | 超音波診断装置及びその制御プログラム | |
| JP2011218086A (ja) | 超音波診断装置 | |
| KR20080086678A (ko) | 초음파 영상을 형성하는 초음파 시스템 및 방법 | |
| JP6246098B2 (ja) | 超音波診断装置及びその制御プログラム | |
| KR101100528B1 (ko) | 계조 보정 처리를 수행하는 초음파 시스템 및 방법 |
Legal Events
| Date | Code | Title | Description |
|---|---|---|---|
| PUAI | Public reference made under article 153(3) epc to a published international application that has entered the european phase |
Free format text: ORIGINAL CODE: 0009012 |
|
| AC | Divisional application: reference to earlier application |
Ref document number: 2887880 Country of ref document: EP Kind code of ref document: P |
|
| AK | Designated contracting states |
Kind code of ref document: A1 Designated state(s): AL AT BE BG CH CY CZ DE DK EE ES FI FR GB GR HR HU IE IS IT LI LT LU LV MC MK MT NL NO PL PT RO RS SE SI SK SM TR |
|
| 17P | Request for examination filed |
Effective date: 20200422 |
|
| RBV | Designated contracting states (corrected) |
Designated state(s): AL AT BE BG CH CY CZ DE DK EE ES FI FR GB GR HR HU IE IS IT LI LT LU LV MC MK MT NL NO PL PT RO RS SE SI SK SM TR |
|
| STAA | Information on the status of an ep patent application or granted ep patent |
Free format text: STATUS: THE APPLICATION HAS BEEN WITHDRAWN |
|
| 18W | Application withdrawn |
Effective date: 20201014 |