EP3286359B1 - Verfahren und systeme zur mehrfachen taxonomischen klassifizierung - Google Patents
Verfahren und systeme zur mehrfachen taxonomischen klassifizierung Download PDFInfo
- Publication number
- EP3286359B1 EP3286359B1 EP16784041.2A EP16784041A EP3286359B1 EP 3286359 B1 EP3286359 B1 EP 3286359B1 EP 16784041 A EP16784041 A EP 16784041A EP 3286359 B1 EP3286359 B1 EP 3286359B1
- Authority
- EP
- European Patent Office
- Prior art keywords
- sequences
- sequence
- virus
- mer
- sample
- Prior art date
- Legal status (The legal status is an assumption and is not a legal conclusion. Google has not performed a legal analysis and makes no representation as to the accuracy of the status listed.)
- Active
Links
Images


Classifications
-
- C—CHEMISTRY; METALLURGY
- C40—COMBINATORIAL TECHNOLOGY
- C40B—COMBINATORIAL CHEMISTRY; LIBRARIES, e.g. CHEMICAL LIBRARIES
- C40B20/00—Methods specially adapted for identifying library members
-
- G—PHYSICS
- G16—INFORMATION AND COMMUNICATION TECHNOLOGY [ICT] SPECIALLY ADAPTED FOR SPECIFIC APPLICATION FIELDS
- G16B—BIOINFORMATICS, i.e. INFORMATION AND COMMUNICATION TECHNOLOGY [ICT] SPECIALLY ADAPTED FOR GENETIC OR PROTEIN-RELATED DATA PROCESSING IN COMPUTATIONAL MOLECULAR BIOLOGY
- G16B30/00—ICT specially adapted for sequence analysis involving nucleotides or amino acids
- G16B30/10—Sequence alignment; Homology search
-
- G—PHYSICS
- G16—INFORMATION AND COMMUNICATION TECHNOLOGY [ICT] SPECIALLY ADAPTED FOR SPECIFIC APPLICATION FIELDS
- G16B—BIOINFORMATICS, i.e. INFORMATION AND COMMUNICATION TECHNOLOGY [ICT] SPECIALLY ADAPTED FOR GENETIC OR PROTEIN-RELATED DATA PROCESSING IN COMPUTATIONAL MOLECULAR BIOLOGY
- G16B40/00—ICT specially adapted for biostatistics; ICT specially adapted for bioinformatics-related machine learning or data mining, e.g. knowledge discovery or pattern finding
- G16B40/20—Supervised data analysis
-
- Y—GENERAL TAGGING OF NEW TECHNOLOGICAL DEVELOPMENTS; GENERAL TAGGING OF CROSS-SECTIONAL TECHNOLOGIES SPANNING OVER SEVERAL SECTIONS OF THE IPC; TECHNICAL SUBJECTS COVERED BY FORMER USPC CROSS-REFERENCE ART COLLECTIONS [XRACs] AND DIGESTS
- Y02—TECHNOLOGIES OR APPLICATIONS FOR MITIGATION OR ADAPTATION AGAINST CLIMATE CHANGE
- Y02A—TECHNOLOGIES FOR ADAPTATION TO CLIMATE CHANGE
- Y02A90/00—Technologies having an indirect contribution to adaptation to climate change
- Y02A90/10—Information and communication technologies [ICT] supporting adaptation to climate change, e.g. for weather forecasting or climate simulation
Definitions
- Metagenomics the genomic analysis of a population of microorganisms, makes possible the profiling of microbial communities in the environment and the human body at unprecedented depth and breadth. Its rapidly expanding use is revolutionizing our understanding of microbial diversity in natural and man-made environments and is linking microbial community profiles with health and disease. To date, most studies have relied on PCR amplification of microbial marker genes (e.g. bacterial 16S rRNA), for which large, curated databases have been established. More recently, higher throughput and lower cost sequencing technologies have enabled a shift towards enrichment-independent metagenomics. These approaches reduce bias, improve detection of less abundant taxa, and enable discovery of novel pathogens
- microbial marker genes e.g. bacterial 16S rRNA
- the invention provides a method of identifying one or more taxa in a sample from a sample source, as defined by the claims.
- the present disclosure provides a method of identifying one or more taxa in a sample from a sample source, the method comprising: (a) providing sequencing reads for a plurality of polynucleotides from the sample, and for each sequencing read: (i) performing with a computer system a sequence comparison between the sequencing read and a plurality of reference polynucleotide sequences, wherein the comparison comprises calculating k-mer weights as a measure of how likely it is that k-mers within the sequencing read are derived from a reference sequence within the plurality of reference polynucleotide sequences; and (ii) calculating a probability that the sequencing read corresponds to a particular reference sequence in a database of reference sequences based on the k-mer weights, thereby generating a sequence probability; (b) calculating a score for the presence or absence of one or more taxa based on the sequence probabilities corresponding to sequences representative of said one or more taxa; and (c) identifying the one or more taxa as present or
- the one or more taxa comprise a first bacterial strain identified as present and a second bacterial strain identified as absent based on one or more nucleotide differences in sequence.
- the first bacterial strain is identified as present and the second bacterial strain is identified as absent based on a single nucleotide difference in sequence.
- the method further comprises identifying a condition of the sample source by comparison of the results of step (c) to a biosignature.
- each reference sequence in the database of reference sequences is associated with, prior to the comparison, a reference k-mer weight as a measure of how likely it is that a k-mer within the reference sequence originates from the reference sequence.
- the database of reference sequences comprise sequences from a plurality of taxa, and each reference sequence in the database of reference sequences is associated with a reference k-mer weight as a measure of how likely it is that a k-mer within the reference sequence originates from a taxon within the plurality of taxa.
- One or more of the steps may be performed for all sequencing reads in parallel, such as the step of performing the sequence comparison.
- the method may further comprise quantifying an amount of polynucleotides corresponding to the reference sequences identified in step (b) based on a number of corresponding sequencing readings.
- the method further comprises determining presence, absence, or abundance of a plurality of taxa in the sample based on results of step (b), wherein the plurality of reference polynucleotide sequences comprise groups of sequences corresponding to individual taxa in the plurality of taxa.
- a sequencing read identified as belonging to a particular taxon in the plurality of taxa and not present among the group of sequences corresponding to that taxon can be added to the group of sequences corresponding to that taxon for use in later sequence comparisons.
- determining the presence, absence, or abundance of a taxon in the plurality of taxa comprises resolving a tie between two possible taxa to which a sequencing read corresponds, wherein resolving the tie comprises determining a sum of k-mer weights for the reference sequence along each branch of a phylogenetic tree.
- a particular individual is identified as the sample source.
- the database of reference sequences can comprise any of a variety of reference sequences.
- the reference sequences are from one or more of bacteria, archaea, chromalveolata, viruses, fungi, plants, fish, amphibians, reptiles, birds, mammals, and humans.
- the database of reference sequences consists of sequences from a reference individual or a reference sample source.
- the method may further comprise identifying the polynucleotides from the sample source as being derived from the reference individual or the reference sample source.
- the database of reference sequences comprises k-mers having one or more mutations with respect to known polynucleotide sequences, such that a plurality of variants of the known polynucleotide sequences are represented in the database of reference sequences.
- the database of reference sequences can comprise marker gene sequences for taxonomic classification of bacterial sequences, such as 16S rRNA sequences.
- the database of reference sequences comprises sequences of human transcripts.
- the database of reference sequences consists of sequences associated with a condition.
- One or more such sequences may form a biosignature for the condition, a plurality of which may together form the reference database.
- the record database is associated with a condition of the sample source to establish a biosignature for the condition.
- the method further comprises identifying a condition of the sample source by comparison of the record database to a biosignature, including identifying the the sample source as having the condition.
- the condition may be food contamination.
- the condition is infection.
- Biosignatures e.g. of infection
- the infection is influenza and the biosignature consists of sequences of one or more of IFIT1, IFI6, IFIT2, ISG15, OASL, IFIT3, NT5C3A, MX2, IFITM1, CXCL10, IFI44L, MX1, IFIH1, OAS2, SAMD9, RSAD2, DDX58.
- the sample source is a subject.
- the method may further comprise monitoring treatment in an infected subject by identifying the presence or absence of the biosignature in samples from the infected subject at multiple times after beginning treatment. Treatment of the infected subject can be adjusted based on results of the monitoring.
- methods of the present disclosure comprise selecting, and optionally taking, medical action based on the results of sequence and/or taxa identification.
- medical action can comprise administering a pharmaceutical composition, such as an antibiotic.
- the antibiotic is selected based on efficacy against taxa identified in the sample.
- the database of reference sequences comprises polynucleotide sequences reverse-translated from amino acid sequences.
- Reverse-translating can use a non-degenerate code comprising a single codon for each amino acid.
- a sequencing read can be translated to an amino acid sequence and then reverse-translated using the non-degenerate code prior to comparison with the reverse-translated reference sequences.
- the k-mer weight relates a count of a particular k-mer within a particular reference sequence, a count of the particular k-mer among a group of sequences comprising the reference sequence, and a count of the particular k-mer among all reference sequences in the database of reference sequences.
- step (b) is completed for 20,000 sequencing reads in less than 1.5 seconds.
- the 20,000 sequencing reads can comprise sequences from two or more of bacteria, viruses, fungi, and humans.
- steps (a)-(c) are performed by a computer system in response to a user request.
- the user uploads the sequencing reads to the computer system, and the method is performed concurrently with the upload.
- the user uploads a plurality of sequencing reads to the computer system, and results of the sequence analysis are reported to the user for one or more of the plurality of sequencing reads while other sequencing reads of the plurality of sequencing reads are uploading.
- a sequencing file containing a plurality of sequencing reads may be broken into smaller components (e.g. subsets of one or more sequencing reads), and components uploaded first may be analyzed and reported while the remainder of the file continues to upload.
- the computer system may be remote with respect to the user.
- the method can further comprise sequencing the plurality of polynucleotides from the sample to generate the sequencing reads.
- the present disclosure provides a method of detecting a plurality of taxa in a sample.
- the method comprising providing sequencing reads for a plurality of polynucleotides from the sample, and for each sequencing read: (a) assigning the sequencing read to a first taxonomic group based on a first sequence comparison between the sequencing read and a first plurality of polynucleotide sequences from the different first taxonomic groups, wherein at least two sequencing reads are assigned to different taxonomic groups; (b) performing with a computer system a second sequence comparison between the sequencing read and a second plurality of polynucleotide sequences corresponding to members of the first taxonomic group, wherein the comparison comprises counting a number of k-mers within the sequencing read of at least 5 nucleotides in length that exactly match one or more k-mers within a reference sequence in the second plurality of polynucleotide sequences; (c) classifying the sequencing read as belonging to a second
- Step (b) may further comprise calculating k-mer weights as measures of how likely it is that k-mers within the sequencing read are derived from a reference sequence in the second plurality of polynucleotide sequences.
- the third set of reference sequences consist of polynucleotide sequences derived from reverse-translating the corresponding amino acid sequences.
- the method can further comprise performing with the computer system a relaxed sequence comparison between the sequencing read and the second plurality of polynucleotide sequences if the similarity in (d) is below the second threshold, wherein the relaxed sequence comparison is less stringent than the second sequence comparison.
- classifying the sequencing read in step (c) comprises resolving a tie between two or more possible taxonomic groups based on a k-mer weight as a measure of how likely it is that the sequencing read corresponds to a polynucleotide from an ancestor of one of the possible taxonomic groups.
- step (a) comprises assigning sequencing reads to two or more taxa selected from bacteria, viruses, fungi, or humans.
- a sequencing read classified as belonging to the second taxonomic group and not present among the group of sequences corresponding to the second taxonomic group is added to the group of sequences corresponding to the second taxonomic group for use in later sequence comparisons.
- the second plurality of nucleotide sequences may comprise marker gene sequences for taxonomic classification of bacterial sequences, such as 16S rRNA sequences.
- the second plurality of nucleotide sequences may comprise sequences of human transcripts.
- the method further comprises diagnosing a condition based on a degree of similarity between the plurality of taxa detected in the sample and a biological signature for the condition.
- the condition can be contamination of the sample, or infection of a subject.
- the infection can be assessed based on the presence or amount of (i) sequences of host transcripts; and/or (ii) sequences of one or more infectious agents.
- the method can further comprise monitoring treatment in an infected subject by detecting presence, absence, or abundance of a plurality of taxa in samples from the infected subject at multiple times after beginning treatment, and optionally changing treatment of the infected subject based on results of the monitoring.
- the method may further comprise classifying the sequencing read as corresponding to a gene transcript if the measure of similarity between the sequencing read and reference sequence is above the first threshold level. Where a sequencing read is classified as corresponding to a gene transcript, the method may further comprise diagnosing a condition based on a degree of similarity between the plurality of taxa detected in the sample and a biological signature for the condition.
- the system is configured for identifying a plurality of polynucleotides in a sample from a sample source based on sequencing reads for the plurality of polynucleotides.
- the system may comprise one or more computer processors programmed to, for each sequencing read: (a) perform a sequence comparison between the sequencing read and a plurality of reference polynucleotide sequences, wherein the comparison comprises calculating k-mer weights as measures of how likely it is that k-mers within the sequencing read are derived from a reference sequence within the plurality of reference polynucleotide sequences; (b) identify the sequencing read as corresponding to a particular reference sequence in a database of reference sequences if the sum of k-mer weights for the reference sequence is above a threshold level; and (c) assemble a record database comprising reference sequences identified in step (b), wherein the record database excludes reference sequences to which no sequencing read corresponds.
- the system may further comprise a reaction module in communication with the computer processor, wherein the reaction module performs polynucleotide sequencing reactions to produce the sequencing reads.
- the system is configured for identifying one or more taxa in a sample from a sample source based on sequencing reads for a plurality of polynucleotides.
- the system may comprise one or more computer processors programmed to: (a) for each sequencing read, perform a sequence comparison between the sequencing read and a plurality of reference polynucleotide sequences, wherein the comparison comprises calculating k-mer weights as measures of how likely it is that k-mers within the sequencing read are derived from a reference sequence within the plurality of reference polynucleotide sequences; (b) for each sequencing read, calculate a probability that the sequencing read corresponds to a particular reference sequence in a database of reference sequences based on the k-mer weights, thereby generating a sequence probability; (c) calculate a score for the presence or absence of one or more taxa based on the sequence probabilities corresponding to sequences representative of said one or more taxa; and (d) identify the one or more taxa as present or absent
- a computer-readable medium comprising code that, upon execution by one or more processors, implements a method according to any of the methods disclosed herein.
- execution of the computer readable medium implements a method of identifying a plurality of polynucleotides in a sample from a sample source based on sequencing reads for the plurality of polynucleotides.
- the execution of the computer readable medium implements a method comprising: (a) for each of the sequencing reads, performing a sequence comparison between the sequencing read and a plurality of reference polynucleotide sequences, wherein the comparison comprises calculating k-mer weights as measures of how likely it is that k-mers within the sequencing read are derived from a reference sequence within the plurality of reference polynucleotide sequences; (b) for each of the sequencing reads, identifying the sequencing read as corresponding to a particular reference sequence in a database of reference sequences if the sum of k-mer weights for the reference sequence is above a threshold level; and (c) assembling a record database comprising reference sequences identified in step (b), wherein the record database excludes reference sequences to which no sequencing read corresponds.
- the execution of the computer readable medium implements a method of identifying one or more taxa in a sample from a sample source based on sequencing reads for a plurality of polynucleotides, the method comprising: (a) for each of the sequencing reads, performing a sequence comparison between the sequencing read and a plurality of reference polynucleotide sequences, wherein the comparison comprises calculating k-mer weights as a measure of how likely it is that k-mers within the sequencing read are derived from a reference sequence within the plurality of reference polynucleotide sequences; (b) for each of the sequencing reads, calculating a probability that the sequencing read corresponds to a particular reference sequence in a database of reference sequences based on the k-mer weights, thereby generating a sequence probability; (c) calculating a score for the presence or absence of one or more taxa based on the sequence probabilities corresponding to sequences representative of said one or more taxa; and (d) identifying the one
- a range should be considered to have specifically disclosed all the possible subranges as well as individual numerical values within that range.
- description of a range such as from 1 to 6 should be considered to have specifically disclosed subranges such as from 1 to 3, from 1 to 4, from 1 to 5, from 2 to 4, from 2 to 6, from 3 to 6 etc., as well as individual numbers within that range, for example, 1, 2, 3, 4, 5, and 6. This applies regardless of the breadth of the range.
- the systems and methods of this disclosure as described herein may employ, unless otherwise indicated, conventional techniques and descriptions of molecular biology (including recombinant techniques), cell biology, biochemistry, microarray and sequencing technology, which are within the skill of those who practice in the art.
- Such conventional techniques include polymer array synthesis, hybridization and ligation of oligonucleotides, sequencing of oligonucleotides, and detection of hybridization using a label.
- Specific illustrations of suitable techniques can be had by reference to the examples herein. However, equivalent conventional procedures can, of course, also be used.
- Such conventional techniques and descriptions can be found in standard laboratory manuals such as Green, et al., Eds., Genome Analysis: A Laboratory Manual Series (Vols.
- the term “about” or “approximately” means within an acceptable error range for the particular value as determined by one of ordinary skill in the art, which will depend in part on how the value is measured or determined, i.e., the limitations of the measurement system. For example, “about” can mean within 1 or more than 1 standard deviation, per the practice in the art. Alternatively, “about” can mean a range of up to 20%, up to 10%, up to 5%, or up to 1% of a given value. Alternatively, particularly with respect to biological systems or processes, the term can mean within an order of magnitude, preferably within 5-fold, and more preferably within 2-fold, of a value. Where particular values are described in the application and claims, unless otherwise stated the term "about” meaning within an acceptable error range for the particular value should be assumed.
- polynucleotide refers to a polymeric form of nucleotides of any length, either deoxyribonucleotides or ribonucleotides, or analogs thereof.
- Polynucleotides may have any three dimensional structure, and may perform any function, known or unknown.
- polynucleotides coding or non-coding regions of a gene or gene fragment, loci (locus) defined from linkage analysis, exons, introns, messenger RNA (mRNA), transfer RNA (tRNA), ribosomal RNA (rRNA), short interfering RNA (siRNA), short-hairpin RNA (shRNA), micro-RNA (miRNA), ribozymes, cDNA, recombinant polynucleotides, branched polynucleotides, plasmids, vectors, isolated DNA of any sequence, isolated RNA of any sequence, nucleic acid probes, and primers.
- loci defined from linkage analysis, exons, introns, messenger RNA (mRNA), transfer RNA (tRNA), ribosomal RNA (rRNA), short interfering RNA (siRNA), short-hairpin RNA (shRNA), micro-RNA (miRNA), ribozymes, cDNA, recombinant polyn
- a polynucleotide may comprise one or more modified nucleotides, such as methylated nucleotides and nucleotide analogs. If present, modifications to the nucleotide structure may be imparted before or after assembly of the polymer. The sequence of nucleotides may be interrupted by non-nucleotide components. A polynucleotide may be further modified after polymerization, such as by conjugation with a labeling component.
- “Complementarity” refers to the ability of a nucleic acid to form hydrogen bond(s) with another nucleic acid sequence by either traditional Watson-Crick or other non-traditional types.
- a percent complementarity indicates the percentage of residues in a nucleic acid molecule which can form hydrogen bonds (e.g., Watson-Crick base pairing) with a second nucleic acid sequence (e.g., 5, 6, 7, 8, 9, 10 out of 10 being 50%, 60%, 70%, 80%, 90%, and 100% complementary, respectively).
- Perfectly complementary means that all the contiguous residues of a nucleic acid sequence will hydrogen bond with the same number of contiguous residues in a second nucleic acid sequence.
- Substantially complementary refers to a degree of complementarity that is at least 60%, 65%, 70%, 75%, 80%, 85%, 90%, 95%, 97%, 98%, 99%, or 100% over a region of 8, 9, 10, 11, 12, 13, 14, 15, 16, 17, 18, 19, 20, 21, 22, 23, 24, 25, 30, 35, 40, 45, 50, or more nucleotides, or refers to two nucleic acids that hybridize under stringent conditions. Sequence identity, such as for the purpose of assessing percent complementarity, may be measured by any suitable alignment algorithm, including but not limited to the Needleman-Wunsch algorithm (see e.g.
- the EMBOSS Needle aligner available at www.ebi.ac.uk/Tools/psa/emboss_needle/nucleotide.html, optionally with default settings
- the BLAST algorithm see e.g. the BLAST alignment tool available at blast.ncbi.nlm.nih.gov/Blast.cgi, optionally with default settings
- the Smith-Waterman algorithm see e.g. the EMBOSS Water aligner available at www.ebi.ac.uk/Tools/psa/emboss_water/nucleotide.html, optionally with default settings.
- Optimal alignment may be assessed using any suitable parameters of a chosen algorithm, including default parameters.
- expression refers to the process by which a polynucleotide is transcribed from a DNA template (such as into and mRNA or other RNA transcript) and/or the process by which a transcribed mRNA is subsequently translated into peptides, polypeptides, or proteins.
- Transcripts and encoded polypeptides may be collectively referred to as "gene product.” If the polynucleotide is derived from genomic DNA, expression may include splicing of the mRNA in a eukaryotic cell.
- polypeptide refers to polymers of amino acids of any length.
- the polymer may be linear or branched, it may comprise modified amino acids, and it may be interrupted by non amino acids.
- the terms also encompass an amino acid polymer that has been modified; for example, disulfide bond formation, glycosylation, lipidation, acetylation, phosphorylation, or any other manipulation, such as conjugation with a labeling component.
- amino acid includes natural and/or unnatural or synthetic amino acids, including glycine and both the D or L optical isomers, and amino acid analogs and peptidomimetics.
- control is an alternative subject or sample used in an experiment for comparison purpose.
- subject means a vertebrate, preferably a mammal, more preferably a human.
- Mammals include, but are not limited to, murines, simians, humans, farm animals, sport animals, and pets. Tissues, cells, and their progeny of a biological entity obtained in vivo or cultured in vitro are also encompassed.
- determining can be used interchangeably herein to refer to any form of measurement, and include determining if an element is present or not (for example, detection). These terms can include both quantitative and/or qualitative determinations. Assessing may be relative or absolute. "Detecting the presence of” can include determining the amount of something present, as well as determining whether it is present or absent.
- the term specificity, or true negative rate, can refer to a test's ability to exclude a condition correctly.
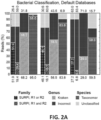
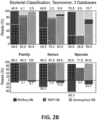
- the specificity of the algorithm may refer to the proportion of reads known not to be from an organism in a given taxonomic bin, which will not be placed in the taxonomic bin.
- this is calculated by determining the proportion of true negatives (reads not placed in the bin that are not from the taxonomic bin) to the total number of reads that are not derived from an organism within the taxonomic bin (the sum of the reads that are not placed in a given taxonomic bin and are not derived from an organism within that taxonomic bin and reads that are placed in that taxonomic bin that are not derived from an organism within that taxonomic bin).
- sensitivity can refer to a test's ability to identify a condition correctly.
- the sensitivity of a test may refer to the proportion of reads known to be from an organism in a given taxonomic bin, which will be placed in the taxonomic bin.
- this is calculated by determining the proportion of true positives (reads placed in the bin that are from the taxonomic bin) to the total number of reads that are derived from an organism within the taxonomic bin (the sum of the reads that are placed in a given taxonomic bin and are derived from an organism within that taxonomic bin and reads that are not placed in that taxonomic bin that are derived from an organism within that taxonomic bin).
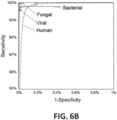
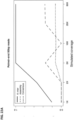
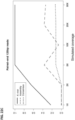
- the quantitative relationship between sensitivity and specificity can change as different classification cut-offs are chosen. This variation can be represented using ROC curves.
- the x-axis of a ROC curve shows the false-positive rate of an assay, which can be calculated as (1 - specificity).
- the y-axis of a ROC curve reports the sensitivity for an assay. This allows one to determine a sensitivity of an assay for a given specificity, and vice versa.
- Adaptor or “adapter” are used interchangeably and can refer to an oligonucleotide that may be attached to the end of a nucleic acid.
- Adaptor sequences may comprise, for example, priming sites, the complement of a priming site, recognition sites for endonucleases, common sequences and promoters.
- Adaptors may also incorporate modified nucleotides that modify the properties of the adaptor sequence. For example, phosphorothioate groups may be incorporated in one of the adaptor strands.
- taxon (plural “taxa”), “taxonomic group,” and “taxonomic unit” are used interchangeably to refer to a group of one or more organisms that comprises a node in a clustering tree.
- the level of a cluster is determined by its hierarchical order.
- a taxon is a group tentatively assumed to be a valid taxon for purposes of phylogenetic analysis.
- a taxon is any of the extant taxonomic units under study.
- a taxon is given a name and a rank.
- a taxon can represent a domain, a sub-domain, a kingdom, a sub-kingdom, a phylum, a sub-phylum, a class, a subclass, an order, a sub-order, a family, a subfamily, a genus, a subgenus, or a species.
- taxa can represent one or more organisms from the kingdoms eubacteria, protista, or fungi at any level of a hierarchal order.
- sequence identity refers to an exact nucleotide-to-nucleotide or amino acid-to-amino acid correspondence of two polynucleotides or polypeptide sequences, respectively.
- techniques for determining sequence identity include determining the nucleotide sequence of a polynucleotide and/or determining the amino acid sequence encoded thereby, and comparing these sequences to a second nucleotide or amino acid sequence.
- Two or more sequences can be compared by determining their "percent identity.”
- the percent identity of two sequences, whether nucleic acid or amino acid sequences is the number of exact matches between two aligned sequences divided by the length of the shorter sequences and multiplied by 100. Percent identity may also be determined, for example, by comparing sequence information using the advanced BLAST computer program, including version 2.2.9, available from the National Institutes of Health. The BLAST program is based on the alignment method of Karlin and Altschul, Proc. Natl. Acad. Sci. USA 87:2264-2268 (1990 ) and as discussed in Altschul, et al., J. Mol. Biol.
- the BLAST program defines identity as the number of identical aligned symbols (i.e., nucleotides or amino acids), divided by the total number of symbols in the shorter of the two sequences. The program may be used to determine percent identity over the entire length of the proteins being compared. Default parameters are provided to optimize searches with short query sequences in, for example, with the blastp program.
- the program also allows use of an SEG filter to mask-off segments of the query sequences as determined by the SEG program of Wootton and Federhen, Computers and Chemistry 17:149-163 (1993 ). Ranges of desired degrees of sequence identity are approximately 80% to 100% and integer values therebetween. In general, an exact match indicates 100% identity over the length of the shortest of the sequences being compared (or over the length of both sequences, if identical).
- the disclosure provides a method of identifying a plurality of polynucleotides in a sample source.
- the method comprises providing sequencing reads for a plurality of polynucleotides from the sample, and for each sequencing read: (a) performing with a computer system a sequence comparison between the sequencing read and a plurality of reference polynucleotide sequences, wherein the comparison comprises calculating k-mer weights as a measure of how likely it is that k-mers within the sequencing read are derived from a reference sequence within the plurality of reference polynucleotide sequences; (b) identifying the sequencing read as corresponding to a particular reference sequence in a database of reference sequences if the sum of k-mer weights for the reference sequence is above a threshold level; and (c) assembling a record database comprising reference sequences identified in step (b), wherein the record database excludes reference sequences to which no sequencing read corresponds.
- the disclosure provides a method of identifying one or more taxa in a sample from a sample source.
- the method comprises (a) providing sequencing reads for a plurality of polynucleotides from the sample, and for each sequencing read: (i) performing with a computer system a sequence comparison between the sequencing read and a plurality of reference polynucleotide sequences, wherein the comparison comprises calculating k-mer weights as a measure of how likely it is that k-mers within the sequencing read are derived from a reference sequence within the plurality of reference polynucleotide sequences; and (ii) calculating a probability that the sequencing read corresponds to a particular reference sequence in a database of reference sequences based on the k-mer weights, thereby generating a sequence probability; (b) calculating a score for the presence or absence of one or more taxa based on the sequence probabilities corresponding to sequences representative of said one or more taxa; and (c) identifying the one or more taxa as present or
- the one or more taxa comprises a first bacterial strain identified as present and a second bacterial strain identified as absent based on one or more nucleotide differences in sequence.
- the first bacterial strain is identified as present and the second bacterial strain is identified as absent based on a single nucleotide difference in sequence.
- a sequencing read refers to the inferred sequence of nucleotide bases in a nucleic acid molecule.
- a sequencing read may be of any appropriate length, such as about or more than about 20 nt, 30 nt, 36 nt, 40 nt, 50 nt, 75 nt, 100 nt, 150 nt, 200 nt, 250 nt, 300 nt, 400 nt, 500 nt, or more in length. In some cases, a sequencing read is less than 200 nt, 150 nt, 100 nt, 75 nt, or fewer in length.
- Sequencing reads can be "paired," meaning that they are derived from different ends of a nucleic acid fragment. Paired reads can have intervening unknown sequence or overlap. In some cases, the sequencing read is a contig or consensus sequence assembled from separate overlapping reads.
- a sequencing read may be analyzed in terms of component k-mers.
- Sequence comparison may comprise one or more comparison steps in which one or more k-mers of a sequencing read are compared to k-mers of one or more reference sequences (also referred to simply as a "reference").
- a k-mer is about or more than about 3 nt, 4 nt, 5 nt, 6 nt, 7 nt, 8 nt, 9 nt, 10 nt, 11 nt, 12 nt, 13 nt, 14 nt, 15 nt, 16 nt, 17 nt, 18 nt, 19 nt, 20 nt, 25 nt, 30 nt, 35 nt, 40 nt, 45 nt, 50 nt, 75 nt, 100 nt, or more in length.
- a k-mer is about or less than about 30 nt, 25 nt, 20 nt, 15 nt, 10 nt, or fewer in length.
- the k-mer may be in the range of 3 nt to 13 nt, 5 nt to 25 nt in length, 7 nt to 99 nt, or 3 nt to 99 nt in length.
- the length of k-mer analyzed at each step may vary. For example, a first comparison may compare k-mers in a sequencing read and a reference sequence that are 21 nt in length, whereas a second comparison may compare k-mers in a sequencing read and a reference sequence that are 7 nt in length.
- k-mers analyzed may be overlapping (such as in a sliding window), and may be of same or different lengths. While k-mers are generally referred to herein as nucleic acid sequences, sequence comparison also encompasses comparison of polypeptide sequences, including comparison of k-mers consisting of amino acids.
- a reference sequence includes any sequence to which a sequencing read is compared.
- the reference sequence is associated with some known characteristic, such as a condition of a sample source, a taxonomic group, a particular species, an expression profile, a particular gene, an associated phenotype such as likely disease progression, drug resistance or pathogenicity, increased or reduced predisposition to disease, or other characteristic.
- a reference sequence is one of many such reference sequences in a database.
- databases comprising various types of reference sequences are available, one or more of which may serve as a reference database either individually or in various combinations. Databases can comprise many species and sequence types, such as NR, UniProt, SwissProt, TrEMBL, or UniRef90.
- Databases can comprise specific kinds of sequences from multiple species, such as those used for taxonomic classification of species, such as bacteria.
- databases can be 16S databases, such as The Greengenes database, the UNITE database, or the SILVA database. Marker genes other than 16S may be used as reference sequences for the identification of microorganisms (e.g. bacteria), such as metabolic genes, genes encoding structural proteins, proteins that control growth, cell cycle or reproductive regulation, housekeeping genes or genes that encode virulence, toxins, or other pathogenic factors.
- marker genes include, but are not limited to, 18S rDNA, 23 S rDNA, gyrA, gyrB gene, groEL, rpoB gene,fusA gene, recA gene, sod A, coxl gene, and nifD gene.
- Reference databases can comprise internal transcribed sequences (ITS) databases, such as UNITE, ITSoneDB, or ITS2. Databases can comprise multiple sequences from a single species, such as the human genome, the human transcriptome, model organisms such as the mouse genome, the yeast transcriptome, or the C. elegans proteome, or disease vectors such as bat, tick, or mosquitoes and other domestic and wild animals.
- the reference database comprises sequences of human transcripts.
- Reference sequences in databases can comprise DNA sequences, RNA sequences, or protein sequences. Reference sequences in databases can comprise sequences from a plurality of taxa. In some cases, the reference sequences are from a reference individual or a reference sample source. Examples of reference individual genomes are, for example, a maternal genome, a paternal genome, or the genome of a non-cancerous tissue sample. Examples of reference individuals or sample sources are the human genome, the mouse genome, or the genomes of particular serovars, genovars, strains, variants or otherwise characterized types of bacteria, archea, viruses, phages, fungi, and parasites.
- the database can comprise polymorphic reference sequences that contain one or more mutations with respect to known polynucleotide sequences.
- polymorphic reference sequences can be different alleles found in the population, such as SNPs, indels, microdeletions, microexpansions, common rearrangements, genetic recombinations, or prophage insertion sites, and may contain information on their relative abundance compared to non-polymorphic sequences.
- Polymorphic reference sequences may also be artificially generated from the reference sequences of a database, such as by varying one or more (including all) positions in a reference genome such that a plurality of possible mutations not in the actual reference database are represented for comparison.
- the database of reference sequences can comprise reference sequences of one or more of a variety of different taxonomic groups, including but not limited to bacteria, archaea, chromalveolata, viruses, fungi, plants, fish, amphibians, reptiles, birds, mammals, and humans.
- the database of reference sequences consists of sequences from one or more reference individuals or a reference sample sources (e.g. 10, 100, 1000, 10000, 100000, 1000000, or more), and each reference sequence in the database is associated with its corresponding individual or sample source.
- an unknown sample may be identified as originating from an individual or sample source represented in the reference database on the basis of a sequence comparison.
- each reference sequence in the database of reference sequences is associated with, prior to the comparison, a k-mer weight as a measure of how likely it is that a k-mer within the reference sequence originates from the reference sequence.
- the database of reference sequences can comprise sequences from a plurality of taxa, and each reference sequence in the database of reference sequences is associated with a k-mer weight as a measure of how likely it is that a k-mer within the reference sequence originates from a taxon within the plurality of taxa.
- Calculating the k-mer weight can comprise comparing a reference sequence in the database to the other reference sequences in the database, such as by a method described herein. The k-mer values thus associated with sequences or taxa in the database may then be used in determining k-mer weights for k-mers within sequencing reads.
- comparing k-mers in a read to a reference sequence comprises counting k-mer matches between the two.
- the stringency for identifying a match may vary.
- a match may be an exact match, in which the nucleotide sequence of the k-mer from the read is identical to the nucleotide sequence of the k-mer from the reference.
- a match may be an incomplete match, where 1, 2, 3, 4, 5, 10, or more mismatches are permitted.
- a likelihood also referred to as a "k-mer weight" or "KW” can be calculated.
- the k-mer weight relates a count of a particular k-mer within a particular reference sequence, a count of the particular k-mer among a group of sequences comprising the reference sequence, and a count of the particular k-mer among all reference sequences in the database of reference sequences.
- C ref (K i ) indicates the count of the K i in a particular reference.
- C db (K i ) indicates the count of K i in the database.
- This weight provides a relative, database specific measure of how likely it is that a k-mer originated from a particular reference. Prior to comparing a sequencing read to the database of reference sequences, the k-mer weight (or measurement of likelihood that a k-mer originates from a given reference sequence) can be calculated for each k-mer and reference sequence in the database.
- each reference sequence can be associated with a measure of likelihood, or k-mer weight, that a k-mer within the reference sequence originates from a taxon within a plurality of taxa.
- a reference database can comprise sequences from multiple species of canines, and the k-mer weight could be calculated by relating the count of a given k-mer in all canine sequences to its count in the entire database, which includes other taxa.
- the k-mer weight measuring how likely it is that a k-mer originates from a specific taxon is calculated by defining C ref (K i ) in the above equation as a function that returns the total count of K i in a particular taxon.
- reference database derived weights for a plurality of k-mers within a sequencing read are added and compared to a threshold value.
- the threshold value can be specific to the collection of reference sequences in the database and may be selected based on a variety of factors, such as average read length, whether a specific sequence or source organism is to be identified as present in the sample, and the like. If the sum of k-mer weights for the reference sequence is above the threshold level, the sequencing read may be identified as corresponding to the reference sequence, and optionally the organism or taxonomic group associated with the reference sequence. In some cases, the read is assigned to the reference sequence with the maximum sum of k-mer weights, which may or may not be required to be above a threshold.
- the sequence read can be assigned to the taxonomic lowest common ancestor (LCA) taking into account the read's total k-mer weight along each branch of the phylogenetic tree.
- LCA taxonomic lowest common ancestor
- the methods comprise calculating a probability.
- a probability is calculated for a sequencing read generated from a plurality of polynucleotides.
- the probability is the probability (or likelihood) that the sequencing read corresponds to a particular reference sequence in a database of reference sequences based on the k-mer weights.
- a probability is calculated for each sequencing read, thereby generating a plurality of sequence probabilities.
- the presence or absence of one or more taxa in a sample is determined based on the sequence probabilities. For example, the probability may identify a first bacterial strain as being present in the sample and a second bacterial strain as being absent in the sample. In some cases, the probability is represented as a percentage (%) or as a fraction.
- a probability is provided as a score representative of the probability.
- the score can be based on any arbitrary scale so long as the score is indicative of the probability (e.g. a probability that an individual sequence corresponds to a particular reference sequence, or a probability that a particular taxon is present in the sample).
- a score representative of the probability is used to determine the presence or absence of one or more taxa within a sample. For example, a score above a threshold value may be indicative of presence, and/or a score below a threshold value may be indicative of absence. In some embodiments, presence or absence is reported as a probability, rather than an absolute call. Example methods for calculating such probabilities are provided herein. In general, cases described herein in terms of presence or absence likewise encompass calculating a probability or score for such presence or absence.
- results of methods described herein will typically be assembled in a record database.
- the record database comprises reference sequences identified as present in the sample and excludes reference sequences to which no sequencing read was found to correspond, such as by failure to match a sequencing read above a set threshold level.
- the software routines used to generate the sequence record database and to compare sequencing reads to the database can be run on a computer. The comparison can be performed automatically upon receiving data. The comparison can be performed in response to a user request. The user request can specify which reference database to compare the sample to.
- the computer can comprise one or more processors. Processors may be associated with one or more controllers, calculation units, and/or other units of a computer system, or implanted in firmware as desired.
- routines may be stored in any computer readable memory, such as in RAM, ROM, flash memory, a magnetic disk, a laser disk, or other storage medium.
- the record database, sequencing reads, or a report summarizing the results of database construction or sequence read comparison may also be stored in any suitable medium, such as in RAM, ROM, flash memory, a magnetic disk, a laser disk, or other storage medium.
- the record database, sequencing reads, or a report summarizing the results of database construction or sequence read comparison may be delivered to a computing device via any known delivery method including, for example, over a communication channel such as a telephone line, the internet, a wireless connection, etc., or via a transportable medium, such as a computer readable disk, flash drive, etc...
- a database, sequencing reads, or report may be communicated to a user at a local or remote location using any suitable communication medium.
- the communication medium can be a network connection, a wireless connection, or an internet connection.
- a database or report can be transmitted over such networks or connections (or any other suitable means for transmitting information, including but not limited to mailing database summary, such as a print-out) for reception and/or for review by a user.
- the recipient can be but is not limited to the customer, an individual, a health care provider, a health care manager, or electronic system (e.g. one or more computers, and/or one or more servers).
- the database or report generator sends the report to a recipient's device, such as a personal computer, phone, tablet, or other device.
- the database or report may be viewed online, saved on the recipient's device, or printed.
- the comparison of communicated sequencing reads to a database can occur after all the reads are uploaded.
- the comparison of communicated sequencing reads to a database can begin while the sequencing reads are in the process of being uploaded.
- One or more steps of a method described herein may be performed in parallel for each of the plurality of sequencing reads.
- each of the sequencing reads in the plurality may be subjected in parallel to a first sequence comparison between the sequencing read and a plurality of reference polynucleotide sequences (e.g. reference polynucleotide sequences from a plurality of different taxa and/or a plurality of different reference databases).
- Comparison in parallel differs from certain stepwise comparison processes in that sequencing reads having a purported match in a first reference database are not subtracted from the query set of sequences for subsequent comparison with a second reference database.
- sequences having a purported match in the first database may be incorrectly identified before comparison being run against a reference database containing a more accurate match (e.g. the correct sequence).
- each sequence can be assigned to an optimal first taxonomic class prior to identifying with greater specificity a sequence or taxon to which a sequencing read corresponds.
- sequencing reads may be first classified as corresponding to human, bacterial, or fungal sequences before identifying a particular gene, bacterial species, or fungal species to which the sequencing read corresponds.
- Parallel sequence comparison may comprise comparison with sequences from two or more different taxonomic groups, such as 3, 4, 5, 6, or more different taxonomic groups.
- the different taxonomic groups may be selected from two or more of the following bacteria, archaea, chromalveolata, viruses, fungi, plants, fish, amphibians, reptiles, birds, mammals, and humans.
- a method may further comprise quantifying an amount of polynucleotides corresponding to a reference sequence identified in an earlier step. Quantification can be based on a number of corresponding sequencing reads identified. This can include normalizing the count by the total number of reads, the total number of reads associated with sequences, the length of the reference sequence, or a combination thereof. Examples of such normalization include FPKM and RPKM, but may also include other methods that take into account the relative amount of reads in different samples, such as normalizing sequencing reads from samples by the median of ratios of observed counts per sequence. A difference in quantity between samples can indicate a difference between the two samples.
- the quantitation can be used to identify differences between subjects, such as comparing the taxa present in the microbiota of subjects with different diets, or to observe changes in the same subject over time, such as observing the taxa present in the microbiota of a subject before and after going on a particular diet.
- a method may comprise determining the presence, absence, or abundance of specific taxa or nucleotide polymorphisms within samples based on results of an earlier step.
- the plurality of reference polynucleotide sequences typically comprise groups of sequences corresponding to individual taxa in the plurality of taxa.
- at least 50, 100, 250, 500, 1000, 5000, 10000, 50000, 100000, 250000, 500000, or 1000000 different taxa are identified as absent or present (and optionally abundance, which may be relative) based on sequences analyzed by a method described herein. In some cases, this analysis is performed in parallel.
- the methods, compositions, and systems of the present disclosure enable parallel detection of the presence or absence of a taxon in a community of taxa, such as an environmental or clinical sample, when the taxon identified comprises less than one per 10 9 , or one per 10 6 , or 0.05% of the total population of taxa in the source sample.
- detection is based on sequencing reads corresponding to a polynucleotide that is present at less than 0.01% of the total nucleic acid population.
- the particular polynucleotide may be at least 20%, 30%, 40%, 50%, 60%, 70%, 80%, 85%, 90%, 91%, 92%, 93%, 94%, 95%, 96% or 97% homologous to other nucleic acids in the population.
- the particular polynucleotide is less than 75%, 50%, 40%, 30%, 20%, or 10% homologous to other nucleic acids in the population.
- Determining the presence, absence, or abundance of specific taxa can comprise identifying an individual subject as the source of a sample.
- a reference database may comprise a plurality of reference sequences, each of which corresponds to an individual organism (e.g. a human subject), with sequences from a plurality of different subject represented among the reference sequences. Sequencing reads for an unknown sample may then be compared to sequences of the reference database, and based on identifying the sequencing reads in accordance with a described method, an individual represented in the reference database may be identified as the sample source of the sequencing reads.
- the reference database may comprise sequences from at least 10 2 , 10 3 , 10 4 , 10 5 , 10 6 , 10 7 , 10 8 , 10 9 , or more individuals.
- a sequencing read does not have a match to a reference sequence at the level of a particular taxonomic group (e.g. at the species level), or at any taxonomic level.
- the corresponding sequence may be added to a reference database on the basis of known characteristics.
- a sequence is identified as belonging to a particular taxon in the plurality of taxa, and is not present among the group of sequences corresponding to that taxon, it is added to the group of sequences corresponding to the taxon for use in later sequence comparisons.
- bacterial genome can be added to the sequence database.
- the sequencing read may be added to a reference database of sequences associated with that source or condition for use in identifying future samples that share the same source or condition.
- a sequence that does not have a match at a lower level but does have a match at a higher level may be assigned to that higher level while also adding the sequencing read to the plurality of reference sequences that correspond to that taxonomic group. Reference databases so updated may be used in later sequence comparisons.
- two possible taxa may be tied for the assignment of a particular sequencing read.
- the tie may be resolved.
- a tie is resolved by determining a sum of k-mer weights for the reference sequences along each branch of a phylogenetic tree connecting the taxa. The sequencing read may then be assigned to the node connected to the branch with the highest sum of k-mer weights.
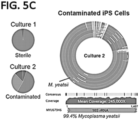
- a reference database can consist of sequences (and optionally abundance levels of sequences) associated with one or more conditions. Multiple conditions may be represented by one or more sequences in the reference database, such as 10, 50, 100, 1000, 10000, 100000, 1000000, or more conditions. For example, a reference database may consist of thousands of groups of sequences, each group of sequences being associated with a different bacterial contaminant, such that contamination of a sample by any of the represented bacteria may be detected by sequence comparison according to a method of the disclosure.
- a condition can be any characteristic of a sample or source from which a sample is derived.
- the reference database may consist of a set of genes that are associated with contamination by microorganisms, infection of a subject from which the sample is derived, or a host response to pathogens.
- Other conditions include, but are not limited to, contamination (e.g. environmental contamination, surface contamination, food contamination, air contamination, water contamination, cell culture contamination), stimulus response (e.g. drug responder or non-responder, allergic response, treatment response), infection (e.g. bacterial infection, fungal infection, viral infection), disease state (e.g. presence of disease, worsening of disease, disease recovery), and a healthy state.
- the sequences may be derived from and associated with any of a variety of infectious agents.
- the infectious agent can be bacterial.
- Non-limiting examples of bacterial pathogens include Mycobacteria (e.g. M. tuberculosis, M. bovis, M. avium, M. leprae, and M. africanum ), rickettsia, mycoplasma, chlamydia, and legionella.
- bacterial infections include, but are not limited to, infections caused by Gram positive bacillus (e.g., Listeria, Bacillus such as Bacillus anthracis, Erysipelothrix species), Gram negative bacillus (e.g., Bartonella, Brucella, Campylobacter, Enterobacter, Escherichia, Francisella, Hemophilus, Klebsiella, Morganella, Proteus, Providencia, Pseudomonas, Salmonella, Serratia, Shigella, Vibrio and Yersinia species), spirochete bacteria (e.g., Borrelia species including Borrelia burgdorferi that causes Lyme disease), anaerobic bacteria (e.g., Actinomyces and Clostridium species), Gram positive and negative coccal bacteria, Enterococcus species, Streptococcus species, Pneumococcus species, Staphylococcus species, and Neisseria species.
- infectious bacteria include, but are not limited to: Helicobacter pyloris, Legionella pneumophilia, Mycobacteria tuberculosis, M. avium, M. intracellular e, M. kansaii, M.
- Sequences in the reference database may be associated with viral infectious agents.
- viral pathogens include the herpes virus ⁇ e.g., human cytomegalomous virus (HCMV), herpes simplex virus 1 (HSV-1), herpes simplex virus 2 (HSV-2), varicella zoster virus (VZV), Epstein-Barr virus), influenza A virus and Heptatitis C virus (HCV) (see Munger et al, Nature Biotechnology (2008) 26: 1179-1186 ; Syed et al, Trends in Endocrinology and Metabolism (2009) 21 :33-40 ; Sakamoto et al, Nature Chemical Biology (2005) 1 :333-337 ; Yang et al, Hepatology (2008) 48: 1396-1403 ) or a picomavirus such as Coxsackievirus B3 (CVB3) (see Rassmann et al, Anti-viral Research (2007) 76: 150-158 ).
- HCMV human cytomegalomous virus
- viruses include, but are not limited to, the hepatitis B virus, HIV, poxvirus, hepadavirus, retrovirus, and RNA viruses such as flavivirus, togavirus, coronavirus, Hepatitis D virus, orthomyxovirus, paramyxovirus, rhabdovirus, bunyavirus, filo virus, Adenovirus, Human herpesvirus, type 8, Human papillomavirus, BK virus, JC virus, Smallpox, Hepatitis B virus, Human bocavirus, Parvovirus B19, Human astrovirus, Norwalk virus, coxsackievirus, hepatitis A virus, poliovirus, rhinovirus, Severe acute respiratory syndrome virus, Hepatitis C virus, yellow fever virus, dengue virus, West Nile virus, Rubella virus, Hepatitis E virus, and Human immunodeficiency virus (HIV).
- flavivirus flavivirus
- togavirus coronavirus
- Hepatitis D virus orthomy
- the virus is an enveloped virus.
- enveloped virus examples include, but are not limited to, viruses that are members of the hepadnavirus family, herpesvirus family, iridovirus family, poxvirus family, flavivirus family, togavirus family, retrovirus family, coronavirus family, filovirus family, rhabdovirus family, bunyavirus family, orthomyxovirus family, paramyxovirus family, and arenavirus family.
- HBV Hepadnavirus hepatitis B virus
- woodchuck hepatitis virus woodchuck hepatitis virus
- Hepadnaviridae Hepatitis virus
- duck hepatitis B virus heron hepatitis B virus
- Herpesvirus herpes simplex virus (HSV) types 1 and 2 varicella-zoster virus, cytomegalovirus (CMV), human cytomegalovirus (HCMV), mouse cytomegalovirus (MCMV), guinea pig cytomegalovirus (GPCMV), Epstein-Barr virus (EBV), human herpes virus 6 (HHV variants A and B), human herpes virus 7 (HHV-7), human herpes virus 8 (HHV-8), Kaposi's sarcoma - associated herpes virus (KSHV), B virus Poxvirus vaccinia virus, variola virus, smallpox virus, monkeypox virus, cowpox virus, camelpox
- HSV
- VEE Venezuelan equine encephalitis
- chikungunya virus Ross River virus, Mayaro virus, Sindbis virus, rubella virus
- Retrovirus human immunodeficiency virus HIV
- HTLV human T cell leukemia virus
- MMTV mouse mammary tumor virus
- RSV Rous sarcoma virus
- lentiviruses Coronavirus, severe acute respiratory syndrome (SARS) virus
- Filovirus Ebola virus Marburg virus
- Metapneumoviruses such as human metapneumovirus (HMPV), Rhabdovirus rabies virus, vesicular stomatitis virus, Bunyavirus, Crimean-Congo hemorrhagic fever virus, Rift Valley fever virus, La Crosse virus, Hanta
- the virus is a non-enveloped virus, examples of which include, but are not limited to, viruses that are members of the parvovirus family, circovirus family, polyoma virus family, papillomavirus family, adenovirus family, iridovirus family, reovirus family, birnavirus family, calicivirus family, and picornavirus family.
- BFDV Beak and Feather Disease virus, chicken anaemia virus, Polyomavirus, simian virus 40 (SV40), JC virus, BK virus, Budgerigar fledgling disease virus, human papillomavirus, bovine papillomavirus (BPV) type 1, cotton tail rabbit papillomavirus, human adenovirus (HAdV-A, HAdV-B, HAdV-C, HAdV-D, HAdV-E, and HAdV-F), fowl adenovirus A, bovine adenovirus D, frog adenovirus, Reovirus, human orbivirus, human coltivirus, mammalian orthoreovirus, bluetongue virus, rotavirus A, rotaviruses (groups B to G), Colorado tick fever virus, aquareo
- the virus may be phage.
- phages include, but are not limited to T4, T5, ⁇ phage, T7 phage, G4, P1, ⁇ 6, Thermoproteus tenax virus 1, M13, MS2, Q ⁇ , ⁇ X174, ⁇ 29, PZA, ⁇ 15, BS32, B103, M2Y (M2), Nf, GA-1, FWLBc1, FWLBc2, FWLLm3, B4.
- the reference database may comprise sequences for phage that are pathogenic, protective, or both.
- the virus is selected from a member of the Flaviviridae family (e.g., a member of the Flavivirus, Pestivirus, and Hepacivirus genera), which includes the hepatitis C virus, Yellow fever virus; Tick-borne viruses, such as the Gadgets Gully virus, Kadam virus, Kyasanur Forest disease virus, Langat virus, Omsk hemorrhagic fever virus, Powassan virus, Royal Farm virus, Karshi virus, tick-borne encephalitis virus, Neudoerfl virus, Sofjin virus, Louping ill virus and the Negishi virus; seabird tick-borne viruses, such as the Meaban virus, Saumarez Reef virus, and the Tyuleniy virus; mosquito-borne viruses, such as the Aroa virus, dengue virus, Kedougou virus, Cacipacore virus, Koutango virus, Japanese encephalitis virus, Murray Valley encephalitis virus, St.
- Tick-borne viruses such as the Gadgets Gully virus, Ka
- the virus is selected from a member of the Arenaviridae family, which includes the Ippy virus, Lassa virus (e.g., the Josiah, LP, or GA391 strain), lymphocytic choriomeningitis virus (LCMV), Mobala virus, Mopeia virus, Amapari virus, Flexal virus, Guanarito virus, Junin virus, Latino virus, Machupo virus, Oliveros virus, Parana virus, Pichinde virus, Pirital virus, Sabia virus, Tacaribe virus, Tamiami virus, Whitewater Arroyo virus, Chapare virus, and Lujo virus.
- Lassa virus e.g., the Josiah, LP, or GA391 strain
- LCMV lymphocytic choriomeningitis virus
- Mobala virus Mopeia virus
- Amapari virus Flexal virus
- Guanarito virus Junin virus
- Latino virus Machupo virus
- Oliveros virus Parana virus
- the virus is selected from a member of the Bunyaviridae family (e.g., a member of the Hantavirus, Nairovirus, Orthobunyavirus, and Phlebovirus genera), which includes the Hantaan virus, Sin Nombre virus, Dugbe virus, Bunyamwera virus, Rift Valley fever virus, La Crosse virus, Punta Toro virus (PTV), California encephalitis virus, and Crimean-Congo hemorrhagic fever (CCHF) virus.
- Bunyaviridae family e.g., a member of the Hantavirus, Nairovirus, Orthobunyavirus, and Phlebovirus genera
- the virus is selected from a member of the Filoviridae family, which includes the Ebola virus (e.g., the Zaire, Sudan, Ivory Coast, Reston, and Kenya strains) and the Marburg virus (e.g., the Angola, Ci67, Musoke, Popp, Ravn and Lake Victoria strains); a member of the Togaviridae family (e.g., a member of the Alphavirus genus), which includes the Venezuelan equine encephalitis virus (VEE), Eastern equine encephalitis virus (EEE), Western equine encephalitis virus (WEE), Sindbis virus, rubella virus, Semliki Forest virus, Ross River virus, Barmah Forest virus, O' nyong'nyong virus, and the chikungunya virus; a member of the Poxyiridae family (e.g., a member of the Orthopoxvirus genus), which includes the smallpox virus, monkeypox
- Infectious agents with which sequences in the reference database may be associated can be fungal.
- infectious fungal infectious agents include, without limitation Aspergillus, Blastomyces, Coccidioides, Cryptococcus, Histoplasma, Paracoccidioides, Sporothrix, and at least three genera of Zygomycetes.
- Secondary infections that can worsen diaper rash include fungal organisms (for example yeasts of the genus Candida).
- the above fungi, as well as many other fungi can cause disease in pets and companion animals.
- the present teaching is inclusive of substrates that contact animals directly or indirectly.
- fungal infectious agent examples include, but are not limited to, Aspergillus, Blastomyces dermatitidis, Candida, Coccidioides immitis, Cryptococcus neoformans, Histoplasma capsulatum var. capsulatum, Paracoccidioides brasiliensis, Sporothrix schenckii, Zygomycetes spp., Absidia corymbifera, Rhizomucor pusillus, or Rhizopus arrhizus.
- parasites Another example of infectious agents with which sequences in a reference database may be associated are parasites.
- Non-limiting examples of parasites include Plasmodium, Leishmania, Babesia, Treponema, Borrelia, Trypanosoma, Toxoplasma gondii, Plasmodium falciparum, P. vivax, P. ovale, P. malariae, Trypanosoma spp., or Legionella spp.
- the reference database may combine sequences associated with different infectious agents (e.g. reference sequences associated with infection by a variety of bacterial agents, a variety of viral agents, and a variety of fungal agents). Moreover, the reference database may comprise sequences identified as originating from a pathogen that has not yet been identified or classified.
- infectious agents e.g. reference sequences associated with infection by a variety of bacterial agents, a variety of viral agents, and a variety of fungal agents.
- the reference database may comprise sequences identified as originating from a pathogen that has not yet been identified or classified.
- Reference sequences associated with a condition also include genetic markers for drug resistance, pathogenicity, and disease.
- a variety of disease-associated markers are known, which may be represented in the reference database.
- a disease-associated marker may be a causal genetic variant.
- causal genetic variants are genetic variants for which there is statistical, biological, and/or functional evidence of association with a disease or trait.
- A. single causal genetic variant can be associated with more than one disease or trait.
- a causal genetic variant can be associated with a Mendelian trait, a non-Mendelian trait, or both.
- Causal genetic variants can manifest as variations in a polynucleotide, such 1 , 2, 3, 4, 5, 6, 7, 8, 9, 10, 20, 50, or more sequence differences (such as between a polynucleotide comprising the causal genetic variant and a polynucleotide lacking the causal genetic variant at the same relative genomic position).
- Non-limiting examples of types of causal genetic variants include single nucleotide polymorphisms (SNP), deletion/insertion polymorphisms (DIP), copy number variants (CNV), short tandem repeats (STR), restriction fragment length polymorphisms (RFLP), simple sequence repeats (SSR), variable number of tandem repeats (VNTR), randomly amplified polymorphic DNA (RAPD), amplified fragment length polymorphisms (AFLP), mter-retrotransposon amplified polymorphisms (IRAP), long and short interspersed elements (LINE/SINE), long tandem repeats (LTR), mobile elements, retrotransposon microsatellite amplified polymorphisms, retrotransposon-based insertion polymorphisms, sequence specific amplified polymorphism, and heritable epi genetic modification (for example, DNA methylation).
- SNP single nucleotide polymorphisms
- DIP deletion/insertion polymorphisms
- CNV copy number variants
- STR short
- a causal genetic variant may also be a set of closely related causal genetic variants. Some causal genetic variants may exert influence as sequence variations in RNA polynucleotides. At this level, some causal genetic variants are also indicated by the presence or absence of a species of RNA polynucleotides. Also, some causal genetic variants result in sequence variations in protein polypeptides.
- a number of causal genetic variants are known in the art.
- An example of a causal genetic variant that is a SNP is the Hb S variant of hemoglobin that causes sickle cell anemia.
- An example of a causal genetic variant that is a DIP is the delta508 mutation of the CFTR gene which causes cystic fibrosis.
- causal genetic variants An example of a causal genetic variant that is a CNV is trisomy 21, which causes Down's syndrome.
- An example of a causal genetic variant that is an STR is tandem repeat that causes Huntington's disease. Additional non-limiting examples of causal genetic variants are described in WO2014015084A2 and US20100022406 .
- drug resistance markers include enzymes conferring resistance to various aminoglycoside antibiotics such as G418 and neomycin (e.g., an aminoglycoside 3'-phosphotransferase, 3'APH II, also known as neomycin phosphotransferase II (nptII or "neo”)), Zeocin TM or bleomycin (e.g., the protein encoded by the ble gene from Streptoalloteichus hindustanus ), hygromycin (e.g., hygromycin resistance gene, hph, from Streptomyces hygroscopicus or from a plasmid isolated from Escherichia coli or Klebsiella pneumoniae, which codes for a kinase (hygromycin phosphotransferase, HPT) that inactivates Hygromycin B through phosphorylation), puromycin (e.g., the Streptomyces alboniger puromycin-N
- JCM 4673 or a deaminase encoded by a gene such as bsr, from Bacillus cereus or the BSD resistance gene from Aspergillus terreus ).
- Other exemplary drug resistance markers are dihydrofolate reductase (DHFR), adenosine deaminase (ADA), thymidine kinase (TK), and hypoxanthine-guanine phosphoribosyltransferase (HPRT).
- DHFR dihydrofolate reductase
- ADA adenosine deaminase
- TK thymidine kinase
- HPRT hypoxanthine-guanine phosphoribosyltransferase
- Proteins such as P-glycoprotein and other multidrug resistance proteins act as pumps through which various cytotoxic compounds, e.g., chemotherapeutic agents such as vinblastine and anthracyclines, are expelled from
- markers of pathogenicity include: factors involved in outer-membrane protein expression, microbial toxins, factors involved in biofilm formation, factors involved in carbohydrate transport and metabolism, factors involved in cell envelope synthesis, and factors involved in lipid metabolism.
- markers of pathogenicity can include, but are not limited to gp120, ebola virus envelope protein, or other glycosylated viral envelope proteins or viral proteins.
- the reference database may consist of host expression profiles associated with a healthy state and/or one or more disease states, in which certain combinations of expressed genes (or levels of expression of particular genes) identify a condition of a subject.
- the groups of genes may be overlapping.
- the reference database consisting of sequences associated with a condition may comprise both host expression profiles and groups of sequences associated with other conditions (e.g. reference sequences associated with various infectious agents).
- the method comprises identifying the condition in the sample or the source from which the sample is derived.
- the condition may be identified based on the presence or change in 10%, 20%, 30%, 40%, 50%, 60%, 70%, 80%, 90%, or 100% of the components of a biosignature.
- a condition may be identified based on the presence or change in less than 20%, 10%, 1%, 0.1%, 0.01%, 0.001%, 0.0001%, or 0.00001% of the components of a biosignature.
- a sample is identified as affected by the condition if at least 80% of the sequences and/or taxa associated with the condition are identified as present (or present at a level associated with the condition).
- the sample is identified as affected by the condition if at least 90%, 95%, 99%, or all sequences or taxa (or quantities of these) associated with the condition are present.
- the condition is one of being from a particular individual, such as an individual subject (e.g. a human in a database of sequences from a plurality of different humans)
- identifying the sample as being affected by the condition comprises identifying the sample as being from the individual to whom the sequences in the database correspond.
- identifying a subject as the source of the sample is based on only a fraction of the subject's genomic sequence (e.g. less than 50%, 25%, 10%, 5%, or less).
- the presence, absence, or abundance of particular sequences, polymorphisms, or taxa can be used for diagnostic purposes, such as inferring that a sample or subject has a particular condition (e.g. an illness), has had a particular condition, or is likely to develop a particular condition if sequence reads associated with the condition (e.g. from a particular disease-causing organism) are present at higher levels than a control (e.g. an uninfected individual).
- the sequencing reads can originate from the host and indicate the presence of a disease-causing organism by measuring the presence, absence, or abundance of a host gene in a sample.
- the presence, absence, or abundance can be used to determine the need for a treatment or care intensity, inform the choice of a treatment, infer effectiveness of a treatment, wherein a decrease in the number of sequencing reads from a disease-causing agent after treatment, or a change in the presence, absence, or abundance of specific host-response genes, indicates that a treatment is effective, whereas no change or insufficient change indicates that the treatment is ineffective.
- the sample can be assayed before or one or more times after treatment is begun. In some examples, the treatment of the infected subject is altered based on the results of the monitoring.
- one or more samples having a known condition may be used to establish a biosignature for that condition.
- the biosignature may be established by associating the record database with the condition. For example, a plurality of samples from a particular environmental source may be used to identify sequences and/or taxa associated with that environmental source, thereby establishing a biosignature consisting of those sequences and/or taxa so associated.
- a biosignature may comprise comparing sequencing reads for one or more samples representative of the condition with one or more samples not representative of the condition.
- a biosignature can consist of gene expression involved in a host response (e.g. an immune response) among individuals infected by a virus, which sequences may be compared to sequences from subjects that are not infected or are infected by some other agent (e.g. bacteria).
- some other agent e.g. bacteria
- the presence, absence, or abundance of particular sequencing reads may be associated with a viral rather than a bacterial infection.
- the biosignature can consist of sequences of genes involved in a variety of antiviral responses, the presence, absence, or abundance of sequencing reads associated with which can be indicative of a specific class or type of viral infection.
- the biosignature associated with a reference database consists of the sequences (and optionally levels) of host transcripts and/or the sequences (and optionally levels) of transcripts or genomes of one or more infectious agents.
- the condition is influenza infection and the biosignature consists of sequences of one or more of (e.g. 1, 2, 3, 4, 5, 6, 7, 8, 9, 10, 11, 12, or all of) IFIT1, IFI6, IFIT2, ISG15, OASL, IFIT3, NT5C3A, MX2, IFITM1, CXCL10, IFI44L, MX1, IFIH1, OAS2, SAMD9, RSAD2, and DDX58.
- the reference database could be common mutations or gene fusions found in cancerous cells, and the presence, absence, or abundance of sequencing reads associated with the biosignature can indicate that the patient has or does not have detectable cancer, what type of cancer a detectable cancer is, a preferred treatment method, whether existing treatment is effective, and/or prognosis.
- the reference database can comprise sequences associated with contamination, such as polynucleotide and/or amino acid sequences from food contaminants, surface contaminants, or environmental contaminants.
- contamination such as polynucleotide and/or amino acid sequences from food contaminants, surface contaminants, or environmental contaminants.
- common food contaminants are Escherichia coli, Clostridium botulinum, Salmonella, Listeria, and Vibrio cholerae.
- surface contaminants are Escherichia coli, Clostridium botulinum, Salmonella, Listeria, Vibrio cholerae, influenza virus, methicillin-resistant Staphylococcus aureus, vancomycin-resistant Enterococci, Pseudomonas spp., Acinetobacter spp., Clostridium difficile, and norovirus.
- Contaminants may be infectious agents, examples of which are provided herein.
- the database of references sequence comprises polynucleotide sequences reverse-translated from amino acid sequences.
- translation refers to the process of using the codon code to determine an amino acid sequence from a nucleotide sequence.
- the standard codon code is degenerate, such that multiple three-nucleotide codons encode the same amino acid.
- reverse-translation often produces a variety of possible sequences that could encode a particular amino acid sequence.
- reverse-translation can use a non-degenerate code, such that each amino acid is only represented by a single codon.
- phenylalanine is encoded by "TTT" and "TTC.”
- a non-degenerate code would only associate one of the codons with phenylalanine.
- a sequencing read can be compared to this non-degenerate, reverse-translated sequence by any of the methods described herein.
- the sequencing read can be translated into all six reading-frames and reverse-translated using the same non-degenerate code to generate six polynucleotides that do not include alternate codons prior to comparing.
- nucleic acid sequences may be analyzed in the protein space.
- Comparing sequences in accordance with a method of the disclosure can provide a variety of benefits.
- computational resources used in the performance of a method may be substantially decreased relative to a reference method, such as a method based on traditional sequence alignment.
- the speed with which a plurality of sequences in a sample are identified may be substantially increased.
- identifying sequencing reads as corresponding to a particular reference sequence in a database of reference sequences may be completed for 20,000 sequences in less than 1.5 seconds.
- at least about 500000, 1000000, 2000000, 3000000, 4000000, 5000000, 10000000, or more sequences are identified per minute.
- the set of sequences and processor used for benchmarking sequence identification processivity may be any that are described herein.
- the sequencing reads used for benchmarking comprise sequences from two or more of bacteria, viruses, fungi, and humans.
- Performance of a method described herein may be defined relative to a reference tool, such as SURPI (see e.g. Naccache, S.N. et al. A cloud-compatible bioinformatics pipeline for ultrarapid pathogen identification from next-generation sequencing of clinical samples. Genome research 24, 1180-1192 (2014 )) or Kraken (see e.g. Wood, D.E. & Salzberg, S.L. Kraken: ultrafast metagenomic sequence classification using exact alignments. Genome biology 15, R46
- a method of the disclosure is at least 5-fold, 10-fold, 50-fold, 100-fold, 250-fold or more faster than SURPI in reaching results that are at least as accurate as SURPI using the same data set and computer hardware.
- a method of the present disclosure provides improved accuracy relative to a reference analysis tool. For example, accuracy may be improved by at least 5%, 6%, 7%, 8%, 9%, 10%, 15%, 20%, 25%, or more, using the same data set and computer hardware.
- sequences and/or taxa present in a known sample are identifies with an accuracy of at least about 80%, 85%, 90%, 95%, 96%, 97%, 98%, 99%, or higher.
- the methods provided herein are operable to distinguish between two or more different polynucleotides based on only a few sequence differences.
- methods provided herein may be utilized to distinguish between two or more strains of taxa (e.g. bacterial strains) based on a low degree of sequence variation between the compared taxa.
- one or more taxa comprise a first bacterial strain identified as present and a second bacterial strain identified as absent based on one or more nucleotide differences in sequence (e.g. 1, 2, 3, 4, 5, 6, 7, 8, 9, 10, 25, 50, or more differences).
- taxa are distinguished based on fewer than 25, 10, 5, 4, 3, 2, or fewer sequence differences.
- the first bacterial strain is identified as present and the second bacterial strain is identified as absent based on a single nucleotide difference in sequence (e.g. a SNP).
- Sequencing data for analysis may be provided by a user, which may have been produced by any suitable means. Sequencing data may also be generated by isolating polynucleotides from a sample and sequencing a plurality of the polynucleotides. Samples from which polynucleotides may be derived for analysis by the present methods and systems can be from any of a variety of sources. Non-limiting examples of sample sources include environmental sources, industrial sources, one or more subjects, and one or more populations of microbes. Examples of environmental sources include, but are not limited to agricultural fields, lakes, rivers, water reservoirs, air vents, walls, roofs, soil samples, plants, and swimming pools.
- Polynucleotides may be isolated from chromalveolata such as malaria, and dinoflagellates.
- subjects from which polynucleotides may be isolated include multicellular organisms, such as fish, amphibians, reptiles, birds, and mammals.
- mammals include be primates (e.g., apes, monkeys, gorillas), rodents (e.g., mice, rats), cows, pigs, sheep, horses, dogs, cats, or rabbits.
- the mammal is a human.
- the sample is an individual subject.
- a sample may comprise a sample from a subject, such as whole blood; blood products; red blood cells; white blood cells; buffy coat; swabs; urine; sputum; saliva; semen; lymphatic fluid; amniotic fluid; cerebrospinal fluid; peritoneal effusions; pleural effusions; biopsy samples; fluid from cysts; synovial fluid; vitreous humor; aqueous humor; bursa fluid; eye washes; eye aspirates; plasma; serum; pulmonary lavage; lung aspirates; animal, including human, tissues, including but not limited to, liver, spleen, kidney, lung, intestine, brain, heart, muscle, pancreas, cell cultures, as well as lysates, extracts, or materials and fractions obtained from the samples described above or any cells and microorganisms and viruses that may be present on or in a sample.
- a sample may comprise a sample from a subject, such as whole blood; blood products; red blood cells; white blood cells; buffy coat
- a sample may comprise cells of a primary culture or a cell line.
- cell lines include, but are not limited to 293-T human kidney cells, A2870 human ovary cells, A431 human epithelium, B35 rat neuroblastoma cells, BHK-21 hamster kidney cells, BR293 human breast cells, CHO chinese hamster ovary cells, CORL23 human lung cells, HeLa cells, or Jurkat cells.
- the sample may comprise a homogeneous or mixed population of microbes, including one or more of viruses, bacteria, protists, monerans, chromalveolata, archaea, or fungi.
- viruses include, but are not limited to human immunodeficiency virus, ebola virus, rhinovirus, influenza, rotavirus, hepatitis virus, West Nile virus, ringspot virus, mosaic viruses, herpesviruses, lettuce big-vein associated virus.
- Non-limiting examples of bacteria include Staphylococcus aureus, Staphylococcus aureus Mu3; Staphylococcus epidermidis, Streptococcus agalactiae, Streptococcus pyogenes, Streptococcus pneumonia, Escherichia coli, Citrobacter koseri, Clostridium perfringens, Enterococcus faecalis, Klebsiella pneumonia, Lactobacillus acidophilus, Listeria monocytogenes, Propionibacterium granulosum, Pseudomonas aeruginosa, Serratia marcescens, Bacillus cereus Staphylococcus aureus Mu50 Yersinia enterocolitica Staphylococcus simulans Micrococcus luteus and Enterobacter aerogenes
- fungi include, but are not limited to Absidia corymbifera, Aspergillus niger, Candida albi
- a sample can also be processed samples such as preserved, fixed and/or stabilised samples.
- a sample can comprise or consist essentially of RNA.
- a sample can comprise or consist essentially of DNA.
- cell-free polynucleotides e.g. cell-free DNA and/or cell-free RNA
- cell-free polynucleotides are extracellular polynucleotides present in a sample (e.g. a sample from which cells have been removed, a sample that is not subjected to a lysis step, or a sample that is treated to separate cellular polynucleotides from extracellular polynucleotides).
- cell-free polynucleotides include polynucleotides released into circulation upon death of a cell, and are isolated as cell-free polynucleotides from the plasma fraction of a blood sample.
- nucleic acids can be purified by organic extraction with phenol,phenol/chloroform/isoamyl alcohol, or similar formulations, including TRIzol and TriReagent.
- extraction techniques include: (1) organic extraction followed by ethanol precipitation, e.g., using a phenol/chloroform organic reagent with or without the use of an automated nucleic acid extractor, e.g., the Model 341 DNA Extractor avai lable from Applied Biosystems (Foster City, Calif.); (2) stationary phase adsorption methods; and (3) salt-induced nucleic acid precipitation methods, such precipitation methods being typically referred to as "salting- out” methods.
- nucleic acid isolation and/or purification includes the use of magnetic particles to which nucleic acids can specifically or non-specifically bind, followed by isolation of the beads using a magnet, and washing and eluting the nucleic acids from the beads.
- the above isolation methods may be preceded by an enzyme digestion step to help eliminate unwanted protein from the sample, e.g., digestion with proteinase K, or other like proteases.
- RNase inhibitors may be added to the lysis buffer.
- Purification methods may be directed to isolate DNA, RNA, or both. When both DNA and RNA are isolated together during or subsequent to an extraction procedure, further steps may be employed to purify one or both separately from the other. Sub-fractions of extracted nucleic acids can also be generated, for example, purification by size, sequence, or other physical or chemical
- the extracted polynucleotides from the samples can be sequenced to genereate sequencing reads.
- Exemplary sequencing techniques can include, for example emulsion PCR (pyrosequencing from Roche 454, semiconductor sequencing from Ion Torrent, SOLiD sequencing by ligation from Life Technologies, sequencing by synthesis from Intelligent Biosystems), bridge amplification on a flow cell (e.g. Solexa/lllumina), isothermal amplification by Wildfire technology (Life Technologies) or rolonies/nanoballs generated by rolling circle amplification (Complete Genomics, Intelligent Biosystems, Polonator).
- Sequencing technologies like Heliscope (Helicos), SMRT technology ( Pacific Biosciences) or nanopore sequencing (Oxford Nanopore) allow direct sequencing of single molecules without prior clonal amplification may be suitable sequencing platforms. Sequencing may be performed with or without target enrichment. In some cases, polynucleotides from a sample are amplified by any suitable means prior to and/or during sequencing.
- DNA sequencing technology that is used in the disclosed methods can be the Helicos True Single Molecule Sequencing (tSMS) (e.g. as described in Harris T. D. et al., Science 320:106-109 [2008 ]).
- tSMS Helicos True Single Molecule Sequencing
- a DNA sample is cleaved into strands of approximately 100 to 200 nucleotides, and a polyA sequence is added to the 3' end of each DNA strand.
- Each strand is labeled by the addition of a fluorescently labeled adenosine nucleotide.
- the DNA strands are then hybridized to a flow cell, which contains millions of oligo-T capture sites that are immobilized to the flow cell surface.
- the templates can be at a density of about 100 million templates/cm 2 .
- the flow cell is then loaded into an instrument, e.g., HeliScope TM sequencer, and a laser illuminates the surface of the flow cell, revealing the position of each template.
- a CCD camera can map the position of the templates on the flow cell surface.
- the template fluorescent label is then cleaved and washed away.
- the sequencing reaction begins by introducing a DNA polymerase and a fluorescently labeled nucleotide.
- the oligo-T nucleic acid serves as a primer.
- the polymerase incorporates the labeled nucleotides to the primer in a template directed manner. The polymerase and unincorporated nucleotides are removed.
- the templates that have directed incorporation of the fluorescently labeled nucleotide are discerned by imaging the flow cell surface. After imaging, a cleavage step removes the fluorescent label, and the process is repeated with other fluorescently labeled nucleotides until the desired read length is achieved. Sequence information is collected with each nucleotide addition step.
- DNA is typically sheared into fragments of approximately 300-800 base pairs, and the fragments are blunt-ended.
- Oligonucleotide adaptors are then ligated to the ends of the fragments.
- the adaptors serve as primers for amplification and sequencing of the fragments.
- the fragments can be attached to DNA capture beads, e.g., streptavidin-coated beads using, e.g., Adaptor B, which contains 5'-biotin tag.
- the fragments attached to the beads are PCR amplified within droplets of an oil-water emulsion. The result is multiple copies of clonally amplified DNA fragments on each bead.
- the beads are captured in wells (pico-liter sized). Pyrosequencing is performed on each DNA fragment in parallel. Addition of one or more nucleotides generates a light signal that is recorded by a CCD camera in a sequencing instrument. The signal strength is proportional to the number of nucleotides incorporated. Pyrosequencing makes use of pyrophosphate (PPi) which is released upon nucleotide addition. PPi is converted to ATP by ATP sulfurylase in the presence of adenosine 5' phosphosulfate. Luciferase uses ATP to convert luciferin to oxyluciferin, and this reaction generates light that is discerned and analyzed.
- PPi pyrophosphate
- SOLiD TM sequencing-by-ligation genomic DNA is sheared into fragments, and adaptors are attached to the 5' and 3' ends of the fragments to generate a fragment library.
- internal adaptors can be introduced by ligating adaptors to the 5' and 3' ends of the fragments, circularizing the fragments, digesting the circularized fragment to generate an internal adaptor, and attaching adaptors to the 5' and 3' ends of the resulting fragments to generate a mate-paired library.
- clonal bead populations are prepared in microreactors containing beads, primers, template, and PCR components.
- the templates are denatured and beads are enriched to separate the beads with extended templates. Templates on the selected beads are subjected to a 3' modification that permits bonding to a glass slide.
- the sequence can be determined by sequential hybridization and ligation of partially random oligonucleotides with a central determined base (or pair of bases) that is identified by a specific fluorophore. After a color is recorded, the ligated oligonucleotide is cleaved and removed and the process is then repeated.
- DNA sequencing may be by single molecule, real-time (SMRT TM ) sequencing technology of Pacific Biosciences.
- SMRT TM real-time sequencing technology
- Single DNA polymerase molecules are attached to the bottom surface of individual zero-mode wavelength identifiers (ZMW identifiers) that obtain sequence information while phospholinked nucleotides are being incorporated into the growing primer strand.
- ZMW is a confinement structure which enables observation of incorporation of a single nucleotide by DNA polymerase against the background of fluorescent nucleotides that rapidly diffuse in an out of the ZMW (in microseconds). It takes several milliseconds to incorporate a nucleotide into a growing strand.
- the fluorescent label is excited and produces a fluorescent signal, and the fluorescent tag is cleaved off. Identification of the corresponding fluorescence of the dye indicates which base was incorporated. The process is repeated.
- Nanopore sequencing is a single-molecule sequencing technology whereby a single molecule of DNA is sequenced directly as it passes through a nanopore.
- a nanopore is a small hole, of the order of 1 nanometer in diameter. Immersion of a nanopore in a conducting fluid and application of a potential (voltage) across it results in a slight electrical current due to conduction of ions through the nanopore. The amount of current which flows is sensitive to the size and shape of the nanopore.
- each nucleotide on the DNA molecule obstructs the nanopore to a different degree, changing the magnitude of the current through the nanopore in different degrees.
- this change in the current as the DNA molecule passes through the nanopore represents a reading of the DNA sequence.
- the DNA sequencing technology that is used in the disclosed methods is the chemical-sensitive field effect transistor (chemFET) array (see e.g. US20090026082 ).
- chemFET chemical-sensitive field effect transistor
- DNA molecules can be placed into reaction chambers, and the template molecules can be hybridized to a sequencing primer bound to a polymerase. Incorporation of one or more triphosphates into a new nucleic acid strand at the 3' end of the sequencing primer can be discerned by a change in current by a chemFET.
- An array can have multiple chemFET sensors.
- single nucleic acids can be attached to beads, and the nucleic acids can be amplified on the bead, and the individual beads can be transferred to individual reaction chambers on a chemFET array, with each chamber having a chemFET sensor, and the nucleic acids can be sequenced.
- Ion Torrent single molecule sequencing which pairs semiconductor technology with a simple sequencing chemistry to directly translate chemically encoded information (A, C, G, T) into digital information (0, 1) on a semiconductor chip.
- A, C, G, T chemically encoded information
- Ion Torrent uses a high-density array of micro-machined wells to perform this biochemical process in a massively parallel way. Each well holds a different DNA molecule. Beneath the wells is an ion-sensitive layer and beneath that an ion sensor.
- a nucleotide for example a C
- a hydrogen ion will be released.
- the charge from that ion will change the pH of the solution, which can be identified by Ion Torrent's ion sensor.
- the Ion personal Genome Machine (PGM TM ) sequencer then sequentially floods the chip with one nucleotide after another. If the next nucleotide that floods the chip is not a match. No voltage change will be recorded and no base will be called. If there are two identical bases on the DNA strand, the voltage will be double, and the chip will record two identical bases called. Direct identification allows recordation of nucleotide incorporation in seconds.
- the disclosure provides a method of detecting a plurality of taxa in a sample.
- the method comprises providing sequencing reads for a plurality of polynucleotides from the sample, and for each sequencing read: (a) assigning the sequencing read to a first taxonomic groups based on a first sequence comparison between the sequencing read and a first plurality of polynucleotide sequences from the different first taxonomic groups, wherein at least two sequencing reads are assigned to different taxonomic groups; (b) performing with a computer system a second sequence comparison between the sequencing read and a second plurality of polynucleotide sequences corresponding to members of the first taxonomic group, wherein the comparison comprises counting a number of k-mers within the sequencing read of at least 5 nucleotides in length that exactly match one or more k-mers within a reference sequence in the second plurality of polynucleotide sequences; (c) classifying the sequencing read as belonging to a second taxon
- Sequence comparison may comprise any method of sequence comparison described herein.
- sequence comparison comprises one or more comparison steps in which one or more k-mers of a sequencing read are compared to k-mers of one or more reference sequences (also referred to simply as a "reference").
- a k-mer is about or more than about 3 nt, 4 nt, 5 nt, 6 nt, 7 nt, 8 nt, 9 nt, 10 nt, 11 nt, 12 nt, 13 nt, 14 nt, 15 nt, 16 nt, 17 nt, 18 nt, 19 nt, 20 nt, 25 nt, 30 nt, 35 nt, 40 nt, 45 nt, 50 nt, 75 nt, 100 nt, or more in length.
- a k-mer is about or less than about 30 nt, 25 nt, 20 nt, 15 nt, 10 nt, or fewer in length.
- the k-mer may be in the range of 3 nt to 13 nt, 5 nt to 25 nt in length, 7 nt to 99 nt, or 3 nt to 99 nt in length.
- the length of k-mer analyzed at each step may vary. For example, a first comparison may compare k-mers in a sequencing read and a reference sequence that are 21 nt in length, whereas a second comparison may compare k-mers in a sequencing read and a reference sequence that are 7 nt in length.
- k-mers analyzed may be overlapping (such as in a sliding window), and may be of same or different lengths. While k-mers are generally referred to herein as nucleic acid sequences, sequence comparison also encompasses comparison of polypeptide sequences, including comparison of k-mers consisting of amino acids. Reference sequences and reference databases used in performing a sequence comparison can be any described herein, such as with regard to any of the various aspects of the disclosure.
- comparing k-mers in a read to a reference sequence comprises counting k-mer matches between the two.
- the stringency for identifying a match may vary.
- a match may be an exact match, in which the nucleotide sequence of the k-mer from the read is identical to the nucleotide sequence of the k-mer from the reference.
- a match may be an incomplete match, where 1, 2, 3, 4, 5, 10, or more mismatches are permitted.
- a likelihood also referred to as a "k-mer weight" or "KW” can be calculated.
- the k-mer weight relates a count of a particular k-mer within a particular reference sequence, a count of the particular k-mer among a group of sequences comprising the reference sequence, and a count of the particular k-mer among all reference sequences in the database of reference sequences.
- C ref (K i ) indicates the count of the K i in a particular reference.
- C db (K i ) indicates the count of K i in the database.
- This weight provides a relative, database specific measure of how likely it is that a k-mer originated from a particular reference. Prior to comparing a sequencing read to the database of reference sequences, the k-mer weight (or measurement of likelihood that a k-mer originates from a given reference sequence) is calculated for each k-mer and reference sequence in the database.
- each reference sequence can be associated with a measure of likelihood, or k-mer weight, that a k-mer within the reference sequence originates from a taxon within a plurality of taxa.
- a reference database can comprise sequences from multiple species of canines, and the k-mer weight could be calculated by relating the count of a given k-mer in all canine sequences to its count in the entire database, which includes other taxa.
- the k-mer weight measuring how likely it is that a k-mer originates from a specific taxon is calculated by defining C ref (K i ) in the above equation as a function that returns the total count of K i in a particular taxon.
- Results may be stored in a record database, examples of which are described herein, such as with regard to any of the various aspects of the disclosure.
- a single detection process may comprise multiple sequence comparison steps. One or more of the steps may be performed for all sequences to be evaluated by that step in parallel.
- a sequencing read is assigned to a first taxonomic group based on a first sequence comparison between the sequencing read and a first plurality of polynucleotide sequences from the different first taxonomic groups, wherein at least two sequencing reads are assigned to different taxonomic groups.
- a first taxonomic group may be a broad class, assignment to which may specify which reference database or reference sequences should be used in a second comparison to identify the sequence or corresponding taxon with greater specificity.
- assignment to a first taxonomic class can comprise assigning a sequence to any of bacteria, archaea, chromalveolata, viruses, fungi, plants, fish, amphibians, reptiles, birds, mammals, and humans.
- the first plurality of polynucleotides may be in the form of a reference database, which can comprise sequences from any of a variety of taxa to which a sequence may be assigned.
- the first comparison may be performed for all sequencing reads to be analyzed in parallel, such that assignment to a first taxonomic group comprises assignment to the group yielding the closest match among all groups to which a sequencing read is compared.
- a second sequence comparison step may be performed, wherein a sequencing read and a second plurality of polynucleotide sequences corresponding to members of the first taxonomic group to which the read was assigned are compared.
- the second comparison will typically comprise counting a number of k-mers within the sequencing read of at least 5 nucleotides in length that exactly match one or more k-mers within a reference sequence in the second plurality of polynucleotide sequences. Examples of k-mer analyses are provided herein, such as with respect to any of the various aspects of the disclosure.
- the second plurality of sequences may be in the form of a second reference database.
- the second plurality of polynucleotide sequences may comprise or consist of the subset of sequences associated with the first taxonomic group to which the sequencing read was assigned, or only a subset of these.
- the second plurality of polynucleotide sequences may comprise or consist of sequences associated with the first taxonomic group that were not among the first polynucleotide sequences.
- the parameters for the second sequence comparison may be the same or different from the parameters used in the first sequence comparison. For example, k-mer length, k-mer weight threshold to identify a match, or stringency may be the same or different, each of which may be varied independently.
- a sequencing read may be classified as belonging to a second taxonomic group that is more specific than the first taxonomic group if a measure of similarity between the sequencing read and reference sequence is above a first threshold level.
- Threshold for making an identification may vary depending on the parameters of the comparison. Examples of possible thresholds are provided herein, such as with regard to any of the various aspects of the disclosure. Determining a threshold may comprise calculating a sum of k-mer weights for a given sequencing read, as described herein.
- the threshold value may be selected based on a variety of factors, such as average read length, the reference sequences to which the reads are compared, whether a specific sequence or source organism is to be identified as present in the sample, and the like.
- the threshold value can be specific to the set of specified reference sequences. If the sum of k-mer weights for the reference sequence is above the threshold level, the sequencing read may be identified as corresponding to the reference sequence, and optionally the organism or taxonomic group associated with the reference sequence. In some cases, the read is assigned to the reference sequence with the maximum sum of k-mer weights, which may or may not be required to be above a threshold.
- the sequence read can be assigned to the taxonomic lowest common ancestor (LCA) taking into account the read's total k-mer weight along each branch of the phylogenetic tree.
- LCA taxonomic lowest common ancestor
- correspondence with a reference sequence, organism, or taxonomic group indicates that it was present in the sample.
- a second taxonomic group is considered more specific than a first taxonomic group when the second taxonomic group is of a more specific hierarchical order.
- the first taxonomic group may be at the level of family, while the second taxonomic group is at the level of genus or species.
- the second taxonomic group may be at the level of a specific individual.
- a sequence may be identified as human in the first sequence comparison, and classification based on the second comparison may identify the particular human from which the sequence was derived, a process which may further involve comparison of groups of sequences.
- classifying a sequencing read is not possible on the basis of the second comparison, such as in the case where the maximum sum of k-mer weights for a sequencing read is below a threshold.
- classifying the sequence read as belonging to the second taxonomic group can be based on similarity above a second threshold level determined by comparing with the computer system a sequence derived from translating the sequencing read and a third set of reference sequences corresponding to amino acid sequences of members of the first taxonomic group.
- Methods for translating sequencing reads are described herein. The process may comprise translation of one or more reading frames, such as all 6 reading frames. Comparison may be at the level of amino acids, where the translated sequencing read is compared to a set of reference amino acid sequences.
- the translated sequencing reads may be reverse-translated, and compared to reference sequences derived from reverse-translating reference amino acid sequences.
- Methods for translating and reverse-translating are described herein, and include reverse-translating using a non-degenerate code.
- Reference amino acid sequences may be in the form of a reference database, examples of which are described herein.
- classifying a sequencing read is still not possible on the basis of the comparison to the third set of reference sequences, such as in the case where the maximum sum of k-mer weights for a sequencing read is below a threshold.
- the method may further comprise performing with the computer system a relaxed sequence comparison between the sequencing read and the second plurality of polynucleotide sequences.
- the relaxed sequence comparison is less stringent than the second sequence comparison.
- Methods for reducing stringency of a sequencing comparison are described herein, such with regard to any of the various aspects of the disclosure. Classifying may then be possible based on identifying matching sequences at the lower stringency.
- a similar reduced-stringency analysis may be applied with respect to reverse-translated amino acid reference sequences, which may be performed in place of or in addition to reduced-stringency comparison of reference polynucleotide sequences.
- two or more reference sequences from different taxa may be identified as possibly corresponding to the sequencing read based on the parameters for comparison.
- the tie will usually be resolved in order to assign the sequencing read to just one reference sequence or taxon.
- resolving a tie between two or more possible taxonomic groups based on the k-mer weight that the sequencing read corresponds to a polynucleotide from an ancestor of one of the possible taxonomic groups. Methods for resolving such ties are described herein, such as with regard to any of the various aspects of the disclosure.
- a method may further comprise quantifying an amount of polynucleotides corresponding to a reference sequence identified in an earlier step. Quantification can be based on a number of corresponding sequencing reads identified. This can include normalizing the count by the total number of reads, the total number of reads associated with sequences, the length of the reference sequence, or a combination thereof.
- normalization examples include FPKM and RPKM, but may also include other methods that take into account the relative amount of reads in different samples, such as normalizing sequencing reads from samples by the median of ratios of observed counts per sequence.
- a difference in quantity between samples can indicate a difference between the two samples.
- the quantitation can be used to identify differences between subjects, such as comparing the taxa present in the microbiota of subjects with different diets, or to observe changes in the same subject over time, such as observing the taxa present in the microbiota of a subject before and after going on a particular diet. If a sequencing read classified as belonging to the second taxonomic group is not present among the group of reference sequences associated with that second taxonomic group, it may be added to the group of reference sequences for use in future comparisons.
- a method may comprise determining the presence, absence, or abundance of specific taxa within samples based on results of an earlier step.
- the plurality of reference polynucleotide sequences typically comprise groups of sequences corresponding to individual taxa in the plurality of taxa.
- at least 50, 100, 250, 500, 1000, 5000, 10000, 50000, 100000, 250000, 500000, or 1000000 different taxa are identified as absent or present (and optionally abundance, which may be relative) based on sequences analyzed by a method described herein. In some cases, this analysis is performed in parallel.
- the methods, compositions, and systems of the present disclosure enable parallel detection of the presence or absence of a taxon in a community of taxa, such as an environmental or clinical sample, when the taxon identified comprises less than 0.05% of the total population of taxa in the source sample.
- detection is based on sequencing reads corresponding to a polynucleotide that is present at less than 0.01% of the total nucleic acid population.
- the particular polynucleotide may be at least 20%, 30%, 40%, 50%, 60%, 70%, 80%, 85%, 90%, 91%, 92%, 93%, 94%, 95%, 96% or 97% homologous to other nucleic acids in the population.
- the particular polynucleotide is less than 75%, 50%, 40%, 30%, 20%, or 10% homologous to other nucleic acids in the population.
- Determining the presence, absence, or abundance of specific taxa can comprise identifying an individual subject as the source of a sample.
- a reference database may comprise a plurality of reference sequences, each of which corresponds to an individual organism (e.g. a human subject), with sequences from a plurality of different subject represented among the reference sequences. Sequencing reads for an unknown sample may then be compared to sequences of the reference database, and based on identifying the sequencing reads in accordance with a described method, an individual represented in the reference database may be identified as the sample source of the sequencing reads.
- the reference database may comprise sequences from at least 10 2 , 10 3 , 10 4 , 10 5 , 10 6 , 10 7 , 10 8 , 10 9 , or more individuals.
- a sequencing read does not have a match to a reference sequence at the level of a particular taxonomic group (e.g. at the species level), or at any taxonomic level.
- the corresponding sequence may be added to a reference database on the basis of known characteristics.
- a sequence is identified as belonging to a particular taxon in the plurality of taxa, and is not present among the group of sequences corresponding to that taxon, it is added to the group of sequences corresponding to the taxon for use in later sequence comparisons.
- bacterial genome can be added to the sequence database.
- the sequencing read may be added to a reference database of sequences associated with that source or condition for use in identifying future samples that share the same source or condition.
- a sequence that does not have a match at a lower level but does have a match at a higher level may be assigned to that higher level while also adding the sequencing read to the plurality of reference sequences that correspond to that taxonomic group. Reference databases so updated may be used in later sequence comparisons.
- Identifying the presence, absence, or abundance of the plurality of taxa is used to diagnose a condition based on a degree of similarity between the plurality of taxa detected in the sample and a biological signature for the condition.
- Example conditions include, but are not limited to, contamination (e.g. environmental contamination, surface contamination, food contamination, air contamination, water contamination, cell culture contamination), stimulus response (e.g. drug responder or non-responder, allergic response, treatment response), infection (e.g. bacterial infection, fungal infection, viral infection), disease state (e.g. presence of disease, worsening of disease, disease recovery), a healthy state, or the identity of a sample source (e.g. a specific location or an individual subject). Examples of these are provided herein.
- the method comprises identifying the condition in the sample or the source from which the sample is derived.
- the condition may be identified based on the presence or change in 10%, 20%, 30%, 40%, 50%, 60%, 70%, 80%, 90%, or 100% of the components of a biosignature.
- a condition may be identified based on the presence or change in less than 20%, 10%, 1%, 0.1%, 0.01%, 0.001%, 0.0001%, or 0.00001% of the components of a biosignature.
- a sample is identified as affected by the condition if at least 80% of the sequences and/or taxa associated with the condition are identified as present (or present at a level associated with the condition).
- the sample is identified as affected by the condition if at least 90%, 95%, 99%, or all sequences or taxa (or quantities of these) associated with the condition are present.
- the condition is one of being from a particular individual, such as an individual subject (e.g. a human in a database of sequences from a plurality of different humans)
- identifying the sample as being affected by the condition comprises identifying the sample as being from the individual to whom the sequences in the database correspond.
- identifying a subject as the source of the sample is based on only a fraction of the subject's genomic sequence (e.g. less than 50%, 25%, 10%, 5%, or less).
- the presence, absence, or abundance of particular sequences or taxa can be used for diagnostic purposes, such as inferring that a sample or subject has a particular condition (e.g. an illness) if sequence reads from a particular disease-causing organism are present at higher levels than a control (e.g. an uninfected individual).
- a control e.g. an uninfected individual.
- the sequencing reads can originate from the host and indicate the presence of a disease-causing organism by measuring the presence, absence, or abundance of a host gene in a sample.
- the presence, absence, or abundance can be used to infer effectiveness of a treatment, wherein a decrease in the number of sequencing reads from a disease-causing agent after treatment, or a change in the presence, absence, or abundance of specific host-response genes, indicates that a treatment is effective, whereas no change or insufficient change indicates that the treatment is ineffective.
- the sample can be assayed before or one or more times after treatment is begun. In some examples, the treatment of the infected subject is altered based on the results of the monitoring.
- one or more samples having a known condition may be used to establish a biosignature for that condition using a method of the disclosure.
- the biosignature may be established by associating the presence, absence, or abundance of the plurality of taxa with the condition.
- a plurality of samples from a particular environmental source may be used to identify sequences and/or taxa associated with that environmental source, thereby establishing a biosignature consisting of those sequences and/or taxa so associated.
- a sample e.g.
- condition so identified may be that of a passive carrier (e.g. where viral sequences are detected, but a host immune response is not).
- the method may further comprise any of isolating polynucleotides from a sample, amplifying polynucleotides, and/or sequencing polynucleotides to generate sequencing reads for comparison, such as by any of the methods described herein.
- the disclosure provides systems for performing any of the methods described herein.
- the system is configured for identifying a plurality of polynucleotides in a sample from a sample source based on sequencing reads for the plurality of polynucleotides.
- the system may comprise a computer processor programmed to, for each sequencing read: (a) perform a sequence comparison between the sequencing read and a plurality of reference polynucleotide sequences, wherein the comparison comprises calculating k-mer weights as measures of how likely it is that k-mers within the sequencing read are derived from a reference sequence within the plurality of reference polynucleotide sequences; (b) identify the sequencing read as corresponding to a particular reference sequence in a database of reference sequences if the sum of k-mer weights for the reference sequence is above a threshold level; and (c) assemble a record database comprising reference sequences identified in step (b), wherein the record database excludes reference sequences to which no sequencing read corresponds.
- the system may comprise one or more computer processors programmed to: (a) for each sequencing read, perform a sequence comparison between the sequencing read and a plurality of reference polynucleotide sequences, wherein the comparison comprises calculating k-mer weights as measures of how likely it is that k-mers within the sequencing read are derived from a reference sequence within the plurality of reference polynucleotide sequences; (b) for each sequencing read, calculate a probability that the sequencing read corresponds to a particular reference sequence in a database of reference sequences based on the k-mer weights, thereby generating a sequence probability; (c) calculate a score for the presence or absence of one or more taxa based on the sequence probabilities corresponding to sequences representative of said one or more taxa; and (d) identify the one or more taxa as present or absent in the sample based on the corresponding scores.
- the system may further comprise a reaction module in communication with the computer processor, wherein the reaction module performs polynucleotide sequencing reactions to produce the sequencing reads.
- Processors may be associated with one or more controllers, calculation units, and/or other units of a computer system, or implanted in firmware as desired. If implemented in software, the routines may be stored in any computer readable memory such as in RAM, ROM, flash memory, a magnetic disk, a laser disk, or other storage medium. Likewise, this software may be delivered to a computing device via any known delivery method including, for example, over a communication channel such as a telephone line, the internet, a wireless connection, etc., or via a transportable medium, such as a computer readable disk, flash drive, etc.
- the various steps may be implemented as various blocks, operations, tools, modules or techniques which, in turn, may be implemented in hardware, firmware, software, or any combination thereof.
- some or all of the blocks, operations, techniques, etc. may be implemented in, for example, a custom integrated circuit (IC), an application specific integrated circuit (ASIC), a field programmable logic array (FPGA), a programmable logic array (PLA), etc.
- the computer is configured to receive a customer request to perform a detection reaction on a sample.
- the computer may receive the customer request directly (e.g. by way of an input device such as a keyboard, mouse, or touch screen operated by the customer or a user entering a customer request) or indirectly (e.g. through a wired or wireless connection, including over the internet).
- customers include the subject providing the sample, medical personnel, clinicians, laboratory personnel, insurance company personnel, or others in the health care industry.
- the disclosure provides a computer-readable medium comprising codes that, upon execution by one or more processors, implements a method according to any of the methods disclosed herein.
- execution of the computer readable medium implements a method of identifying a plurality of polynucleotides in a sample from a sample source based on sequencing reads for the plurality of polynucleotides.
- the execution of the computer readable medium implements a method comprising: (a) for each of the sequencing reads, performing a sequence comparison between the sequencing read and a plurality of reference polynucleotide sequences, wherein the comparison comprises calculating k-mer weights as measures of how likely it is that k-mers within the sequencing read are derived from a reference sequence within the plurality of reference polynucleotide sequences; (b) for each of the sequencing reads, identifying the sequencing read as corresponding to a particular reference sequence in a database of reference sequences if the sum of k-mer weights for the reference sequence is above a threshold level; and (c) assembling a record database comprising reference sequences identified in step (b), wherein the record database excludes reference sequences to which no sequencing read corresponds.
- the execution of the computer readable medium implements a method of identifying one or more taxa in a sample from a sample source based on sequencing reads for a plurality of polynucleotides, the method comprising: (a) for each of the sequencing reads, performing a sequence comparison between the sequencing read and a plurality of reference polynucleotide sequences, wherein the comparison comprises calculating k-mer weights as a measure of how likely it is that k-mers within the sequencing read are derived from a reference sequence within the plurality of reference polynucleotide sequences; (b) for each of the sequencing reads, calculating a probability that the sequencing read corresponds to a particular reference sequence in a database of reference sequences based on the k-mer weights, thereby generating a sequence probability; (c) calculating a score for the presence or absence of one or more taxa based on the sequence probabilities corresponding to sequences representative of said one or more taxa; and (d) identifying the one
- Computer readable medium may take many forms, including but not limited to, a tangible storage medium, a carrier wave medium, or physical transmission medium.
- Nonvolatile storage media include, for example, optical or magnetic disks, such as any of the storage devices in any computer(s) or the like, such as may be used to implement the calculation steps, processing steps, etc.
- Volatile storage media include dynamic memory, such as main memory of a computer.
- Tangible transmission media include coaxial cables; copper wire and fiber optics, including the wires that comprise a bus within a computer system.
- Carrier-wave transmission media can take the form of electric or electromagnetic signals, or acoustic or light waves such as those generated during radio frequency (RF) and infrared (IR) data communications.
- RF radio frequency
- IR infrared
- Computer-readable media therefore include for example: a floppy disk, a flexible disk, hard disk, magnetic tape, any other magnetic medium, a CD-ROM, DVD or DVD-ROM, any other optical medium, punch cards paper tape, any other physical storage medium with patterns of holes, a RAM, a PROM and EPROM, a FLASH-EPROM, any other memory chip or cartridge, a carrier wave transporting data or instructions, cables or links transporting such a carrier wave, or any other medium from which a computer can read programming code and/or data. Many of these forms of computer readable media may be involved in carrying one or more sequences of one or more instructions to a processor for execution.
- FIGS. 1A-B An example system in accordance with an embodiment of the disclosure was constructed. An overview of the structure and user interface of this system is illustrated in FIGS. 1A-B , and is referred to in these examples as Taxonomer.
- raw FASTQ files were the input for Taxonomer, which comprised four main modules.
- the 'Binner' module categorized ("bins") sequencing reads into broad taxonomic groups (e.g. host and microbial) followed by comprehensive classification at the nucleotide ('Classifier' module) or amino acid-level ('Protonomer' and 'Afterburner' modules).
- the 'Binner' module used exact k-mer counting for read assignment with a predefined minimum threshold.
- the 'Classifier' module applied exact k-mer matching and probabilistic taxonomic assignment for host transcript expression profiling and classification of bacteria and fungi at the nucleotide level.
- the 'Protonomer' module applied 6-frame translation for virus detection at the amino acid-level. When using discovery mode, sequencing reads that failed amino acid-level classification were subjected to the 'Afterburner' module, which used a reduced amino acid alphabet for increased sensitivity.
- BIOM BIOM format
- BIOM Biological Observation Matrix
- FASTQ formatted read subsets can be used for custom downstream analyses.
- a web interface was developed for Taxonomer that allows users to stream FASTQ files (local or through http access) to the analysis server and interactively visualize results in real-time (illustrated in FIG. 1B ).
- FIG. 1B Using the streaming web application, more than 1x10 5 paired-end reads can be analyzed and visualized in about 5 seconds with fast Internet connection.
- Features of Taxonomer are described in grey boxes. Additional features of Taxonomer are further described below.
- the Binner database was created by counting unique 21bp k-mers in different taxonomic or gene datasets. This was done using Kanalyze, version 0.9.7 (see Audano, P. & Vannberg, F. KAnalyze: a fast versatile pipelined k-mer toolkit. Bioinformatics 30, 2070-2072 (2014 )), but could have alternatively used Jellyfish, version 2.3, (see Marcais, G. & Kingsford, C. A fast, lock-free approach for efficient parallel counting of occurrences of k-mers. Bioinformatics 27, 764-770 (2011 ) ) . Each taxonomic or gene dataset represented a "bin" in which query sequences could be placed based on their k-mer content.
- Each database was assigned a unique bitwise flag that allowed k-mers to belong to one or more bins to be recognized and counted.
- the database bins and flags are shown in FIG. 19 .
- the k-mer counts were merged into a single binary file with two columns, the k-mers and the database flag. Additional columns for other information can be accommodated.
- the file was sorted lexicographically to optimize for rapid k-mer queries. Reads were then assigned to the taxonomic group(s) with which the most k-mers were shared.
- Some reference sequence databases are subsets or overlap with others (e.g. 'Human transcripts' and 'Human genome') and some sequences may be assigned varying taxID's (e.g.
- phage sequences may be annotated as viruses or as bacteria, if integrated as prophages).
- query sequences may share an equal number of k-mers with more than one reference database.
- the 'Binner' module assigns these query sequences as outlined below in Table 1.
- Table 1 Bin assignment for reads with equal numbers of k-mer matches to multiple Binner databases and k-mer matches below threshold. Equal k-mer count of... And ...
- an adapter database can be provided; Binner can ignore k-mers present in the adapter database. In this example, Binner ignored k-mers present in Illumina TruSeq adapters.
- a database of spiked-in control sequences can be provided (e.g. database of External RNA Controls Consortium (ERCC) control sequences) to allow quantification of spike-in controls.
- ERCC External RNA Controls Consortium
- Classifier was used to identify the source of sequences after the sequences were subset by Binner. Classifier identified the source of a sequence based on exact k-mer matching. The k-mer weight for reference sequence was calculated in accordance with Equation 1 and reads were assigned to a reference sequence based on the sum of k-mer weights. In the case of a tie, the query sequence was assigned to the taxonomic lowest common ancestor (LCA) taking into account the read's total k-mer weight along each branch of the phylogenetic tree.
- LCA taxonomic lowest common ancestor
- Taxonomer employed the Afterburner module, a degenerate k-mer matching engine that employs a collapsed aminoacid alphabet. Afterburner used k-means clustering on the BLOSUM62 matrix to generate a compressed amino acid alphabet (see FIG. 8 ). This compressed alphabet results in higher sensitivity in classification with sequences that are more diverged at the expense of a higher false positive rate when compared with Protonomer.
- Example 1 a web-service and implementation for Taxonomer as described in Example 1 are described. Complex metagenomic data can be processed quickly and effectively interpreted through web-based visualizations ( FIG. 1B illustrates such an interface).
- the detection threshold informs a user about how abundant a particular organism must be in order to be detected with the number of reads sampled, thereby providing an indicator of the sensitivity of detection in the sample.
- a slider allowed the user to select an absolute cutoff for the minimum number of reads required in order to be displayed in the sunburst.
- Example 1 Construction of databases for Taxonomer as described in Example 1 are described.
- the Classifier and Protonomer databases are modular, consisting only of multi-fasta files with a 'parent tag' on their definition lines. These tags describe each reference sequence's immediate phylogenetic parent-taxon.
- the marker genes were 16S rRNA gene and genes from the Greengenes database (reference set with operational taxonomic units, OTU, clustered at 99%, version 13_8, FIG. 19 ). This reference set contained 203,452 OTU clusters from 1,262,986 reference sequences.
- the taxonomic lineage for each OTU was used to create a hierarchical taxonomy map to represent OTU relationships. To support the OTU 'species' concept, the taxonomy was completed for ranks in the taxonomic lineage that had no value. Unique dummy species names from the highest taxonomic rank available were used to fill empty values. Versions of the Greengenes database were formatted for use within BLAST, the RDP Classifier, and Kraken.
- Fungal classification was also based on a marker gene approach.
- the marker genes were internal transcribed spacer, ITS, rRNA sequences, and the UNITE database (see Koljalg, U. et al. Towards a unified paradigm for sequence-based identification of fungi. Molecular ecology 22, 5271-5277 (2013 )) (version sh_taxonomy_qiime_ver6_dynamic_s_09.02.2014, FIG. 19 ).
- This reference set contained 45,674 taxa (species hypothesis, SH) generated from 376,803 reference sequences with a default-clustering threshold of 98.5% and expert taxonomic curation. Dummy names were created for ranks that had no value. Versions of the UNITE database were formatted for use with BLAST, the RDP Classifier, and Kraken.
- the viral protein database was created by using UniRef90 (see Suzek, B.E., Huang, H., McGarvey, P., Mazumder, R. & Wu, C.H. UniRef: comprehensive and non-redundant UniProt reference clusters. Bioinformatics 23, 1282-1288 (2007 )) downloaded on June 16, 2014. The database was reduced to 289,486 viral sequences based on NCBI taxonomy. Phage sequences were separated, leaving a total of 200,880 references for other viruses. NCBI taxonomy was used to determine the sequence relationship.
- K-mers were stored in lexicographical order, and k-mer minimizers are used to point to blocks of k-mers in the database. Once a block of k-mers is isolated, a binary search was used to complete the query. In addition to storing the LCA of a k-mer, we also stored the k-mer count and every reference (up to an adjustable cutoff) with associated k-mer weight.
- the Binner database consisted of two binary files: One with extension “.bmi”, the other with extension “.btbi”.
- the file with extension “.bmi” contained information about k-mer minimizers and pointers to blocks of k-mers in the ".btbi” file.
- the ".bmi” file contained rows with the following format: Table 3a.
- Variable types in .bmi file Variable type Variable meaning uint64_t k-mer minimizer uint64_t Number of k-mers in block indexed by this minimizer uint64_t Byte offset to beginning of k-mer block in ".btbi” file
- the ".btbi" file had a header that is 176 bits.
- the header consisted of the following values and C variable types: Table 4.
- Variable types in .btbi file Variable type Variable meaning uint8_t k-mer length ( ⁇ 32) uint8_t k-mer minimizer length ( ⁇ 16) uint64_t Unique k-mer count uint64_t Total k-mer count int k-mer cutoff int taxID cutoff
- the Classifier database consisted of 3 binary files with the following extensions: ".mi”, “.tbi”, and “.rsi”.
- the file with extension “.mi” contained information about k-mer minimizers and pointers to blocks of k-mers in the ".tbi” file.
- the ".mi” file contains rows with the following format: Table 7. Structure of rows in .mi file Variable type Variable meaning uint64_t k-mer minimizer uint64_t Number of k-mers in block indexed by this minimizer uint64_t Byte offset to beginning of k-mer block in ".tbi” file
- the ".tbi" file has a header that is 176 bits.
- the header consisted of the following values and C variable types: Table 8. Structure of the header row in .tbi file Variable type Variable meaning uint8_t k-mer length ( ⁇ 32) uint8_t k-mer minimizer length ( ⁇ 16) uint64_t Unique k-mer count uint64_t Total k-mer count int k-mer cutoff int taxID cutoff
- the ".rsi" file had the following format for each row: Table 10. Structure of rows in .rsi file Variable type Variable meaning uint64_t taxID count uint64_t * taxIDs uint64_t * k-mer weights for each taxID
- Taxonomer database included individual k-mer weights for every taxID. This allowed Taxonomer to accumulate these weights across reads to increase both sequence query assignment sensitivity and specificity.
- Taxonomer described in Example 1 was compared to SURPI (see e.g. Naccache, S.N. et al. A cloud-compatible bioinformatics pipeline for ultrarapid pathogen identification from next-generation sequencing of clinical samples. Genome research 24, 1180-1192 (2014 )). Taxonomer used a non-greedy binning algorithm, as opposed to SURPI, which employs a greedy digital subtraction algorithm (see FIG. 7 ). The data analyzed in this example came from one of the 33 pediatric respiratory tract samples shown in FIG. 6D (RNA) and an additional nasopharyngeal sample (DNA). Of the reads classified as human by SURPI, 1% were classified by Taxonomer as fungal, to lower resolution (11%) or cannot confidently be differentiated between closely related bins (23%) when using a simultaneous binning strategy.
- Taxonomer's alignment-free binning approach was able to capture more phage/viral sequences (7,426) than the alignment-based method (5,798), and resulted in fewer unclassified sequencing reads (3.2% vs. 4.5%). Consistent with the lower abundance of rRNA and mtRNA sequences in DNA sequencing data, Taxonomer had many fewer ambiguous assignments in the DNA dataset than the RNA dataset (0.04%, of which 40% were classified as human and 59% as viral by SURPI; overall agreement 98.7%). In addition to decreased numbers of false negatives, Binner also provides users of the Taxonomer web-service with a high-level overview of the contents of even the largest and most complicated dataset within the first second or so of computation.
- FIG. 18 presents time and classification percentages for Taxonomer, Kraken, and SURPI.
- RNA-Seq data from three virus-positive respiratory tract samples with a range of host vs. microbial composition profiles was used (see e.g. Graf, E.H. Evaluation of Metagenomics for the Detection of Respiratory Viruses Directly from Clinical Samples. (2015 )).
- Kraken was the fastest tool; it required about 1.5 min/sample on average. However, possibly due to its reliance on nucleic acid-level classification only and use a single reference database, Kraken classified fewer reads than Taxonomer or SURPI. SURPI enabled amino acid-level searches for virus detection and discovery, but this greatly extended analysis times to between 1.5 and >12 hours per sample. Like SURPI, Taxonomer provided both nucleic acid and protein-based microbial classification, but Taxonomer also created a host-expression profile. Taxonomer achieved times similar to Kraken, requiring on average ⁇ 5 minutes to classify 5-8x10 6 paired-end reads using 16 CPUs. Moreover, Taxonomer classified the largest number of reads in 2 of the 3 samples and tied with SURPI for the third sample.
- Taxonomer provided fast, and effective means for read and contig classification, was substantially more accurate than the fastest available tools (Kraken and SURPI), and achieved accuracies on 16S amplicon data that closely approach the current standard, RDP. This was facilitated by Taxonomer's comprehensive databases, its k-mer weight approach, and its ability to carry out nucleotide and protein-based searches and classification within a single integrated algorithmic framework. On the datasets tested, Taxonomer was hours faster than SURPI and days faster than RDP. 16S sequences (but not synthetic reads derived from other genomic targets) from the same unrepresented bacteria are almost always correctly binned by Taxonomer (but not erroneously classified; see FIG.
- FIG. 6B also shows receiver operator characteristics (ROC) curves for classification of human and microbial sequences by the 'Binner' module.
- ROC receiver operator characteristics
- FIG. 6D shows the relative read abundance of different taxonomic bins as determined by the 'Binner' module for 33 pediatric respiratory tract samples positive for at least one respiratory virus, including median and interquartile range (IQR) for each bin (6.3x10 6 ⁇ 2x10 6 reads/sample). Relative abundances vary greatly for all bins but reached almost 4 orders of magnitude for the viral and fungal bins.
- IQR median and interquartile range
- Example 6 Bacterial and fungal classification
- Taxonomer described in Example 1 was used to classify reads derived from bacterial and fungal samples.
- a comprehensive classification database can mitigate errors resulting from imperfect matches from query sequences to databases.
- the choice of default reference database can affect the specificity and sensitivity of a classifier.
- One solution is to use RefSeq, but the version of RefSeq (at the time of access) only contained some 5,000 sequenced bacterial taxa, whereas available 16S rRNA sequences suggest existence of at least 100,000 to 200,000 OTUs given existing sequence databases.
- Reads derived from taxa that are absent from the classification database can result in false negative and false positive classifications, especially at the genus and species level ( FIG. 11 ).
- FIG. 11 shows that query sequences not represented in the reference database cause false-positive and false-negative classifications, and that Taxonomer is less affected than other tools.
- the right-hand portion of the SURPI column records the classification rates when either read from a mate pair was classified correctly; the left-hand portion, records the rates for classifying both mates to the same taxon.
- SURPI underperforms both Taxonomer and Kraken.
- Table 12 Sequence identity of full-length SILVA references used to generate synthetic read sets for FIGS. 2A-D and FIGS. 8-10 compared to the most similar reference sequence in the 'Classifier' database. Synthetic read sets were constructed using 1,013 randomly selected bacterial 16S sequences from the SILVA (release 119) database.
- OTUs operational taxonomic units
- SHs species hypotheses
- the percent identity was used to determine the assignment of the highest taxonomic rank. Sequence reads with >97% identity to a reference were assigned to a species, >90% identity to a genus, and ⁇ 90% to a family when lineage information was available at this rank. For classification by RDP, classifications were resolved as above to the rank with a minimum confidence level of ⁇ 0.5. SURPI was not included in the comparison because there is no option to employ a user-provided database. As shown in FIG. 2C , Taxonomer's performance in classifying the simulated bacterial reads closely approximated that of the RDP Classifier, an established reference tool.
- Taxonomer and RDP classified 59.5% and 61.4% of reads correctly, and recovery rates are very similar. Although Kraken's classification and recovery rates improved dramatically using Taxonomer's database compared to its own, Taxonomer still correctly classified 13.5% more reads compared to Kraken (59.5% vs. 46%) and also had a lower false positive-rate (15.7% vs. 20.1%). Taxonomer also outperformed Kraken on taxon recovery rate (94.9% vs. 83%), and Taxonomer's false-recovery rate was lower as well (23.3% vs. 37.9%).
- FIG. 12 the impact of read length
- sequencing errors upon classification accuracy see FIG. 13 .
- FIG. 12 shows the read-level (top) and taxon-level (bottom) bacterial classification accuracy of BLAST, the RDP Classifier, Kraken, and Taxonomer run using the Greengenes 99% OTU database.
- the reads were either using 100bp single-end ( FIG. 12A ) or (B) 100bp paired-end ( FIG. 12B ) 16S rDNA reads simulated at 5X coverage from 1,013 randomly selected SILVA references with ⁇ 97% sequence identity to reference sequences.
- the performance of Taxonomer was comparable to the RDP Classifier and superior to Kraken, whereas given the applied criteria BLAST was less sensitive but more specific.
- FIG. 12 shows the read-level (top) and taxon-level (bottom) bacterial classification accuracy of BLAST, the RDP Classifier, Kraken, and Taxonomer run using the Greengenes 99% OTU database.
- the reads were either using 100bp single-end ( FIG. 12A ) or (B) 100bp
- FIG. 13 shows family, genus and species level classification accuracy for BLAST, the RDP Classifier, Kraken and Taxonomer using the same read-length and database across error rates of 0.01%, 0.1%, 1%, 5%, and 10%. Performance improved for all tools as a function of read lengths. Taxonomer and Kraken were both more sensitive to sequencing errors than BLAST and the RDP Classifier due to their reliance on exact k-mer matches. Nevertheless, these same analyses demonstrate that Taxonomer's nucleotide classification algorithm is error resistant, with Taxonomer achieving greater classification accuracies than Kraken for sequences with less than 5% errors.
- FIG. 2D shows classification and recovery rates using Taxonomer's fungal database.
- Table 13 Accession numbers for published 16S amplicon data used in for bacterial abundance estimates (FIG. 2E), numbers of reads, and analysis times for the RDP Classifier and Taxonomer. Number of reads for reference (b) is based on mate pairs. Sample Source Ref.
- Ref (a) and Ref (b) refer to the publications from which the data was derived: (Ref (a) was Subramanian, S. et al. Nature 510, 417-421 (2014 ); Ref (b) was Lax, S. et al. Science 345, 1048-1052 (2014 )).
- Taxonomer's bacterial abundance estimates were highly correlated with RDP's across taxonomic levels for all three datasets.
- FIG. 14D show 16S rRNA gene amplicon sequences of variable region 4 from two published data sets generated on HiSeq2000 (dark green, 1x150bp reads) and MiSeq instruments (light green, 2x150 reads).
- the average number of reads per sample was 44,685 and the average processing times (using 1 CPU) were 1:28 minutes for Taxonomer and 7.9 hours for the RDP Classifier.
- Taxonomer described in Example 1 was used to classify reads derived from viral sources.
- RNA-Seq data from 24 samples known to harbor particular respiratory viruses was used.
- the mean pairwise, genome-level sequence identities of the 24 respiratory viruses to reference sequences in the NCBI nt database were 93.7% (range: 75.9-99.8%; see Table 14 and FIG. 8A ).
- the sequencing reads from each sample were binned by Binner, and the 'viral' and 'unclassified' bins (see FIG. 1A and 6C ) were taxonomically classified by Protonomer, RAPSearch2 (default and fast settings), and DIAMOND (default and sensitive settings).
- RAPSearch 2 is employed by SURPI (see Zhao, Y., Tang, H. & Ye, Y. RAPSearch2: a fast and memory-efficient protein similarity search tool for next-generation sequencing data. Bioinformatics 28, 125-126 (2012 ) ) , whereas DIAMOND is an ultrafast, BLAST-like protein search tool (see Buchfink, B., Xie, C. & Huson, D.H. Fast and sensitive protein alignment using DIAMOND. Nature methods (2014 )).
- Protonomer showed a sensitivity of 94.6 ⁇ 2.7%, RAPSearch2 had a sensitivity of 95.0 ⁇ 2.2% in default mode and 94.8 ⁇ 2.2% in fast mode; both were more sensitive than DIAMOND, which had a sensitivity of 90.5 ⁇ 2.7% in default mode and 90.5 ⁇ 2.7% in sensitive mode. Conversely, Protonomer (90.7 ⁇ 17.1%) and DIAMOND (default: 92.0 ⁇ 17.1%, sensitive: 91.9 ⁇ 14.9%) provided significantly higher specificity than RAPSearch2 in default mode (88.0 ⁇ 20.0%).
- DIAMOND does not support joint analysis of paired sequencing reads. In this comparison, the results of the mate pair with the lowest E-value were used rather than reconciling results of read mates, which likely resulted in optimistic performance estimates for DIAMOND. Protonomer is also the fastest of the three tools, classifying 10 4 to 10 6 reads/sample (Protonomer: 14 seconds; DIAMOND: 37 seconds in default and 46 seconds in sensitive mode; RAPSearch2: 343 seconds in default and 169 seconds in rapid modes, FIG. 8 ).
- Taxonomer was further used to analyze published RNA-Seq data from three patients in whom viral pathogens with significance to public health were detected: a serum sample from a patient with hemorrhagic fever caused by a novel rhabdovirus (Bas Congo Virus, FIG. 3D ); a throat swab from a patient with avian influenza (H7N9 subtype, FIG. 3E ), and a plasma sample from a patient with Ebola virus ( FIG. 3F ). Taxonomer detected the relevant viruses in all three cases, even after removal of the target sequence from the reference database, thus demonstrating the utility of Taxonomer for rapid virus detection and discovery in public health emergencies.
- Table 14 Viruses, percent nucleotide-level identity to reference sequences in the NCBI nt database, as well as numbers of total and viral reads for pediatric upper respiratory tract specimens used to compare 'Protonomer', RAPSearch2, and DIAMOND for protein-level classification of viral sequences (see FIGS 3, 8 & 9).
- Example 8 Human mRNA transcript profiling
- Taxonomer described in Example 1 was used to profile a host response, which is of growing interest for infectious diseases testing and for quality-control of cell lines and tissues where microbial contaminants may confound transcript expression profiles. Taxonomer is the only ultrafast metagenomics tool with this capability. Taxonomer's default databases included ERCC control sequences, allowing users to normalize transcript counts. By default these reference transcripts and corresponding gene models (GTF file) from the ENSMBL human reference sequence, GRCh37.75. A k-mer of size of 20 was used, which works well for mapping reads to human transcripts. Table 15.
- Taxonomer's expression profiles were compared to those of standard transcript expression profiling tools Sailfish and Cufflinks, as well as quantitative PCR. Gene-level Pearson and Spearman correlation coefficients for RNA-seq versus qPCR were 0.85 and 0.84 for Taxonomer, 0.87 and 0.86 for Sailfish, and 0.80 and 0.80 for Cufflinks, respectively. These results showed that Taxonomer's quantification of synthetic reads and a commercially available RNA standard (MAQC specifically, human brain tissue samples, see Table 15 ) was accurate over a broad range of transcript abundance. Indeed, accuracy was intermediate between Sailfish's and Cufflink's ( FIG. 4A ).
- transcript GTF Following the benchmarks used for Sailfish we filtered the transcript GTF using the gffread utility with the flags -C -M -E and -T, as well as any transcripts consisting solely of Ns. The GTF was sorted using the FluxSimulator sortGTF command and used to generate the synthetic data for benchmarking.
- Taxonomer described in Example 1 was used to identify infection and contamination in a biological sample.
- Taxonomer was used to analyze RNA-Seq data from the plasma of patients suspected of being infected with Ebola virus, but who had tested negative for Ebola virus ( FIG. 5A ).
- Taxonomer detected HIV, Lassa virus, Enterovirus (typed by Taxonomer as Coxsackievirus), and GB virus C.
- FIG. 16B shows that Taxonomer classified a reported Enterovirus as Enterovirus A in plasma from a patient with suspected Ebola virus disease in Sierra Leone (SRR1564825).
- Mean sequencing depth was 162X covering 96% of the reference sequence (AY421765).
- FIGS. 5A and 16 show that Taxonomer detected Elizabethkingia meningoseptica in sample SAMN03015718 (SRR1564828). The mean coverage of the 16S rRNA gene was 16,162-fold and the consensus sequence shared 99.9% nucleotide sequence identity with the type strain of E . meningoseptica (AJ704540, ATCC 13253).
- C. psittaci is the causative agent of psittacosis, an uncommon zoonotic infection acquired from birds that generally presents with fever, headache, cough and sometimes diarrhea.
- E. meningoseptica is a ubiquitous gram-negative bacterium that characteristically causes meningitis or sepsis in newborns, but can also infect immunocompromized adults.
- Taxonomer was employed to detect viral infection from a respiratory sample of a child with pneumonia. Reads classified as “viral” or “unknown” were assembled using Trinity (see e.g. Grabherr MG, et al. Nat Biotechnol, 2011 May 15; 29(7):644-52 ) into 2,325 contigs (run time 6 seconds). Four of the contigs were identified as unclassified members of the family Anelloviridae ( FIG. 5B ). The consensus genome sequences had 68.5% pairwise identity with TTV-like mini virus isolate LIL-y1 (EF538880.1) and the predicted protein sequences were 44%-60% identical with those of strain LIL-y1. The pie chart and sunburst in FIG. 5B show contig-level classification.
- Protonomer classified 19 of the 239 reads as derived from Anellovirus, whereas Protonomer in combination with Afterburner identified 89 of the 239 reads as derived from Anellovirus. Protonomer did not misclassify any Anellovirus-derived reads, whereas Afterburner misclassified 110 of the Anellovirus-derived reads to other viral taxa.
- FIG. 9A shows that Protonomer (94.6 ⁇ 2.7%) and Afterburner (94.5 ⁇ 2.3%) had comparable sensitivity while their combination was slightly more sensitive (95.0 ⁇ 2.4%).
- FIG. 9B shows, conversely, that Protonomer (91.1 ⁇ 16.8%) was slightly more specific than Afterburner (86.6 ⁇ 21.4%) and a combination of the two tools (86.8 ⁇ 20.7%).
- True viral reads were determined by mapping of all reads to a manually constructed viral consensus genome sequence for each sample.
- FIG. 9C showed the mean analysis times were 14.3 ⁇ 7.5 seconds (Protonomer), 27.4 ⁇ 21.5 seconds (Protomer/Afterburner), and 41.7 ⁇ 28.7 seconds (Afterburner). All tools were run on 16 CPU.
- Taxonomer detected highly similar proportions of viral (influenza A from a nasopharyngeal swab) and bacterial ( Mycoplasma pneumonia from a bronchoalveolar lavage) pathogens in respiratory tract samples subjected to 2 different library preparation methods and 3 different next-generation sequencing platforms (see FIG. 5D and FIG. 20 ). While the same sequencing libraries were analyzed with the MiSeq and HiSeq instruments, separate sequencing libraries were prepared for the Ion Proton instrument. Similar proportions of viral (0.43% to 0.55% of all reads) and bacterial (16S rRNA sequences representing 0.004% to 0.006% of all reads) pathogen sequences were obtained with all experimental conditions. The presence of both pathogens was confirmed by qPCR.
- Taxonomer was used to detect contamination in a cell culture.
- RNA-seq data was analyzed from induced pluripotent stem cell cultures with and without Mycoplasma contamination. Quality control of the RNA-Seq data by Taxonomer immediately highlighted bacterial contamination (pie chart) and identified the organism as M. yeatsii (99.4% sequence identity with the type strain, MYU67946). High expression of rRNA was demonstrated by 32% of RNA-Seq reads mapping to the M. yeatsii 16S rRNA gene (245,000X coverage.
- Example 10 Taxonomic classification in education
- Example 11 Taxonomic classification for consumers
- a consumer can collect sample, either swab from mouth, skin or kitchen sink, seal the sample in a zip bag, mail the sample to a sequencing laboratory, and then analyze the sequencing result online using taxonomic methods and systems described herein, such as Taxonomer as described in Example 1.
- a dentist can obtain a sample using mouth, tooth, or gum swab to test for mouth or tooth microbes.
- Example 12 Taxonomic classification for food safety and authenticity
- Food safety inspectors, food manufacturers, vendors and consumers can check food for contamination by examining microbial content in food, or food authenticity by examining whether food ingredients match the label, using taxonomic methods and systems described herein, such as Taxonomer as described in Example 1.
- taxonomic methods and systems described herein such as Taxonomer as described in Example 1.
- a swab from a food surface or a small piece of the food can be tested.
- Example 14 Taxonomic classification for hospital safety and contamination monitoring
- microbial contamination in hospital equipment, rooms, and patient belongings can be monitored using taxonomic methods and systems described herein, such as Taxonomer as described in Example 1.
- a swab from equipment, belongings, wall or floor surface can be tested for microbial contaminants.
- such microbial contaminants can be multiple-drug resistant strains of microbes.
- Example 15 Taxonomic classification for biological product quality and safety monitoring.
- Inspectors and consumers can monitor microbial contamination in biological products and in biological product manufacturing process using taxonomic methods and systems described herein, such as Taxonomer as described in Example 1.
- biological products can be tested for microbial contamination.
- cell lines or other material used for biological product manufacturing processes can be tested for host gene expression profiling, quality monitoring, and microbial contamination.
- Example 16 Taxonomic classification for animal disease diagnostics and treatment.
- a person involved in animal disease management such as a veterinary practitioner, a farmer, or a pet owner can diagnose or treat an animal using taxonomic methods and systems described herein, such as Taxonomer as described in Example 1.
- taxonomic methods and systems described herein such as Taxonomer as described in Example 1.
- a mouth swab, blood, a nasalpharyngeal swab, urine, stool, or a swab from a wound site can be collected, sequenced, and analyzed using Taxonomer. The results of the analysis can be used by a veterinary medicine practitioner for diagnostics and treatment plan development.
- Example 17 Taxonomic classification for microbial strain profiling
- Taxonomer database can be constructed containing microbial strain information (e.g. a bacterial database constructed from different strain, including multiple-drug resistant strains). For example, whole-genome DNA sequences or sequencing reads from multiple strains of one bacterial species can be used for database construction. In another example, sequences of strains can be from a virus, such as HIV, HCV, HBV, and influenza.
- microbial strain information e.g. a bacterial database constructed from different strain, including multiple-drug resistant strains.
- whole-genome DNA sequences or sequencing reads from multiple strains of one bacterial species can be used for database construction.
- sequences of strains can be from a virus, such as HIV, HCV, HBV, and influenza.
- detecting microbial strain is achieved by calculating the probability that a certain microorganism was in the sample given the probability that one or more of its reference sequences (e.g. 16S, CDSs, etc.) were observed.
- reference sequences e.g. 16S, CDSs, etc.
- K i obs _ err E base ⁇ L K ⁇ NBRS ⁇ reads K nbrs
- ' denotes the number of kmers in the database of reference sequences that differ by a single or more nucleotide from K i .
- L k is the Kmer length.
- E base is the per-base error rate of the sequencing platform; and
- the final value of the recursion gives a conditional probability that Seq j was observed based upon the probability that each of its kmers was observed one or more times in the read dataset: pSeq j ⁇ n i pK i seq j
- this formulation can be extended to a collection of ORFs, or other reference sequences, that may comprise a bacterial stereotype, a viral genome, or a bacterial genome, or specific microorganism reference sequences, as shown in Eq. 6.
- MLST alleles were determined using three methods: (1) de novo assembly (“assembly”) in which reads were assembled using the Velvet assembler after which the best allelic match was determined using BLAST to a database of known MLST alleles; (2) Consensus read mapping (“consensus”) in which reads were mapped to the R6 reference genome using bwa followed by majority rules consensus base calling at the MLST loci and allelic assignment; and (3) kmer-based MLST typing (“MLST” in FIGS. 21A-C ) which catalogues the k-mer content of a read set, determines the probability of their observation and uses a composite likelihood framework to assign the best allele call and composite MLST genotype. Boxplots in FIGS.
- FIG. 21A-C show the number of correctly identified loci using each of the three sequence typing methods and under the 6 different simulated coverage scenarios. The results are stratified by simulated read length with ( FIG. 21A ) 50bp reads, ( FIG. 21B ) 100bp reads and ( FIG. 21C ) 125bp reads.
- K-mer uniqueness is calculated as the fraction of a particular k-mer, ki, in a specific organism compared to the count of ki in the entire database. For example, if ki is found 3 times in a particular organism and ki is counted present 10 times in the database, the uniqueness of ki in the organism would be 3/10 or .3.
- a reference sequence contains three k-mers: k1, k2, and k3. These three k-mers have a relative uniqueness of u1, u2, and u3. These k-mers have binarized coverage of bc1, bc2, and bc3.
- the dot product would then be computed as (u1*bc1 + u2*bc2 + u3*bc3).
- pi the proportion of bases for a single organism's reference sequences that have nonzero coverage compared to the total number of bases in the organism's reference sequences. This information can be summarized using a weighted sum into a single number called the rank metric.
- the rank metric is a condensed summary of how well an organism's reference sequences are represented by the query sequences.
- the weight is a number between 0 and 1, and the sum of all weights, in this example w1+w2, is 1.
- simulation and machine learning methods e.g. random forests, to compute optimal weights with training data sets or on extensive simulations, and discover rank metric cutoffs that allow making informed calls about which organisms' DNA and/or RNA is present or absent in a given set of query sequences.
- the cutoff of positively identifying an organism is a fixed value. In another embodiment, the cutoff of positively identifying an organism varies depending on the rank metric of other organisms presented in the query sequences. Because of homology or sequence similarity between different organisms, a k-mer from the sequence of one organism can match to sequences of other organisms, therefore a set of k-mers from one organism can generate different rank metrics values to a set of different organisms. The cutoff can be defined to be greater than rank metric values of the set of predefined different organisms.
- Example 18 Taxonomic classification for tumor profiling
- Taxonomer as described in Example 1
- DNA sequences of different tumors from different tissues can be used to construct a tumor database, which can then be used in Taxonomer for analyzing sequences obtained from tumor tissues.
- Taxonomer can assign each read to a most likely tumor type using a tumor database so constructed.
- a whole genome assembly or genomic sequence reads can be used for database construction.
- Example 19 Taxonomic classification for forensic profiling
- Taxonomer as described in Example 1
- the taxonomic methods and systems described herein can be used to assign sequencing reads to individual of a population if such database constructed from genomic sequences of individuals from the population.
- the population used to construct a database in some examples, people with criminal records, aliens who enter the United States, or the people living in a country.
- DNA material from a crime scene can be sequenced and analyzed with Taxonomer as described above to determine if a DNA sample derived from an individual is present.
- Example 20 Taxonomic classification for genetic testing
- Taxonomic methods and systems described herein can be used with an artificial k-mer database containing all simulated k-mers with DNA polymorphisms associated with diseases or conditions. Taxonomer can then be used to assign sequencing reads from an individual to particular disease-causing genotypes.
- the DNA being analyzed with Taxonomer can, as an example, be fetal-derived cell-free DNA from a pregnant woman for prenatal screening, or the DNA can be derived from a mouth swab, saliva, or blood from an individual undergoing genetic testing.
- Example 21 Use of k-mer weights or other measure to calculate a pairwise distance between every sequence in a classification database.
- the taxonomic methods and systems described herein can be used to calculate a pairwise distance between every sequence in a classification database.
- a pairwise distance can be used to identify sequences with discordant neighbors, thus identifying misannotated or mislocated sequences within a previously existing taxonomy or classification database.
- the pairwise distances can be used to produce a new phylogenetic tree, having the optimal structure for accurate classification and diagnosis.
- Bootstrap or other node-confidence metrics can be used to collapse polytomies and poorly resolved nodes in a taxonomic tree, for reasons such as speeding classification, improving classification, or improving diagnostic accuracy.
- the abovementioned database can be used to classify reference sequences previously annotated as derived from a common clinical strain, isolate, or otherwise named organism as used in diagnostic parlance. This name can be associated with appropriate leaves and nodes of the database in order to associate the taxonomic associations in the database with commonly used diagnostic names for organisms.
- a similar process can be used to produce a protein database organized by sequence similarity such that the different branches correspond to different types of genes or proteins, such as different functions, GO classifications, gene-families, etc...
- the name of the organism the protein(s) are derived from can be attached to the appropriate leaf and node in the protein taxonomy.
- This approach can be used to distinguish between closely related pathogens, such as E. coli and Shigella or Anthrax and other Bacilli that cannot be distinguished using 16S sequence alone.
- pathogens such as E. coli and Shigella or Anthrax and other Bacilli that cannot be distinguished using 16S sequence alone.
- other proteins and nucleotide sequences can be used to confirm the presence of a particular pathogen, wherein the presence is indicated by a first piece of data, such as the 16S sequence, and reads are also present that are classified as a taxon-specific protein.
- These confirmatory findings can be reported to improve a diagnosis.
- viruses can be classified using the above process to produce a protein database organized upon sequence similarity or pairwise distance such that different branches would correspond to different types of viral genes, such that different branches would correspond to different types of viral genes.
- Non-limiting examples of these genes can be gag, env, or pol.
- the names of the viruses from which these sequences are derived can be attached to the appropriate leaves and nodes of the taxonomic structure.
- the viral database can be used to establish what portion of a viral or viral taxon's genome is present in the query dataset. For example, one could test that HIV was detected in a sample and specifically the sample contain HIV gag and pol sequences, but not HIV env sequences.
Landscapes
- Life Sciences & Earth Sciences (AREA)
- Physics & Mathematics (AREA)
- Engineering & Computer Science (AREA)
- Health & Medical Sciences (AREA)
- Medical Informatics (AREA)
- Theoretical Computer Science (AREA)
- Bioinformatics & Cheminformatics (AREA)
- Biophysics (AREA)
- Spectroscopy & Molecular Physics (AREA)
- General Health & Medical Sciences (AREA)
- Evolutionary Biology (AREA)
- Biotechnology (AREA)
- Bioinformatics & Computational Biology (AREA)
- Data Mining & Analysis (AREA)
- Chemical & Material Sciences (AREA)
- Computer Vision & Pattern Recognition (AREA)
- Public Health (AREA)
- Evolutionary Computation (AREA)
- Epidemiology (AREA)
- Databases & Information Systems (AREA)
- Bioethics (AREA)
- Artificial Intelligence (AREA)
- Analytical Chemistry (AREA)
- Software Systems (AREA)
- Proteomics, Peptides & Aminoacids (AREA)
- Organic Chemistry (AREA)
- Biochemistry (AREA)
- Medicinal Chemistry (AREA)
- Molecular Biology (AREA)
- General Chemical & Material Sciences (AREA)
- Chemical Kinetics & Catalysis (AREA)
- Measuring Or Testing Involving Enzymes Or Micro-Organisms (AREA)
- Structure Of Transmissions (AREA)
Claims (20)
- Verfahren zum Identifizieren eines Taxons oder mehrerer Taxa in einer Probe von einem Probenursprung, wobei der Probenursprung ein Individuum ist, um einen Zustand des Individuums zu identifizieren, wobei der Zustand Lebensmittelverunreinigung, Infektion, allergische Reaktion, Behandlungsreaktion, Krankheitszustand oder Gesundheitszustand ist, wobei das Verfahren Folgendes umfasst:(a) Erhalten, für jedes entsprechende k-mer in einer Vielzahl von k-meren, für jede entsprechende Referenzpolynucleotidsequenz (refi) in einer Vielzahl von Referenzpolynucleotidsequenzen, einer entsprechenden k-mer-Gewichtung für das entsprechende k-mer für die entsprechende Referenzpolynucleotidsequenz, wobei die entsprechende k-mer-Gewichtung für das entsprechende k-mer (Ki) für die entsprechende Referenzpolynucleotidsquenz (refi) berechnet wird als:
 KWrefi die entsprechende k-mer-Gewichtung für das entsprechende k-mer ist,Cref(Ki) eine Zählung einer Anzahl von Auftreten des entsprechenden k-mers (Ki) in der entsprechenden Referenzpolynucleotidsequenz (refi) ist,Cdb(Ki) eine Zählung einer Anzahl von Auftreten des entsprechenden k-mers (Ki) in der Vielzahl von Referenzpolynucleotidsequenzen ist undk-mer-Gesamtzählung eine Anzahl von k-meren von Länge-k-Nucleotiden in der Vielzahl von Referenzpolynucleotidsequenzen ist, wodurch eine Vielzahl von k-mer-Gewichtungen gebildet wird;(b) Bereitstellen einer Vielzahl von Probensequenzierungsauslesungen für eine Vielzahl von Polynucleotiden aus der Probe und für jede entsprechende Probensequenzierungsauslesung:(i) Durchführen eines Sequenzvergleichs zwischen der entsprechenden Probensequenzierungsauslesung und der Vielzahl von Referenzpolynucleotidsequenzen mit einem Computersystem, wobei der Vergleich das Bestimmen, für jede entsprechende Referenzpolynucleotidsequenz in der Vielzahl von Referenzpolynucleotidsequenzen, eines entsprechenden Satzes von k-meren innerhalb der entsprechenden Probensequenzierungsauslesung, die ebenfalls in der entsprechenden Referenzsequenz gefunden werden, umfasst; und(ii) Berechnen einer entsprechenden Wahrscheinlichkeit, dass die entsprechende Probensequenzierungsauslesung einer bestimmten Referenzsequenz aus der Vielzahl von Referenzsequenzen entspricht, wobei die entsprechende Wahrscheinlichkeit auf einer Summe von k-mer-Gewichtungen aus der Vielzahl von k-mer-Gewichtungen für den entsprechenden Satz von k-meren innerhalb der Probensequenzierungsauslesung, die ebenfalls in der bestimmten Referenzsequenz gefunden werden, die einen Schwellenwert überschreitet, basiert, wodurch eine entsprechende Sequenzwahrscheinlichkeit erzeugt wird, dass die entsprechende Probensequenzierungsauslesung mit der bestimmten Referenzsequenz übereinstimmt;(c) Berechnen einer oder mehrerer Bewertungen für die Gegenwart oder Abwesenheit eines Taxons oder mehrerer Taxa in der Probe basierend auf den entsprechenden Sequenzwahrscheinlichkeiten jeder Sequenzierungsauslesung in der Vielzahl von Sequenzierungsauslesungen;(d) Identifizieren des einen Taxons oder der mehreren Taxa basierend auf der einen oder den mehreren Bewertungen als vorhanden oder fehlend; und(e) Identifizieren des Zustands des Individuums basierend auf dem Vergleich der Ergebnisse aus Schritt (d) mit einer oder mehreren Sequenzen einer Biosignatur innerhalb der Vielzahl von Referenzsequenzen.
 - Verfahren nach Anspruch 1, wobei das eine Taxon oder die mehreren Taxa einen ersten Bakterienstamm, der als vorhanden identifiziert wird, und einen zweiten Bakterienstamm, der als fehlend identifiziert wird, basierend auf einem oder mehreren Nucleotidunterschieden in der Sequenz, umfassen.
- Verfahren nach Anspruch 1, wobei die Vielzahl von Referenzsequenzen Sequenzen aus einer Vielzahl von Taxa umfasst und jede Referenzsequenz in der Vielzahl von Referenzsequenzen einer Referenz-k-mer-Gewichtung als Maß dessen zugeordnet ist, wie wahrscheinlich es ist, dass ein k-mer innerhalb der Referenzsequenz von einem Taxon innerhalb der Vielzahl von Taxa stammt.
- Verfahren nach Anspruch 1, wobei die Vielzahl von Referenzsequenzen Referenzsequenzen eines oder mehrerer aus Bakterien, Archaeen, Chromalveolata, Viren, Pilzen, Pflanzen, Fischen, Amphibien, Reptilien, Vögeln, Säugetieren und Menschen umfasst.
- Verfahren nach Anspruch 1, wobei der Schritt des Durchführens des Sequenzvergleichs für alle Sequenzierungsauslesungen parallel durchgeführt wird.
- Verfahren nach Anspruch 1, wobei die Vielzahl von Referenzsequenzen aus Sequenzen von einem Referenzindividuum oder aus einem Referenzprobenursprung besteht.
- Verfahren nach Anspruch 1, wobei die Vielzahl von Referenzsequenzen k-mere umfasst, die eine oder mehrere Mutationen in Bezug auf bekannte Polynucleotidsequenzen aufweisen, sodass eine Vielzahl von Varianten der bekannten Polynucleotidsequenzen in der Vielzahl von Referenzsequenzen repräsentiert wird.
- Verfahren nach Anspruch 6, wobei das Verfahren weiters das Identifizieren der Polynucleotide aus dem Probenursprung als von dem Referenzindividuum oder dem Referenzprobenursprung abgeleitet umfasst.
- Verfahren nach Anspruch 1, wobei die Vielzahl von Referenzsequenzen Markergensequenzen zur taxonomischen Klassifikation von Bakteriensequenzen, Sequenzen von menschlichen Transkripten, Sequenzen, die dem Zustand zugeordnet sind, oder eine Kombination daraus umfasst.
- Verfahren nach Anspruch 1, wobei der Zustand eine Lebensmittelverunreinigung ist.
- Verfahren nach Anspruch 1, wobei der Zustand eine Infektion ist.
- Verfahren nach Anspruch 11, wobei die Infektion Influenza ist und die Biosignatur aus Sequenzen von einer oder mehreren aus IFIT1, IFI6, IFIT2, ISG15, OASL, IFIT3, NT5C3A, MX2, IFITM1, CXCL10, IFI44L, MX1, IFIH1, OAS2, SAMD9, RSAD2, DDX58 besteht.
- Verfahren nach Anspruch 11, wobei die Biosignatur (i) Sequenzen von Wirtstranskripten oder Mengen von Sequenzen von Wirtstranskripten; und/oder (ii) Sequenzen von einem oder mehreren infektiösen Mitteln umfasst.
- Verfahren nach Anspruch 1, wobei die Vielzahl von Referenzsequenzen Polynucleotidsequenzen umfasst, die aus Aminosäuresequenzen reverstranskribiert wurden.
- Verfahren nach Anspruch 13, wobei eine Sequenzierungsauslesung in eine Aminosäuresequenz translatiert wird und dann unter Verwendung des nichtdegenerierten Codes vor dem Vergleich mit den reverstranslatierten Referenzsequenzen reverstranslatiert wird.
- Verfahren nach Anspruch 1, das weiters das Überwachen der Behandlung in dem Individuum durch Identifizieren der Gegenwart oder Abwesenheit der Biosignatur in Proben von dem Individuum zu mehreren Zeitpunkten nach Behandlungsbeginn umfasst.
- Verfahren nach Anspruch 16, das weiters das Ändern der Behandlung des infizierten Individuums basierend auf den Ergebnissen der Überwachung umfasst.
- Verfahren nach Anspruch 1, das weiters das Auswählen einer medizinischen Handlung basierend auf den Ergebnissen aus Schritt (d) und gegebenenfalls das Durchführen der medizinischen Handlung umfasst.
- Verfahren nach Anspruch 18, wobei die medizinische Handlung durchgeführt wird und das Verabreichen einer pharmazeutischen Zusammensetzung umfasst.
- Verfahren nach Anspruch 19, wobei die pharmazeutische Zusammensetzung ein Antibiotikum umfasst.
Applications Claiming Priority (2)
| Application Number | Priority Date | Filing Date | Title |
|---|---|---|---|
| US201562152782P | 2015-04-24 | 2015-04-24 | |
| PCT/US2016/029067 WO2016172643A2 (en) | 2015-04-24 | 2016-04-22 | Methods and systems for multiple taxonomic classification |
Publications (4)
| Publication Number | Publication Date |
|---|---|
| EP3286359A2 EP3286359A2 (de) | 2018-02-28 |
| EP3286359A4 EP3286359A4 (de) | 2018-12-26 |
| EP3286359C0 EP3286359C0 (de) | 2025-06-18 |
| EP3286359B1 true EP3286359B1 (de) | 2025-06-18 |
Family
ID=57143592
Family Applications (1)
| Application Number | Title | Priority Date | Filing Date |
|---|---|---|---|
| EP16784041.2A Active EP3286359B1 (de) | 2015-04-24 | 2016-04-22 | Verfahren und systeme zur mehrfachen taxonomischen klassifizierung |
Country Status (8)
| Country | Link |
|---|---|
| US (2) | US11335436B2 (de) |
| EP (1) | EP3286359B1 (de) |
| CN (2) | CN107532332B9 (de) |
| AU (2) | AU2016253004B2 (de) |
| CA (1) | CA2977548A1 (de) |
| IL (2) | IL281001B (de) |
| WO (1) | WO2016172643A2 (de) |
| ZA (1) | ZA201707500B (de) |
Families Citing this family (68)
| Publication number | Priority date | Publication date | Assignee | Title |
|---|---|---|---|---|
| US10325685B2 (en) | 2014-10-21 | 2019-06-18 | uBiome, Inc. | Method and system for characterizing diet-related conditions |
| US10169541B2 (en) | 2014-10-21 | 2019-01-01 | uBiome, Inc. | Method and systems for characterizing skin related conditions |
| US10265009B2 (en) | 2014-10-21 | 2019-04-23 | uBiome, Inc. | Method and system for microbiome-derived diagnostics and therapeutics for conditions associated with microbiome taxonomic features |
| US10311973B2 (en) | 2014-10-21 | 2019-06-04 | uBiome, Inc. | Method and system for microbiome-derived diagnostics and therapeutics for autoimmune system conditions |
| US10366793B2 (en) | 2014-10-21 | 2019-07-30 | uBiome, Inc. | Method and system for characterizing microorganism-related conditions |
| US10395777B2 (en) | 2014-10-21 | 2019-08-27 | uBiome, Inc. | Method and system for characterizing microorganism-associated sleep-related conditions |
| AU2015335907A1 (en) | 2014-10-21 | 2017-04-13 | Psomagen, Inc. | Method and system for microbiome-derived diagnostics and therapeutics |
| US10073952B2 (en) | 2014-10-21 | 2018-09-11 | uBiome, Inc. | Method and system for microbiome-derived diagnostics and therapeutics for autoimmune system conditions |
| US10777320B2 (en) | 2014-10-21 | 2020-09-15 | Psomagen, Inc. | Method and system for microbiome-derived diagnostics and therapeutics for mental health associated conditions |
| US10357157B2 (en) | 2014-10-21 | 2019-07-23 | uBiome, Inc. | Method and system for microbiome-derived characterization, diagnostics and therapeutics for conditions associated with functional features |
| US9710606B2 (en) | 2014-10-21 | 2017-07-18 | uBiome, Inc. | Method and system for microbiome-derived diagnostics and therapeutics for neurological health issues |
| US10246753B2 (en) | 2015-04-13 | 2019-04-02 | uBiome, Inc. | Method and system for characterizing mouth-associated conditions |
| EP3286359B1 (de) | 2015-04-24 | 2025-06-18 | University of Utah Research Foundation | Verfahren und systeme zur mehrfachen taxonomischen klassifizierung |
| US11514289B1 (en) | 2016-03-09 | 2022-11-29 | Freenome Holdings, Inc. | Generating machine learning models using genetic data |
| US10824951B2 (en) * | 2016-03-14 | 2020-11-03 | Huawei Technologies Co., Ltd. | System and method for rule generation using data processed by a binary classifier |
| KR102194798B1 (ko) * | 2016-12-20 | 2020-12-23 | 주식회사 천랩 | 16S rRNA 서열 기반 세균 동정 및 관리 장치, 그리고 이의 동작 방법 |
| WO2018119882A1 (zh) * | 2016-12-29 | 2018-07-05 | 中国科学院深圳先进技术研究院 | 一种宏基因组数据分类方法和装置 |
| CN106951733B (zh) * | 2017-02-21 | 2019-03-26 | 苏州普瑞森基因科技有限公司 | 一种优化的16S rDNA高通量测序物种比对方法 |
| WO2018160899A1 (en) * | 2017-03-01 | 2018-09-07 | Bluedot Llc | Systems and methods for metagenomic analysis |
| US11996170B2 (en) * | 2017-07-28 | 2024-05-28 | Tata Consultancy Services Limited | Method and system for identification and classification of operational taxonomic units in a metagenomic sample |
| US20190172553A1 (en) * | 2017-11-08 | 2019-06-06 | Koninklijke Philips N.V. | Using k-mers for rapid quality control of sequencing data without alignment |
| DE112018006190T5 (de) * | 2017-12-04 | 2020-08-20 | Nantomics, Llc | Subtypisierung von tnbc und methoden |
| CN110046333B (zh) * | 2018-01-16 | 2023-03-21 | 阿里巴巴集团控股有限公司 | 信息展示方法、数据处理方法、设备及系统 |
| CN108415773B (zh) * | 2018-02-27 | 2021-08-31 | 天津大学 | 一种基于融合算法的高效软硬件划分方法 |
| US12410425B2 (en) * | 2018-03-08 | 2025-09-09 | Cornell University | Highly multiplexed phylogenetic imaging of microbial communities |
| CN110021365B (zh) * | 2018-06-22 | 2021-01-22 | 深圳市达仁基因科技有限公司 | 确定检测靶点的方法、装置、计算机设备和存储介质 |
| CN109949866B (zh) * | 2018-06-22 | 2021-02-02 | 深圳市达仁基因科技有限公司 | 病原体操作组的检测方法、装置、计算机设备和存储介质 |
| US10839937B1 (en) * | 2018-07-19 | 2020-11-17 | X Development Llc | Whole cell circular delta viewer and navigator |
| EP3844298A4 (de) * | 2018-08-27 | 2022-05-18 | Idbydna Inc. | Verfahren und systeme zur bereitstellung von probenformationen |
| WO2020050627A1 (ko) * | 2018-09-05 | 2020-03-12 | 주식회사 천랩 | 시료 미생물의 동정 및 분류 방법 |
| WO2020068881A1 (en) * | 2018-09-24 | 2020-04-02 | Second Genome, Inc. | Compositions, systems, apparatuses, and methods for validation of microbiome sequence processing and differential abundance analyses via multiple bespoke spike-in mixtures |
| CN109658981B (zh) * | 2018-12-10 | 2022-10-04 | 海南大学 | 一种单细胞测序的数据分类方法 |
| US20200202975A1 (en) * | 2018-12-19 | 2020-06-25 | AiOnco, Inc. | Genetic information processing system with mutation analysis mechanism and method of operation thereof |
| CN110162916B (zh) * | 2019-05-31 | 2023-04-25 | 太原理工大学 | 一种评估山火熏烧后架空钢芯铝绞线承载能力的方法 |
| GB201914064D0 (en) * | 2019-09-30 | 2019-11-13 | Longas Tech Pty Ltd | Method for determining a measure correlated to the probability that two mutated sequence reads derive from the same sequence comprising mutations |
| EP4041918B1 (de) * | 2019-10-11 | 2025-12-10 | Life Technologies Corporation | Verfahren und systeme zur bewertung der mikrobiellen bevölkerungen |
| CN110846424B (zh) * | 2019-11-05 | 2020-11-20 | 烟台大学 | 出入境口岸微生物的快速检验检疫方法 |
| US11809498B2 (en) | 2019-11-07 | 2023-11-07 | International Business Machines Corporation | Optimizing k-mer databases by k-mer subtraction |
| US20230038963A1 (en) * | 2019-12-12 | 2023-02-09 | Yale University | Computer-implemented methods of identifying mold growth |
| US20230056396A1 (en) * | 2020-01-17 | 2023-02-23 | Asklepios Biopharmaceutical, Inc. | Systems and methods for synthetic regulatory sequence design or production |
| WO2021168143A1 (en) * | 2020-02-18 | 2021-08-26 | Tempus Labs, Inc. | Systems and methods for detecting viral dna from sequencing |
| CN111621583B (zh) * | 2020-07-30 | 2020-11-06 | 首都医科大学附属北京友谊医院 | 一种利什曼原虫的种群分型和基因溯源的方法 |
| CN111951892B (zh) * | 2020-08-04 | 2024-06-18 | 荣联科技集团股份有限公司 | 一种基于单细胞测序数据分析细胞轨迹的方法及电子设备 |
| US11781190B2 (en) | 2020-08-06 | 2023-10-10 | International Business Machines Corporation | Discovery of biological signatures of optimized sensitivity and specificity |
| CN112029879A (zh) * | 2020-09-14 | 2020-12-04 | 壹宏(深圳)基因有限公司 | 一种肠道嗜酸乳杆菌的检测方法和试剂 |
| KR20230132768A (ko) * | 2020-11-16 | 2023-09-18 | 마이크로노마, 인크. | 비인간 메타게놈 경로 분석에 의한 암 진단 및 분류 |
| US20220156632A1 (en) * | 2020-11-19 | 2022-05-19 | International Business Machines Corporation | Identifying genetic sequence expression profiles according to classification feature sets |
| CN113096740B (zh) * | 2020-12-21 | 2024-08-27 | 北京诺赛基因组研究中心有限公司 | 使用机器学习对核酸序列进行分类的方法 |
| CN112599196B (zh) * | 2020-12-21 | 2021-11-05 | 北京诺赛基因组研究中心有限公司 | 构建对核酸序列进行分类的模型方法及其应用 |
| CN112863601B (zh) * | 2021-01-15 | 2023-03-10 | 广州微远基因科技有限公司 | 病原微生物耐药基因归属模型及其建立方法和应用 |
| CN112687344B (zh) * | 2021-01-21 | 2021-09-10 | 予果生物科技(北京)有限公司 | 一种基于宏基因组的人腺病毒分子分型和溯源方法及系统 |
| EP4281582A4 (de) * | 2021-01-22 | 2024-12-25 | Illumina, Inc. | Verfahren und systeme zur metagenomikanalyse |
| WO2022170124A1 (en) * | 2021-02-04 | 2022-08-11 | Idbydna Inc. | Systems and methods for analysis of samples |
| US20230352117A1 (en) * | 2021-02-23 | 2023-11-02 | Idbydna Inc. | Systems and methods for analysis of presence of microorganisms |
| KR20230152058A (ko) * | 2021-02-26 | 2023-11-02 | 컨타미네이션 소스 아이덴티피케이션 엘엘씨. | 미생물 유전 분석을 위한 생물정보학 파이프라인 및 주석 처리 시스템 |
| US20240266072A1 (en) * | 2021-05-21 | 2024-08-08 | Battelle Memorial Institute | System and method for genomic analysis of pathogens |
| CN113201599B (zh) * | 2021-06-03 | 2023-03-31 | 北京大学人民医院 | 一种基于PCR和nanopore测序检测脑脊液感染哪些病原体的方法 |
| WO2023131795A1 (en) * | 2022-01-07 | 2023-07-13 | Earlham enterprises Ltd | Method and apparatus for detecting pathogens |
| US20240087683A1 (en) * | 2022-09-14 | 2024-03-14 | Microsoft Technology Licensing, Llc | Classification using a machine learning model trained with triplet loss |
| WO2024096149A1 (ko) * | 2022-11-01 | 2024-05-10 | 엘지전자 주식회사 | 차세대 시퀀싱 방법을 이용한 미생물 분석 시스템 및 미생물 분석 방법 |
| WO2024101492A1 (ko) * | 2022-11-11 | 2024-05-16 | 엘지전자 주식회사 | 차세대 시퀀싱 방법을 이용한 미생물 분석 시스템 및 미생물 분석 방법 |
| WO2024158685A1 (en) * | 2023-01-23 | 2024-08-02 | Illumina, Inc. | Inferring microorganism of origin for antimicrobial resistance markers in targeted metagenomics |
| CN119452418A (zh) | 2023-05-15 | 2025-02-14 | 因美纳有限公司 | 基于机器学习预测样本中的生物组分 |
| EP4471784A1 (de) * | 2023-05-31 | 2024-12-04 | Biomérieux | Verfahren und system zur probabilistischen typisierung mikrobieller stämme |
| EP4471785A1 (de) * | 2023-05-31 | 2024-12-04 | Biomérieux | Verfahren und system zur probabilistischen typisierung mikrobieller stämme |
| WO2024249933A1 (en) * | 2023-06-01 | 2024-12-05 | The Regents Of The University Of California | Identification of marker sequences for rapid classification of microbial pathogens through machine learning analysis of genome assemblies |
| WO2025024534A1 (en) * | 2023-07-26 | 2025-01-30 | Regents Of The University Of Michigan | Improving phylogenetic placement using taxonomy-independent feature generation |
| CN118866166B (zh) * | 2024-09-29 | 2025-01-07 | 厦门大学 | 基于二维分子图的分子类药性无监督预测方法及装置 |
Family Cites Families (13)
| Publication number | Priority date | Publication date | Assignee | Title |
|---|---|---|---|---|
| KR20010022917A (ko) * | 1997-08-15 | 2001-03-26 | 구루버 루이스 | 핵산 종을 감지하고 이를 정량화하는 방법 및 그 조성물 |
| US8262900B2 (en) | 2006-12-14 | 2012-09-11 | Life Technologies Corporation | Methods and apparatus for measuring analytes using large scale FET arrays |
| US9434997B2 (en) * | 2007-08-24 | 2016-09-06 | Lawrence Livermore National Security, Llc | Methods, compounds and systems for detecting a microorganism in a sample |
| US8478544B2 (en) * | 2007-11-21 | 2013-07-02 | Cosmosid Inc. | Direct identification and measurement of relative populations of microorganisms with direct DNA sequencing and probabilistic methods |
| TWI460602B (zh) | 2008-05-16 | 2014-11-11 | Counsyl Inc | 廣用的懷孕前篩檢裝置 |
| WO2011008349A2 (en) * | 2009-05-26 | 2011-01-20 | Duke University | Methods of identifying infectious disease and assays for identifying infectious disease |
| US9165109B2 (en) * | 2010-02-24 | 2015-10-20 | Pacific Biosciences Of California, Inc. | Sequence assembly and consensus sequence determination |
| EP3663412B1 (de) * | 2011-09-23 | 2022-03-09 | Oxford Nanopore Technologies PLC | Analyse eines polymers mit polymereinheiten durch translokation durch eine nanopore |
| AU2013292610B2 (en) | 2012-07-17 | 2018-05-17 | Myriad Women's Health, Inc. | System and methods for detecting genetic variation |
| US20140129152A1 (en) * | 2012-08-29 | 2014-05-08 | Michael Beer | Methods, Systems and Devices Comprising Support Vector Machine for Regulatory Sequence Features |
| US20150294065A1 (en) * | 2012-10-15 | 2015-10-15 | Technical University Of Denmark | Database-Driven Primary Analysis of Raw Sequencing Data |
| US20140288844A1 (en) * | 2013-03-15 | 2014-09-25 | Cosmosid Inc. | Characterization of biological material in a sample or isolate using unassembled sequence information, probabilistic methods and trait-specific database catalogs |
| EP3286359B1 (de) | 2015-04-24 | 2025-06-18 | University of Utah Research Foundation | Verfahren und systeme zur mehrfachen taxonomischen klassifizierung |
-
2016
- 2016-04-22 EP EP16784041.2A patent/EP3286359B1/de active Active
- 2016-04-22 CN CN201680023810.6A patent/CN107532332B9/zh active Active
- 2016-04-22 WO PCT/US2016/029067 patent/WO2016172643A2/en not_active Ceased
- 2016-04-22 AU AU2016253004A patent/AU2016253004B2/en active Active
- 2016-04-22 IL IL281001A patent/IL281001B/en unknown
- 2016-04-22 CA CA2977548A patent/CA2977548A1/en active Pending
- 2016-04-22 CN CN202210580317.1A patent/CN115206436A/zh active Pending
-
2017
- 2017-08-22 IL IL254094A patent/IL254094B/en active IP Right Grant
- 2017-10-04 US US15/724,476 patent/US11335436B2/en active Active
- 2017-11-06 ZA ZA2017/07500A patent/ZA201707500B/en unknown
-
2022
- 2022-04-19 US US17/724,296 patent/US20230055403A1/en active Pending
-
2023
- 2023-01-05 AU AU2023200050A patent/AU2023200050B2/en active Active
Also Published As
| Publication number | Publication date |
|---|---|
| US20230055403A1 (en) | 2023-02-23 |
| WO2016172643A3 (en) | 2017-02-09 |
| US20180365375A1 (en) | 2018-12-20 |
| AU2016253004A1 (en) | 2017-09-07 |
| CN107532332B (zh) | 2022-04-19 |
| AU2023200050B2 (en) | 2024-10-24 |
| EP3286359A4 (de) | 2018-12-26 |
| CA2977548A1 (en) | 2016-10-27 |
| CN107532332A (zh) | 2018-01-02 |
| CN107532332B9 (zh) | 2022-07-08 |
| ZA201707500B (en) | 2023-10-25 |
| IL254094B (en) | 2021-03-25 |
| CN115206436A (zh) | 2022-10-18 |
| EP3286359C0 (de) | 2025-06-18 |
| IL254094A0 (en) | 2017-10-31 |
| EP3286359A2 (de) | 2018-02-28 |
| AU2023200050A1 (en) | 2023-02-09 |
| IL281001B (en) | 2022-07-01 |
| AU2016253004B2 (en) | 2022-10-06 |
| US11335436B2 (en) | 2022-05-17 |
| WO2016172643A2 (en) | 2016-10-27 |
| IL281001A (en) | 2021-04-29 |
Similar Documents
| Publication | Publication Date | Title |
|---|---|---|
| AU2023200050B2 (en) | Methods and systems for multiple taxonomic classification | |
| Gruber-Vodicka et al. | phyloFlash: rapid small-subunit rRNA profiling and targeted assembly from metagenomes | |
| Nafea et al. | Application of next-generation sequencing to identify different pathogens | |
| Pinto et al. | Sequencing-based analysis of microbiomes | |
| Pillay et al. | Whole genome sequencing of SARS-CoV-2: adapting Illumina protocols for quick and accurate outbreak investigation during a pandemic | |
| US20240265999A1 (en) | Methods and systems for metagenomics analysis | |
| Ibanez-Lligona et al. | Bioinformatic tools for NGS-based metagenomics to improve the clinical diagnosis of emerging, re-emerging and new viruses | |
| Simmonds et al. | CZ ID: a cloud-based, no-code platform enabling advanced long read metagenomic analysis | |
| Kiguchi et al. | Long-read metagenomics of multiple displacement amplified DNA of low-biomass human gut phageomes by SACRA pre-processing chimeric reads | |
| Maggi et al. | Long-range PCR-based NGS applications to diagnose mendelian retinal diseases | |
| Van Poelvoorde et al. | Whole-genome-based phylogenomic analysis of the Belgian 2016–2017 influenza A (H3N2) outbreak season allows improved surveillance | |
| Cheng et al. | Deep longitudinal lower respiratory tract microbiome profiling reveals genome-resolved functional and evolutionary dynamics in critical illness | |
| Larsen et al. | Ancient DNA provides evidence of 27,000-year-old papillomavirus infection and long-term codivergence with rodents | |
| Marinova-Bulgaranova et al. | Current Methods for Reliable Identification of Species in the Acinetobacter calcoaceticus–Acinetobacter baumannii Complex | |
| Ndiaye et al. | Phage diversity mirrors bacterial strain diversity in the honey bee gut microbiota | |
| Kuang et al. | Infectome analysis of bat kidneys from Yunnan province, China, reveals novel henipaviruses related to Hendra and Nipah viruses and prevalent bacterial and eukaryotic microbes | |
| Higuera et al. | Development of a multilocus sequence typing scheme for Giardia intestinalis | |
| HK40082323A (en) | Methods and systems for multiple taxonomic classification | |
| Afolayan et al. | Assessing the performance of current strain resolution tools on long-read metagenomes | |
| US20240254570A1 (en) | Inferring microorganism of origin for antimicrobial resistance markers in targeted metagenomics | |
| Hunter et al. | Nanopore sequencing from protozoa to phages: decoding biological information on a string of biochemical molecules into human-readable signals | |
| HK40101478A (zh) | 用於宏基因组学分析的方法和系统 | |
| Kardailsky | Biomonitoring of freshwater streams: the promising application of Environmental DNA and Cas enrichment | |
| Zhao et al. | Evolutionary and Modification Features of Two Monkeypox Virus Strains: Insights from Integrated Genomic and Epigenomic Analyses | |
| Ferdous | Optimization and Validation of Sars-CoV-2 Sequencing |
Legal Events
| Date | Code | Title | Description |
|---|---|---|---|
| STAA | Information on the status of an ep patent application or granted ep patent |
Free format text: STATUS: THE INTERNATIONAL PUBLICATION HAS BEEN MADE |
|
| PUAI | Public reference made under article 153(3) epc to a published international application that has entered the european phase |
Free format text: ORIGINAL CODE: 0009012 |
|
| STAA | Information on the status of an ep patent application or granted ep patent |
Free format text: STATUS: REQUEST FOR EXAMINATION WAS MADE |
|
| 17P | Request for examination filed |
Effective date: 20170825 |
|
| AK | Designated contracting states |
Kind code of ref document: A2 Designated state(s): AL AT BE BG CH CY CZ DE DK EE ES FI FR GB GR HR HU IE IS IT LI LT LU LV MC MK MT NL NO PL PT RO RS SE SI SK SM TR |
|
| AX | Request for extension of the european patent |
Extension state: BA ME |
|
| RIN1 | Information on inventor provided before grant (corrected) |
Inventor name: SCHLABERG, ROBERT Inventor name: QIAO, YI Inventor name: SIMMON, KEITH Inventor name: MARTH, GABOR Inventor name: YANDELL, MARK Inventor name: FLYGARE, STEVEN Inventor name: EILBECK, KAREN Inventor name: MILLER, CHASE Inventor name: OSBORNE, EDWARD, J. |
|
| DAV | Request for validation of the european patent (deleted) | ||
| DAX | Request for extension of the european patent (deleted) | ||
| A4 | Supplementary search report drawn up and despatched |
Effective date: 20181122 |
|
| RIC1 | Information provided on ipc code assigned before grant |
Ipc: C40B 20/00 20060101AFI20181116BHEP Ipc: C40B 30/02 20060101ALI20181116BHEP Ipc: G06F 19/22 20110101ALI20181116BHEP |
|
| STAA | Information on the status of an ep patent application or granted ep patent |
Free format text: STATUS: EXAMINATION IS IN PROGRESS |
|
| 17Q | First examination report despatched |
Effective date: 20210923 |
|
| P01 | Opt-out of the competence of the unified patent court (upc) registered |
Effective date: 20230529 |
|
| RIN1 | Information on inventor provided before grant (corrected) |
Inventor name: SCHLABERG, ROBERT Inventor name: YANDELL, MARK Inventor name: MARTH, GABOR Inventor name: EILBECK, KAREN Inventor name: QIAO, YI Inventor name: MILLER, CHASE Inventor name: SIMMON, KEITH Inventor name: FLYGARE, STEVEN |
|
| REG | Reference to a national code |
Ref country code: DE Ref legal event code: R079 Free format text: PREVIOUS MAIN CLASS: C40B0020000000 Ipc: G16B0040000000 Ref country code: DE Ref legal event code: R079 Ref document number: 602016092595 Country of ref document: DE Free format text: PREVIOUS MAIN CLASS: C40B0020000000 Ipc: G16B0040000000 |
|
| GRAP | Despatch of communication of intention to grant a patent |
Free format text: ORIGINAL CODE: EPIDOSNIGR1 |
|
| STAA | Information on the status of an ep patent application or granted ep patent |
Free format text: STATUS: GRANT OF PATENT IS INTENDED |
|
| RIC1 | Information provided on ipc code assigned before grant |
Ipc: G16B 40/00 20190101AFI20241220BHEP |
|
| INTG | Intention to grant announced |
Effective date: 20250114 |
|
| GRAS | Grant fee paid |
Free format text: ORIGINAL CODE: EPIDOSNIGR3 |
|
| GRAA | (expected) grant |
Free format text: ORIGINAL CODE: 0009210 |
|
| STAA | Information on the status of an ep patent application or granted ep patent |
Free format text: STATUS: THE PATENT HAS BEEN GRANTED |
|
| AK | Designated contracting states |
Kind code of ref document: B1 Designated state(s): AL AT BE BG CH CY CZ DE DK EE ES FI FR GB GR HR HU IE IS IT LI LT LU LV MC MK MT NL NO PL PT RO RS SE SI SK SM TR |
|
| REG | Reference to a national code |
Ref country code: GB Ref legal event code: FG4D |
|
| REG | Reference to a national code |
Ref country code: CH Ref legal event code: EP |
|
| REG | Reference to a national code |
Ref country code: DE Ref legal event code: R096 Ref document number: 602016092595 Country of ref document: DE |
|
| REG | Reference to a national code |
Ref country code: CH Ref legal event code: EP |
|
| REG | Reference to a national code |
Ref country code: IE Ref legal event code: FG4D |
|
| U01 | Request for unitary effect filed |
Effective date: 20250717 |
|
| U07 | Unitary effect registered |
Designated state(s): AT BE BG DE DK EE FI FR IT LT LU LV MT NL PT RO SE SI Effective date: 20250723 |
|
| PG25 | Lapsed in a contracting state [announced via postgrant information from national office to epo] |
Ref country code: GR Free format text: LAPSE BECAUSE OF FAILURE TO SUBMIT A TRANSLATION OF THE DESCRIPTION OR TO PAY THE FEE WITHIN THE PRESCRIBED TIME-LIMIT Effective date: 20250919 Ref country code: NO Free format text: LAPSE BECAUSE OF FAILURE TO SUBMIT A TRANSLATION OF THE DESCRIPTION OR TO PAY THE FEE WITHIN THE PRESCRIBED TIME-LIMIT Effective date: 20250918 |
|
| PG25 | Lapsed in a contracting state [announced via postgrant information from national office to epo] |
Ref country code: HR Free format text: LAPSE BECAUSE OF FAILURE TO SUBMIT A TRANSLATION OF THE DESCRIPTION OR TO PAY THE FEE WITHIN THE PRESCRIBED TIME-LIMIT Effective date: 20250618 |
|
| PG25 | Lapsed in a contracting state [announced via postgrant information from national office to epo] |
Ref country code: RS Free format text: LAPSE BECAUSE OF FAILURE TO SUBMIT A TRANSLATION OF THE DESCRIPTION OR TO PAY THE FEE WITHIN THE PRESCRIBED TIME-LIMIT Effective date: 20250918 |
|
| PG25 | Lapsed in a contracting state [announced via postgrant information from national office to epo] |
Ref country code: IS Free format text: LAPSE BECAUSE OF FAILURE TO SUBMIT A TRANSLATION OF THE DESCRIPTION OR TO PAY THE FEE WITHIN THE PRESCRIBED TIME-LIMIT Effective date: 20251018 |
|
| PG25 | Lapsed in a contracting state [announced via postgrant information from national office to epo] |
Ref country code: SM Free format text: LAPSE BECAUSE OF FAILURE TO SUBMIT A TRANSLATION OF THE DESCRIPTION OR TO PAY THE FEE WITHIN THE PRESCRIBED TIME-LIMIT Effective date: 20250618 |
|
| PG25 | Lapsed in a contracting state [announced via postgrant information from national office to epo] |
Ref country code: CZ Free format text: LAPSE BECAUSE OF FAILURE TO SUBMIT A TRANSLATION OF THE DESCRIPTION OR TO PAY THE FEE WITHIN THE PRESCRIBED TIME-LIMIT Effective date: 20250618 |
|
| PG25 | Lapsed in a contracting state [announced via postgrant information from national office to epo] |
Ref country code: PL Free format text: LAPSE BECAUSE OF FAILURE TO SUBMIT A TRANSLATION OF THE DESCRIPTION OR TO PAY THE FEE WITHIN THE PRESCRIBED TIME-LIMIT Effective date: 20250618 |
|
| PG25 | Lapsed in a contracting state [announced via postgrant information from national office to epo] |
Ref country code: SK Free format text: LAPSE BECAUSE OF FAILURE TO SUBMIT A TRANSLATION OF THE DESCRIPTION OR TO PAY THE FEE WITHIN THE PRESCRIBED TIME-LIMIT Effective date: 20250618 |
|
| PG25 | Lapsed in a contracting state [announced via postgrant information from national office to epo] |
Ref country code: ES Free format text: LAPSE BECAUSE OF FAILURE TO SUBMIT A TRANSLATION OF THE DESCRIPTION OR TO PAY THE FEE WITHIN THE PRESCRIBED TIME-LIMIT Effective date: 20250618 |
|
| PGFP | Annual fee paid to national office [announced via postgrant information from national office to epo] |
Ref country code: GB Payment date: 20260320 Year of fee payment: 11 |
|
| PLBE | No opposition filed within time limit |
Free format text: ORIGINAL CODE: 0009261 |
|
| STAA | Information on the status of an ep patent application or granted ep patent |
Free format text: STATUS: NO OPPOSITION FILED WITHIN TIME LIMIT |