EP2738701A2 - Verfahren und Vorrichtung zur statistischen Simulation einer elektronischen Schaltung - Google Patents
Verfahren und Vorrichtung zur statistischen Simulation einer elektronischen Schaltung Download PDFInfo
- Publication number
- EP2738701A2 EP2738701A2 EP13195312.7A EP13195312A EP2738701A2 EP 2738701 A2 EP2738701 A2 EP 2738701A2 EP 13195312 A EP13195312 A EP 13195312A EP 2738701 A2 EP2738701 A2 EP 2738701A2
- Authority
- EP
- European Patent Office
- Prior art keywords
- raw data
- mathematical model
- dependent variables
- analysis
- data
- Prior art date
- Legal status (The legal status is an assumption and is not a legal conclusion. Google has not performed a legal analysis and makes no representation as to the accuracy of the status listed.)
- Withdrawn
Links
Images



Classifications
-
- G—PHYSICS
- G06—COMPUTING OR CALCULATING; COUNTING
- G06F—ELECTRIC DIGITAL DATA PROCESSING
- G06F30/00—Computer-aided design [CAD]
- G06F30/30—Circuit design
- G06F30/36—Circuit design at the analogue level
- G06F30/367—Design verification, e.g. using simulation, simulation program with integrated circuit emphasis [SPICE], direct methods or relaxation methods
-
- G—PHYSICS
- G06—COMPUTING OR CALCULATING; COUNTING
- G06F—ELECTRIC DIGITAL DATA PROCESSING
- G06F30/00—Computer-aided design [CAD]
-
- G—PHYSICS
- G06—COMPUTING OR CALCULATING; COUNTING
- G06F—ELECTRIC DIGITAL DATA PROCESSING
- G06F2111/00—Details relating to CAD techniques
- G06F2111/08—Probabilistic or stochastic CAD
Definitions
- the present invention relates generally to a method and apparatus for the analysis of an electronic circuit.
- a modem automotive vehicle contains many electronic circuits which control the overall operation of the vehicle. These electronic circuits must be tested under a variety of different operating conditions and variations of the electronic circuits. For example, most components in an electronic circuit have a known manufacturing tolerance or known variance in the value of the component. For complete testing of such circuits, it is necessary to accommodate and, if necessary, correct for variations in the values of the electronic components which form the circuit.
- the raw data Since the raw data is obtained by humans and test measurement, the raw data almost invariably will contain some errors caused by human errors in the testing procedure. Consequently, the raw data is often preprocessed to remove data values that are clearly in error.
- the preprocessing step is optional but, if performed at the end of the preprocessing step, only valid raw data will remain in the raw data set.
- the raw data is oftentimes organized for subsequent analysis.
- the raw data set may be organized through data averaging and/or low-pass filtering in order to facilitate the subsequent analysis of the data.
- the remaining raw data in the raw data set will be stored as a document in a computer-accessible file.
- a spreadsheet is oftentimes used to organize the raw data set in order to simplify its entry to the computer or processor in preparation for the data analysis.
- the raw data is then ready for data analysis.
- data analysis There are many different types of data analysis, such as analysis of variance, T-test, worst-case analysis, regression analysis, etc., which may be performed on the data.
- Each data analysis method generates its own set of relationships between the independent and dependent variables for the electronic circuit and these relationships between the independent and dependent variables together form a mathematical model with each data analysis method having its own mathematical model.
- the accuracy of the mathematical model is then determined by inputting the independent variables from the raw data set to the mathematical model and comparing the dependent variables or outputs from the mathematical model with the actual dependent variables in the raw data set. Any difference between the computed data values from the mathematical model and the actual values from the raw data forms an error and the analysis of this error between the computed data values and the raw data is analyzed statistically to determine the accuracy of the selected analysis method for the data.
- the statistical error of the mathematical model assuming a sufficient sample size, is sufficiently accurate that the mathematical model can be used for further testing of the electronic circuit.
- the selected analysis method produces an unacceptable error between the computed dependent variables and the measured variables from the raw data.
- it is necessary to select a different analysis method and apply that different analysis method to the raw data until a mathematical model having an acceptable error between the computed data and the raw data is identified. That procedure, however, is not only time consuming, but cumbersome.
- the present invention provides a method and apparatus using a programmed processor for electronic circuit simulation which overcomes the above-mentioned disadvantages of the previously known methods.
- raw data is first collected from the circuit to form a raw data set of the independent or input variables and the dependent or output variables.
- the raw data set is taken, if applicable, under different environmental conditions, such as different temperatures, random electrical noise, etc., of the type that the electronic circuit would be subjected to during normal operation.
- the raw data is preprocessed to remove incorrect data.
- Conventional preprocessing methods may be used, such as data averaging and low-pass filtering.
- the resulting raw data, whether preprocessed or not, is then organized into a computer-readable file, such as a spreadsheet.
- the raw data is then analyzed using at least two, and preferably more, data analysis methods to generate the relationships between the dependent and independent variables of the circuit.
- data analysis methods can include, for example, ANOVA (analysis of variance) analysis method, T-test method of analysis, worst-case analysis, and the like. In each case, the analysis method generates its own relationships between the independent and dependent variables for the electronic circuit.
- each analysis method constructs a mathematical model which defines the relationship between the dependent and independent variables.
- the mathematical model will differ from one analysis method to the other and can include, for example, first order equations, second order equations, higher order equations, differential equations, and the like.
- the accuracy of each model is then statistically determined. This is accomplished by utilizing the same set of independent variables in the raw data set and computing the dependent variables as a function of the mathematical model. Unless the computed values for the dependent variables in the mathematical model are identical to the actual data in the raw data set, which is rarely the case, an error will exist between the computed data for the dependent variables and the actual raw data for the dependent variables for the various values of the independent variables in both the raw data and the mathematical model.
- the accuracy of the mathematical model is then determined using standard statistical techniques. For example, the standard deviation for each model can be determined to ensure that the mathematical model meets the minimum accuracy requirements for the circuit application.
- the accuracies for the different mathematical models for the different analysis methods are then compared and the mathematical model having the highest statistical accuracy is then selected by the programmed processor provided that the sample size for that particular mathematical model meets the minimum requirements for statistical reliability.
- fuzzy logic is employed to make that selection.
- the reasoning logic to select the most accurate mathematical model and analysis method also preferably accesses a computer expert database containing known data for the accuracy of the analysis methods as well as the required sample sizes.
- a simulation model is preferably constructed for the electronic circuit. Any conventional method, such as Spice, PSpice, Saber, and so forth may be used to construct the simulated circuit and facilitate further testing of the circuit.
- the steps conducted during a circuit simulation modeling process are broadly illustrated.
- the electronic circuit is first constructed, typically by constructing a prototype.
- This electronic circuit furthermore, includes at least one independent variable or input and at least one dependent variable or output. Consequently, as the independent variable changes in value, the circuit functions to vary the output of the dependent variable in a repeatable fashion.
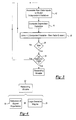
- FIG. 2 illustrates a flowchart of a program executed by a programmed processor of a preferred embodiment of the present invention.
- step 20 proceeds to step 22 where raw data is obtained from the circuit constructed at step 20.
- the technician varies the values of the inputs for the circuit and then measures the values of the outputs for the circuit.
- a plurality of different inputs are applied to the circuit at step 22 and for each set of different inputs, the outputs from the circuit are measured and recorded.
- the recordation of the data at step 22 is performed manually by the technician.
- the performance of the circuit may also vary as a function of environmental conditions.
- the temperature of the circuit, presence of electronic noise, and the like may vary the performance of the circuit. Consequently, the collection of the raw data into a raw data set at step 22 may be conducted under different environmental conditions and these different environmental conditions also become a part of the raw data set with the environmental condition, such as temperature, constituting a separate "input" or independent variable for the electronic circuit.
- step 22 proceeds to step 24 where the raw data is optionally preprocessed to remove erroneous data. Since the raw data was manually collected at step 22, the raw data inevitably includes some human error.
- the optional preprocessing step 24 may be used to eliminate, or at least reduce, that human error.
- Step 24 proceeds to step 26 where the raw data is analyzed.
- the raw data is analyzed using at least two, and preferably more, different analysis methods.
- analysis methods may include, for example, ANOVA analysis, T-test analysis, worst-case analysis, and the like.
- a first method of analysis e.g. ANOVA
- the analysis methods generate their results at step 30.
- the results generated at step 30, furthermore, consist of mathematical relationships between the inputs or independent variables and the outputs or dependent variables for the electronic circuit. These mathematical formulas may take a variety of different forms, such as first, second, or even higher order equations, exponential equations, differential equations and the like.
- the results generated at step 30 are stored by the processor in computer memory or other storage medium. Step 30 then proceeds to step 32.
- step 32 the raw data is again analyzed by using a different method of analysis.
- step 32 proceeds to step 34 where the second method of analysis generates mathematical relationships between the inputs or independent variables and the outputs or dependent variables for the circuit.
- these relationships may be of any form, such as first, second, or even higher order equations, exponential equations, differential equations and the like.
- step 26 proceeds to step 40 as shown in both FIGS. 1 and 2 .
- step 40 the mathematical relationships between the dependent and independent variables for each different mathematical model, one model associated with each different analysis method, are grouped to create the mathematical model.
- the number of different relationships or equations for each different mathematical model will differ. However, ideally each mathematical model will be able to predict the value of its outputs or dependent variables as a function of the circuit inputs or independent variables with only a minimum of error.
- An exemplary flowchart illustrating the calculation of the error of the mathematical model is shown in FIG. 3 .
- step 42 associates the raw data inputs to the circuit with the independent variables of the mathematical model. Step 42 then proceeds to step 44.
- Step 44 then calculates or computes the value of the dependent variables using the raw data input values and the mathematical formulae of the mathematical model which correspond to the analysis method of steps 28 and 30 ( FIG. 2 ). Step 44 then proceeds to step 46. At step 46, the error between the computed variable using the mathematical model and the raw data output or dependent variables is computed as the absolute value of the difference between the two values. Step 46 then proceeds to step 48.
- step 48 the processor determines whether or not all of the inputs of the raw data set have been analyzed for the first analysis method. If not, step 48 branches back to step 42 where the above analysis is repeated for the next data input of the raw data set. Otherwise, step 48 proceeds to step 50.
- step 50 the program determines whether or not all of the different analysis methods, i.e. analysis method 1 through analysis method N, have been analyzed to compute the error between the mathematical model dependent variables and the outputs from the raw data in the raw data set. If not, step 50 branches back to step 42 and reiterates the above-described process for the next analysis method. Conversely, if all the analysis methods have been analyzed and the errors determined and stored by the processor, step 50 proceeds to step 52 which is the reasoning module to select the best analysis method for the particular circuit under examination.
- the reasoning module step 52 which ultimately determines which analysis method is best suited for the particular circuit in question, broadly includes a computer database 54 of expert experience as well as a logic decision engine.
- the database 54 will contain, for example, the adequacy of the sample size for the various analysis methods performed at step 26 ( FIG. 2 ).
- the database of expert experience may also contain data regarding modeling experience from previous projects.
- a primary factor considered by the logic decision engine 56 is the error P(x) between the raw data output values and the computed values from the mathematical model for a given set of input or independent variables. For example, as shown in FIG. 5 , the statistical error P(x) as a function of the standard deviation ⁇ is shown. As well known in statistics, the greater the standard deviation ⁇ , the less error in the results.
- a table of sigma versus parts per million is shown.
- a sigma of 6 is difficult to obtain for most mathematical models but indicates an error of less than .002 parts per million.
- a sigma or standard deviation of 3 represents an accuracy of 99.7% which is acceptable for many applications, such as automotive circuitry.
- the logic decision engine 56 assigns an index to each method on a 100% scale with the highest index given to the most accurate mathematical model and vice versa.
- index numbers are also subject to input from the expert database 54 to ensure that an adequate number of samples are available for that particular analysis method. If not, a very low index is associated with that particular analysis method.
- the logic decision engine 56 may use fuzzy logic in its determination of the most accurate analysis method. More specifically, the data from the mathematical models is inputted by the logic decision engine 56 at step 60. Step 60 then proceeds to step 62.
- step 62 the fuzzy logic rules are obtained from the expert database 54. This range of fuzzy rules will contain ranges of data in a fuzzy data format. Step 62 then proceeds to step 64.
- step 64 the processor using the fuzzy rules determined at step 62 creates the fuzzy inferences for the data. Step 64 then proceeds to step 66.
- the processor performs defuzzification on the data after processing with the fuzzy inference at step 64.
- Any of several methods may be used to perform defuzzification. For example, centroid of area, maximum, bisector of area, mean of maximum, smallest of maximum, and largest of maximum are all different defuzzification methods used to obtain a crisp output. Any of these methods may be used to perform defuzzification in the instant invention and, preferably, the database 54 of expert experience contains an identification of which defuzzification method should be used to obtain optimal accuracy of the mathematical model.
- step 40 proceeds to step 70.
- a mathematical model of the circuit is constructed using any conventional circuit simulation tool, such as Spice or PSpice.
- the simulated electronic circuit is then used for further testing and analysis of the overall circuit.
- the circuitry includes a central processing unit 100 which may be of any conventional construction.
- the CPU receives input data and manipulates that data under control of a computer program.
- a program memory block 102 contains the computer program or computer code executed by the CPU 100.
- a storage memory block 104 communicates with the CPU 100 through a bidirectional bus 106 to not only receive data for storage, but also to provide previously stored data to the CPU 100 for use by the CPU 100 when executing its computer program.
- One or more input devices 108 also communicate with the CPU to provide the required input data, such as the raw data from the circuit, to the CPU 100.
- the CPU 100 will store this raw data as well as other input data in the storage memory block 104 for subsequent use by the CPU 100 when required.
- the input device 108 may be a direct input device, such as a keyboard, more typically the input device 108 comprises a computer file which may be inputted by the CPU 100.
- the CPU communicates with one or more output devices 110 for use by the operator of the system.
- the output devices 110 may comprise, for example, video displays, printers, and/or the like.
- the CPU 100 is programmed to execute the program illustrated in FIG. 2 . More specifically, the CPU 100 includes means, such as the input device 108, to input the raw data. The CPU 100, once it has acquired the raw data from the input device 100 and under program control from the program stored in the program memory block 102, generates the various results from the different mathematical models as shown in steps 28-38 in FIG. 2 .
- the CPU generates the mathematical modeling at step 40 for each different method under program control of the method illustrated more fully in FIG. 3 .
- the CPU 100 under program control executes the logic decision engine 56 as well as accesses the database of expert experience 54 contained in the storage memory 104 to determine the best method.
- the CPU 100 is programmed to utilize fuzzy logic to determine the best mathematical model.
- the present invention provides a circuit simulation method executed by a programmed processor which not only automates the analysis and mathematical modeling of the electronic circuit, but also automatically selects which of two or more analysis methods provides the optimal result from the simulation.
Landscapes
- Engineering & Computer Science (AREA)
- Physics & Mathematics (AREA)
- Computer Hardware Design (AREA)
- Theoretical Computer Science (AREA)
- Evolutionary Computation (AREA)
- Geometry (AREA)
- General Engineering & Computer Science (AREA)
- General Physics & Mathematics (AREA)
- Microelectronics & Electronic Packaging (AREA)
- Management, Administration, Business Operations System, And Electronic Commerce (AREA)
Applications Claiming Priority (1)
| Application Number | Priority Date | Filing Date | Title |
|---|---|---|---|
| US13/692,075 US20140156233A1 (en) | 2012-12-03 | 2012-12-03 | Method and apparatus for electronic circuit simulation |
Publications (1)
| Publication Number | Publication Date |
|---|---|
| EP2738701A2 true EP2738701A2 (de) | 2014-06-04 |
Family
ID=49683591
Family Applications (1)
| Application Number | Title | Priority Date | Filing Date |
|---|---|---|---|
| EP13195312.7A Withdrawn EP2738701A2 (de) | 2012-12-03 | 2013-12-02 | Verfahren und Vorrichtung zur statistischen Simulation einer elektronischen Schaltung |
Country Status (3)
| Country | Link |
|---|---|
| US (1) | US20140156233A1 (de) |
| EP (1) | EP2738701A2 (de) |
| JP (1) | JP2014110047A (de) |
Families Citing this family (5)
| Publication number | Priority date | Publication date | Assignee | Title |
|---|---|---|---|---|
| US11314907B2 (en) | 2016-08-26 | 2022-04-26 | Hitachi, Ltd. | Simulation including multiple simulators |
| US11138358B2 (en) * | 2017-09-29 | 2021-10-05 | Texas Instruments Incorporated | Simulation and analysis of circuit designs |
| DE102019124928A1 (de) | 2018-09-28 | 2020-04-02 | Taiwan Semiconductor Manufacturing Company, Ltd. | Integriertes schaltungsdesign unter verwendung von fuzzy-maschinenlernen |
| US11392748B2 (en) * | 2018-09-28 | 2022-07-19 | Taiwan Semiconductor Manufacturing Company, Ltd. | Integrated circuit design using fuzzy machine learning |
| US20220358364A1 (en) * | 2019-11-05 | 2022-11-10 | Incucomm, Inc. | Systems and methods for constructing an artificial intelligence (ai) neural-like model of a real system |
Family Cites Families (17)
| Publication number | Priority date | Publication date | Assignee | Title |
|---|---|---|---|---|
| US5146460A (en) * | 1990-02-16 | 1992-09-08 | International Business Machines | Logic simulation using a hardware accelerator together with an automated error event isolation and trace facility |
| WO1995017781A1 (en) * | 1993-12-23 | 1995-06-29 | The State Of Oregon, Acting By And Through The State Board Of Higher Education On Behalf Of Portland State University | Programmable analog array circuit |
| JPH08123778A (ja) * | 1994-10-20 | 1996-05-17 | Hitachi Ltd | 非線形モデル自動生成方法 |
| US5691896A (en) * | 1995-08-15 | 1997-11-25 | Rosemount, Inc. | Field based process control system with auto-tuning |
| US5901061A (en) * | 1996-05-24 | 1999-05-04 | Hewlett-Packard Company | Method of checking for races in a digital design |
| US6018723A (en) * | 1997-05-27 | 2000-01-25 | Visa International Service Association | Method and apparatus for pattern generation |
| US6205439B1 (en) * | 1998-07-15 | 2001-03-20 | Micron Technology, Inc. | Optimization of simulation run-times based on fuzzy-controlled input values |
| US6321225B1 (en) * | 1999-04-23 | 2001-11-20 | Microsoft Corporation | Abstracting cooked variables from raw variables |
| US6754852B2 (en) * | 2000-03-02 | 2004-06-22 | Texas Instruments Incorporated | Debug trigger builder |
| EP1323059A2 (de) * | 2000-04-05 | 2003-07-02 | Pavilion Technologies, Inc. | Vorrichtung und verfahren zur enterprisemodellierung, optimierung und steuerung |
| US7103524B1 (en) * | 2001-08-28 | 2006-09-05 | Cadence Design Systems, Inc. | Method and apparatus for creating an extraction model using Bayesian inference implemented with the Hybrid Monte Carlo method |
| AU2002359605A1 (en) * | 2001-12-07 | 2003-06-23 | Cadence Design Systems, Inc. | Timing model extraction by timing graph reduction |
| US20030188267A1 (en) * | 2002-03-29 | 2003-10-02 | International Business Machines Corporation | Circuit and method for modeling I/O |
| US7283928B2 (en) * | 2004-09-30 | 2007-10-16 | John Antanies | Computerized method and software for data analysis |
| US7574344B2 (en) * | 2005-09-29 | 2009-08-11 | Sun Microsystems, Inc. | Static timing based IR drop analysis |
| US7483824B1 (en) * | 2006-03-03 | 2009-01-27 | Azul Systems, Inc. | Self-checking test generator for partially-modeled processors by propagating fuzzy states |
| US8594989B2 (en) * | 2009-04-09 | 2013-11-26 | International Business Machines Corporation | Compensating for variations in device characteristics in integrated circuit simulation |
-
2012
- 2012-12-03 US US13/692,075 patent/US20140156233A1/en not_active Abandoned
-
2013
- 2013-11-12 JP JP2013233644A patent/JP2014110047A/ja active Pending
- 2013-12-02 EP EP13195312.7A patent/EP2738701A2/de not_active Withdrawn
Non-Patent Citations (1)
| Title |
|---|
| None |
Also Published As
| Publication number | Publication date |
|---|---|
| US20140156233A1 (en) | 2014-06-05 |
| JP2014110047A (ja) | 2014-06-12 |
Similar Documents
| Publication | Publication Date | Title |
|---|---|---|
| Steier et al. | The use of Bayesian statistics for 14C dates of chronologically ordered samples: a critical analysis | |
| US6895350B2 (en) | Fraction defective estimating method, system for carrying out the same recording medium | |
| US5687094A (en) | Design verification apparatus | |
| EP2342603B1 (de) | Verfahren und vorrichtung zur erzeugung von statusschätzungsmodellen bei der überwachung von maschinenzuständen | |
| Aimran et al. | The development of comparative bias index | |
| CN107766254B (zh) | 一种基于层次分析的软件质量评估方法及系统 | |
| EP2738701A2 (de) | Verfahren und Vorrichtung zur statistischen Simulation einer elektronischen Schaltung | |
| JP2013257821A (ja) | 情報処理装置及び情報処理方法及びプログラム | |
| CN120779916A (zh) | 一种控制系统数字化模型校验方法和系统 | |
| JP3570211B2 (ja) | 不良率推定方法、不良率推定システムおよび記録媒体 | |
| Radionov et al. | Automated system design for experimental research of the technological process parameters of spacecraft waveguide paths induction soldering | |
| JP6394787B2 (ja) | 製品検査装置、製品検査方法及びコンピュータプログラム | |
| CN108376123A (zh) | 一种卫星重力观测数据异常值提取方法、装置及电子设备 | |
| US20070180411A1 (en) | Method and apparatus for comparing semiconductor-related technical systems characterized by statistical data | |
| Greif et al. | Software validation in metrology: A case study for a GUM-supporting software | |
| CN116702521B (zh) | 一种自动驾驶场景一致性对比方法、装置及电子设备 | |
| US6526326B2 (en) | Fraction defective estimating method and system for estimating an assembly fraction defective of an article | |
| CN114490412A (zh) | 基于自减逆向云发生器的三维cad软件性能度量方法及装置 | |
| JP2011141674A (ja) | ソフトウェア品質指標値管理システム、ソフトウェア品質指標値の真値を推定する推定方法及び推定プログラム | |
| Bi et al. | Thurstonian models for three variants (specified, unspecified, and unspecified with forgiveness) of the Two‐Out‐of‐Five method | |
| Коробко et al. | An alternative method for assessing the agreement between test results | |
| CN118734919B (zh) | 一种图分类测试模型数据集测试方法、终端及存储介质 | |
| Mahmoud et al. | Performance of Log-Beta Log-Logistic Regression Model | |
| Poliarus et al. | The Features Ofapplication of Normative Documents to Inverse Problemsof Measurement | |
| Yurov | Quality assessment of verification methodologies and verification procedures |
Legal Events
| Date | Code | Title | Description |
|---|---|---|---|
| PUAI | Public reference made under article 153(3) epc to a published international application that has entered the european phase |
Free format text: ORIGINAL CODE: 0009012 |
|
| 17P | Request for examination filed |
Effective date: 20140203 |
|
| AK | Designated contracting states |
Kind code of ref document: A2 Designated state(s): AL AT BE BG CH CY CZ DE DK EE ES FI FR GB GR HR HU IE IS IT LI LT LU LV MC MK MT NL NO PL PT RO RS SE SI SK SM TR |
|
| AX | Request for extension of the european patent |
Extension state: BA ME |
|
| RIN1 | Information on inventor provided before grant (corrected) |
Inventor name: WANG, CAN Inventor name: PHATAK, SUJIT Inventor name: MCCUNE, DONALD J. |
|
| STAA | Information on the status of an ep patent application or granted ep patent |
Free format text: STATUS: REQUEST FOR EXAMINATION WAS MADE |
|
| STAA | Information on the status of an ep patent application or granted ep patent |
Free format text: STATUS: THE APPLICATION IS DEEMED TO BE WITHDRAWN |
|
| 18D | Application deemed to be withdrawn |
Effective date: 20170701 |