EP2647976A1 - 3d data analysis device, 3d data analysis method, and 3d data analysis program - Google Patents
3d data analysis device, 3d data analysis method, and 3d data analysis program Download PDFInfo
- Publication number
- EP2647976A1 EP2647976A1 EP11844939.6A EP11844939A EP2647976A1 EP 2647976 A1 EP2647976 A1 EP 2647976A1 EP 11844939 A EP11844939 A EP 11844939A EP 2647976 A1 EP2647976 A1 EP 2647976A1
- Authority
- EP
- European Patent Office
- Prior art keywords
- stereoscopic image
- data analysis
- graphics
- analysis apparatus
- microparticles
- Prior art date
- Legal status (The legal status is an assumption and is not a legal conclusion. Google has not performed a legal analysis and makes no representation as to the accuracy of the status listed.)
- Ceased
Links
Images


Classifications
-
- G—PHYSICS
- G06—COMPUTING; CALCULATING OR COUNTING
- G06T—IMAGE DATA PROCESSING OR GENERATION, IN GENERAL
- G06T15/00—3D [Three Dimensional] image rendering
-
- G—PHYSICS
- G01—MEASURING; TESTING
- G01N—INVESTIGATING OR ANALYSING MATERIALS BY DETERMINING THEIR CHEMICAL OR PHYSICAL PROPERTIES
- G01N15/00—Investigating characteristics of particles; Investigating permeability, pore-volume, or surface-area of porous materials
- G01N15/10—Investigating individual particles
- G01N15/14—Electro-optical investigation, e.g. flow cytometers
-
- G—PHYSICS
- G06—COMPUTING; CALCULATING OR COUNTING
- G06T—IMAGE DATA PROCESSING OR GENERATION, IN GENERAL
- G06T11/00—2D [Two Dimensional] image generation
- G06T11/20—Drawing from basic elements, e.g. lines or circles
- G06T11/206—Drawing of charts or graphs
-
- G—PHYSICS
- G06—COMPUTING; CALCULATING OR COUNTING
- G06T—IMAGE DATA PROCESSING OR GENERATION, IN GENERAL
- G06T3/00—Geometric image transformation in the plane of the image
- G06T3/40—Scaling the whole image or part thereof
-
- G—PHYSICS
- G06—COMPUTING; CALCULATING OR COUNTING
- G06T—IMAGE DATA PROCESSING OR GENERATION, IN GENERAL
- G06T3/00—Geometric image transformation in the plane of the image
- G06T3/60—Rotation of a whole image or part thereof
-
- H—ELECTRICITY
- H04—ELECTRIC COMMUNICATION TECHNIQUE
- H04N—PICTORIAL COMMUNICATION, e.g. TELEVISION
- H04N13/00—Stereoscopic video systems; Multi-view video systems; Details thereof
- H04N13/20—Image signal generators
- H04N13/204—Image signal generators using stereoscopic image cameras
-
- H—ELECTRICITY
- H04—ELECTRIC COMMUNICATION TECHNIQUE
- H04N—PICTORIAL COMMUNICATION, e.g. TELEVISION
- H04N13/00—Stereoscopic video systems; Multi-view video systems; Details thereof
- H04N13/20—Image signal generators
- H04N13/275—Image signal generators from 3D object models, e.g. computer-generated stereoscopic image signals
-
- H—ELECTRICITY
- H04—ELECTRIC COMMUNICATION TECHNIQUE
- H04N—PICTORIAL COMMUNICATION, e.g. TELEVISION
- H04N13/00—Stereoscopic video systems; Multi-view video systems; Details thereof
- H04N13/20—Image signal generators
- H04N13/282—Image signal generators for generating image signals corresponding to three or more geometrical viewpoints, e.g. multi-view systems
-
- H—ELECTRICITY
- H04—ELECTRIC COMMUNICATION TECHNIQUE
- H04N—PICTORIAL COMMUNICATION, e.g. TELEVISION
- H04N13/00—Stereoscopic video systems; Multi-view video systems; Details thereof
- H04N13/30—Image reproducers
- H04N13/302—Image reproducers for viewing without the aid of special glasses, i.e. using autostereoscopic displays
- H04N13/31—Image reproducers for viewing without the aid of special glasses, i.e. using autostereoscopic displays using parallax barriers
-
- H—ELECTRICITY
- H04—ELECTRIC COMMUNICATION TECHNIQUE
- H04N—PICTORIAL COMMUNICATION, e.g. TELEVISION
- H04N13/00—Stereoscopic video systems; Multi-view video systems; Details thereof
- H04N13/30—Image reproducers
- H04N13/332—Displays for viewing with the aid of special glasses or head-mounted displays [HMD]
- H04N13/339—Displays for viewing with the aid of special glasses or head-mounted displays [HMD] using spatial multiplexing
-
- H—ELECTRICITY
- H04—ELECTRIC COMMUNICATION TECHNIQUE
- H04N—PICTORIAL COMMUNICATION, e.g. TELEVISION
- H04N13/00—Stereoscopic video systems; Multi-view video systems; Details thereof
- H04N13/30—Image reproducers
- H04N13/349—Multi-view displays for displaying three or more geometrical viewpoints without viewer tracking
- H04N13/351—Multi-view displays for displaying three or more geometrical viewpoints without viewer tracking for displaying simultaneously
-
- G—PHYSICS
- G01—MEASURING; TESTING
- G01N—INVESTIGATING OR ANALYSING MATERIALS BY DETERMINING THEIR CHEMICAL OR PHYSICAL PROPERTIES
- G01N15/00—Investigating characteristics of particles; Investigating permeability, pore-volume, or surface-area of porous materials
- G01N15/10—Investigating individual particles
- G01N2015/1006—Investigating individual particles for cytology
-
- G—PHYSICS
- G01—MEASURING; TESTING
- G01N—INVESTIGATING OR ANALYSING MATERIALS BY DETERMINING THEIR CHEMICAL OR PHYSICAL PROPERTIES
- G01N15/00—Investigating characteristics of particles; Investigating permeability, pore-volume, or surface-area of porous materials
- G01N15/10—Investigating individual particles
- G01N15/14—Electro-optical investigation, e.g. flow cytometers
- G01N2015/1477—Multiparameters
-
- G—PHYSICS
- G06—COMPUTING; CALCULATING OR COUNTING
- G06T—IMAGE DATA PROCESSING OR GENERATION, IN GENERAL
- G06T2200/00—Indexing scheme for image data processing or generation, in general
- G06T2200/04—Indexing scheme for image data processing or generation, in general involving 3D image data
-
- G—PHYSICS
- G06—COMPUTING; CALCULATING OR COUNTING
- G06T—IMAGE DATA PROCESSING OR GENERATION, IN GENERAL
- G06T2200/00—Indexing scheme for image data processing or generation, in general
- G06T2200/08—Indexing scheme for image data processing or generation, in general involving all processing steps from image acquisition to 3D model generation
-
- G—PHYSICS
- G06—COMPUTING; CALCULATING OR COUNTING
- G06T—IMAGE DATA PROCESSING OR GENERATION, IN GENERAL
- G06T2210/00—Indexing scheme for image generation or computer graphics
- G06T2210/56—Particle system, point based geometry or rendering
Definitions
- the present invention relates to a 3D data analysis apparatus, a 3D data analysis method, and a 3D data analysis program. More specifically, the present invention relates to a 3D data analysis apparatus and the like for displaying measurement data of microparticles with a 3D stereoscopic image.
- microparticle measurement apparatus which introduces a dispersion liquid of microparticles in a flow channel and measures the microparticles optically, electrically, or magnetically.
- a particle analyzer that distinguishes synthetic particles on the basis of sizes or shapes.
- a parameter (variable) which can be measured by the particle analyzer include an elemental composition and a particle diameter of a microparticle.
- a flow cytometer (flow cytometry) is used.
- a parameter which can be measured by the flow cytometer include forward scattered light (FS), side scatter (SS), fluorescent light (FL), and impedance of microparticles.
- the forward scattered light (FS), the side scatter (SS), and the fluorescent light (FL) are used as parameters that indicate an optical characteristic of a cell or a microbe (hereinafter, simply referred to as "cell"), and the impedance is used as a parameter that indicates an electrical characteristic of a cell.
- the forward scattered light is light that is scattered at a small angle in a forward direction with respect to an axis of laser light and includes scattered light, diffracted light, and refracted light of laser light which is generated on a surface of a cell.
- the forward scattered light is mainly used as a parameter that indicates the size of a cell.
- the side scatter is light that is scattered at approximately 90 degrees with respect to an axis of laser light and is scattered light of laser light that is generated in a granule or a core inside a cell.
- the side scatter is mainly used as a parameter that indicates an internal structure of a cell.
- the fluorescent light is light that is generated from a fluorochrome labeled to a cell and is used as a parameter that indicates existence or nonexistence of a cell surface antigen recognized by a fluorochrome-labeled antibody, the amount of a nucleic acid to which a fluorochrome is combined, or the like.
- the impedance is measured by an electrical resistance method and used as a parameter that indicates a cell volume.
- a data analysis apparatus is used in which measurement values of cells are plotted with these measurement parameters being as axes, thereby creating a diagram that shows a characteristic distribution of the cells in a cell population.
- a one-dimensional distribution chart with the use of one measurement parameter is called as a histogram, which is created with an X axis indicating the measurement parameter, and a Y axis indicating the number of cells (count).
- a two-dimensional distribution chart in which two measurement parameters are used is called as a cytogram, which is created by plotting cells on the basis of the measurement values in a coordinate plane with the X axis indicating one measurement parameter and the Y axis indicating the other measurement parameter.
- the cell population as a sample includes unnecessary cells not to be analyzed, so the analysis of the measurement data is performed after a cell small population to be analyzed is selected from the cell population as the sample.
- the cell small population to be analyzed is selected by specifying an area in which the cell small population exists on the histogram or the cytogram. This operation is called as "gating" because cells as targets are enclosed in an area specified on the histogram or the cytogram.
- the cell small population to be analyzed and unnecessary cells may exist in an overlapped area in some cases.
- a lymphocyte is analyzed with human peripheral blood as a sample
- FS forward scattered light
- SS side scatter
- a user In order to specify an area so that only a cell small population to be analyzed is enclosed without enclosing unnecessary cells, conventionally, a user has to perform gating while referring to a plurality of histograms or cytograms. Along with improvement of the performance of a flow cytometer, the number of parameters that can be measured is increased, so the user has to refer to more histograms or cytograms. Further, at this time, the user is requested to perform a gating operation while imaging a three-dimensional distribution chart (3D distribution chart) in which two cytograms are combined.
- 3D distribution chart three-dimensional distribution chart
- Patent Document 1 proposes "an analysis apparatus including a measurement data obtaining means for obtaining first, second, and third measurement data items from an analyte, a 3D distribution chart creating means for creating a 3D distribution chart that indicates a distribution of formed elements contained in the analyte with the first, second, and third measurement data items as axes, an area setting means for variably setting a separate area on the 3D distribution chart, and a reference distribution chart creating means for creating, with respect to formed elements that belongs to the separate area set by the area setting means, at least one of a 2D distribution chart with the first and second measurement data items used as the axes and a frequency distribution chart with the first measurement data item used as the axis" (see, claim 9 of Patent Document 1).
- the analysis apparatus it is possible to set the separate area on the 3D distribution chart while referring to the 2D distribution chart (cytogram) and the frequency distribution chart (histogram) displayed along with the 3D distribution chart. It should be noted that the 3D distribution chart of the analysis apparatus is not viewed stereoscopically but is displayed two-dimensionally on a display.
- twin-lens stereo image technology (3D stereoscopic image technology) will be described.
- twin-lens stereo image first, two images when an object is viewed with a right eye and a left eye are prepared. Then, these images are displayed at the same time, and an image for the right eye is presented only to the right eye, and an image for the left eye is presented only to the left eye.
- an image that appears in the eyes at a time when the object is viewed in a 3D space is reproduced, and a user is caused to stereoscopically view the object.
- a (a) glasses type For a 3D display which allows a stereoscopic view, a (a) glasses type, a (b) glasses-free type, and a (c) viewer type are mainly adopted.
- the (a) glasses type includes an anaglyph type, a polarization filter type, and a time-sharing type.
- the (b) glasses-free type includes a parallax barrier type and a lenticular type
- the (c) viewer type includes a stereoscope type and a head mount type.
- Patent Document 1 Japanese Patent Application Laid-open No. 2006-17497
- the present invention provides a 3D data analysis apparatus including a data storage unit to store measurement data of microparticles, an input unit to select three kinds of variables independent of the measurement data, a data processing unit to calculate positions and graphics in a coordinate space with the three kinds of variables being coordinate axes and create a 3D stereoscopic image that represents a characteristic distribution of the microparticles, and a display unit to display the 3D stereoscopic image.
- a 3D data analysis apparatus it is possible to analyze the measurement data while stereoscopically viewing the 3D distribution chart with the arbitrarily selected three kinds of parameters being the coordinate axes.
- the present invention also provides a 3D data analysis method including the steps of selecting three kinds of variables independent of measurement data of microparticles, calculating positions and graphics in a coordinate space with the three kinds of variables being coordinate axes and creating a 3D stereoscopic image that represents a characteristic distribution of the microparticles, and displaying the 3D stereoscopic image.
- the resent invention also provides a 3D data analysis program causing a computer to execute the steps of calculating positions and graphics in a coordinate space with three kinds of independent variables selected from measurement data of microparticles being coordinate axes and creating a 3D stereoscopic image that represents a characteristic distribution of the microparticles, and displaying the 3D stereoscopic image.
- the "microparticles” widely include biologically relevant particles such as cells, microbes, and liposomes, synthetic particles such as latex particles, gel particles, and particles for industrial use, and the like.
- the cells include animal cells (hematopoietic cells or the like) and plant cells.
- the microbes include bacteria such as coli bacilli, viruses such as tobacco mosaic viruses, and fungi such as yeast.
- the biologically relevant particles include chromosomes, liposomes, mitochondrion, organelle (cell organelle), and the like that form various cells. Further, the biologically relevant particles can include biologically relevant polymer such as nucleic acids, proteins, and complexes of these.
- the particles for industrial use may be organic or inorganic polymeric materials, metal, or the like.
- the organic polymeric materials include polystyrene, styrenedivinylbenzene, polymethyl methacrylate, and the like.
- the inorganic polymeric materials include glass, silica, magnetic materials, and the like.
- the metal include gold colloid, aluminum, and the like. These microparticles generally have spherical forms but may be non-spherical forms. Further, the sizes, masses, and the like of these microparticles are also not limited particularly.
- the data analysis apparatus is provided which is capable of easily and instinctively specifying microparticles and microparticle small populations to be analyzed without referring to a large number of histograms or cytograms or imaging a 3D distribution chart.
- Fig. 1 shows the structure of a 3D data analysis apparatus according to the present invention.
- the 3D data analysis apparatus is provided contiguously with a microparticle measurement apparatus, thereby constituting a microparticle analysis system.
- Fig. 2 shows the functional structure of the microparticle analysis system.
- a flow cytometer is used as the microparticle measurement apparatus will be described.
- the 3D data analysis apparatus denoted by reference numeral 1 in the figure constitutes a microparticle analysis system 3 by being connected to a flow cytometer 2 with a communication cable 4.
- the 3D data analysis apparatus 1 includes a central processing unit (CPU) 10, a memory 20, a hard disk 30, a user interface, and the like.
- CPU central processing unit
- the hard disk 30 a 3D data analysis program 31, measurement data 32 of microparticles, an operating system (OS) 33, and the like are stored and held.
- the user interface includes a mouse 41, a keyboard 42, and the like which receive an input of information from a user and a display 43, a printer 44, and the like which output information to the user.
- an input device such as a stick controller and a pen tablet may be provided, instead of the mouse 41 and the keyboard 42 or along with these devices.
- a data storage unit 130 stores the measurement data 32 of the microparticles (cells) which is output from the flow cytometer 2.
- the measurement data output from an input and output interface 250 of the flow cytometer 2 is input to an input and output interface 150 of the 3D data analysis apparatus 1 through the communication cable 4 and stored in a data storage unit 30 (hard disk 30).
- the measurement data 32 is processed in a data processing unit 120.
- the data processing unit 120 starts the processing upon reception of an input from an input unit 141 (mouse 41, keyboard 42, or the like) by a user. That is, when the user selects and inputs three kinds of variables (parameters) independent of the measurement data 32, the data processing unit 120 creates a 3D distribution chart that represents a characteristic distribution of microparticles with the parameters selected being as the coordinate axes.
- the 3D distribution chart is created by plotting the microparticles in the coordinate space with the parameters selected being as the coordinate axes.
- the plotting of the microparticles are performed by calculating positions and a graphic in the coordinate space of the microparticles from measurement values of the parameters selected and drawing the graphic calculated on the position calculated.
- the "parameters independent” refer to parameters which are selected from the forward scattered light (FS), the side scatter (SS), the fluorescent light (FL), the impedance, and the like of the microparticles and are different from each other.
- the fluorescent light (FL) can be dealt as a parameter different for each wavelength of fluorochrome labeled to the microparticles and represented by FL1, FL2 to FLn (n: 3 or more integer), or the like.
- a combination of the forward scattered light (FS), the side scatter (SS), and the fluorescent light (FL1) or a combination of the forward scattered light (FS), the side scatter (SS), and the impedance are given as examples.
- the three kinds of parameters independent can be a combination arbitrarily selected from the measurement data.
- the 3D distribution chart created by the data processing unit 120 is displayed as a 3D stereoscopic image on a display unit 142 (display 43).
- One or two or more 3D stereoscopic images can be displayed on the display unit 142.
- 3D stereoscopic images obtained by observing the same 3D distribution chart in a plurality of different directions may be displayed, or 3D stereoscopic images of a plurality of 3D distribution charts may be displayed with at least one of three kinds of parameters selected being different.
- the 3D stereoscopic images are twin-lens stereo images to be described in detail in the following.
- the display unit 142 may display a 3D distribution chart that represents a characteristic distribution of microparticles at the plurality of time points with a 3D stereoscopic image.
- Examples of the measurement data that includes measurement values at a plurality of time points include data obtained by measuring association or dissociation of cell-surface molecular complexes with time with the use of the fluorescence resonance energy transfer (FRET), data obtained by measuring a change of a cell membrane with time with the use of fluorochrome the fluorescence wavelength of which varies depending on a charge of the cell membrane, data obtained by measuring the intensity of expression of a cell-surface molecule by being correlated with an inflow response of intracellular calcium, and the like.
- FRET fluorescence resonance energy transfer
- the 3D stereoscopic images of the 3D distribution chart at the plurality of time points may be displayed in a row at the same time or may be switched and displayed one by one.
- the switching may be automatically performed or may be performed on the basis of an input signal of a user.
- the display of the 3D stereoscopic image on the display unit 142 may be performed by arbitrarily rotating or scaling up or down on the basis of an input signal of a user from the input unit 141 (mouse 41, keyboard 42, or the like). Further, in the case where a separate area for gating is set in a coordinate space of the 3D distribution chart on the basis of the input signal from the input unit 141, the 3D stereoscopic image is rotated or scaled up or down along with a 3D shape that represents the separate area displayed in the 3D stereoscopic image.
- the flow cytometer 2 can have the same structure as the conventionally known apparatus or can be configured by appropriately modifying this, specifically, is constituted of a control unit 210, a flow system 220, a detection system 230, an input and output interface 250, and the like.
- the flow system 200 causes a laminar flow of a sample liquid containing the microparticles to flow to the center of a laminar flow of a sheath liquid to arrange the microparticles in the laminar flow in a row.
- the detection system 230 obtains a parameter value that indicates the characteristic of the microparticles that are flown through the flow channel.
- an optical detection unit 231 irradiates the microparticles flown with light, detects scattered light, fluorescent light, or the like generated from the microparticles, and obtains the intensity thereof.
- the optical detection unit 231 includes a laser light source, lens, a mirror, a filter, an area image pickup element such as a CCD and a CMOS element, a PMT (photo multiplier tube), or the like.
- an electrical detection unit 232 includes an electrode provided so as to be opposed to the microparticles flown, and obtains an impedance, a capacitance value, an inductance, and the like of the microparticles.
- the flow cytometer 2 may be provided with a sorting system 240 for sorting the microparticles which are determined to have a desired characteristic as a result of the analysis.
- the sorting system 240 for example, it is possible to adopt a system of ejecting a droplet containing the microparticles to a space outside the flow cell and controlling a moving direction of the droplet, thereby collecting only desired microparticles into a container.
- the measurement values of the intensities of the scattered light, the fluorescent light, and the like detected in the detection system 230 or the measurement values of the impedance, the capacitance value, the inductance, and the like are converted into electrical signals and output from the input and output interface 250 as the measurement data.
- Fig. 3 schematically shows a 3D distribution chart displayed by the 3D data analysis apparatus according to the present invention.
- the 3D distribution chart is displayed as a 3D stereoscopic image on the display unit 142 and can be stereoscopically visually confirmed by a user.
- a 3D distribution chart 5 shows a characteristic distribution of the microparticles in a coordinate space 6 with the three kinds of parameters selected by a user being as the coordinate axes.
- graphics 7 are drawn.
- the three kinds of parameters are a combination of the forward scattered light (FS-Lin: X axis), the side scatter (SS-Lin: Y axis), and a first fluorescent light (FL1-Lin: Z axis) is given as an example.
- the parameters used for the respective coordinate axes can be a combination selected arbitrarily.
- the first fluorescent light (FL1), a second fluorescent light (FL2), and an impedance can be used for the X axis, the Y axis, and the Z axis, respectively.
- the 3D stereoscopic display of the 3D distribution chart is performed with a twin-lens stereo image.
- Fig. 4 schematically shows a twin-lens stereo image displayed by the 3D data analysis apparatus according to the present invention.
- the data processing unit 120 creates the 3D distribution chart 5 and creates an image at a time when the distribution chart is viewed with the left eye (left-eye image 5L) and an image when viewed with the right eye (right-eye image 5R).
- the display unit 142 displays the left-eye image 5L and the right-eye image 5R at the same time, and separate presentation is performed so that the left-eye image 5L is presented only to the left eye, and the right-eye image 5R presented only to the right eye.
- the separation presentation can be performed by alternately displaying the left-eye image 5L and the right-eye image 5R with a minute time difference and causing shutter glasses 8 to be synthesized with this.
- another glasses type such as an anaglyph type and a polarization filter type, the glasses-free type such as a parallax barrier type and a lenticular type, and the viewer type such as a stereoscope type and a head mount type may be used.
- the display 43 By performing the separation presentation of the left-eye image 5L and the right-eye image 5R, the display 43 reproduces an image seen in the eyes at the time when the 3D distribution chart is viewed in the 3D space and causes a user to stereoscopically view the distribution chart.
- the 3D data analysis apparatus 1 it is possible for a user to analyze the measurement data while stereoscopically viewing the 3D distribution chart with the arbitrarily selected three kinds of parameters being as the coordinate axes. Therefore, in the 3D data analysis apparatus 1, it is possible to easily and instinctively specify the microparticles and microparticle small populations to be analyzed on the distribution chart, so it is unnecessary to refer to a lot of histograms or cytograms or imaging the 3D distribution chart as in the conventional way.
- the parameters used for the coordinate axes are arbitrarily combined to display the 3D distribution chart, with the result that it is possible to obtain information relating to the three characteristics of the microparticles with one graph.
- the 3D analysis apparatus 1 by displaying the 3D stereoscopic image obtained by observing the same 3D distribution chart in a plurality of different directions or displaying the 3D stereoscopic images of a plurality of 3D distribution charts with at least one of three kinds of parameters selected being different, it is possible to obtain more pieces of information.
- the 3D analysis apparatus 1 it is possible to perform an efficient analysis by reducing the number of graphs to be referred to as compared to the display with conventional histograms or cytograms.
- the graphics corresponding to the microparticles which are each denoted by the reference numeral 7 in Fig. 3 , are calculated as polyhedrons constituted of polygons each having a predetermined shape and displayed in the 3D stereoscopic image.
- the data processing unit 120 calculates the positions and the graphics 7 of the microparticles in the coordinate space and creates the 3D distribution chart.
- the graphic 7 as the polyhedron constituted of the polygons having the predetermined shape, it is possible to reduce a calculation load in the data processing unit 120.
- the graphic 7 as the polyhedron constituted of the polygons having the predetermined shape it is possible to increase the stereoscopic effect of an image when the image is stereoscopically viewed.
- the polyhedron constituted of the polygons having the predetermined shape for example, a hexahedron constituted of six triangular polygons as shown in (A) of Fig. 5 or an octahedron constituted of eight polygons as shown in (B) of Fig. 5 can be employed.
- the shapes of the graphic 7 are not particularly limited as long as a polyhedron constituted of polygons each having a predetermined shape is provided. In a viewpoint of the stereoscopic effect and the reduction of the calculation load, the hexahedron or the octahedron is preferable.
- the graphics 7 observed forward when stereoscopically viewed are indicated with increased shading, and the graphics 7 observed backward are indicated with decreased shading.
- a process of changing the shading of the graphics 7 is referred to as a "shade process" hereinafter.
- FIG. 6 A conceptual diagram of a stereoscopic observation image (hereinafter, simply referred to as "stereoscopic image”) of the graphic 7 which has been subjected to the shade process is shown in Fig. 6 .
- a stereoscopic image of the graphic 7 which has been subjected to the shade process.
- the graphics 7 observed forward are darker, and the graphics 7 observed backward are lighter.
- a depth is given to the stereoscopic image of the 3D stereoscopic image, and the stereoscopic effect can be increased.
- a left-eye image and a right-eye image are displayed at the same time, and the left-eye image and the right-eye image of a graphic 70 observed at a position on a screen of the display 43 when stereoscopically viewed are displayed in a superimposed manner (see, (B) of Fig. 7 ).
- the graphic is stereoscopically viewed forward as compared to the position on the screen of the display 43.
- the stereoscopic image of the graphic observed in a pop-up manner from the screen position is denoted by the reference numeral 71 in the figure, and the left-eye image and the right-eye image of the graphic 71 displayed on the display 43 are denoted by the symbols 71L and 71R, respectively.
- the left-eye image displayed on the display 43 is positioned leftward as compared to the right-eye image (see, (C) of Fig.
- the graphic is stereoscopically viewed backward from the position on the screen of the display 43.
- the stereoscopic image of the graphic observed in a pop-up manner from the screen position is denoted by the reference numeral 72
- the left-eye image and the right-eye image of the graphic 71 displayed on the display 43 are denoted by the symbols 72L and 72R, respectively.
- the left-eye image 71L and the right-eye image 71R of the graphic 71 observed forward are displayed to be darker, and the left-eye image 72L and the right-eye image 72R of the graphic 72 observed backward are displayed to be lighter.
- the coordinate axis is displayed to be thicker as a part observed forward when the stereoscopic viewing is performed, and the coordinate axis is displayed to be thinner as a part observed backward.
- a conceptual diagram of a stereoscopic image of the coordinate axis having a varied thickness is shown in Fig. 8 . In this way, by changing the thickness of the coordinate axis, it is possible to increase the stereoscopic effect by giving a depth to the stereoscopic image of the 3D stereoscopic image.
- scale intervals of the coordinate axis are set to be wider as a part observed forward when the stereoscopic viewing is performed, and the scale intervals thereof are set to be narrower as a part observed backward, with the result that a further depth can be given to the stereoscopic image.
- the name of the coordinate axis (SS-Lin in the figure) and the characters of the scale values (200, 400, 600, 800, 1000, in the figure) are displayed to be larger toward the front and displayed to be smaller toward the back, with the result that the same effect is obtained.
- the process of changing the thickness of the coordinate axis, the size of the scale intervals, and the size of the characters can also be performed through an application of the shade process described above.
- the coordinate axes may be a biexponential axis having characteristics of a linear axis and a logarithmic axis in combination.
- the detail of the biexponential axis is described in "A New "Logicle” Display Method Avoids Deceptive Effects of Logarithmic Scaling for Low Signals and Compensated Data. Cytometry part A 69A: 541-551, 2006", for example.
- the biexponential axis With respect to such data that a measurement value of a parameter selected as a coordinate axis is smaller than a predetermined value, a function the main function element of which is a linear function is applied, thereby obtaining the positions of the graphics 7 corresponding to the microparticles. Further, with respect to such data that a measurement value is larger than the predetermined value, a function the main function element of which is a logarithmic function is applied, thereby obtaining the positions of the graphics 7. More simply, the biexponential axis can be set so that an area larger than the predetermined area is a logarithmic axis, and an area smaller than the predetermined area is a linear axis.
- the biexponential axis for the coordinate axes of the 3D distribution chart, it is possible to perform displaying at a wider dynamic range for which the characteristics of the logarithmic axis are used, and at the same time, to perform displaying with negative numbers because of the characteristics of the linear axis. It should be noted that at least one of the coordinate axes of the 3D distribution chart may be a biexponential axis.
- the display of the 3D stereoscopic image to the display unit 142 may be performed by arbitrarily rotating or scaling up or down on the basis of an input signal of the user from the input unit 141 (mouse 41, keyboard 42, or the like).
- the 3D stereoscopic image is rotated, as shown in Fig. 3 , it is preferable that the coordinate axes are displayed on each side of the 3D configuration (cube in the figure) that forms the coordinate space 6.
- the 3D configuration of the coordinate space 6 becomes clear because of these coordinate axes, so a change of the direction of the 3D distribution chart at the time when the 3D stereoscopic image is rotated is easily recognized.
- the 3D stereoscopic image displayed on the display 43 may be rotated optionally by an input from a user or may be always rotated slowly in a certain direction or in an uncertain direction.
- the stereoscopic effect can be increased as compared to the display with a still image.
- the 3D stereoscopic image displayed on the display 43 is automatically rotated up to a direction such that the stereoscopic observation image from a coordinate axis direction selected by a user is provided on the basis of an input signal of the user at any timing during a rotation operation by the user or an automatic rotation.
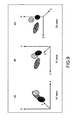
- Fig. 9 the stereoscopic observation images of the 3D distribution charts from the respective coordinate axes are shown.
- (A), (B), and (C) of Fig. 9 indicate observation images from a Z-axis direction, an X-axis direction, and a Y-axis direction, respectively.
- the switching of the viewpoint from the respective coordinate axes may be set so that the image is rotated at a viewpoint in the Z-axis direction by an input of Z key with the keyboard 42, and the image is rotated at a viewpoint from the Z-axis direction to the X-axis direction by an input of X key, for example. Further, the switching of the viewpoint from the respective coordinate axes may be performed by clicking an icon displayed on the display 43 with the mouse 41, for example. In this way, with the simple inputs, the viewpoint from the coordinate axes is switched, thereby making it possible to observe the 3D stereoscopic image, with the result that the user easily grasps the characteristic distribution of the microparticles in the 3D distribution chart.
- the 3D stereoscopic image be rotated so as to maintain a vertical direction of the 3D distribution chart. That is, it is preferable that the 3D stereoscopic image is rotated with any one selected from among an XY plane, a YZ plane, and a ZX plane of the 3D distribution chart is always directed downwards in the distribution chart. Specifically, for example, in the case where the 3D stereoscopic image shown in (A) of Fig. 9 is always rotated, the image is rotated so that the ZX plane is always disposed on the bottom surface of the 3D distribution chart.
- the image may be rotated while tilting the rotation axis of the 3D distribution chart or changing a tilted angle thereof.
- the image may be rotated while tilting the rotation axis of the 3D distribution chart or changing a tilted angle thereof.
- the 3D stereoscopic image displayed on the display 43 may be displayed with such a moving image that the graphics corresponding to the microparticles are swung.
- graphics observed forward are swung more intensely.
- a conceptual diagram of the stereoscopic images of the graphics to which the swinging operation is given is shown in Fig. 10 .
- the graphics 71 and 72 are swung rightward and leftward as indicated by the arrows in the figure, and a rightward and leftward swinging range is larger for the graphic 71 observed forward and smaller for the graphic 72 observed backward.
- the graphic observed forward is displayed in the more intensely swinging manner, with the result that the depth is given to the stereoscopic image of the 3D stereoscopic image, and the stereoscopic effect can be increased.
- the graphics corresponding to the microparticles may be displayed in a blinked manner.
- the graphics observed forward at the time of the stereoscopic viewing in a more frequently blinked manner than the graphics observed backward, it is possible to further increase the stereoscopic effect of the 3D stereoscopic image.
- the measurement data 32 includes measurement values at the plurality of time points
- the association or dissociation of the cell-surface molecular complexes is measured as described above, it is possible to confirm a change with time in the association or the like of the cell-surface molecular complexes on the moving image.
- the 3D data analysis apparatus is devised to increase the stereoscopic effect of the 3D stereoscopic image displayed. Therefore, even in the case of the 3D distribution chart constituted of only points (graphics corresponding to the microparticles) and lines (coordinate axes), it is possible for a user to analyze the measurement data while preferably visually confirming the stereoscopic image and easily and instinctively specify the microparticles and the microparticle small population to be analyzed on the distribution chart.
- a 3D data analysis program causes a computer to execute a step of calculating the positions and the graphics in the coordinate space with the three kinds of variables selected from the measurement data of the microparticles being the coordinate axes and creating the 3D stereoscopic image that represents the characteristic distribution of the microparticles and a step of displaying the 3D stereoscopic image.
- the 3D data analysis program is stored and held in the hard disk 30 (see, reference numeral 31 in the figure).
- the 3D data analysis program is read in the memory 20 under the control of the operating system (OS) 33 and executes a creation process of the 3D stereoscopic image of the 3D distribution chart in the data processing unit 120 and a display process of the 3D stereoscopic image on the display unit 142.
- OS operating system
- the 3D data analysis program can be recorded in a computer-readable recording medium.
- the recording medium is computer-readable, the recording medium is not particularly limited.
- a disk-type recording medium such as a flexible disk and a CD-ROM is used.
- a tape type recording medium such as a magnetic tape may be used.
- the 3D data analysis apparatus By the 3D data analysis apparatus according to the present invention, it is possible to easily and instinctively specifying the microparticles and the microparticle small populations to be analyzed without referring to a lot of histograms or cytograms or imaging the 3D distribution chart. Therefore, the 3D data analysis apparatus according to the present invention is used along with a flow cytometer, for example, and is usable to easily analyze characteristics of cells or microbes with high accuracy in the fields of medicine, public health, drug discovery, and the like.
Abstract
Description
- The present invention relates to a 3D data analysis apparatus, a 3D data analysis method, and a 3D data analysis program. More specifically, the present invention relates to a 3D data analysis apparatus and the like for displaying measurement data of microparticles with a 3D stereoscopic image.
- To analyze microparticles including biologically relevant particles such as cells, microbes, and liposomes and synthetic particles such as latex particles, gel particles, and particles for industrial use, a microparticle measurement apparatus is used which introduces a dispersion liquid of microparticles in a flow channel and measures the microparticles optically, electrically, or magnetically.
- As an example, there is a particle analyzer that distinguishes synthetic particles on the basis of sizes or shapes. Examples of a parameter (variable) which can be measured by the particle analyzer include an elemental composition and a particle diameter of a microparticle.
- Further, to analyze biologically relevant particles, a flow cytometer (flow cytometry) is used. Examples of a parameter which can be measured by the flow cytometer include forward scattered light (FS), side scatter (SS), fluorescent light (FL), and impedance of microparticles. The forward scattered light (FS), the side scatter (SS), and the fluorescent light (FL) are used as parameters that indicate an optical characteristic of a cell or a microbe (hereinafter, simply referred to as "cell"), and the impedance is used as a parameter that indicates an electrical characteristic of a cell.
- Specifically, first, the forward scattered light is light that is scattered at a small angle in a forward direction with respect to an axis of laser light and includes scattered light, diffracted light, and refracted light of laser light which is generated on a surface of a cell. The forward scattered light is mainly used as a parameter that indicates the size of a cell. Next, the side scatter is light that is scattered at approximately 90 degrees with respect to an axis of laser light and is scattered light of laser light that is generated in a granule or a core inside a cell. The side scatter is mainly used as a parameter that indicates an internal structure of a cell. Further, the fluorescent light is light that is generated from a fluorochrome labeled to a cell and is used as a parameter that indicates existence or nonexistence of a cell surface antigen recognized by a fluorochrome-labeled antibody, the amount of a nucleic acid to which a fluorochrome is combined, or the like. Furthermore, the impedance is measured by an electrical resistance method and used as a parameter that indicates a cell volume.
- To analyze measurement data in a flow cytometer, a data analysis apparatus is used in which measurement values of cells are plotted with these measurement parameters being as axes, thereby creating a diagram that shows a characteristic distribution of the cells in a cell population. A one-dimensional distribution chart with the use of one measurement parameter is called as a histogram, which is created with an X axis indicating the measurement parameter, and a Y axis indicating the number of cells (count). Further, a two-dimensional distribution chart in which two measurement parameters are used is called as a cytogram, which is created by plotting cells on the basis of the measurement values in a coordinate plane with the X axis indicating one measurement parameter and the Y axis indicating the other measurement parameter.
- The cell population as a sample includes unnecessary cells not to be analyzed, so the analysis of the measurement data is performed after a cell small population to be analyzed is selected from the cell population as the sample. The cell small population to be analyzed is selected by specifying an area in which the cell small population exists on the histogram or the cytogram. This operation is called as "gating" because cells as targets are enclosed in an area specified on the histogram or the cytogram.
- On the histogram with one measurement parameter as an axis or on the cytogram with one combined measurement parameter as axes, the cell small population to be analyzed and unnecessary cells may exist in an overlapped area in some cases. For example, when a lymphocyte is analyzed with human peripheral blood as a sample, on a cytogram with a forward scattered light (FS) and a side scatter (SS) used for axes, a part of monocyte exists in the same area as the lymphocyte in some cases. Therefore, when performing gating, a user has to specify an area in which only lymphocyte exists so as not to enclose the monocyte.
- In order to specify an area so that only a cell small population to be analyzed is enclosed without enclosing unnecessary cells, conventionally, a user has to perform gating while referring to a plurality of histograms or cytograms. Along with improvement of the performance of a flow cytometer, the number of parameters that can be measured is increased, so the user has to refer to more histograms or cytograms. Further, at this time, the user is requested to perform a gating operation while imaging a three-dimensional distribution chart (3D distribution chart) in which two cytograms are combined.
- To assist the user in performing the gating operation,
Patent Document 1 proposes "an analysis apparatus including a measurement data obtaining means for obtaining first, second, and third measurement data items from an analyte, a 3D distribution chart creating means for creating a 3D distribution chart that indicates a distribution of formed elements contained in the analyte with the first, second, and third measurement data items as axes, an area setting means for variably setting a separate area on the 3D distribution chart, and a reference distribution chart creating means for creating, with respect to formed elements that belongs to the separate area set by the area setting means, at least one of a 2D distribution chart with the first and second measurement data items used as the axes and a frequency distribution chart with the first measurement data item used as the axis" (see, claim 9 of Patent Document 1). By the analysis apparatus, it is possible to set the separate area on the 3D distribution chart while referring to the 2D distribution chart (cytogram) and the frequency distribution chart (histogram) displayed along with the 3D distribution chart. It should be noted that the 3D distribution chart of the analysis apparatus is not viewed stereoscopically but is displayed two-dimensionally on a display. - In relation to the present invention, twin-lens stereo image technology (3D stereoscopic image technology) will be described. In the twin-lens stereo image, first, two images when an object is viewed with a right eye and a left eye are prepared. Then, these images are displayed at the same time, and an image for the right eye is presented only to the right eye, and an image for the left eye is presented only to the left eye. As a result, an image that appears in the eyes at a time when the object is viewed in a 3D space is reproduced, and a user is caused to stereoscopically view the object.
- For a 3D display which allows a stereoscopic view, a (a) glasses type, a (b) glasses-free type, and a (c) viewer type are mainly adopted. The (a) glasses type includes an anaglyph type, a polarization filter type, and a time-sharing type. Further, the (b) glasses-free type includes a parallax barrier type and a lenticular type, and the (c) viewer type includes a stereoscope type and a head mount type.
- Patent Document 1: Japanese Patent Application Laid-open No.
2006-17497 - As described above, conventionally, in the data analysis apparatus used for the flow cytometer, at the time of gating, it is necessary for a user to specify the position of a cell small population to be analyzed on a distribution chart while referring to a large number of histograms or cytograms or imaging a three-dimensional distribution chart obtained by combining two cytograms (3D distribution chart).
- In view of the above, it is an object of the present invention to provide a data analysis apparatus capable of easily and instinctively specifying microparticles and microparticle small populations to be analyzed on a distribution chart without referring to a large number of histograms or cytograms or imaging a 3D distribution chart.
- To solve the above-mentioned problem, the present invention provides a 3D data analysis apparatus including a data storage unit to store measurement data of microparticles, an input unit to select three kinds of variables independent of the measurement data, a data processing unit to calculate positions and graphics in a coordinate space with the three kinds of variables being coordinate axes and create a 3D stereoscopic image that represents a characteristic distribution of the microparticles, and a display unit to display the 3D stereoscopic image.
By the 3D data analysis apparatus, it is possible to analyze the measurement data while stereoscopically viewing the 3D distribution chart with the arbitrarily selected three kinds of parameters being the coordinate axes. - Further, the present invention also provides a 3D data analysis method including the steps of selecting three kinds of variables independent of measurement data of microparticles, calculating positions and graphics in a coordinate space with the three kinds of variables being coordinate axes and creating a 3D stereoscopic image that represents a characteristic distribution of the microparticles, and displaying the 3D stereoscopic image. Furthermore, the resent invention also provides a 3D data analysis program causing a computer to execute the steps of calculating positions and graphics in a coordinate space with three kinds of independent variables selected from measurement data of microparticles being coordinate axes and creating a 3D stereoscopic image that represents a characteristic distribution of the microparticles, and displaying the 3D stereoscopic image.
- In the present invention, the "microparticles" widely include biologically relevant particles such as cells, microbes, and liposomes, synthetic particles such as latex particles, gel particles, and particles for industrial use, and the like.
The cells include animal cells (hematopoietic cells or the like) and plant cells. The microbes include bacteria such as coli bacilli, viruses such as tobacco mosaic viruses, and fungi such as yeast. The biologically relevant particles include chromosomes, liposomes, mitochondrion, organelle (cell organelle), and the like that form various cells. Further, the biologically relevant particles can include biologically relevant polymer such as nucleic acids, proteins, and complexes of these. The particles for industrial use may be organic or inorganic polymeric materials, metal, or the like. The organic polymeric materials include polystyrene, styrenedivinylbenzene, polymethyl methacrylate, and the like. The inorganic polymeric materials include glass, silica, magnetic materials, and the like. The metal include gold colloid, aluminum, and the like. These microparticles generally have spherical forms but may be non-spherical forms. Further, the sizes, masses, and the like of these microparticles are also not limited particularly. - According to the present invention, the data analysis apparatus is provided which is capable of easily and instinctively specifying microparticles and microparticle small populations to be analyzed without referring to a large number of histograms or cytograms or imaging a 3D distribution chart.
-
- [
Fig. 1] Fig. 1 is a block diagram for explaining the structure of a 3D analysis apparatus according to the present invention, which is provided contiguously with a flow cytometer. - [
Fig. 2] Fig. 2 is a block diagram for explaining the functional structure of the 3D analysis apparatus according to the present invention. - [
Fig. 3] Fig. 3 is a schematic diagram for explaining a 3D distribution chart displayed by the 3D data analysis apparatus according to the present invention. - [
Fig. 4] Fig. 4 is a schematic diagram for explaining a twin-lens stereo image (3D stereoscopic image) displayed by the 3D data analysis apparatus according to the present invention. - [
Fig. 5] Fig. 5 is a schematic diagram for explaining shapes of graphics corresponding microparticles in the 3D stereoscopic image. - [
Fig. 6] Fig. 6 is a conceptual diagram for explaining a stereoscopic observation image of a graphic which is subjected to a shade process. - [
Fig. 7] Fig. 7 is a schematic diagram for explaining a method of processing the shade process. - [
Fig. 8] Fig. 8 is a conceptual diagram for explaining a stereoscopic observation image of coordinate axes. - [
Fig. 9] Fig. 9 is a conceptual diagram for explaining the stereoscopic observation images in the 3D distribution charts from the respective coordinate axes. - [
Fig. 10] Fig. 10 is a conceptual diagram for explaining a stereoscopic observation image of a moving image obtained by swinging a graphic corresponding to the microparticle. - Hereinafter, preferred embodiments for carrying out the present invention will be described with reference to the drawings. It should be noted that the embodiments to be described below are an example of a representative embodiment of the present invention, so the scope of the present invention is not interpreted narrowly because of the embodiments. It should be noted that the description will be given in the following order.
- 1. Structure of 3D data analysis apparatus
- 2. Display of 3D stereoscopic image
- 3. Characteristics of 3D stereoscopic image
- (3-1) shape of graphic
- (3-2) shade process for graphic
- (3-3) coordinate axis
- (3-4) moving image
- 4. 3D data analysis program
-
Fig. 1 shows the structure of a 3D data analysis apparatus according to the present invention. Here, shown is an embodiment in which the 3D data analysis apparatus is provided contiguously with a microparticle measurement apparatus, thereby constituting a microparticle analysis system. Further,Fig. 2 shows the functional structure of the microparticle analysis system. Hereinafter, an example in which a flow cytometer is used as the microparticle measurement apparatus will be described. - The 3D data analysis apparatus denoted by
reference numeral 1 in the figure constitutes amicroparticle analysis system 3 by being connected to aflow cytometer 2 with acommunication cable 4. The 3Ddata analysis apparatus 1 includes a central processing unit (CPU) 10, amemory 20, ahard disk 30, a user interface, and the like. In thehard disk 30, a 3Ddata analysis program 31,measurement data 32 of microparticles, an operating system (OS) 33, and the like are stored and held. The user interface includes amouse 41, akeyboard 42, and the like which receive an input of information from a user and adisplay 43, aprinter 44, and the like which output information to the user. It should be noted that an input device such as a stick controller and a pen tablet may be provided, instead of themouse 41 and thekeyboard 42 or along with these devices. - A data storage unit 130 (hard disk 30) stores the
measurement data 32 of the microparticles (cells) which is output from theflow cytometer 2. The measurement data output from an input andoutput interface 250 of theflow cytometer 2 is input to an input andoutput interface 150 of the 3Ddata analysis apparatus 1 through thecommunication cable 4 and stored in a data storage unit 30 (hard disk 30). - The
measurement data 32 is processed in adata processing unit 120. Thedata processing unit 120 starts the processing upon reception of an input from an input unit 141 (mouse 41,keyboard 42, or the like) by a user. That is, when the user selects and inputs three kinds of variables (parameters) independent of themeasurement data 32, thedata processing unit 120 creates a 3D distribution chart that represents a characteristic distribution of microparticles with the parameters selected being as the coordinate axes. The 3D distribution chart is created by plotting the microparticles in the coordinate space with the parameters selected being as the coordinate axes. The plotting of the microparticles are performed by calculating positions and a graphic in the coordinate space of the microparticles from measurement values of the parameters selected and drawing the graphic calculated on the position calculated. - Here, the "parameters independent" refer to parameters which are selected from the forward scattered light (FS), the side scatter (SS), the fluorescent light (FL), the impedance, and the like of the microparticles and are different from each other. The fluorescent light (FL) can be dealt as a parameter different for each wavelength of fluorochrome labeled to the microparticles and represented by FL1, FL2 to FLn (n: 3 or more integer), or the like. As the three kinds of parameters independent, a combination of the forward scattered light (FS), the side scatter (SS), and the fluorescent light (FL1) or a combination of the forward scattered light (FS), the side scatter (SS), and the impedance are given as examples. In addition, the three kinds of parameters independent can be a combination arbitrarily selected from the measurement data.
- The 3D distribution chart created by the
data processing unit 120 is displayed as a 3D stereoscopic image on a display unit 142 (display 43). One or two or more 3D stereoscopic images can be displayed on thedisplay unit 142. In the case where the two or more 3D stereoscopic images are displayed, 3D stereoscopic images obtained by observing the same 3D distribution chart in a plurality of different directions may be displayed, or 3D stereoscopic images of a plurality of 3D distribution charts may be displayed with at least one of three kinds of parameters selected being different. The 3D stereoscopic images are twin-lens stereo images to be described in detail in the following. - Further, in the case where the
measurement data 32 includes measurement values at a plurality of different time points, thedisplay unit 142 may display a 3D distribution chart that represents a characteristic distribution of microparticles at the plurality of time points with a 3D stereoscopic image. Examples of the measurement data that includes measurement values at a plurality of time points include data obtained by measuring association or dissociation of cell-surface molecular complexes with time with the use of the fluorescence resonance energy transfer (FRET), data obtained by measuring a change of a cell membrane with time with the use of fluorochrome the fluorescence wavelength of which varies depending on a charge of the cell membrane, data obtained by measuring the intensity of expression of a cell-surface molecule by being correlated with an inflow response of intracellular calcium, and the like. - The 3D stereoscopic images of the 3D distribution chart at the plurality of time points may be displayed in a row at the same time or may be switched and displayed one by one. In the case where the switching display of the 3D stereoscopic display is performed, the switching may be automatically performed or may be performed on the basis of an input signal of a user. By displaying the 3D stereoscopic images of the 3D distribution chart at the plurality of time points, it is possible for a user to analyze the data while confirming a change with time in the characteristic distribution of the microparticles, and a multifactorial analysis can be performed as compared to the case where time (temporal axis) is added to three kinds of parameters (coordinate axes).
- The display of the 3D stereoscopic image on the
display unit 142 may be performed by arbitrarily rotating or scaling up or down on the basis of an input signal of a user from the input unit 141 (mouse 41,keyboard 42, or the like). Further, in the case where a separate area for gating is set in a coordinate space of the 3D distribution chart on the basis of the input signal from theinput unit 141, the 3D stereoscopic image is rotated or scaled up or down along with a 3D shape that represents the separate area displayed in the 3D stereoscopic image. - The
flow cytometer 2 can have the same structure as the conventionally known apparatus or can be configured by appropriately modifying this, specifically, is constituted of acontrol unit 210, aflow system 220, adetection system 230, an input andoutput interface 250, and the like. - In a flow channel formed in a flow cell or micro chip, the
flow system 200 causes a laminar flow of a sample liquid containing the microparticles to flow to the center of a laminar flow of a sheath liquid to arrange the microparticles in the laminar flow in a row. Thedetection system 230 obtains a parameter value that indicates the characteristic of the microparticles that are flown through the flow channel. Specifically, anoptical detection unit 231 irradiates the microparticles flown with light, detects scattered light, fluorescent light, or the like generated from the microparticles, and obtains the intensity thereof. Theoptical detection unit 231 includes a laser light source, lens, a mirror, a filter, an area image pickup element such as a CCD and a CMOS element, a PMT (photo multiplier tube), or the like. Further, anelectrical detection unit 232 includes an electrode provided so as to be opposed to the microparticles flown, and obtains an impedance, a capacitance value, an inductance, and the like of the microparticles. Theflow cytometer 2 may be provided with asorting system 240 for sorting the microparticles which are determined to have a desired characteristic as a result of the analysis. For thesorting system 240, for example, it is possible to adopt a system of ejecting a droplet containing the microparticles to a space outside the flow cell and controlling a moving direction of the droplet, thereby collecting only desired microparticles into a container. - The measurement values of the intensities of the scattered light, the fluorescent light, and the like detected in the
detection system 230 or the measurement values of the impedance, the capacitance value, the inductance, and the like are converted into electrical signals and output from the input andoutput interface 250 as the measurement data. -
Fig. 3 schematically shows a 3D distribution chart displayed by the 3D data analysis apparatus according to the present invention. The 3D distribution chart is displayed as a 3D stereoscopic image on thedisplay unit 142 and can be stereoscopically visually confirmed by a user. - A
3D distribution chart 5 shows a characteristic distribution of the microparticles in a coordinatespace 6 with the three kinds of parameters selected by a user being as the coordinate axes. In the3D distribution chart 5, at positions calculated from the measurement values of the parameters selected,graphics 7 corresponding to the respective microparticles are drawn. - In the figure, the case where the three kinds of parameters are a combination of the forward scattered light (FS-Lin: X axis), the side scatter (SS-Lin: Y axis), and a first fluorescent light (FL1-Lin: Z axis) is given as an example. The parameters used for the respective coordinate axes can be a combination selected arbitrarily. For example, the first fluorescent light (FL1), a second fluorescent light (FL2), and an impedance can be used for the X axis, the Y axis, and the Z axis, respectively.
- The 3D stereoscopic display of the 3D distribution chart is performed with a twin-lens stereo image.
Fig. 4 schematically shows a twin-lens stereo image displayed by the 3D data analysis apparatus according to the present invention. - When a user selects the parameters, the
data processing unit 120 creates the3D distribution chart 5 and creates an image at a time when the distribution chart is viewed with the left eye (left-eye image 5L) and an image when viewed with the right eye (right-eye image 5R). The display unit 142 (display 43) displays the left-eye image 5L and the right-eye image 5R at the same time, and separate presentation is performed so that the left-eye image 5L is presented only to the left eye, and the right-eye image 5R presented only to the right eye. - For example, in a time-division system, which is one of the glasses type, the separation presentation can be performed by alternately displaying the left-
eye image 5L and the right-eye image 5R with a minute time difference and causingshutter glasses 8 to be synthesized with this. In addition, for the separation distribution, another glasses type such as an anaglyph type and a polarization filter type, the glasses-free type such as a parallax barrier type and a lenticular type, and the viewer type such as a stereoscope type and a head mount type may be used. - By performing the separation presentation of the left-
eye image 5L and the right-eye image 5R, thedisplay 43 reproduces an image seen in the eyes at the time when the 3D distribution chart is viewed in the 3D space and causes a user to stereoscopically view the distribution chart. - As described above, in the 3D
data analysis apparatus 1, it is possible for a user to analyze the measurement data while stereoscopically viewing the 3D distribution chart with the arbitrarily selected three kinds of parameters being as the coordinate axes. Therefore, in the 3Ddata analysis apparatus 1, it is possible to easily and instinctively specify the microparticles and microparticle small populations to be analyzed on the distribution chart, so it is unnecessary to refer to a lot of histograms or cytograms or imaging the 3D distribution chart as in the conventional way. In addition, the parameters used for the coordinate axes are arbitrarily combined to display the 3D distribution chart, with the result that it is possible to obtain information relating to the three characteristics of the microparticles with one graph. Further, by displaying the 3D stereoscopic image obtained by observing the same 3D distribution chart in a plurality of different directions or displaying the 3D stereoscopic images of a plurality of 3D distribution charts with at least one of three kinds of parameters selected being different, it is possible to obtain more pieces of information. Thus, in the3D analysis apparatus 1, it is possible to perform an efficient analysis by reducing the number of graphs to be referred to as compared to the display with conventional histograms or cytograms. - Hereinafter, the characteristics of the 3D stereoscopic image displayed by the 3D data analysis apparatus according to the present invention will be described in order.
- The graphics corresponding to the microparticles, which are each denoted by the
reference numeral 7 inFig. 3 , are calculated as polyhedrons constituted of polygons each having a predetermined shape and displayed in the 3D stereoscopic image. As described above, on the basis of the measurement values of the parameters selected by a user, thedata processing unit 120 calculates the positions and thegraphics 7 of the microparticles in the coordinate space and creates the 3D distribution chart. At this time, by calculating the graphic 7 as the polyhedron constituted of the polygons having the predetermined shape, it is possible to reduce a calculation load in thedata processing unit 120. Further, by displaying, in the 3D stereoscopic image, the graphic 7 as the polyhedron constituted of the polygons having the predetermined shape, it is possible to increase the stereoscopic effect of an image when the image is stereoscopically viewed. - As the polyhedron constituted of the polygons having the predetermined shape, for example, a hexahedron constituted of six triangular polygons as shown in (A) of
Fig. 5 or an octahedron constituted of eight polygons as shown in (B) ofFig. 5 can be employed. The shapes of the graphic 7 are not particularly limited as long as a polyhedron constituted of polygons each having a predetermined shape is provided. In a viewpoint of the stereoscopic effect and the reduction of the calculation load, the hexahedron or the octahedron is preferable. - In the 3D stereoscopic image, the
graphics 7 observed forward when stereoscopically viewed are indicated with increased shading, and thegraphics 7 observed backward are indicated with decreased shading. In this way, a process of changing the shading of thegraphics 7 is referred to as a "shade process" hereinafter. - A conceptual diagram of a stereoscopic observation image (hereinafter, simply referred to as "stereoscopic image") of the graphic 7 which has been subjected to the shade process is shown in
Fig. 6 . Toward a direction of the arrow in the figure, thegraphics 7 observed forward are darker, and thegraphics 7 observed backward are lighter. In this way, by performing the shade process for thegraphics 7, a depth is given to the stereoscopic image of the 3D stereoscopic image, and the stereoscopic effect can be increased. - With reference to
Fig. 7 , the method of shade process will be described. On thedisplay 43, a left-eye image and a right-eye image are displayed at the same time, and the left-eye image and the right-eye image of a graphic 70 observed at a position on a screen of thedisplay 43 when stereoscopically viewed are displayed in a superimposed manner (see, (B) ofFig. 7 ). - In the case where the left-eye image displayed on the
display 43 is positioned rightward as compared to the right-eye image (see, (A) ofFig. 7 ), the graphic is stereoscopically viewed forward as compared to the position on the screen of thedisplay 43. The stereoscopic image of the graphic observed in a pop-up manner from the screen position is denoted by thereference numeral 71 in the figure, and the left-eye image and the right-eye image of the graphic 71 displayed on thedisplay 43 are denoted by thesymbols display 43 is positioned leftward as compared to the right-eye image (see, (C) ofFig. 7 ), the graphic is stereoscopically viewed backward from the position on the screen of thedisplay 43. The stereoscopic image of the graphic observed in a pop-up manner from the screen position is denoted by thereference numeral 72, and the left-eye image and the right-eye image of the graphic 71 displayed on thedisplay 43 are denoted by thesymbols - In the shade process, the left-
eye image 71L and the right-eye image 71R of the graphic 71 observed forward are displayed to be darker, and the left-eye image 72L and the right-eye image 72R of the graphic 72 observed backward are displayed to be lighter. - In the 3D stereoscopic image, the coordinate axis is displayed to be thicker as a part observed forward when the stereoscopic viewing is performed, and the coordinate axis is displayed to be thinner as a part observed backward. A conceptual diagram of a stereoscopic image of the coordinate axis having a varied thickness is shown in
Fig. 8 . In this way, by changing the thickness of the coordinate axis, it is possible to increase the stereoscopic effect by giving a depth to the stereoscopic image of the 3D stereoscopic image. - Further, as shown in
Fig. 8 , scale intervals of the coordinate axis are set to be wider as a part observed forward when the stereoscopic viewing is performed, and the scale intervals thereof are set to be narrower as a part observed backward, with the result that a further depth can be given to the stereoscopic image. Furthermore, the name of the coordinate axis (SS-Lin in the figure) and the characters of the scale values (200, 400, 600, 800, 1000, in the figure) are displayed to be larger toward the front and displayed to be smaller toward the back, with the result that the same effect is obtained. It should be noted that the process of changing the thickness of the coordinate axis, the size of the scale intervals, and the size of the characters can also be performed through an application of the shade process described above. - The coordinate axes may be a biexponential axis having characteristics of a linear axis and a logarithmic axis in combination. The detail of the biexponential axis is described in "A New "Logicle" Display Method Avoids Deceptive Effects of Logarithmic Scaling for Low Signals and Compensated Data. Cytometry part A 69A: 541-551, 2006", for example.
- In the biexponential axis, with respect to such data that a measurement value of a parameter selected as a coordinate axis is smaller than a predetermined value, a function the main function element of which is a linear function is applied, thereby obtaining the positions of the
graphics 7 corresponding to the microparticles. Further, with respect to such data that a measurement value is larger than the predetermined value, a function the main function element of which is a logarithmic function is applied, thereby obtaining the positions of thegraphics 7. More simply, the biexponential axis can be set so that an area larger than the predetermined area is a logarithmic axis, and an area smaller than the predetermined area is a linear axis. By using the biexponential axis for the coordinate axes of the 3D distribution chart, it is possible to perform displaying at a wider dynamic range for which the characteristics of the logarithmic axis are used, and at the same time, to perform displaying with negative numbers because of the characteristics of the linear axis. It should be noted that at least one of the coordinate axes of the 3D distribution chart may be a biexponential axis. - As described above, the display of the 3D stereoscopic image to the display unit 142 (display 43) may be performed by arbitrarily rotating or scaling up or down on the basis of an input signal of the user from the input unit 141 (
mouse 41,keyboard 42, or the like). When the 3D stereoscopic image is rotated, as shown inFig. 3 , it is preferable that the coordinate axes are displayed on each side of the 3D configuration (cube in the figure) that forms the coordinatespace 6. The 3D configuration of the coordinatespace 6 becomes clear because of these coordinate axes, so a change of the direction of the 3D distribution chart at the time when the 3D stereoscopic image is rotated is easily recognized. - The 3D stereoscopic image displayed on the
display 43 may be rotated optionally by an input from a user or may be always rotated slowly in a certain direction or in an uncertain direction. By displaying the 3D stereoscopic image as a moving image that is always rotated, the stereoscopic effect can be increased as compared to the display with a still image. - Further, the 3D stereoscopic image displayed on the
display 43 is automatically rotated up to a direction such that the stereoscopic observation image from a coordinate axis direction selected by a user is provided on the basis of an input signal of the user at any timing during a rotation operation by the user or an automatic rotation. InFig. 9 , the stereoscopic observation images of the 3D distribution charts from the respective coordinate axes are shown. (A), (B), and (C) ofFig. 9 indicate observation images from a Z-axis direction, an X-axis direction, and a Y-axis direction, respectively. The switching of the viewpoint from the respective coordinate axes may be set so that the image is rotated at a viewpoint in the Z-axis direction by an input of Z key with thekeyboard 42, and the image is rotated at a viewpoint from the Z-axis direction to the X-axis direction by an input of X key, for example. Further, the switching of the viewpoint from the respective coordinate axes may be performed by clicking an icon displayed on thedisplay 43 with themouse 41, for example. In this way, with the simple inputs, the viewpoint from the coordinate axes is switched, thereby making it possible to observe the 3D stereoscopic image, with the result that the user easily grasps the characteristic distribution of the microparticles in the 3D distribution chart. - It should be noted that in the case where the 3D stereoscopic image is always rotated and displayed on the
display 43, it is preferable that the 3D stereoscopic image be rotated so as to maintain a vertical direction of the 3D distribution chart. That is, it is preferable that the 3D stereoscopic image is rotated with any one selected from among an XY plane, a YZ plane, and a ZX plane of the 3D distribution chart is always directed downwards in the distribution chart. Specifically, for example, in the case where the 3D stereoscopic image shown in (A) ofFig. 9 is always rotated, the image is rotated so that the ZX plane is always disposed on the bottom surface of the 3D distribution chart. At this time, the image may be rotated while tilting the rotation axis of the 3D distribution chart or changing a tilted angle thereof. In this way, by imposing a certain restriction on the rotation direction of the 3D stereoscopic image, the user more easily perceives a viewpoint direction of the user with respect to the 3D distribution chart, with the result that it is possible to prevents the case where the user cannot grasp the direction of the 3D distribution chart. - The 3D stereoscopic image displayed on the
display 43 may be displayed with such a moving image that the graphics corresponding to the microparticles are swung. At this time, as compared to graphics observed backward when the stereoscopic viewing is performed, graphics observed forward are swung more intensely. A conceptual diagram of the stereoscopic images of the graphics to which the swinging operation is given is shown inFig. 10 . Thegraphics - Further, in the case where the 3D stereoscopic image is displayed with a moving image, the graphics corresponding to the microparticles may be displayed in a blinked manner. At this time, by displaying the graphics observed forward at the time of the stereoscopic viewing in a more frequently blinked manner than the graphics observed backward, it is possible to further increase the stereoscopic effect of the 3D stereoscopic image.
- Furthermore, in the case where the
measurement data 32 includes measurement values at the plurality of time points, it is possible to display the 3D stereoscopic image of the 3D distribution chart at the time points with a moving image. As a result, in the example in which the association or dissociation of the cell-surface molecular complexes is measured as described above, it is possible to confirm a change with time in the association or the like of the cell-surface molecular complexes on the moving image. - As described above, the 3D data analysis apparatus according to the present invention is devised to increase the stereoscopic effect of the 3D stereoscopic image displayed. Therefore, even in the case of the 3D distribution chart constituted of only points (graphics corresponding to the microparticles) and lines (coordinate axes), it is possible for a user to analyze the measurement data while preferably visually confirming the stereoscopic image and easily and instinctively specify the microparticles and the microparticle small population to be analyzed on the distribution chart.
- A 3D data analysis program according to the present invention causes a computer to execute a step of calculating the positions and the graphics in the coordinate space with the three kinds of variables selected from the measurement data of the microparticles being the coordinate axes and creating the 3D stereoscopic image that represents the characteristic distribution of the microparticles and a step of displaying the 3D stereoscopic image.
- A description will be given on the basis of the above embodiment with reference to
Figs. 1 and2 again. The 3D data analysis program is stored and held in the hard disk 30 (see,reference numeral 31 in the figure). The 3D data analysis program is read in thememory 20 under the control of the operating system (OS) 33 and executes a creation process of the 3D stereoscopic image of the 3D distribution chart in thedata processing unit 120 and a display process of the 3D stereoscopic image on thedisplay unit 142. - The 3D data analysis program can be recorded in a computer-readable recording medium. As long as the recording medium is computer-readable, the recording medium is not particularly limited. For example, a disk-type recording medium such as a flexible disk and a CD-ROM is used. Further, a tape type recording medium such as a magnetic tape may be used.
- By the 3D data analysis apparatus according to the present invention, it is possible to easily and instinctively specifying the microparticles and the microparticle small populations to be analyzed without referring to a lot of histograms or cytograms or imaging the 3D distribution chart. Therefore, the 3D data analysis apparatus according to the present invention is used along with a flow cytometer, for example, and is usable to easily analyze characteristics of cells or microbes with high accuracy in the fields of medicine, public health, drug discovery, and the like.
-
- 1: 3D data analysis apparatus
- 10: central processing unit
- 110: control unit
- 120: data processing unit
- 130: data storage unit
- 141: input unit
- 142: display unit
- 150: input and output interface
- 2: flow cytometer
- 210: control unit
- 220: flow system
- 230: detection system
- 231: optical detection unit
- 232: electrical detection unit
- 240: sorting system
- 250: input and output interface
- 3: microparticle analysis system
- 30: hard disk
- 31: 3D data analysis program
- 32: measurement data
- 33: operating system
- 4: communication cable
- 41: mouse
- 42: keyboard
- 43: display
- 44: printer
- 5: 3D distribution chart
- 6: coordinate space
- 7: graphic
- 8: shutter glasses
Claims (14)
- A 3D data analysis apparatus, comprising:a data storage unit to store measurement data of microparticles;an input unit to select three kinds of variables independent of the measurement data;a data processing unit to calculate positions and graphics in a coordinate space with the three kinds of variables being coordinate axes and create a 3D stereoscopic image that represents a characteristic distribution of the microparticles; anda display unit to display the 3D stereoscopic image.
- The 3D data analysis apparatus according to claim 1, wherein
the display unit displays the 3D stereoscopic image by rotating and scaling up and down the 3D stereoscopic image on the basis of an input signal from the input unit. - The 3D data analysis apparatus according to claim 2, making it possible to perform a stereoscopic image observation of the 3D stereoscopic image from a coordinate axis direction arbitrarily selected by rotating the 3D stereoscopic image in the display unit on the basis of the input signal from the input unit.
- The 3D data analysis apparatus according to claim 3, wherein
the graphics are polyhedrons each constituted of polygons having a predetermined shape. - The 3D data analysis apparatus according to claim 4, wherein
in the 3D stereoscopic image, the graphics that are observed forward at a time of the stereoscopic image observation of the 3D stereoscopic image are displayed to be darker, and the graphics that are observed backward are displayed to be lighter. - The 3D data analysis apparatus according to claim 5, wherein
in the 3D stereoscopic image, the coordinate axes are displayed on respective sides of a 3D shape that forms the coordinate space. - The 3D data analysis apparatus according to claim 6, wherein
in the 3D stereoscopic image, a part of the coordinate axes which is observed forward at the time of the stereoscopic image observation of the 3D stereoscopic image is displayed to be thicker, and a part thereof which is observed backward is displayed to be thinner. - The 3D data analysis apparatus according to claim 7, wherein
at least one of the coordinate axes is a biexponential axis. - The 3D data analysis apparatus according to claim 8, wherein
the 3D stereoscopic image is displayed as a moving image in which the graphics are swung, and the graphics that are observed forward at the time of the stereoscopic image observation of the moving image are swung to a larger degree as compared to the graphics observed backward. - The 3D data analysis apparatus according to claim 9, wherein
the 3D stereoscopic image is displayed as a moving image in which the graphics are blinked, and the graphics that are observed forward at the time of the stereoscopic image observation of the moving image are blinked more frequently as compared to the graphics observed backward. - The 3D data analysis apparatus according to claim 10, wherein
the display unit is a display, and
the 3D data analysis apparatus comprising glasses for stereoscopically viewing the 3D stereoscopic image displayed on the display. - A microparticle analysis system, being configured by contiguously providing the 3D data analysis apparatus according to any one of claims 1 to 11 and a microparticle measurement apparatus.
- A 3D data analysis method, comprising the steps of:selecting three kinds of variables independent of measurement data of microparticles;calculating positions and graphics in a coordinate space with the three kinds of variables being coordinate axes and creating a 3D stereoscopic image that represents a characteristic distribution of the microparticles; anddisplaying the 3D stereoscopic image.
- A 3D data analysis program, causing a computer to execute the steps of:calculating positions and graphics in a coordinate space with three kinds of independent variables selected from measurement data of microparticles being coordinate axes and creating a 3D stereoscopic image that represents a characteristic distribution of the microparticles; anddisplaying the 3D stereoscopic image.
Applications Claiming Priority (2)
| Application Number | Priority Date | Filing Date | Title |
|---|---|---|---|
| JP2010269944 | 2010-12-03 | ||
| PCT/JP2011/077195 WO2012073824A1 (en) | 2010-12-03 | 2011-11-25 | 3d data analysis device, 3d data analysis method, and 3d data analysis program |
Publications (2)
| Publication Number | Publication Date |
|---|---|
| EP2647976A1 true EP2647976A1 (en) | 2013-10-09 |
| EP2647976A4 EP2647976A4 (en) | 2017-08-09 |
Family
ID=46171762
Family Applications (1)
| Application Number | Title | Priority Date | Filing Date |
|---|---|---|---|
| EP11844939.6A Ceased EP2647976A4 (en) | 2010-12-03 | 2011-11-25 | 3d data analysis device, 3d data analysis method, and 3d data analysis program |
Country Status (6)
| Country | Link |
|---|---|
| US (2) | US20130229412A1 (en) |
| EP (1) | EP2647976A4 (en) |
| JP (2) | JP6070192B2 (en) |
| KR (1) | KR101969602B1 (en) |
| CN (1) | CN103229041B (en) |
| WO (1) | WO2012073824A1 (en) |
Families Citing this family (6)
| Publication number | Priority date | Publication date | Assignee | Title |
|---|---|---|---|---|
| JP5817369B2 (en) | 2011-09-13 | 2015-11-18 | ソニー株式会社 | SPECTRUM ANALYSIS DEVICE, MICROPARTICLE MEASUREMENT DEVICE, METHOD AND PROGRAM FOR SPECTRUM ANALYSIS OR SPECTRUM CHART DISPLAY |
| CN104699235B (en) * | 2013-12-05 | 2017-12-01 | 浙江大学 | Three dimensions imaging exchange method and system based on ultrasonic wave |
| US9396586B2 (en) | 2014-03-14 | 2016-07-19 | Matterport, Inc. | Processing and/or transmitting 3D data |
| US9830720B2 (en) * | 2015-09-02 | 2017-11-28 | Becton, Dickinson And Company | Graphics control during flow cytometry event gating |
| CN109426302B (en) * | 2017-08-30 | 2022-05-20 | 西门子(中国)有限公司 | Data analysis equipment and method |
| JP7374943B2 (en) * | 2021-02-26 | 2023-11-07 | シスメックス株式会社 | Display method and sample analyzer |
Family Cites Families (24)
| Publication number | Priority date | Publication date | Assignee | Title |
|---|---|---|---|---|
| JP2938502B2 (en) * | 1990-03-01 | 1999-08-23 | 株式会社東芝 | Image display device |
| JP2853355B2 (en) * | 1991-03-14 | 1999-02-03 | 三菱電機株式会社 | 3D graphic data generator |
| US5776709A (en) * | 1991-08-28 | 1998-07-07 | Becton Dickinson And Company | Method for preparation and analysis of leukocytes in whole blood |
| US5598164A (en) * | 1992-08-10 | 1997-01-28 | Reppas; George S. | Vehicle obstacle avoidance system |
| US5423321A (en) * | 1993-02-11 | 1995-06-13 | Fontenot; Mark G. | Detection of anatomic passages using infrared emitting catheter |
| GB9316214D0 (en) * | 1993-08-05 | 1993-09-22 | Philips Electronics Uk Ltd | Image processing |
| JPH0991468A (en) * | 1995-09-22 | 1997-04-04 | Nippon Telegr & Teleph Corp <Ntt> | Three-dimensional image display device and its method |
| JPH10318904A (en) * | 1996-06-10 | 1998-12-04 | Toa Medical Electronics Co Ltd | Apparatus for analyzing particle image and recording medium recording analysis program therefor |
| JPH10124702A (en) * | 1996-10-25 | 1998-05-15 | Dainippon Printing Co Ltd | Device for manufacturing flame picture |
| US6629065B1 (en) * | 1998-09-30 | 2003-09-30 | Wisconsin Alumni Research Foundation | Methods and apparata for rapid computer-aided design of objects in virtual reality and other environments |
| JP2000156875A (en) * | 1998-11-19 | 2000-06-06 | Sony Corp | Video preparing device, video display system and graphics preparing method |
| JP2000268198A (en) * | 1999-03-15 | 2000-09-29 | Sony Corp | Stereoscopic image processor and stereoscopic image processing method |
| US6690371B1 (en) * | 2000-05-03 | 2004-02-10 | Ge Medical Systems Global Technology, Llc | Relevant image data extraction from a medical image data volume |
| CN1204267C (en) * | 2000-05-05 | 2005-06-01 | 朱学军 | Intracellular nucleic acid testing method and device |
| TWI285852B (en) * | 2002-11-05 | 2007-08-21 | Asia Air Survey Co Ltd | System and method for visualization processing and recording medium with visualization processing program recorded therein |
| JP4438358B2 (en) * | 2003-09-04 | 2010-03-24 | 株式会社サタケ | Granular color sorter with display adjustment mechanism |
| US8050491B2 (en) * | 2003-12-17 | 2011-11-01 | United Technologies Corporation | CAD modeling system and method |
| JP4746285B2 (en) | 2004-06-30 | 2011-08-10 | シスメックス株式会社 | Hematology analyzer, analysis program, fractionation area setting method |
| US7113266B1 (en) * | 2005-03-30 | 2006-09-26 | Beckman Coulter, Inc. | Flow cytometer for differentiating small particles in suspension |
| JP4267598B2 (en) * | 2005-07-11 | 2009-05-27 | ザイオソフト株式会社 | Image fusion processing method, image fusion processing program, and image fusion processing apparatus |
| WO2007069260A1 (en) * | 2005-12-16 | 2007-06-21 | Technion Research & Development Foundation Ltd. | Method and apparatus for determining similarity between surfaces |
| JP4568357B2 (en) * | 2008-06-30 | 2010-10-27 | インターナショナル・ビジネス・マシーンズ・コーポレーション | Computer system for retrieving a scene including moving image content to be searched from moving image data, method and computer program therefor |
| US8581927B2 (en) * | 2008-11-04 | 2013-11-12 | Beckman Coulter, Inc. | Multidimensional particle analysis data cluster reconstruction |
| US20110109617A1 (en) * | 2009-11-12 | 2011-05-12 | Microsoft Corporation | Visualizing Depth |
-
2011
- 2011-11-25 EP EP11844939.6A patent/EP2647976A4/en not_active Ceased
- 2011-11-25 WO PCT/JP2011/077195 patent/WO2012073824A1/en active Application Filing
- 2011-11-25 JP JP2012546830A patent/JP6070192B2/en not_active Expired - Fee Related
- 2011-11-25 CN CN201180057042.3A patent/CN103229041B/en not_active Expired - Fee Related
- 2011-11-25 US US13/885,637 patent/US20130229412A1/en not_active Abandoned
- 2011-11-25 KR KR1020137013053A patent/KR101969602B1/en active IP Right Grant
-
2015
- 2015-08-28 US US14/838,780 patent/US9542768B2/en active Active
-
2016
- 2016-12-28 JP JP2016256507A patent/JP6269808B2/en not_active Expired - Fee Related
Non-Patent Citations (1)
| Title |
|---|
| See references of WO2012073824A1 * |
Also Published As
| Publication number | Publication date |
|---|---|
| US20150371427A1 (en) | 2015-12-24 |
| KR101969602B1 (en) | 2019-04-16 |
| JPWO2012073824A1 (en) | 2014-05-19 |
| EP2647976A4 (en) | 2017-08-09 |
| WO2012073824A1 (en) | 2012-06-07 |
| CN103229041A (en) | 2013-07-31 |
| US9542768B2 (en) | 2017-01-10 |
| JP6070192B2 (en) | 2017-02-01 |
| JP6269808B2 (en) | 2018-01-31 |
| CN103229041B (en) | 2016-03-02 |
| KR20130136476A (en) | 2013-12-12 |
| US20130229412A1 (en) | 2013-09-05 |
| JP2017111155A (en) | 2017-06-22 |
Similar Documents
| Publication | Publication Date | Title |
|---|---|---|
| US9710953B2 (en) | Apparatus, method, and program for 3D data analysis, and fine particle analysis system | |
| US9542768B2 (en) | Apparatus, method, and program for processing 3D microparticle data | |
| EP2647999B1 (en) | 3d data analysis device and 3d data analysis method | |
| US9959450B2 (en) | Apparatus, method and program for 3D data analysis, and microparticle analysis system | |
| JP5691452B2 (en) | 3D data analysis apparatus, 3D data analysis method, and 3D data analysis program | |
| JP2013088167A5 (en) | ||
| WO2014123859A1 (en) | Digital holographic microscopy apparatus and method for clinical diagnostic hematology | |
| CN114281283A (en) | Display method of scattered point image, sample analysis equipment and related device |
Legal Events
| Date | Code | Title | Description |
|---|---|---|---|
| PUAI | Public reference made under article 153(3) epc to a published international application that has entered the european phase |
Free format text: ORIGINAL CODE: 0009012 |
|
| 17P | Request for examination filed |
Effective date: 20130508 |
|
| AK | Designated contracting states |
Kind code of ref document: A1 Designated state(s): AL AT BE BG CH CY CZ DE DK EE ES FI FR GB GR HR HU IE IS IT LI LT LU LV MC MK MT NL NO PL PT RO RS SE SI SK SM TR |
|
| DAX | Request for extension of the european patent (deleted) | ||
| RA4 | Supplementary search report drawn up and despatched (corrected) |
Effective date: 20170707 |
|
| RIC1 | Information provided on ipc code assigned before grant |
Ipc: G06T 15/00 20110101ALI20170630BHEP Ipc: H04N 13/02 20060101ALI20170630BHEP Ipc: G06T 19/00 20110101ALI20170630BHEP Ipc: G01N 35/00 20060101ALI20170630BHEP Ipc: G01N 15/00 20060101AFI20170630BHEP |
|
| STAA | Information on the status of an ep patent application or granted ep patent |
Free format text: STATUS: EXAMINATION IS IN PROGRESS |
|
| 17Q | First examination report despatched |
Effective date: 20190412 |
|
| STAA | Information on the status of an ep patent application or granted ep patent |
Free format text: STATUS: EXAMINATION IS IN PROGRESS |
|
| REG | Reference to a national code |
Ref country code: DE Ref legal event code: R003 |
|
| RAP3 | Party data changed (applicant data changed or rights of an application transferred) |
Owner name: SONY GROUP CORPORATION |
|
| STAA | Information on the status of an ep patent application or granted ep patent |
Free format text: STATUS: THE APPLICATION HAS BEEN REFUSED |
|
| 18R | Application refused |
Effective date: 20210705 |