JP4746285B2 - Hematology analyzer, analysis program, fractionation area setting method - Google Patents
Hematology analyzer, analysis program, fractionation area setting method Download PDFInfo
- Publication number
- JP4746285B2 JP4746285B2 JP2004193428A JP2004193428A JP4746285B2 JP 4746285 B2 JP4746285 B2 JP 4746285B2 JP 2004193428 A JP2004193428 A JP 2004193428A JP 2004193428 A JP2004193428 A JP 2004193428A JP 4746285 B2 JP4746285 B2 JP 4746285B2
- Authority
- JP
- Japan
- Prior art keywords
- blood
- area
- blood cells
- frequency distribution
- dimensional
- Prior art date
- Legal status (The legal status is an assumption and is not a legal conclusion. Google has not performed a legal analysis and makes no representation as to the accuracy of the status listed.)
- Active
Links
- 238000000034 method Methods 0.000 title claims description 49
- 238000005194 fractionation Methods 0.000 title claims description 18
- 238000009826 distribution Methods 0.000 claims description 89
- 210000004369 blood Anatomy 0.000 claims description 43
- 239000008280 blood Substances 0.000 claims description 43
- 210000000601 blood cell Anatomy 0.000 claims description 42
- 238000010586 diagram Methods 0.000 claims description 39
- 238000005259 measurement Methods 0.000 claims description 29
- 238000004458 analytical method Methods 0.000 claims description 24
- 238000012545 processing Methods 0.000 claims description 13
- 241001465754 Metazoa Species 0.000 claims description 12
- 238000004159 blood analysis Methods 0.000 claims description 4
- 239000003086 colorant Substances 0.000 claims description 4
- 238000001514 detection method Methods 0.000 description 26
- 230000003287 optical effect Effects 0.000 description 8
- 238000002835 absorbance Methods 0.000 description 6
- 210000004027 cell Anatomy 0.000 description 5
- 239000003153 chemical reaction reagent Substances 0.000 description 5
- 238000004891 communication Methods 0.000 description 5
- 238000002360 preparation method Methods 0.000 description 5
- 102000001554 Hemoglobins Human genes 0.000 description 3
- 108010054147 Hemoglobins Proteins 0.000 description 3
- 230000015572 biosynthetic process Effects 0.000 description 3
- 238000005755 formation reaction Methods 0.000 description 3
- 239000002245 particle Substances 0.000 description 3
- 210000003743 erythrocyte Anatomy 0.000 description 2
- 210000000265 leukocyte Anatomy 0.000 description 2
- 230000002093 peripheral effect Effects 0.000 description 2
- 210000002700 urine Anatomy 0.000 description 2
- 206010018910 Haemolysis Diseases 0.000 description 1
- 239000012491 analyte Substances 0.000 description 1
- 238000003491 array Methods 0.000 description 1
- 210000001124 body fluid Anatomy 0.000 description 1
- 239000010839 body fluid Substances 0.000 description 1
- 238000006243 chemical reaction Methods 0.000 description 1
- 239000003085 diluting agent Substances 0.000 description 1
- 238000010790 dilution Methods 0.000 description 1
- 239000012895 dilution Substances 0.000 description 1
- 239000003814 drug Substances 0.000 description 1
- 229940079593 drug Drugs 0.000 description 1
- 238000002474 experimental method Methods 0.000 description 1
- 239000012530 fluid Substances 0.000 description 1
- 230000008588 hemolysis Effects 0.000 description 1
- 238000009877 rendering Methods 0.000 description 1
- 239000007787 solid Substances 0.000 description 1
- 238000000638 solvent extraction Methods 0.000 description 1
- 238000010186 staining Methods 0.000 description 1
Images


Classifications
-
- G—PHYSICS
- G01—MEASURING; TESTING
- G01N—INVESTIGATING OR ANALYSING MATERIALS BY DETERMINING THEIR CHEMICAL OR PHYSICAL PROPERTIES
- G01N15/00—Investigating characteristics of particles; Investigating permeability, pore-volume, or surface-area of porous materials
- G01N15/10—Investigating individual particles
- G01N15/14—Electro-optical investigation, e.g. flow cytometers
- G01N15/1456—Electro-optical investigation, e.g. flow cytometers without spatial resolution of the texture or inner structure of the particle, e.g. processing of pulse signals
- G01N15/1459—Electro-optical investigation, e.g. flow cytometers without spatial resolution of the texture or inner structure of the particle, e.g. processing of pulse signals the analysis being performed on a sample stream
-
- G01N2015/012—
-
- G01N2015/016—
-
- G01N2015/018—
-
- G01N2015/1019—
-
- G—PHYSICS
- G01—MEASURING; TESTING
- G01N—INVESTIGATING OR ANALYSING MATERIALS BY DETERMINING THEIR CHEMICAL OR PHYSICAL PROPERTIES
- G01N15/00—Investigating characteristics of particles; Investigating permeability, pore-volume, or surface-area of porous materials
- G01N15/10—Investigating individual particles
- G01N15/14—Electro-optical investigation, e.g. flow cytometers
- G01N2015/1486—Counting the particles
Description
本発明は、分析装置、分析プログラム及び分画領域設定方法に関し、さらに詳しくは、分画領域を適切に設定することができる分析装置、分析プログラム及び分画領域設定方法に関する。 The present invention relates to an analysis apparatus, an analysis program, and a fraction area setting method, and more particularly, to an analysis apparatus, an analysis program, and a fraction area setting method that can appropriately set a fraction area .
操作者がキーボードを使用して、サイトグラム(スキャッタグラム)上に分画領域を設定することが可能な細胞分析装置が知られている(例えば、特許文献1参照)。
しかし、上記特許文献1の装置による分画領域の設定は、操作者がスキャッタグラムのみを見ながら行うものであり、散乱光強度I0や前方散乱光強度I90の頻度分布とスキャッタグラムとの関係が分からないため、分画領域の設定が難しいという問題点があった。
However, the setting of the fractionation area by the apparatus of
本発明は、係る事情に鑑みてなされたものであり、動物の血液中の血球を適切に自動分類できなかった場合であっても、ユーザが手動で複数の分画領域を容易にかつ適切に設定することができ、正確な分類結果を取得することを可能とする血液分析装置を提供するものである。 The present invention has been made in view of such circumstances, and even when the blood cells in the blood of an animal cannot be automatically automatically classified, the user can easily and appropriately appropriately select a plurality of fractional areas. The present invention provides a blood analyzer that can be set and can obtain an accurate classification result .
本発明の血液分析装置は、ヒトを除く動物から採取された血液に含まれる血球を複数種類に分類する血液分析装置であって、血液に含まれる血球から第1のパラメータに関する第1測定データおよび第2のパラメータに関する第2測定データを取得する測定データ取得手段と、前記第1および第2測定データに基づいて、前記第1および第2のパラメータを軸とし、血液に含まれる血球を複数種類に分類して表示した2次元分布図を作成する2次元分布図作成手段と、血球が複数種類に分類された前記2次元分布図上にユーザが複数の分画領域を設定する入力を行うための領域設定手段と、前記領域設定手段によって設定された前記複数の分画領域に属する血球について、前記第1のパラメータを軸とする度数分布図を前記複数の分画領域のそれぞれに対応して作成する度数分布図作成手段と、前記複数の分画領域が示された前記2次元分布図および前記度数分布図作成手段によって作成された度数分布図を出力する出力手段と、を備え、設定された分画領域を変更する入力が前記領域設定手段によって行われた場合に、前記度数分布図作成手段は、前記領域設定手段によって変更された分画領域に属する血球に対応して、前記第1のパラメータを軸とする度数分布図を変更し、前記出力手段は、変更された分画領域が示された前記2次元分布図および変更された度数分布図を出力する。 The blood analyzer of the present invention is a blood analyzer that classifies blood cells contained in blood collected from animals other than humans into a plurality of types, and includes first measurement data relating to a first parameter from blood cells contained in blood , and multiple measurement data acquisition means for acquiring the second measurement data relating to a second parameter based on said first and second measurement data, said first and second parameter as an axis, a blood cell included in blood A two-dimensional distribution chart creating means for creating a two-dimensional distribution chart classified and displayed and a user inputs to set a plurality of fractional areas on the two-dimensional distribution chart in which blood cells are classified into a plurality of types. an area setting means for, the blood cell belonging to the plurality of fractions region set by the region setting means, a frequency distribution diagram centered on the first parameter of the plurality of fractions area Frequency distribution diagram creating means created corresponding to each, and output means for outputting the two-dimensional distribution diagram showing the plurality of fractional areas and the frequency distribution diagram created by the frequency distribution diagram creating means When the input for changing the set fractional area is performed by the area setting means, the frequency distribution diagram creating means applies the blood cell belonging to the fractional area changed by the area setting means to Correspondingly, the frequency distribution chart with the first parameter as an axis is changed, and the output means outputs the two-dimensional distribution chart showing the changed fraction area and the changed frequency distribution chart. The
本発明によれば、2次元分布図上に設定された分画領域に属する有形成分について一次元の度数分布図が作成され、この度数分布図の形状を参照することにより、分画領域が適切に設定されているかどうかを確認することができる。従って、本発明によれば、分画領域を従来よりも適切かつ容易に設定することができ、分析精度を向上させることができる。 According to the present invention, a one-dimensional frequency distribution diagram is created for the formed component belonging to the fraction area set on the two-dimensional distribution map, and by referring to the shape of the frequency distribution chart, the fraction area is You can check whether it is set properly. Therefore, according to the present invention, it is possible to set the fractionation area appropriately and easily as compared with the prior art, and the analysis accuracy can be improved.
以下、本発明の実施例を図面に基づいて説明する。
本発明の一実施例による試料分析装置は、血液を分析して白血球(WBC)、赤血球(RBC)および血小板(PLT)などの数を算出する血球計数装置である。この試料分析装置は、動物の血液分析に好適に用いられるものである。動物の血液分析では、通常行われる内蔵パラメータに基づく自動解析では適切に血球(有形成分)の種類を分類できない場合がある。この場合に、以下に示す手動解析を行うことにより、適切な分画領域を設定し、その分画領域に基づいて分析を行うことにより、高い精度で動物の血液分析を行うことが可能になる。また、薬効を確認するための動物実験において、種々の分画領域を設定し、その分画領域内に含まれる所定の血球の増減を把握したいという要望がある。
Embodiments of the present invention will be described below with reference to the drawings.
A sample analyzer according to an embodiment of the present invention is a blood cell counter that analyzes blood to calculate the number of white blood cells (WBC), red blood cells (RBC), platelets (PLT), and the like. This sample analyzer is suitably used for animal blood analysis. In animal blood analysis, there are cases in which the type of blood cells (formation) cannot be properly classified by automatic analysis based on built-in parameters that are normally performed. In this case, it is possible to perform blood analysis of an animal with high accuracy by setting an appropriate fraction area by performing the manual analysis shown below and performing an analysis based on the fraction area. . Further, in animal experiments for confirming drug efficacy, there is a demand for setting various fractional areas and grasping the increase or decrease of predetermined blood cells contained in the fractional areas.
1.全体構成
図1は、本発明の一実施例による試料分析装置およびその周辺機器の全体構成を示した斜視図である。
図1に示すように、本実施例の試料分析装置10は、装置本体1と、装置本体1に通信ケーブルを介して接続されるデータ処理端末2とを含む。
装置本体1は、装置本体1に陽圧や陰圧を供給する空圧源5にチューブを介して接続されている。また、装置本体1は、検体を収容した検体容器を自動で装置本体1に供給するサンプラ部6に接続されている。また、装置本体1は、図示しない試薬容器にチューブを介して接続され、空圧源5から供給される陰圧を使用して試薬容器から試薬を吸引する。
装置本体1は、血液の吸引を行う試料吸引部14a、14bなどを備えている。
試料吸引部14aは、使用者が検体容器を保持しながら血液を吸引させるマニュアルモードで使用される吸引部であり、試料吸引部14bは、サンプラ部6を使用して自動で血液を吸引するサンプラモードで使用される吸引部である。
データ処理端末2は、端末本体15、CRTディスプレイを含む端末側表示部16、および、キーボードや図示しないマウスを含む端末側入力部18を含む。
データ処理端末2は、分析結果のリストを印字するためのページプリンタ3、粒度分布図やスキャッタグラムを印字するカラーグラフィックプリンタ4、および、分析結果を検査伝票形式の用紙に印字するデータプリンタ7にそれぞれ通信ケーブルを介して接続されている。
1. Overall Configuration FIG. 1 is a perspective view showing an overall configuration of a sample analyzer and its peripheral devices according to an embodiment of the present invention.
As shown in FIG. 1, the
The apparatus
The apparatus
The sample suction unit 14a is a suction unit used in a manual mode in which a user sucks blood while holding a sample container, and the sample suction unit 14b is a sampler that automatically sucks blood using the
The
The
2.内部構成
図2は、装置本体1およびデータ処理端末2の内部構成を示すブロック図である。
図2に示すように、装置本体1は、試料吸引部14a,14b、試料調製部17、検出部19、本体側制御部26、および、出入力インターフェイス32aを含む。
試料調製部17は、試料吸引部14aおよび14bによって吸引された血液と図示しない試薬容器から吸引した試薬とを混合することによって、希釈、溶血、および染色などの処理をする。そして、これらの処理によって作成された測定用試料を検出部19に供給する。
検出部19は、光学系検出部20と、電気系検出部22と吸光度検出部24とを含む。
光学系検出部20については後述する。
2. Internal Configuration FIG. 2 is a block diagram showing the internal configuration of the apparatus
As shown in FIG. 2, the apparatus
The
The
The optical
電気系検出部22は、RF/DC検出方式を採用した検出器と、シースフローDC検出方式を採用した検出器とを含む。なお、シースフローDC検出方式を採用した検出器としては、例えば、米国特許第6,525,807号明細書に第1測定部として記載された検出器が使用できる。
The
吸光度検出部24としては、発光ダイオードと、受光素子と、それらの間に配置された透明なセルとを含む検出器が使用されている。吸光度検出部24は、希釈液のみの透過光強度とヘモグロビン測定用試料の透過光強度とを本体側制御部26に出力し、本体側制御部26は、これらの出力値を端末側制御部34に送り、端末側制御部34は、これらの透過光強度の差(吸光度)からヘモグロビン(HGB)濃度を算出する。
As the
本体側制御部26は、CPU、ROM、RAM、A/D変換回路などを含み、検出部19から出力されるアナログ信号をデジタル信号に変換し、それらのデータを出入力インターフェイス32aを介してデータ処理端末2に送信する。また、本体側制御部26は、試料吸引部14a,14b、試料調製部17、および検出部19などの動作を制御する。
The main body
端末本体15は、出入力インターフェイス32bと、端末側制御部34とを含む。出入力インターフェイス32aと32bとは通信ケーブル33を介して接続されている。
The
端末側制御部34は、CPU,ROM、RAM、およびハードディスクなどを含む。端末側制御部34は、出入力インターフェイス32bを介して装置本体1から送信されたデタから分析結果を算出し、それを端末側表示部16に表示させたり、各種プリンタ(図1参照)に印字させたりすることができる。
また、端末側制御部34は、端末側入力部18から入力された情報を装置本体1に送信することができる。
The terminal
Further, the terminal
図3は、光学系検出部20の構成を示した斜視図である。
図3に示すように、光学系検出部20は、ノズル36、レーザダイオード40、コリメータレンズ42、シースフローセル43、集光レンズ44、ピンホール板45、フォトダイオード46、集光レンズ47、ダイタロイックミラー48、フォトマルチプライヤチューブ(以下、「フォトマル」と呼ぶ。)49、フィルタ50、ピンホール板51、フォトマルチプライヤチューブ(以下、「フォトマル」と呼ぶ。)52、および、アンプ53〜55を含む。
試料調製部17(図2参照)から供給された測定用試料は、ノズル36を介してシースフローセル43のオリフィス部38を流れる。
レーザダイオード40から発せられた光は、シースフローセル40のオリフィス部38を流れる測定用試料をコリメータレンズ42を介して照射する。オリフィス部38を流れる測定用試料によって前方に散乱した光(前方散乱光)は、集光レンズ44とピンホール板45とを介してフォトダイオード46に入射する。
オリフィス部38を流れる測定用試料によって側方に散乱した光(側方散乱光)は、集光レンズ47とダイクロイックミラー48とを介してフォトマル49に入射する。
光が照射されることによって、オリフィス部38を流れる測定用試料から発せられた蛍光(側方蛍光)は、集光レンズ47とダイクロイックミラー48とフィルタ50とピンホール板51とを介してフォトマル52に入射する。
フォトダイオード46は、入射された前方散乱光をその強度に応じた電気的な情報に変換して前方散乱光強度として出力する。フォトマル49は、入射された側方散乱光をその強度に応じた電気的な情報に変換して側方散乱光強度として出力する。フォトマル52は、入射された側方蛍光をその強度に応じた電気的な情報に変換して側方蛍光強度として出力する。
フォトダイオード46から出力される前方散乱光強度と、フォトマル49から出力される側方散乱光強度と、フォトマル52から出力される側方蛍光強度とは、それぞれアンプ53,54,55によって増幅され、本体側制御部26に入力される。
FIG. 3 is a perspective view showing the configuration of the optical
As shown in FIG. 3, the optical
The measurement sample supplied from the sample preparation unit 17 (see FIG. 2) flows through the
The light emitted from the
Light scattered laterally by the measurement sample flowing through the orifice portion 38 (side scattered light) enters the
Fluorescence (side fluorescence) emitted from the measurement sample flowing through the
The
The forward scattered light intensity output from the
3.試料分析装置の動作
3−1.全体の流れ
図4を参照して、本実施例の試料分析装置の動作の全体の流れについて説明する。
3. Operation of sample analyzer 3-1. Overall Flow With reference to FIG. 4, the overall flow of the operation of the sample analyzer of this embodiment will be described.
まず、S1では、端末側制御部34が、測定開始の指令を待ち、指令があるとS2に移動する。指令がない場合には、S6に移動し、手動解析開始の指令を待つ。
次に、S2では、端末側制御部34からの指令により、本体側制御部26が、測定動作制御を開始する。本体側制御部26の制御により、選択されているモードに応じて試料吸引部14aまたは14bが血液の吸引を行い、試料調製部17が、所定の測定用試料を作成し、検出部19の各検出部に供給する。
次に、S3では、光学系検出部20は、光学情報として前方散乱光強度、側方散乱光強度および側方蛍光強度を本体側制御部26に出力し、電気系検出部22は、電気情報を本体側制御部26に出力し、吸光度検出部24は、透過光強度を本体側制御部26に出力する。これにより、スキャッタグラムを作成するのに必要な測定データが得られる。これらの測定データは、通信ケーブル33を介して端末側制御部34に送られ、端末側制御部34内の記憶部に記憶される。
次に、S4では、分析物中に含まれる個々の有形成分を上記測定データ(側方散乱光強度および側方蛍光強度)の大きさに基づいて分布させることにより、スキャタグラムを作成する。具体的には、端末側制御部34内の記憶部に記憶された測定データを、図5で示す256×256個の要素からなる2次元配列(A1)のそれぞれの要素に分類する。この2次元配列の各要素に記載された数字は、その要素に属する有形成分の度数を示している。例えば、A1の要素Scatter[4][251]には、9個の有形成分が属している。
このようにして得られたスキャッタグラムについて、端末側制御部34に内蔵されたパラメータに基づいて有形成分を種類ごとに分類して計数する処理が行われ、有形成分の種類を区別する情報(例えば色情報)が与えられる。
次に、S5では、スキャッタグラムのデータや有形成分の計数値を含む上記分析結果が端末側制御部34内の記憶部に記憶される。
First, in S1, the terminal-
Next, in S <b> 2, the main body
Next, in S3, the optical
Next, in S4, a scattergram is created by distributing individual formed components contained in the analyte based on the magnitude of the measurement data (side scattered light intensity and side fluorescence intensity). Specifically, the measurement data stored in the storage unit in the terminal-
Information for discriminating the type of the formed component is obtained by processing the scattergram obtained in this manner to classify and count the formed component for each type based on the parameters built in the terminal-
Next, in S <b> 5, the analysis result including the scattergram data and the formed component count value is stored in the storage unit in the terminal-
次に、S6では、端末側制御部34が、手動解析開始の指令を待ち、指令があるとS7に移動する。指令がない場合には、S1に移動し、測定開始の指令を待つ。
次に、S7では、S5で記憶させたスキャッタグラムを読み出し、端末側表示部16に表示させる。
次に、S8では、端末側制御部34が、使用者によって設定された分画領域に基づいて手動解析を行う。この工程は、後で詳細に説明する。
次に、S9では、端末側制御部34が、手動解析終了の指令を待ち、指令があるとS1に移動する。指令がない場合には、S8に移動し、手動解析を続行する。
Next, in S6, the terminal
Next, in S7, the scattergram stored in S5 is read and displayed on the terminal
Next, in S8, the terminal
Next, in S9, the terminal-
3−2.手動解析
3−2−1.手動解析画面
次に、手動解析工程S8について、詳細に説明する。この工程では、手動で分画領域を設定し、その分画領域内に存在する有形成分についてヒストグラムを作成する。
3-2. Manual analysis 3-2-1. Manual Analysis Screen Next, the manual analysis step S8 will be described in detail. In this step, a fraction area is manually set, and a histogram is created for the formed component existing in the fraction area.
図6に手動解析モードの画面60を示す。この画面左には、スキャッタグラム61及びエリア情報62が描かれている。スキャッタグラム61には、手動で設定された分画領域(エリアA、B)が示されている。スキャッタグラム61に示された有形成分は、端末側制御部34に内蔵されたパラメータに基づいて自動分析された結果に基づいて色分けされている。分画領域を設定しても、この色分けは、変更されない。従って、1つの分画領域内に複数色の有形成分が含まれる場合がある。この場合であってもヒストグラムは、通常、1色で描かれる(なお、色分け情報をヒストグラムに反映させて、ヒストグラムを複数色で描いてもよい。)。分画領域は、端末側表示部16上に表示されたポインタを、マウスなどのポインティングデバイスを用いて移動させることにより、変更された分画領域の各頂点の座標情報を記憶させることにより、設定することができる。エリア情報62には、エリアBを区画する多角形の各頂点の座標情報62aが示されている。別のエリアを選択すると、選択したエリアを区画する多角形の各頂点の座標が示される。
FIG. 6 shows a
画面60中央には、X軸及びY軸のヒストグラム(度数分布)63,64が描かれている。各ヒストグラムの左上には、コンボボックス63a,64aが設けられている。このコンボボックス63a,64aでは、全領域、エリアA、エリアB又は全エリアの何れかを選択することができる。「全領域」が選択されると、スキャッタグラム61内の全ての有形成分についてヒストグラムが描画される。「エリアA」又は「エリアB」を選択すると、その選択されたエリア内に属する有形成分についてヒストグラムが描画される。「全エリア」を選択すると、エリアA及びBについて、ヒストグラムが描画される。このとき、エリアごとに色又は線種を変えて、互いに区別できるようにしている。なお、設定を変更して、複数のエリアを選択できるようにしてもよく、また、全エリアについてのヒストグラムが常に表示されるようにしてもよい。ヒストグラム63,64は、エリアBを選択した場合のヒストグラムである。
In the center of the
画面60の右側には、X軸及びY軸に対するヒストグラム情報65,66が描かれている。ヒストグラム情報65,66は、ヒストグラム63,64に関する統計データであり、平均値、分散、半値幅などからなる。
On the right side of the
本実施例の装置の使用者は、スキャッタグラム61、ヒストグラム63,64の形状とヒストグラム情報65,66を見て、設定した分画領域が適切であるかどうかを判断する。例えば、ヒストグラム63,64の形状が正規分布になっていると、分画領域が適切である可能性が高いと判断する。また、例えば、ヒストグラム63,64中のピークの裾部分が不自然に途切れている場合には、分画領域が不適切である可能性が高いと判断する。分画領域が適切であると判断すると、分画領域の設定を終える。分画領域が不適切であると判断すると、分画領域の再設定を行う。再設定を行うと、再設定後の分画領域についてヒストグラムが描画される。
The user of the apparatus of the present embodiment looks at the scattergram 61, the shapes of the
3−2−2.ヒストグラム描画処理
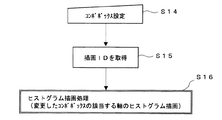
ヒストグラム63,64は、スキャッタグラム61内に多角形エリア(分画領域)が設定されたとき、及びコンボボックス63a,64aの設定が変更されたときに、描画される。
3-2-2. Histogram rendering processing The
図7に示すように、スキャッタグラム61内に多角形エリアが設定されたとき(S11)、多角形エリアの頂点の座標情報及び頂点数が取得され(S12)、この情報に基づいてヒストグラム63,64が描画される(S13)。このとき、X軸、Y軸の両方のヒストグラム63,64が描画される。
As shown in FIG. 7, when a polygon area is set in the scattergram 61 (S11), the coordinate information and the number of vertices of the polygon area are acquired (S12), and the
また、図8に示すように、コンボボックス63a,64aの設定が変更されたとき(S14)、ポインタの位置からコンボボックス63a,64aのどの要素が選択されたかについての情報(描画ID)が取得され(S15)、コンボボックス63aの設定が変更されればX軸ヒストグラムが、コンボボックス64aの設定が変更されればY軸ヒストグラムが描画される(S16)。以下、図8Aを参照して、このときの操作を具体的に説明する。コンボボックス63aを例にとると、コンボボックス63aは、図8A(a)のような外観を有し、その右端には、矢印部63bを備える。矢印部63bをマウスを使用して選択すると、図8A(b)のように、リストボックス63cにコンボボックス63aが備える各要素が表示される。ここに表示された各要素は、選択可能であり、何れかの要素を選択することにより、コンボボックス63aの設定を変更することができる(S14)。このとき、ポインタの位置からどの要素が選択されたかについての情報(描画ID)が取得され(S15)、変更されたコンボボックス63aの該当する軸のヒストグラム(X軸ヒストグラム)が描画される(S16)。
Also, as shown in FIG. 8, when the settings of the combo boxes 63a and 64a are changed (S14), information (drawing ID) about which element of the combo boxes 63a and 64a is selected from the position of the pointer is acquired. If the setting of the combo box 63a is changed, the X-axis histogram is drawn, and if the setting of the combo box 64a is changed, the Y-axis histogram is drawn (S16). Hereinafter, the operation at this time will be described in detail with reference to FIG. 8A. Taking the combo box 63a as an example, the combo box 63a has an appearance as shown in FIG. 8A (a), and has an
次に、コンボボックス63aの設定が変更された場合のヒストグラム描画処理について、図5、図9〜13を用いて説明する。ここでは、便宜上、X軸のヒストグラム63を例にとって説明するが、Y軸のヒストグラム64についても同様の処理が行われる。なお、スキャッタグラム61内に多角形エリアが設定されたときには、同様の工程でX軸及びY軸のヒストグラムが描画される。以下の説明において、配列名により配列全体を参照し、配列名と添え字の組合せにより配列の各要素を参照する。例えば、「Hist_X」、「Scatter」によって配列全体を参照し、「Hist_X[Xi]」、「Scatter[Xi][Yi]」によって、それぞれ、配列Hist_X、Scatterの一要素を参照する。
Next, histogram drawing processing when the setting of the combo box 63a is changed will be described with reference to FIGS. 5 and 9 to 13. Here, for the sake of convenience, the X-axis histogram 63 will be described as an example, but the same processing is also performed on the Y-
まず、図9のS21では、作成するヒストグラム及びループ用添え字の初期化を行う。具体的には、Hist_Xの全ての配列要素の値、及びループ用添え字Xi,Yiの値を0にする。ここで、「Hist_X」は、図5のテーブル(Scatter)A1の下側に配置されている一次元配列A2である。テーブルA1の縦列の合計が、この一次元配列A2に収納される。本実施例では、テーブルA1の、ある要素が、選択された分画領域に属する場合には、その要素の値を一次元配列A2に加算し、属さない場合には、加算しないことにより、分画領域に属する有形成分のみについてヒストグラフを描画することを可能にしている。 First, in S21 of FIG. 9, initialization of a histogram to be created and a loop subscript is performed. Specifically, all array element values of Hist_X and loop subscripts Xi and Yi are set to 0. Here, “Hist_X” is the one-dimensional array A2 arranged below the table (Scatter) A1 in FIG. The total of the columns in the table A1 is stored in this one-dimensional array A2. In this embodiment, when an element of the table A1 belongs to the selected fractionation area, the value of the element is added to the one-dimensional array A2, and when it does not belong, it is not added. It is possible to draw a histogram for only the formed portion belonging to the image area.
次に、S22では、ループ用添え字Xiの値を確認し、Xiの値が256より小さい場合には、S23に移動する。Xiの値が256に達している場合には、ループを終了し、S24に移動する。また、S23では、ループ用添え字Yiの値を確認し、Yiの値が256より小さい場合には、S27に移動する。Yiの値が256に達している場合には、S26に移動する。XiおよびYiの値が256に達すると、256×256の配列要素を有するScatterの全ての配列要素が走査される。
S24では、256×256回のループを終えて、必要な値が格納されたHist_Xの各要素の値をたて軸とするヒストグラムが作成され、端末側表示部16に描画される。また、S25では、Hist_Xの各要素の値に基づいて各種の統計データが算出され、ヒストグラム情報として端末側表示部16に描画される。S25の工程を終えると、ヒストグラム描画処理が終了し、図4のS9に移動する。
S26では、ループ用添え字Xiの値を1つ大きくし、S22に戻る。
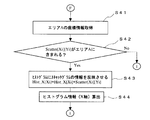
S27では、X軸用のコンボボックス63aの描画IDが取得される。この描画IDに従って、どの分画領域についてヒストグラムが描画されるか、又は全ての分画領域についてヒストグラムが描画されるかなどが決定される。その後、図10のS31に移動する。
Next, in S22, the value of the loop subscript Xi is confirmed. If the value of Xi is smaller than 256, the process proceeds to S23. If the value of Xi has reached 256, the loop is terminated and the process moves to S24. In S23, the value of the loop subscript Yi is confirmed. If the value of Yi is smaller than 256, the process proceeds to S27. If the value of Yi has reached 256, the process moves to S26. When the values of Xi and Yi reach 256, all array elements of Scatter having 256 × 256 array elements are scanned.
In S24, a loop of 256 × 256 times is finished, and a histogram is created with the value of each element of Hist_X storing a necessary value as a vertical axis, and is drawn on the terminal
In S26, the value of the loop subscript Xi is increased by 1, and the process returns to S22.
In S27, the drawing ID of the X-axis combo box 63a is acquired. In accordance with the drawing ID, it is determined for which fraction area the histogram is drawn or for all the fraction areas. Thereafter, the process proceeds to S31 in FIG.
図10のS31では、描画IDが「全領域」であるかどうかが判断される。描画IDが「全領域」である場合には、S35に移動し、Scatter[Xi][Yi]の値をHist_X[Xi]に加える。S23及びS37によって規定されるループを用いてYiの値を1つずつ大きくしながら、S35の工程を繰り返すことにより、Scatter[Xi][0]〜Scatter[Xi][255]の各要素の値がHist_X[Xi]に加えられる。また、S22とS26で規定されるループを用いてXiの値を1つずつ大きくしながらS35の工程を繰り返すことにより、Hist_X[0]〜Hist_X[255]の全ての要素にScatter[Xi][Yi]の内容を反映させる。S36では、Hist_X[Xi]の内容に基づいてヒストグラム情報が算出される。S36を終えると、S37に移動し、ループ用添え字Yiの値を1つ大きくし、Bに戻る。 In S31 of FIG. 10, it is determined whether or not the drawing ID is “all areas”. When the drawing ID is “all areas”, the process moves to S35, and the value of Scatter [Xi] [Yi] is added to Hist_X [Xi]. The value of each element of Scatter [Xi] [0] to Scatter [Xi] [255] is repeated by repeating the process of S35 while increasing the value of Yi one by one using the loop defined by S23 and S37. Is added to Hist_X [Xi]. Further, by repeating the process of S35 while increasing the value of Xi one by one using the loop defined by S22 and S26, Scatter [Xi] [] is added to all elements of Hist_X [0] to Hist_X [255]. Reflect the contents of [Yi]. In S36, histogram information is calculated based on the contents of Hist_X [Xi]. When S36 ends, the process moves to S37, the value of the loop subscript Yi is increased by 1, and the process returns to B.
S31では、描画IDが「全領域」でない場合には、S32に移動する。S32では、描画IDが「エリアAのみ」であるかどうかが判断される。描画IDが「エリアAのみ」である場合には、図11のS41に移動する。S41では、メモリに記憶されたエリアAについての座標情報(多角形の頂点の座標の情報)を読み出す。S42では、S41で読み出した座標情報に基づいてScatter[Xi][Yi]がエリアAに含まれているかどうかを判断する。Scatter[Xi][Yi]がエリアAに含まれている場合には、S43に移行し、Scatter[Xi][Yi]の値をHist_X[Xi]に加える。S43及びS44の詳細な説明は、S35及びS36について説明した通りである。S44を終えると、S37に移動し、ループ用添え字Yiの値を1つ大きくし、S23に戻る。S42において、Scatter[Xi][Yi]がエリアAに含まれていない場合には、Scatter[Xi][Yi]の値をHist_X[Xi]に反映させないで、S37に移動し、ループ用添え字Yiの値を1つ大きくし、Bに戻る。このような工程により、Scatterの各配列要素のうちエリアAに含まれているもののみの値をHist_Xに反映させることができる。 In S31, when the drawing ID is not “all areas”, the process moves to S32. In S32, it is determined whether or not the drawing ID is “Area A only”. If the drawing ID is “Area A only”, the process moves to S41 in FIG. In S41, coordinate information (polygon vertex coordinate information) about area A stored in the memory is read. In S42, it is determined whether or not Scatter [Xi] [Yi] is included in the area A based on the coordinate information read in S41. If Scatter [Xi] [Yi] is included in area A, the process proceeds to S43, and the value of Scatter [Xi] [Yi] is added to Hist_X [Xi]. The detailed description of S43 and S44 is as described for S35 and S36. When S44 ends, the process moves to S37, the value of the loop subscript Yi is increased by 1, and the process returns to S23. In S42, if Scatter [Xi] [Yi] is not included in area A, the value of Scatter [Xi] [Yi] is not reflected in Hist_X [Xi], and the process moves to S37, and the loop subscript is added. Increase Yi by one and return to B. By such a process, only the values included in the area A among the array elements of Scatter can be reflected in Hist_X.
図10を参照すると、S32では、描画IDが「エリアAのみ」でない場合には、S33に移動する。S33では、描画IDが「エリアBのみ」であるかどうかが判断される。描画IDが「エリアBのみ」である場合には、図12のS51に移動する。S51では、エリアBについての座標情報を読み出す。S52〜S54は、S42〜S44と同様である。 Referring to FIG. 10, in S32, if the drawing ID is not “area A only”, the process moves to S33. In S33, it is determined whether or not the drawing ID is “Area B only”. If the drawing ID is “Area B only”, the process moves to S51 in FIG. In S51, the coordinate information about area B is read. S52 to S54 are the same as S42 to S44.
図10を参照すると、S33では、描画IDが「エリアBのみ」でない場合には、S34に移動する。S34では、描画IDが「全エリア」であるかどうかが判断される。描画IDが「全エリア」である場合には、図13のS61に移動する。S61では、エリアA及びエリアBについての座標情報を読み出す。S62では、Scatter[Xi][Yi]がエリアA又はエリアBに含まれているかどうかを判断する。Scatter[Xi][Yi]がエリアA又はエリアBに含まれている場合には、S63に移行し、Scatter[Xi][Yi]の値をHist_X[Xi]に加える。S64は、S44と同様である。なお、別の一次元配列Hist1_X及びHist2_Xを準備し、Scatter[Xi][Yi]がエリアAに含まれている場合には、Scatter[Xi][Yi]の値をHist1_X[Xi]に加え、Scatter[Xi][Yi]がエリアBに含まれている場合には、Scatter[Xi][Yi]の値をHist2_X[Xi]に加えるようにしてもよい。このようにすることで、ヒストグラムを描画する際に、エリアごとに色分けすることが可能になる。 Referring to FIG. 10, in S33, if the drawing ID is not “area B only”, the process moves to S34. In S34, it is determined whether or not the drawing ID is “all areas”. If the drawing ID is “all areas”, the process moves to S61 in FIG. In S61, coordinate information about area A and area B is read. In S62, it is determined whether Scatter [Xi] [Yi] is included in Area A or Area B. If Scatter [Xi] [Yi] is included in Area A or Area B, the process proceeds to S63, and the value of Scatter [Xi] [Yi] is added to Hist_X [Xi]. S64 is the same as S44. If another one-dimensional array Hist1_X and Hist2_X is prepared and Scatter [Xi] [Yi] is included in area A, the value of Scatter [Xi] [Yi] is added to Hist1_X [Xi] When Scatter [Xi] [Yi] is included in area B, the value of Scatter [Xi] [Yi] may be added to Hist2_X [Xi]. By doing so, it is possible to color-divide each area when drawing a histogram.
描画IDが何れの場合でも、最終的に、図10のS37に移動し、S37で、Yiの値を1つ増加させて、その後、図9のS23に移動し、ループを繰り返す。
以上の工程により、選択された分画領域内に存在する有形成分について、ヒストグラムを描画することができる。
なお、本実施例では、S35,43,53及び63においてヒストグラムにスキャッタグラムの情報を反映させると、S36,44,54及び64においてヒストグラム情報を算出するようにしているが、S22において、Xiが256に到達した後に、ヒストグラム情報を算出するようにしてもよい。
Regardless of the drawing ID, the process finally moves to S37 in FIG. 10, and the value of Yi is incremented by 1 in S37, and then the process moves to S23 in FIG. 9 to repeat the loop.
Through the above steps, a histogram can be drawn for the formed component existing in the selected fraction area.
In this embodiment, if the scattergram information is reflected in the histogram in S35, 43, 53 and 63, the histogram information is calculated in S36, 44, 54 and 64. After reaching 256, histogram information may be calculated.
図14は、実施例2に係る分析装置での手動解析モードの画面70を示す。実施例1では、2次元スキャッタグラムに手動で分画領域を設定し、分画領域内の有形成分について、ヒストグラムを作成していたが、実施例2では、3次元スキャッタグラムに分画領域を設定し、この分画領域内の有形成分について2次元スキャッタグラム及びヒストグラムを作成する。
FIG. 14 shows a
画面70の左上には、X1,X2及びYの3つのデータに基づいて3次元スキャッタグラム71が描画されている。X1,X2及びYは、それぞれ、前方散乱光強度、側方散乱光強度及び側方蛍光強度である。また、3次元スキャッタグラム71には、エリアAからエリアDで示す分画領域が設定されている。この分画領域の形状は、特に限定されない。分画領域は、例えば、X1−Y平面及びX2−Y平面のそれぞれにおいて、実施例1で行ったのと同様の方法で多角形の分画領域71a及び71bを設定し、分画領域71aを通りX2方向に延びる立体と、分画領域71bを通りX1方向に延びる立体の重なりによって形成される立体によって、設定することができる。
A three-
符号72〜74は、それぞれ3次元スキャッタグラムの全領域をX1−Y平面、X2−Y平面、X1−X2平面に投影して得られる2次元スキャッタグラムを示し、符号72a〜74aは、選択された分画領域(エリアA)のみについて、X1−Y平面、X2−Y平面、X1−X2平面に投影して得られる2次元スキャッタグラムを示す。2次元スキャッタグラム73及び74などから明らかなように、全領域についてのスキャタグラムでは、複数エリアが互いに重なっていてエリアAの識別が困難であるが、エリアAのみについての2次元スキャッタグラム72a〜74aでは、エリアAの識別が容易である。従って、2次元スキャッタグラム72a〜74aを見て、エリアAに属する有形成分の分布が適切であるかを判断し、不適切であれば、3次元スキャッタグラム71での分画領域を変更することにより、適切な分画領域の設定が可能となる。
また、符号75〜77は、それぞれ3次元スキャッタグラムの全領域をX1,Y,X2軸に投影して得られるヒストグラムを示し、符号75a〜77aは、選択された分画領域(エリアA)のみについて、X1,Y,X2に投影して得られるヒストグラムを示す。ヒストグラム75〜77から明らかなように、全領域についてのヒストグラムでは、複数エリアが互いに重なっていてエリアAの識別が困難であるが、エリアAのみについてのヒストグラム75a〜77aでは、エリアAの識別が容易である。従って、ヒストグラム75a〜77aを見て、エリアAに属する有形成分の分布が適切であるかを判断し、不適切であれば、3次元スキャッタグラム71での分画領域を変更することにより、適切な分画領域の設定が可能となる。
ここでは、エリアAが選択されている場合を例にとって説明したが、別のエリアを選択すると、そのエリアに属する有形成分について、2次元スキャッタグラム、ヒストグラムが描画される。 Here, the case where the area A is selected has been described as an example. However, when another area is selected, a two-dimensional scattergram and a histogram are drawn for the formed component belonging to the area.
分画領域に属する有形成分のみについて2次元スキャッタグラム、ヒストグラムを描画する方法は、基本的に、実施例1の方法と同様である。実施例1では、Scatterの各要素のうち選択された分画領域に属するもののみをHist_Xに反映させることにより、選択された分画領域に属するもののみについてのヒストグラムを描画していたが、本実施例では、3次元配列Scatter3を準備し、この各要素のうち選択された分画領域に属するもののみを2次元配列Scatter2及び1次元配列Hist_Xに反映させることにより、選択された分画領域に属するもののみについての2次元スキャッタグラム及びヒストグラムを描画することができる。なお、1次元配列Hist_Xは、2次元配列Scatter2に基づいて作成してもよく、この場合、実施例1のS13及びS16と同じ方法で1次元配列Hist_Xを作成することができる。 A method of drawing a two-dimensional scattergram and a histogram only for the formed component belonging to the fractionation area is basically the same as the method of the first embodiment. In the first embodiment, only the elements belonging to the selected fractionation area are reflected in Hist_X by reflecting only the elements belonging to the selected fractionation area among the elements of Scatter. In the embodiment, a three-dimensional array Scatter3 is prepared, and only the elements belonging to the selected fraction area among these elements are reflected in the two-dimensional array Scatter2 and the one-dimensional array Hist_X, so that the selected fraction area is displayed. It is possible to draw a two-dimensional scattergram and a histogram for only what belongs. The one-dimensional array Hist_X may be created based on the two-dimensional array Scatter2. In this case, the one-dimensional array Hist_X can be created by the same method as S13 and S16 in the first embodiment.
なお、上記実施例では、スキャッタグラムと度数分布図(ヒストグラム)とをディスプレイの同一画面(エリア設定画面)に表示させているが、別々の画面に表示させてもよい。また、これらの画面をプリンタによって印刷するようにしてもよい。
また、実施例1では、側方蛍光強度および側方散乱光強度を軸とするスキャッタグラムを用い、実施例2では、前方散乱光強度、側方散乱光強度および側方蛍光強度を軸とするスキャッタグラムを用いているが、スキャッタグラムの軸としては、前方散乱光強度、透過光強度など様々な測定データを用いることができる。
上記実施例では、血球計数装置を用いたが、トナーなどの粒子を分析する粒子分析装置、尿中の有形成分を分析する尿分析装置など、種々の分析装置に本発明を適用することができる。
上記実施例では、動物の血液を測定しているが、人の血液を測定してもよいし、血液以外の体液、例えば肺胞洗浄液などを測定してもよい。
上記実施例では、単一の分画領域に含まれる有形成分は、度数分布図上で単一の色を用いて表現しているが、スキャッタグラムで表示されている色に対応させて度数分布図上の有形成分の色を変更してもよい。
上記実施例では、ヒストグラムは、たて軸に度数が表されているが、横軸に度数を表してもよい。
In the above embodiment, the scattergram and the frequency distribution diagram (histogram) are displayed on the same screen (area setting screen) of the display, but may be displayed on separate screens. These screens may be printed by a printer.
In Example 1, a scattergram having side fluorescence intensity and side scattered light intensity as axes is used. In Example 2, forward scattered light intensity, side scattered light intensity, and side fluorescence intensity are used as axes. Although the scattergram is used, various measurement data such as forward scattered light intensity and transmitted light intensity can be used as the axis of the scattergram.
In the above embodiment, the blood cell counter is used. However, the present invention can be applied to various analyzers such as a particle analyzer for analyzing particles such as toner, and a urine analyzer for analyzing urine components. it can.
In the above embodiment, the blood of the animal is measured. However, the blood of a person may be measured, or body fluid other than blood, such as alveolar lavage fluid, may be measured.
In the above embodiment, the formed component included in the single fraction area is expressed by using a single color on the frequency distribution diagram, but the frequency corresponding to the color displayed in the scattergram is used. You may change the color of the formation on a distribution map.
In the above embodiment, the histogram shows the frequency on the vertical axis, but the frequency may be expressed on the horizontal axis.
1 装置本体
2 データ処理端末
3 ページプリンタ
4 カラーグラフィックプリンタ
5 空圧源
6 サンプラ部
7 データプリンタ
10 試料分析装置
14a、14b 試料吸引部
15 端末本体
16 端末側表示部
18 端末側入力部
19 検出部
20 光学系検出部
22 電気系検出部
24 吸光度検出部
26 本体側制御部
28 本体側入力部
30 本体側表示部
32a 出入力インターフェイス
32b 出入力インターフェイス
33 通信ケーブル
34 端末側制御部
61 スキャッタグラム
62 エリア情報
62a 座標情報
63,64 ヒストグラム
63a,64a コンボボックス
65,66 ヒストグラム情報
DESCRIPTION OF
Claims (12)
血液に含まれる血球から第1のパラメータに関する第1測定データおよび第2のパラメータに関する第2測定データを取得する測定データ取得手段と、
前記第1および第2測定データに基づいて、前記第1および第2のパラメータを軸とし、血液に含まれる血球を複数種類に分類して表示した2次元分布図を作成する2次元分布図作成手段と、
血球が複数種類に分類された前記2次元分布図上にユーザが複数の分画領域を設定する入力を行うための領域設定手段と、
前記領域設定手段によって設定された前記複数の分画領域に属する血球について、前記第1のパラメータを軸とする度数分布図を前記複数の分画領域のそれぞれに対応して作成する度数分布図作成手段と、
前記複数の分画領域が示された前記2次元分布図および前記度数分布図作成手段によって作成された度数分布図を出力する出力手段と、を備え、
設定された分画領域を変更する入力が前記領域設定手段によって行われた場合に、前記度数分布図作成手段は、前記領域設定手段によって変更された分画領域に属する血球に対応して、前記第1のパラメータを軸とする度数分布図を変更し、前記出力手段は、変更された分画領域が示された前記2次元分布図および変更された度数分布図を出力する血液分析装置。 A blood analyzer that classifies blood cells contained in blood collected from animals other than humans into multiple types,
Measurement data acquisition means for acquiring first measurement data relating to the first parameter and second measurement data relating to the second parameter from blood cells contained in the blood ;
Based on the first and second measurement data, wherein the first and second parameters as axes, two-dimensional distribution diagram for creating a two-dimensional distribution diagram displayed by classifying blood cell to a plurality of types contained in the blood Creating means;
An area setting means for inputting a user in the two-dimensional distribution diagram in which blood cells are classified into a plurality of types are set a plurality of fractions region,
Frequency distribution chart creation for creating a frequency distribution chart with the first parameter as an axis for blood cells belonging to the plurality of fraction areas set by the area setting means, corresponding to each of the plurality of fraction areas Means,
An output means for outputting the two-dimensional distribution chart showing the plurality of fractional areas and the frequency distribution chart created by the frequency distribution chart creating means;
When the input for changing the set fraction area is performed by the area setting means, the frequency distribution diagram creating means corresponds to the blood cells belonging to the fraction area changed by the area setting means, the first parameter to change the histogram having axes, and the output means, the blood analyzer you output a frequency distribution diagram modified fractionated regions is changed and the two-dimensional distribution diagram shown.
前記出力手段は、前記複数の分画領域が示された前記2次元分布図および前記領域選択手段によって選択された分画領域に対応する度数分布図を出力する請求項1または2に記載の血液分析装置。 An area selection unit for performing input by which the user selects any one of the plurality of fraction areas;
The blood according to claim 1 or 2, wherein the output means outputs the two-dimensional distribution chart showing the plurality of fractional areas and a frequency distribution chart corresponding to the fractional area selected by the area selection means. Analysis equipment.
前記領域設定手段は、前記ディスプレイに表示されるポインタを移動させるためのポインティングデバイスを備え、
前記分画領域は、ユーザが前記ポインティングデバイスを用いて前記ポインタを前記ディスプレイ上で移動させることによって変更される請求項1〜7のいずれか1項に記載の血液分析装置。 The output means is a display;
Said area setting means, Bei example a pointing device for moving a pointer displayed on said display,
The blood analysis apparatus according to any one of claims 1 to 7, wherein the fractionation area is changed by a user moving the pointer on the display using the pointing device.
血液に含まれる血球から第1のパラメータに関する第1測定データ、第2のパラメータに関する第2測定データおよび第3のパラメータに関する第3測定データを取得する測定データ取得手段と、
前記第1、第2および第3のパラメータを軸とし、血液に含まれる血球を複数種類に分類して表示した3次元分布図を作成する3次元分布図作成手段と、
血球が複数種類に分類された前記3次元分布図上にユーザが複数の分画領域を設定する入力を行うための領域設定手段と、
前記領域設定手段によって設定された前記複数の分画領域に属する血球について、前記第1および第2のパラメータの少なくとも一方を軸とする分布図を前記複数の分画領域のそれぞれに対応して作成する参考用分布図作成手段と、
前記複数の分画領域が示された前記3次元分布図および前記参考用分布図作成手段によって作成された分布図を出力する出力手段と、を備え、
設定された分画領域を変更する入力が前記領域設定手段によって行われた場合に、前記参考用分布図作成手段は、前記領域設定手段によって変更された分画領域に属する血球に対応して、前記第1および第2のパラメータの少なくとも一方を軸とする分布図を変更し、前記出力手段は、変更された分画領域が示された前記3次元分布図および変更された分布図を出力する血液分析装置。 A blood analyzer that classifies blood cells contained in blood collected from animals other than humans into multiple types,
Measurement data acquisition means for acquiring first measurement data relating to the first parameter, second measurement data relating to the second parameter, and third measurement data relating to the third parameter from blood cells contained in the blood ;
It said first, second and third parameters as axes, and the three-dimensional distribution diagram generating means for generating a three-dimensional distribution diagram displayed by classifying blood cell contained in the blood a plurality of types,
An area setting means for inputting the blood cells by the user on the diagram classified the three-dimensional distribution of a plurality of types are set a plurality of fractions region,
For blood cells belonging to the plurality of fractionation areas set by the area setting means, a distribution map having at least one of the first and second parameters as an axis is created corresponding to each of the plurality of fractionation areas. A distribution chart for reference
An output means for outputting the three-dimensional distribution chart showing the plurality of fractional areas and the distribution chart created by the reference distribution chart creating means ;
When the input to change the set fraction area is performed by the area setting means, the reference distribution map creating means corresponds to the blood cells belonging to the fraction area changed by the area setting means, The distribution map having at least one of the first and second parameters as an axis is changed, and the output means outputs the three-dimensional distribution map showing the changed fractional area and the changed distribution map. Blood analyzer.
血液に含まれる血球を複数種類に分類して表示した2次元分布図上にユーザが複数の分画領域を設定する入力を行うための領域設定手段と、
血球が複数種類に分類された前記2次元分布図上に設定された前記複数の分画領域に属する血球について、一次元の度数分布図を前記複数の分画領域のそれぞれに対応して作成する度数分布図作成手段と、
前記複数の分画領域が示された前記2次元分布図および前記度数分布図作成手段によって作成された度数分布図を出力する出力手段と、を備え、
設定された分画領域を変更する入力が前記領域設定手段によって行なわれた場合に、前記度数分布図作成手段は、前記領域設定手段によって変更された分画領域に属する血球に対応して、一次元の度数分布図を変更し、前記出力手段は、変更された分画領域が示された前記2次元分布図および変更された度数分布図を出力する血液分析装置。 A blood analyzer that classifies blood cells contained in blood collected from animals other than humans into multiple types,
An area setting means for inputting a user to set a plurality of fractions area in a two-dimensional distribution diagram of the display to classify the blood cell contained in the blood a plurality of types,
For blood cells belonging to the plurality of fraction areas set on the two-dimensional distribution chart in which blood cells are classified into a plurality of types , a one-dimensional frequency distribution chart is created corresponding to each of the plurality of fraction areas. Frequency distribution chart creation means,
An output means for outputting the two-dimensional distribution chart showing the plurality of fractional areas and the frequency distribution chart created by the frequency distribution chart creating means ;
When the input for changing the set fractional area is performed by the area setting means, the frequency distribution diagram creating means performs primary processing corresponding to the blood cells belonging to the fractional area changed by the area setting means. change the original histogram, and the output means, the blood analyzer you output a frequency distribution diagram modified fractionated regions is changed and the two-dimensional distribution diagram shown.
血液に含まれる血球を複数種類に分類して表示した2次元分布図上にユーザが複数の分画領域を設定する入力を行うための領域設定手段と、
血球が複数種類に分類された前記2次元分布図上に設定された前記複数の分画領域に属する血球について、一次元の度数分布図を前記複数の分画領域のそれぞれに対応して作成する度数分布図作成手段と、
前記複数の分画領域が示された前記2次元分布図および前記度数分布図作成手段によって作成された度数分布図を出力する出力手段として機能させ、
設定された分画領域を変更する入力が前記領域設定手段によって行なわれた場合に、前記度数分布図作成手段は、前記領域設定手段によって変更された分画領域に属する血球に対応して、一次元の度数分布図を変更し、前記出力手段は、変更された分画領域が示された前記2次元分布図および変更された度数分布図を出力する分析プログラム。 A computer in a blood analyzer that classifies blood cells contained in blood collected from animals other than humans into multiple types,
An area setting means for inputting a user to set a plurality of fractions area in a two-dimensional distribution diagram of the display to classify the blood cell contained in the blood a plurality of types,
For blood cells belonging to the plurality of fraction areas set on the two-dimensional distribution chart in which blood cells are classified into a plurality of types , a one-dimensional frequency distribution chart is created corresponding to each of the plurality of fraction areas. Frequency distribution chart creation means,
Function as an output means for outputting the two-dimensional distribution chart showing the plurality of fractional areas and the frequency distribution chart created by the frequency distribution chart creating means ;
When the input for changing the set fractional area is performed by the area setting means, the frequency distribution diagram creating means performs primary processing corresponding to the blood cells belonging to the fractional area changed by the area setting means. change the original histogram, and the output means, the analysis program that outputs a frequency distribution diagram modified fractionated regions is changed and the two-dimensional distribution diagram shown.
血液に含まれる血球を複数種類に分類して表示した2次元分布図上にユーザが複数の分画領域を設定する入力を行う第1工程と、
血球が複数種類に分類された前記2次元分布図上に設定された前記複数の分画領域に属する血球について、一次元の度数分布図を前記複数の分画領域のそれぞれに対応して作成する第2工程と、
前記複数の分画領域が示された前記2次元分布図および前記度数分布図を作成する工程で作成された度数分布図を出力する第3工程と、を備え、
設定された分画領域を変更する入力が前記第1工程で行われた場合に、前記第2工程において、変更された分画領域に属する血球に対応して、一次元の度数分布図を変更し、前記第3工程において、変更された分画領域が示された前記2次元分布図および変更された度数分布図を出力する分画領域設定方法。 A fractionation region setting method used in a blood analyzer that classifies blood cells contained in blood collected from animals other than humans into a plurality of types,
A first step in which a user performs an input to set a plurality of fractional areas on a two-dimensional distribution map in which blood cells contained in blood are classified into a plurality of types and displayed ;
For blood cells belonging to the plurality of fraction areas set on the two-dimensional distribution chart in which blood cells are classified into a plurality of types , a one-dimensional frequency distribution chart is created corresponding to each of the plurality of fraction areas. A second step;
A third step of outputting the frequency distribution diagram created in the step of creating the two-dimensional distribution diagram showing the plurality of fractional regions and the frequency distribution diagram ,
When the input to change the set fractionation area is performed in the first step, the one-dimensional frequency distribution diagram is changed in the second step corresponding to the blood cells belonging to the changed fractionation area. and, wherein in the third step, it modified the fractions region showed you output a two-dimensional distribution diagram and modified histogram fractionation area setting method.
Priority Applications (2)
| Application Number | Priority Date | Filing Date | Title |
|---|---|---|---|
| JP2004193428A JP4746285B2 (en) | 2004-06-30 | 2004-06-30 | Hematology analyzer, analysis program, fractionation area setting method |
| US11/166,209 US8676535B2 (en) | 2004-06-30 | 2005-06-27 | Analyzer |
Applications Claiming Priority (1)
| Application Number | Priority Date | Filing Date | Title |
|---|---|---|---|
| JP2004193428A JP4746285B2 (en) | 2004-06-30 | 2004-06-30 | Hematology analyzer, analysis program, fractionation area setting method |
Publications (3)
| Publication Number | Publication Date |
|---|---|
| JP2006017497A JP2006017497A (en) | 2006-01-19 |
| JP2006017497A5 JP2006017497A5 (en) | 2007-07-19 |
| JP4746285B2 true JP4746285B2 (en) | 2011-08-10 |
Family
ID=35515097
Family Applications (1)
| Application Number | Title | Priority Date | Filing Date |
|---|---|---|---|
| JP2004193428A Active JP4746285B2 (en) | 2004-06-30 | 2004-06-30 | Hematology analyzer, analysis program, fractionation area setting method |
Country Status (2)
| Country | Link |
|---|---|
| US (1) | US8676535B2 (en) |
| JP (1) | JP4746285B2 (en) |
Families Citing this family (20)
| Publication number | Priority date | Publication date | Assignee | Title |
|---|---|---|---|---|
| US8217943B2 (en) * | 2006-04-21 | 2012-07-10 | Beckman Coulter, Inc. | Displaying cellular analysis result data using a template |
| EP3680643A1 (en) | 2007-02-01 | 2020-07-15 | Sysmex Corporation | Sample analyzer and computer program product |
| EP1953526B1 (en) | 2007-02-01 | 2017-08-30 | Sysmex Corporation | Hematological analyzer, method for analyzing body fluid and computer program product |
| JP5350611B2 (en) * | 2007-06-28 | 2013-11-27 | シスメックス株式会社 | Display method and sample analyzer |
| US9322834B2 (en) * | 2007-05-30 | 2016-04-26 | Sysmex Corporation | Sample analyzer, blood analyzer and displaying method |
| US8942458B2 (en) | 2008-06-27 | 2015-01-27 | Furukawa Electric Co., Ltd. | Method for distinguishing and sorting of cells and device therefor |
| EP2348301B1 (en) | 2010-01-08 | 2013-08-21 | Sysmex Corporation | Sample analyzer |
| JP5685378B2 (en) * | 2010-01-08 | 2015-03-18 | シスメックス株式会社 | Sample analyzer and sample analysis method |
| US20130229412A1 (en) | 2010-12-03 | 2013-09-05 | Sony Corporation | 3d data analysis apparatus, 3d data analysis method, and 3d data analysis program |
| JP5707904B2 (en) | 2010-12-03 | 2015-04-30 | ソニー株式会社 | 3D data analysis apparatus and 3D data analysis method |
| JP5691452B2 (en) * | 2010-12-03 | 2015-04-01 | ソニー株式会社 | 3D data analysis apparatus, 3D data analysis method, and 3D data analysis program |
| JP2013088898A (en) | 2011-10-14 | 2013-05-13 | Sony Corp | Device, method and program for 3d data analysis, and microparticle analysis system |
| JP6047870B2 (en) | 2011-10-14 | 2016-12-21 | ソニー株式会社 | Apparatus, method and program for 3D data analysis, and fine particle analysis system |
| JP2015031665A (en) * | 2013-08-06 | 2015-02-16 | トライボテックス株式会社 | Particle counter and particle counting method |
| JP6318026B2 (en) * | 2014-06-26 | 2018-04-25 | アズビル株式会社 | Particle detection apparatus and particle detection method |
| JP6420976B2 (en) * | 2014-06-26 | 2018-11-07 | アズビル株式会社 | Particle detection apparatus and particle detection method |
| WO2017171762A1 (en) * | 2016-03-30 | 2017-10-05 | Siemens Healthcare Diagnostics Inc. | Systems, methods, and apparatus for processing platelet cell data |
| JP6467579B2 (en) * | 2017-04-07 | 2019-02-13 | トライボテックス株式会社 | Particle counting apparatus and particle counting method |
| JP6933063B2 (en) * | 2017-09-07 | 2021-09-08 | 株式会社デンソー | Parallelization method, parallelization tool, in-vehicle device |
| JP7374943B2 (en) * | 2021-02-26 | 2023-11-07 | シスメックス株式会社 | Display method and sample analyzer |
Family Cites Families (12)
| Publication number | Priority date | Publication date | Assignee | Title |
|---|---|---|---|---|
| US4325706A (en) * | 1980-08-15 | 1982-04-20 | Ortho Diagnostic Systems Inc. | Automated detection of platelets and reticulocytes in whole blood |
| JPH03195951A (en) * | 1989-12-25 | 1991-08-27 | Canon Inc | Statistic data display |
| JPH0560752A (en) | 1991-09-04 | 1993-03-12 | Omron Corp | Cell analyzer |
| US5837547A (en) * | 1995-12-27 | 1998-11-17 | Caribbean Microparticles Corporation | Flow cytometer calibration method |
| JPH09218147A (en) * | 1996-02-09 | 1997-08-19 | Toa Medical Electronics Co Ltd | Distribution data measuring device |
| JPH10318904A (en) * | 1996-06-10 | 1998-12-04 | Toa Medical Electronics Co Ltd | Apparatus for analyzing particle image and recording medium recording analysis program therefor |
| JP4215397B2 (en) * | 1998-05-14 | 2009-01-28 | ルミネックス コーポレイション | Multiple analyte diagnostic system |
| JP4101994B2 (en) * | 1999-01-21 | 2008-06-18 | シスメックス株式会社 | Particle analyzer and automatic particle analysis method |
| US6391263B1 (en) | 1999-02-26 | 2002-05-21 | Sysmex Corporation | Automated analyzing system and method therefor |
| US6784981B1 (en) | 2000-06-02 | 2004-08-31 | Idexx Laboratories, Inc. | Flow cytometry-based hematology system |
| EP1349114A3 (en) * | 2002-03-19 | 2011-06-15 | Canon Kabushiki Kaisha | Sensor calibration apparatus, sensor calibration method, program, storage medium, information processing method, and information processing apparatus |
| JP4299597B2 (en) * | 2002-07-29 | 2009-07-22 | シスメックス株式会社 | Hematology analyzer and method |
-
2004
- 2004-06-30 JP JP2004193428A patent/JP4746285B2/en active Active
-
2005
- 2005-06-27 US US11/166,209 patent/US8676535B2/en not_active Expired - Fee Related
Also Published As
| Publication number | Publication date |
|---|---|
| JP2006017497A (en) | 2006-01-19 |
| US8676535B2 (en) | 2014-03-18 |
| US20060004541A1 (en) | 2006-01-05 |
Similar Documents
| Publication | Publication Date | Title |
|---|---|---|
| JP4746285B2 (en) | Hematology analyzer, analysis program, fractionation area setting method | |
| US8885911B2 (en) | Method of, and apparatus and computer software for, implementing image analysis protocols | |
| JP5426181B2 (en) | Specimen processing system, cell image classification apparatus, and specimen processing method | |
| US9726584B2 (en) | Sample imaging apparatus | |
| US8977030B2 (en) | Blood cell image display apparatus, specimen analyzing system, blood cell image display method and computer program product | |
| US8842900B2 (en) | Specimen processing system and blood cell image classifying apparatus | |
| US20140154677A1 (en) | Cell analysis apparatus and cell analysis method | |
| US9322834B2 (en) | Sample analyzer, blood analyzer and displaying method | |
| US20090323062A1 (en) | Sample analyzer, particle distribution diagram displaying method and computer program product | |
| US8779387B2 (en) | Method and system for detecting fluorochromes in a flow cytometer | |
| JP2023511760A (en) | Method and system for classifying fluorescence flow cytometer data | |
| US20090244068A1 (en) | Sample analyzer and computer program product | |
| JP5511149B2 (en) | Biological sample analyzer and biological sample analyzing method | |
| US7394482B2 (en) | Microscope system and method for the analysis and evaluation of multiple colorings of a microscopic specimen | |
| US20210278333A1 (en) | Methods and systems for adjusting a training gate to accommodate flow cytometer data | |
| CN101545861B (en) | Sample analyzer and method | |
| US11761879B2 (en) | Method for processing and displaying multi-channel spectral histograms and systems for same | |
| US20230383234A1 (en) | Biological particle sorting device, biological particle sorting system, and information processing device | |
| WO2020262215A1 (en) | Particle analysis system having autofluorescence spectrum correction | |
| JP5502285B2 (en) | Sample analyzer, sample analysis method, and computer program | |
| CN117612608A (en) | Information processing method, information processing apparatus, and inspection system | |
| CA2489863A1 (en) | Method of,and apparatus and computer software for, implementing image analysis protocols |
Legal Events
| Date | Code | Title | Description |
|---|---|---|---|
| A521 | Request for written amendment filed |
Free format text: JAPANESE INTERMEDIATE CODE: A523 Effective date: 20070604 |
|
| A621 | Written request for application examination |
Free format text: JAPANESE INTERMEDIATE CODE: A621 Effective date: 20070604 |
|
| A977 | Report on retrieval |
Free format text: JAPANESE INTERMEDIATE CODE: A971007 Effective date: 20090928 |
|
| A131 | Notification of reasons for refusal |
Free format text: JAPANESE INTERMEDIATE CODE: A131 Effective date: 20100406 |
|
| A521 | Request for written amendment filed |
Free format text: JAPANESE INTERMEDIATE CODE: A523 Effective date: 20100604 |
|
| A131 | Notification of reasons for refusal |
Free format text: JAPANESE INTERMEDIATE CODE: A131 Effective date: 20100921 |
|
| A521 | Request for written amendment filed |
Free format text: JAPANESE INTERMEDIATE CODE: A523 Effective date: 20101118 |
|
| TRDD | Decision of grant or rejection written | ||
| A01 | Written decision to grant a patent or to grant a registration (utility model) |
Free format text: JAPANESE INTERMEDIATE CODE: A01 Effective date: 20110419 |
|
| A01 | Written decision to grant a patent or to grant a registration (utility model) |
Free format text: JAPANESE INTERMEDIATE CODE: A01 |
|
| A61 | First payment of annual fees (during grant procedure) |
Free format text: JAPANESE INTERMEDIATE CODE: A61 Effective date: 20110513 |
|
| FPAY | Renewal fee payment (event date is renewal date of database) |
Free format text: PAYMENT UNTIL: 20140520 Year of fee payment: 3 |
|
| R150 | Certificate of patent or registration of utility model |
Ref document number: 4746285 Country of ref document: JP Free format text: JAPANESE INTERMEDIATE CODE: R150 Free format text: JAPANESE INTERMEDIATE CODE: R150 |
|
| R250 | Receipt of annual fees |
Free format text: JAPANESE INTERMEDIATE CODE: R250 |
|
| R250 | Receipt of annual fees |
Free format text: JAPANESE INTERMEDIATE CODE: R250 |
|
| R250 | Receipt of annual fees |
Free format text: JAPANESE INTERMEDIATE CODE: R250 |
|
| R250 | Receipt of annual fees |
Free format text: JAPANESE INTERMEDIATE CODE: R250 |