EP2333529A1 - X-ray fluorescence analyzing method - Google Patents
X-ray fluorescence analyzing method Download PDFInfo
- Publication number
- EP2333529A1 EP2333529A1 EP10813564A EP10813564A EP2333529A1 EP 2333529 A1 EP2333529 A1 EP 2333529A1 EP 10813564 A EP10813564 A EP 10813564A EP 10813564 A EP10813564 A EP 10813564A EP 2333529 A1 EP2333529 A1 EP 2333529A1
- Authority
- EP
- European Patent Office
- Prior art keywords
- rays
- scattered
- sample
- primary
- continuous
- Prior art date
- Legal status (The legal status is an assumption and is not a legal conclusion. Google has not performed a legal analysis and makes no representation as to the accuracy of the status listed.)
- Granted
Links
Images



Classifications
-
- G—PHYSICS
- G01—MEASURING; TESTING
- G01N—INVESTIGATING OR ANALYSING MATERIALS BY DETERMINING THEIR CHEMICAL OR PHYSICAL PROPERTIES
- G01N23/00—Investigating or analysing materials by the use of wave or particle radiation, e.g. X-rays or neutrons, not covered by groups G01N3/00 – G01N17/00, G01N21/00 or G01N22/00
- G01N23/22—Investigating or analysing materials by the use of wave or particle radiation, e.g. X-rays or neutrons, not covered by groups G01N3/00 – G01N17/00, G01N21/00 or G01N22/00 by measuring secondary emission from the material
- G01N23/223—Investigating or analysing materials by the use of wave or particle radiation, e.g. X-rays or neutrons, not covered by groups G01N3/00 – G01N17/00, G01N21/00 or G01N22/00 by measuring secondary emission from the material by irradiating the sample with X-rays or gamma-rays and by measuring X-ray fluorescence
-
- G—PHYSICS
- G01—MEASURING; TESTING
- G01N—INVESTIGATING OR ANALYSING MATERIALS BY DETERMINING THEIR CHEMICAL OR PHYSICAL PROPERTIES
- G01N2223/00—Investigating materials by wave or particle radiation
- G01N2223/07—Investigating materials by wave or particle radiation secondary emission
- G01N2223/076—X-ray fluorescence
-
- G—PHYSICS
- G01—MEASURING; TESTING
- G01N—INVESTIGATING OR ANALYSING MATERIALS BY DETERMINING THEIR CHEMICAL OR PHYSICAL PROPERTIES
- G01N2223/00—Investigating materials by wave or particle radiation
- G01N2223/60—Specific applications or type of materials
- G01N2223/637—Specific applications or type of materials liquid
Definitions
- the present invention relates to an X-ray fluorescence analyzing method utilizing a so-called scattered X-rays internal standard method.
- This known method is known as a scattered X-rays internal standard method, in which as internal standard lines the Compton scattering X-rays of the characteristic X-rays of the primary X-rays are utilized.
- the intensity of the Compton scattering X-rays of the characteristic X-rays of the primary X-rays is approximately inversely proportional to the mass absorption coefficient relative to the fluorescent X-rays emitted from the element to be analyzed means that such Compton scattering X-rays are effective as the internal standard line.
- the present invention is intended to provide an X-ray fluorescence analyzing method of a kind utilizing the scattered X-rays internal standard method, with which the concentration of the element to be analyzed, which has the atomic number ranging from 9 to 20 and which is contained in a liquid sample containing, as a principal component, hydrogen and at least one element selected from the group consisting of carbon, oxygen and nitrogen, can be calculated accurately.
- the inventors of the present invention have found that if the scattered X-rays caused by the continuous X-rays included in the primary X-rays are used as an internal standard line and if the wavelength of the scattered X-rays caused by the continuous X-rays in the primary X-rays is so chosen as to be shorter than the wavelength of the fluorescent X-rays emitted from each of the elements to be analyzed, which has the atomic number ranging from 9 to 20 and is so set that the measured intensity of the scattered X-rays, caused by the continuous X-rays in the primary X-rays, and the mass absorption coefficient thereof are inversely proportional to each other within the range of variation of a composition of the liquid sample, the internal standard line reflects the composition of the sample accurately and the concentration of the element to be analyzed can therefore be accurately calculated.
- the present invention is based on this finding.
- the present invention provides an X-ray fluorescence analyzing method which includes with primary X-rays irradiating a liquid sample containing, as principal components, hydrogen and at least one element selected from the group consisting of carbon, oxygen and nitrogen; measuring the intensity of fluorescent X-rays, emitted from each of elements contained in the liquid sample and having the atomic number ranging from 9 to 20, and the intensity of scattered X-rays from the liquid sample caused by continuous X-rays included in the primary X-rays ; and calculating the concentration of each of the elements in the liquid sample, based on the ratio between the measured intensity of the fluorescent X-rays, emitted from each of the elements, and the measured intensity of the scattered X-rays caused by the continuous X-rays in the primary X-rays.
- the wavelength of the scattered X-rays caused by the continuous X-rays in the primary X-rays is so chosen as to be shorter than the wavelength of the fluorescent X-rays emitted from each of the elements and is so set that the measured intensity of the scattered X-rays, caused by the continuous X-rays in the primary X-rays, and the mass absorption coefficient thereof are inversely proportional to each other within the range of variation of a composition of the liquid sample,
- the scattered X-rays internal standard method in which the scattered X-rays caused by the continuous X-rays included in the primary X-rays of the wavelength referred to above is utilized as the internal standard line, is applied to the liquid sample containing, as principal component, hydrogen and at least one element selected from the group consisting of carbon, oxygen and nitrogen, the internal standard line can accurately reflect the composition of the liquid sample and the concentration of the element to be analyzed having the atomic number ranging from 9 to 20 can be calculated accurately.
- the wavelength of the scattered X-rays of the continuous X-rays of the primary X-rays is preferably set to a value within the range of 0.1042 to 0.2505 nm.
- the wavelength of the scattered X-rays of the continuous X-rays of the primary X-rays, when the element contained in the liquid sample has the atomic number of 15 to 17, is preferably set to a value within the range of 0.123 to 0.193 nm.
- the X-ray fluorescence spectrometer includes a sample support 8 on which a sample 3 to be analyzed is placed, an X-ray source 1 such as, for example, an X-ray tube for irradiating the sample 3 with primary X-rays 2, and a detecting unit 9 for measuring respective intensities of fluorescent X-rays 4 and scattered X-rays 12 both emitted from the sample 3.
- an X-ray fluorescence spectrometer includes a sample support 8 on which a sample 3 to be analyzed is placed, an X-ray source 1 such as, for example, an X-ray tube for irradiating the sample 3 with primary X-rays 2, and a detecting unit 9 for measuring respective intensities of fluorescent X-rays 4 and scattered X-rays 12 both emitted from the sample 3.
- the detecting unit 9 in turn includes a spectroscopic device 5 for monochromating the fluorescent X-rays 4 and the scattered X-rays 12, both emitted from the sample 3 as described above, and a detector 7 for measuring each of the fluorescent X-rays 6 and the scattered X-rays 12, which have been monochromated.
- a detector having a high energy resolution may be employed for the detecting unit.
- the X-ray fluorescence spectrometer employed in the practice of the X-ray fluorescence analyzing method according to this embodiment of the present invention may be either a wavelength dispersion type or of an energy dispersion type.
- radiation of the primary X-rays 2 towards the sample 3 may also be either a top radiation, in which the radiation is made from top, or a bottom radiation, in which the radiation is made from bottom.
- the illustrated X-ray fluorescence spectrometer also includes a calculating unit 10 such as, for example, a computer for calculating the concentration of an element contained in the sample 3, based on the intensity, measured by the detecting unit 9, of the fluorescent X-rays 4 which have been emitted from each of the elements contained in the sample 3 and having the atomic number ranging from 9 to 20, and an input unit 11 such as, for example, a mouse, a keyboard and/or a touch panel for inputting an instruction to cause the calculating unit 10 to calculate the concentration of each element, contained in the sample 3, with the use of the scattered X-rays internal standard method and the respective wavelengths of the fluorescent X-rays 4 and the scattered X-rays 12 both to be measured by the detecting unit 9.
- a calculating unit 10 such as, for example, a computer for calculating the concentration of an element contained in the sample 3, based on the intensity, measured by the detecting unit 9, of the fluorescent X-rays 4 which have been emitted from each of the elements contained
- an object to be analyzed by the X-ray fluorescence analyzing method is a liquid sample 3A containing, as a principal component, hydrogen and at least one element selected from the group consisting of carbon, oxygen and nitrogen (noting that the composition of the principal component varies depending on the liquid sample 3A), and this liquid sample 3A is hermetically accommodated within any known holder having a window through which the X-rays are permitted to penetrate.
- the calculating unit 10 calculates the concentrations of the elements in the sample 3A, based on the ratio between the intensity, measured by the detecting unit 9, of the fluorescent X-rays 4 emitted from each of the elements contained in the sample 3A and having the atomic number ranging from 9 to 20, and the intensity, also measured by the detecting unit 9, of the scattered X-rays 12 caused by the continuous X-rays included in the primary X-rays.
- the wavelength of the to-be-detected scattered X-rays caused by the continuous X-rays included in the primary X-rays may be shorter than the wavelength of the fluorescent X-rays 4 that will be emitted from each of the elements and, within the range of variation of the composition of the liquid sample 3A, the intensity measured of the scattered X-rays 12 caused by the continuous X-rays included in the primary X-rays and the mass absorption coefficient thereof may be inversely proportional relative to each other, and such setting is inputted. More specifically, the to-be-detected wavelength of the scattered X-rays 13 caused by the continuous X-rays included in the primary X-rays is set to be within the range of 0.1042 to 0.2505 nm and is then inputted.
- the X-ray fluorescence analyzing method is an X-ray fluorescence analyzing method, in which the liquid sample 3A containing, as a principal component, hydrogen ant at least one element selected from the group consisting of carbon, oxygen and nitrogen, is irradiated with the primary X-rays 2, measuring the intensity of the fluorescent X-rays 4, emitted from each of the elements contained in the liquid sample 3A and having the atomic number ranging from 9 to 20, and the intensity of the X-rays 12 which are scattered from the liquid sample 3A as a result of excitation by the continuous X-rays included in the primary X-ray, and calculating the concentration of each of the elements contained in the liquid sample 3A, based on the ratio between the intensity of the fluorescent X-rays 4 emitted from each of the elements contained in the sample 3A and the intensity of the scattered X-rays 12 caused by the continuous X-rays included in the primary X-rays.
- the wavelength of the scattered X-rays 12 caused by the continuous X-rays included in the primary X-rays is so set as to be shorter than the fluorescent X-ray emitted from each of the elements, and so set that within the range of variation of the composition of the liquid sample 3A, the intensity measured of the scattered X-rays 12 caused by the continuous X-rays included in the primary X-rays and the mass absorption coefficient thereof may be inversely proportional relative to each other, specifically, within the range of 0.1042 to 0.2505 nm.
- the concentration of the element to be analyzed which is a light element (which, in the present invention, means an element having the atomic number ranging from 9 to 20) such as, for example, sulfur is to be determined by applying the scattered X-rays internal standard method to the liquid sample such as, for example, oils, organic solvent or aqueous solution which contains, as a principal component, hydrogen and at least one element selected from the group consisting of carbon, oxygen and nitrogen, regarding scattered X-rays as an internal standard line
- the proportion of the scattering power between the Compton scattering and the Thomson scattering is important in the first instance.
- the Compton scattering power makes little difference in the case of the elements having the atomic number of 2 or more, but is about twice that exhibited by any other elements having only hydrogen
- the Compton scattering X-rays caused by the characteristic X-rays included in the primary X-rays such as, for example, the Compton scattering X-rays of Rh - K ⁇ line cannot be used as the internal standard line where the sample contains a substantial amount of hydrogen.
- the scattered X-rays caused by the continuous X-rays in the primary X-rays contain both of the Compton scattering X-rays and the Thomson scattering X-rays, the use as the internal standard line will now be examined.
- I Scat k s ⁇ P Comp + P T hom ⁇ samp ⁇ 1 - e - ⁇ samp ⁇ d
- I Scat represents the intensity of the scattered X-rays caused by the continuous X-rays
- ⁇ Samp represents the mass absorption coefficient of the sample
- P Comp represents the Compton scattering power of the sample
- P Thom represents the Thomson scattering power of the sample
- d represents the area density of the sample
- k s represents the constant.
- the ratio between the intensity of the scattered X-rays caused by the continuous X-rays and the intensity of the fluorescent X-rays of the substantially same wavelength can be expressed by the following formula (5) regardless of the thickness of the sample:
- the sum (P Comp + P Thom ) of the Compton scattering power and the Thomson scattering power must be constant regardless of the composition of the sample.
- the intensity of the scattered X-rays caused by the continuous X-rays is inversely proportional to the mass absorption coefficient of the wavelength of such scattered X-rays.
- the proportion of the Compton scattering power and the Thomson scattering power depends on the wavelength of the scattered X-rays caused by the continuous X-rays and the longer the wavelength, the relatively higher the Thomson scattering power. Also, as discussed previously, with respect to the Compton scattering power, hydrogen exhibits about twice that in any other element, but with respect to the Thomson scattering power, hydrogen is conversely extremely small. In view of this, it may be expected that if the wavelength of the scattered X-rays caused by the continuous X-rays is properly chosen, the dependency of the total scattering power, which is the sum of the Compton and Thomson scattering powers, on the composition of the sample can be reduced.
- the relation with the mass absorption coefficient has been examined by measuring the intensity of the scattered X-rays caused by the continuous X-rays when the sample used has an infinite thickness. More specifically, using liquid samples of different compositions such as, for example, oils, but containing hydrogen, carbon and oxygen, the relation between the measured intensity (relative intensity) of the scattered X-rays of 0.1607 nm in wavelength, caused by the continuous X-rays, and the reciprocal number of the mass absorption coefficient thereof has been examined, the result of which is shown in Fig. 2 . A similar examination has also been made with respect to the scattered X-rays of 0.2776 nm in wavelength caused by the continuous X-rays, the result of which is shown in Fig. 3 .
- the scattered X-rays are emitted from a deep region of the sample when excited by the X-rays of a short wavelength and it is shielded by, for example, a mask of a holder before they are detected, it has been confirmed that regarding the optical system of the apparatus used and the amount of the sample (depth of the sample), the scattered X-rays of the above described two wavelengths caused by the continuous X-rays and generated from the sample in a direction of detection could have been detected without being shielded.
- FIG. 4 a conceptual diagram of the detecting range and the depth of penetration of the scattered X-rays 12, caused by the continuous X-rays in the primary X-rays, when the liquid sample 3A accommodated within a holder 14, which has its bottom surface formed with an window 14a defined therein for passage of X-rays therethrough, is irradiated from below with the primary X-rays 2, is shown in Fig. 4 .
- the measured intensity and the reciprocal number of the mass absorption coefficient is in a good proportion to each other, that is, the measured intensity and the mass absorption coefficient are in a good inverse proportion to each other.
- the scattered X-rays of 0.2776 nm in wavelength caused by the continuous X-rays no good correlation could have been obtained between the measured intensity and the reciprocal number of the mass absorption coefficient. The wavelength that results in the good correlation as shown in Fig.
- the thickness of the sample too is important.
- the ratio of intensity between the fluorescent X-rays, emitted from the element to be analyzed, and the background in the vicinity of the wavelength thereof is utilized, but the ratio of the intensity thereof is expressed by the following formula (6), which is identical with the formula (5) referred to previously.
- the radio of the mass absorption coefficient ⁇ F samp relative to the fluorescent X-rays emitted from the element to be analyzed and the mass absorption coefficient ⁇ S samp relative to the scattered X-rays caused by the continuous X-rays in the primary X-rays must be constant regardless of whether or not the composition of the sample changes.
- the sample contains, as principal components, hydrogen, carbon, nitrogen and oxygen and also contains a minute quantity of sulfur as an element to be analyzed other than the principal components referred to above
- the mass absorption coefficient (cm 2 /g) of each of the principal components relative to the fluorescent X-rays S - K ⁇ line (0.5373 nm in wavelength) of the element to be analyzed the mass absorption coefficient (cm 2 /g) of each of the principal components relative to the scattered X-rays (0.1607 nm in wavelength) caused by the continuous X-rays in the primary X-rays, and the ratio between those two mass absorption coefficients under the principal components referred to above are shown in Table 1 below.
- composition 1 and Composition 2 consisting of only hydrogen, carbon and oxygen as shown in Table 2
- the mass absorption coefficient (cm 2 /g) of each of the compositions relative to the fluorescent X-rays S - K ⁇ line (0.5373 nm in wavelength) of the element to be analyzed the mass absorption coefficient (cm 2 /g) of each of the compositions relative to the scattered X-rays (0.1607 nm in wavelength) caused by the continuous X-rays in the primary X-rays
- ratio between those two mass absorption coefficients under the compositions referred to above are shown in Table 3 below.
- the radio between the mass absorption coefficient relative to the fluorescent X-rays emitted from the element to be analyzed and the mass absorption coefficient relative to the scattered X-rays caused by the continuous X-rays in the primary X-rays is close to constant regardless of whether or not the composition changes.
- the ratio between those two mass absorption coefficients of hydrogen differs considerably from the ratio of any other principal component, the absolute value of the mass absorption coefficient of hydrogen is sufficiently smaller than the absolute value of the mass absorption coefficient of any other principal component and, therefore, the influence brought about by the mass absorption coefficient of hydrogen on the mass absorption coefficient of the composition in its entirety becomes sufficiently minimized.
- liquid paraffin tetrahydronaphthalene, decahydronaphthalene, decane, xylene, turpentine oil, decanol, pentanol, hexanol, linolic acid and oleic acid as respective liquid samples and, also, sulfur of a concentration within the range of 0 to 0.54 mass% as an element to be analyzed, and while the calibration curve exhibited particularly when no correction was made is shown in Fig.
- the background in the vicinity of the wavelength of the fluorescent X-rays emitted from the element to be analyzed is used as the internal standard line
- the scattered X-rays caused by the continuous X-rays of a wavelength shorter than the wavelength of the fluorescent X-rays (S - K ⁇ line of 0.5373 nm in wavelength in this instance) emitted from the element to be analyzed becomes effective as the internal standard line in the determination of the concentration of the element to be analyzed, which is contained in the liquid sample containing, as principal components hydrogen and at least one element selected from the group consisting of carbon, oxygen and nitrogen and which has the atomic number ranging from 9 to 20.
- the sample contains a relatively high concentration of additive elements and depending on the kind of the lubricant oil, the base oil differs.
- the mass absorption coefficient (cm 2 /g) of the calcium relative to the fluorescent X-rays S - K ⁇ line (0.5373 nm in wavelength) exhibited by the element to be analyzed the mass absorption coefficient (cm 2 /g) of the calcium relative to the scattered X-rays (0.1607 nm in wavelength) caused by the continuous X-rays included in the primary X-rays, and the ratio between those two mass absorption coefficients are shown in Table 4 below: It is to be noted that the absorption edge of Ca - K is 0.307 nm and exists between the wavelength of the fluorescent X-rays S - K ⁇ line exhibited by the element to be analyzed and the wavelength of the scattered X-rays caused
- the absolute value of the mass absorption coefficient exhibited with calcium is greater than the absolute value of the mass absorption coefficient exhibited with the carbon, nitrogen and oxygen, and, therefore, any influence, which the mass absorption coefficient exhibited with calcium may bring about on the mass absorption coefficient exhibited with the sample as a whole cannot be negligible.
- a so-called matrix correction can be carried out following the formula (9) below, by using such element in a matrix correction factor and measuring the intensity of the fluorescent X-rays from such element:
- W i A ⁇ I F I Scat + B ⁇ 1 + ⁇ ⁇ j ⁇ W j
- W i represents the content of the element to be analyzed
- a and B represents calibration curve constants
- ⁇ j represents the matrix correction constant
- W j represents the content of the element in a matrix correction factor.
- the matrix correction constant ⁇ j shown in the formula (9) may be determined experimentally by a regression calculation after measurement has been made of a standard sample of a known composition, but containing the element to be analyzed and the element in a matrix correction factor or, alternatively, by calculating the theoretical intensity of the scattered X-rays and the fluorescent X-rays according to the FP method. In the latter case, the method will be a sort of the semi-fundamental parameter method (SFP method) of the calibration curve technique.
- SFP method semi-fundamental parameter method
- the calibration curve exhibited when the scattered X-rays internal standard correction in accordance with the present invention has been made using a lubricant oil and an oil, which is not a lubricant oil, as respective liquid samples, and, also, sulfur as an element to be analyzed and calcium as an element in a matrix correction factor and, also, using the scattered X-rays of 0.1607 nm in wavelength caused by the continuous X-rays in the primary X-rays as the internal standard line, is shown in Fig. 9 .
- the calibration curve shown in Fig. 9 makes it clear that the influence which may be brought about by the sample composition could have been properly removed by the correction. It is to be noted that although nothing was made during the preparation of the calibration curve shown in Fig.
- the scattered X-rays internal standard method in which the scattered X-rays 12 caused by the continuous X-rays included in the primary X-rays, of a wavelength set to a value as hereinbefore described as the internal standard line is applied to the liquid sample 3A containing, as principal components, hydrogen and at least one element selected from the group consisting of carbon, oxygen and nitrogen, the internal standard line can accurately reflect the composition of the liquid sample 3A and the concentration of the element to be analyzed, which has the atomic number ranging from 9 to 20, can be calculated accurately.
- the desirable apparatus sensitivity curve which was obtained in connection with the ratio between the intensity of the fluorescent X-rays S - K ⁇ line (0.5373 nm in wavelength) exhibited by the element to be analyzed and the intensity of the scattered X-rays (0.1344 nm in wavelength) caused by the continuous X-rays in the primary X-rays as the internal standard line, when the measurement was carried out with various oils used as liquid samples, is shown in Fig. 10 . It will readily be understood that even in the X-ray fluorescence analyzing method utilizing the fundamental parameter method, the scattered X-rays internal standard correction according to the present invention is effective to properly remove the influence brought about by the sample composition.
- Fig. 11 The correlation between the calibration accuracy (ppm) and the reciprocal number 1/ ⁇ (1/nm) of the wavelength of the scattered X-rays used as the internal standard line, caused by the continuous X-rays in the primary X-rays, which is exhibited in the calibration curve of sulfur (atomic number being 16) of 500 ppm level prepared by effecting the scattered X-rays internal standard correction according to the present invention, is shown in Fig. 11 . According to the chart shown in Fig.
- the calibration accuracy is 15 ppm or smaller at a wavelength within the range of 0.1042 to 0.2505 nm of the scattered X-ray caused by the continuous X-rays in the primary X-rays and, based on this, in the X-ray fluorescence analyzing method according to the foregoing embodiment of the present invention, the wavelength of the scattered X-rays caused by the continuous X-rays in the primary X-rays is chosen to be a value within the range of 0.1042 to 0.2505 nm relative to the element in the liquid sample, having the atomic number ranging from 9 to 20 with sulfur taken as a center. Also, the chart of Fig.
- the wavelength of the scattered X-rays caused by the continuous X-rays in the primary X-rays is preferably set to a value within the range of 0.123 to 0.193 nm relative to the element in the liquid sample, having the atomic number ranging from 15 to 17 with sulfur taken as a center.
Landscapes
- Physics & Mathematics (AREA)
- Health & Medical Sciences (AREA)
- Life Sciences & Earth Sciences (AREA)
- Chemical & Material Sciences (AREA)
- Analytical Chemistry (AREA)
- Biochemistry (AREA)
- General Health & Medical Sciences (AREA)
- General Physics & Mathematics (AREA)
- Immunology (AREA)
- Pathology (AREA)
- Analysing Materials By The Use Of Radiation (AREA)
Abstract
Description
- This application is based on and claims Convention priority to Japanese patent application No.
2009-205822, filed September 7, 2009 - The present invention relates to an X-ray fluorescence analyzing method utilizing a so-called scattered X-rays internal standard method.
- In the field of X-ray fluorescence analysis, such a method has hitherto been available, in which in determining the content of a metal (an element to be analyzed) contained in, for example, a mineral sample, the ratio between the intensity of fluorescent X-rays, emitted from the element to be analyzed, and the intensity of Compton scattering X-rays of characteristic X-rays of primary X-rays is utilized in order to minimize inter-element effect on the absorption of the fluorescent X-rays emitted from the element to be analyzed. (See the
Patent Documents Non-patent Document 1 listed below.) Also, another method is currently available, in which for the internal standard line, a background in a vicinity of a wavelength of an analytical line, that is, scattered X-rays of a wavelength near the spectrum of the fluorescent X-rays of the element to be analyzed is utilized. (See thePatent Documents - [Patent Document 1]
JP Laid-open Patent Publication No. H10-82749
(See paras. [0037] to [0040]) - [Patent Document 2]
JP Patent Publication No. 3569734
(See paras. [0039], [0036] and [0075]) - [Patent Document 3]
JP Laid-open Patent Publication No. 2008-298679
(See paras. [0001] to [0005] and [0024]) - [Non-patent Document 1] Yoshiyuki Kataoka, et al., "Doseiren ni Okeru Keiko X-sen Bunseki", Advances in X-ray Chemical Analysis, 1981, Vol. 13, p. 145 - 52.
- [Non-patent Document 2] Rigaku Denki Kogyo Kabushiki Kaisha, Oyo Gijutsu Center (Applied Technology Center), "Keiko X-sen Bunseki Jisshu Tekisuto (Text for Exercise in X-ray Fluorescence Analysis)", First print of 4-th edition, Rigaku Denki Kogyo Kabushiki Kaisha, February, 1997, p. 37
- It has, however, been found that if an attempt is made to determine the concentration (content) of sulfur (an element to be analyzed, which has the atomic number ranging from 9 to 20) contained in, for example, oil relative to a liquid sample such as, for example, oils, organic solvent or aqueous solution, that is, a liquid sample containing, as a principal component, hydrogen and at least one element selected from the group consisting of carbon, oxygen and nitrogen (all of which are a so-called non-measurable element of which fluorescent X-rays cannot be measured as a matter of fact) by the application of the above described prior art technology, the concentration of the element to be analyzed cannot be accurately determined because due to the non-measurable elements contained in quantity in the sample, the internal standard line fail to reflect the composition of the sample accurately.
- In view of the foregoing problems inherent in the prior art methods, the present invention is intended to provide an X-ray fluorescence analyzing method of a kind utilizing the scattered X-rays internal standard method, with which the concentration of the element to be analyzed, which has the atomic number ranging from 9 to 20 and which is contained in a liquid sample containing, as a principal component, hydrogen and at least one element selected from the group consisting of carbon, oxygen and nitrogen, can be calculated accurately.
- The inventors of the present invention have found that if the scattered X-rays caused by the continuous X-rays included in the primary X-rays are used as an internal standard line and if the wavelength of the scattered X-rays caused by the continuous X-rays in the primary X-rays is so chosen as to be shorter than the wavelength of the fluorescent X-rays emitted from each of the elements to be analyzed, which has the atomic number ranging from 9 to 20 and is so set that the measured intensity of the scattered X-rays, caused by the continuous X-rays in the primary X-rays, and the mass absorption coefficient thereof are inversely proportional to each other within the range of variation of a composition of the liquid sample, the internal standard line reflects the composition of the sample accurately and the concentration of the element to be analyzed can therefore be accurately calculated. The present invention is based on this finding.
- Accordingly, the present invention provides an X-ray fluorescence analyzing method which includes with primary X-rays irradiating a liquid sample containing, as principal components, hydrogen and at least one element selected from the group consisting of carbon, oxygen and nitrogen; measuring the intensity of fluorescent X-rays, emitted from each of elements contained in the liquid sample and having the atomic number ranging from 9 to 20, and the intensity of scattered X-rays from the liquid sample caused by continuous X-rays included in the primary X-rays ; and calculating the concentration of each of the elements in the liquid sample, based on the ratio between the measured intensity of the fluorescent X-rays, emitted from each of the elements, and the measured intensity of the scattered X-rays caused by the continuous X-rays in the primary X-rays. In this X-ray fluorescence analyzing method; the wavelength of the scattered X-rays caused by the continuous X-rays in the primary X-rays is so chosen as to be shorter than the wavelength of the fluorescent X-rays emitted from each of the elements and is so set that the measured intensity of the scattered X-rays, caused by the continuous X-rays in the primary X-rays, and the mass absorption coefficient thereof are inversely proportional to each other within the range of variation of a composition of the liquid sample,
- According to the present invention, the scattered X-rays internal standard method, in which the scattered X-rays caused by the continuous X-rays included in the primary X-rays of the wavelength referred to above is utilized as the internal standard line, is applied to the liquid sample containing, as principal component, hydrogen and at least one element selected from the group consisting of carbon, oxygen and nitrogen, the internal standard line can accurately reflect the composition of the liquid sample and the concentration of the element to be analyzed having the atomic number ranging from 9 to 20 can be calculated accurately.
- In the practice of the method of the present invention, the wavelength of the scattered X-rays of the continuous X-rays of the primary X-rays is preferably set to a value within the range of 0.1042 to 0.2505 nm. Also, the wavelength of the scattered X-rays of the continuous X-rays of the primary X-rays, when the element contained in the liquid sample has the atomic number of 15 to 17, is preferably set to a value within the range of 0.123 to 0.193 nm.
- In any event, the present invention will become more clearly understood from the following description of preferred embodiments thereof, when taken in conjunction with the accompanying drawings. However, the embodiments and the drawings are given only for the purpose of illustration and explanation, and are not to be taken as limiting the scope of the present invention in any way whatsoever, which scope is to be determined by the appended claims.
In the accompanying drawings, like reference numerals are used to denote like parts throughout the several views, and: -
Fig. 1 is a schematic diagram showing an apparatus with which the X-ray fluorescence analyzing method according to a preferred embodiment of the present invention can be practiced; -
Fig. 2 is a chart showing the relation between the measured intensity and the reciprocal number of the mass absorption coefficient, which is obtained when the scattered X-rays of 0.1607 nm in wavelength caused by the continuous X-rays in the primary X-rays from a liquid sample such as, for example, an oil was examined; -
Fig. 3 is a chart showing the relation between the measured intensity and the reciprocal number of the mass absorption coefficient, which is obtained when the scattered X-rays of 0.2776 nm in wavelength caused by the continuous X-rays in the primary X-rays from a liquid sample such as, for example, an oil was examined; -
Fig 4 is a conceptual diagram showing the depth of penetration of the scattered X-rays of the continuous X-rays of the primary X-rays and a range of detection; -
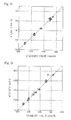
Fig. 5A is a chart showing one example that the measured intensity and the theoretical intensity are in linear relation to each other even when the amount of the sample is increased; -
Fig. 5B is a chart showing another example that the measured intensity and the theoretical intensity are in linear relation to each other even when the amount of the sample is increased; -
Fig. 6 is a chart showing another example that the measured intensity and the theoretical intensity depart from the linear relation when the amount of the sample is increased; -
Fig. 7 is a chart showing the calibration curve exhibited by sulfur contained in a liquid sample such as, for example, an oil or organic solvent when no correction is specifically made; -
Fig. 8 is a chart showing the calibration curve exhibited by sulfur contained in a liquid sample such as, for example, an oil or organic solvent when the scattered X-rays internal standard correction is made in accordance with the present invention; -
Fig. 9 is a chart showing the calibration curve exhibited by sulfur contained in a liquid sample such as, for example, a lubricant oil when the scattered X-rays internal standard correction is made in accordance with the present invention with matrix correction by calcium as a correcting element; -
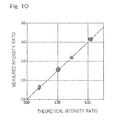
Fig. 10 is a chart showing an apparatus sensitivity curve exhibited by sulfur, which is obtained when the scattered X-rays internal standard correction according to the present invention is effected to a variety of oils used as liquid samples; and; -
Fig. 11 is a chart showing the correlation betweenreciprocal number 1/λ (1/nm) of the wavelength of the scattered X-rays, caused by the continuous X-rays in the primary X-rays and used as the internal standard line, and calibration accuracy (ppm), which are exhibited in the calibration curve of sulfur of 500 ppm in level prepared by effecting the scattered X-rays internal standard correction according to the present invention. - Before the description of the X-ray fluorescence analyzing method according to a preferred embodiment of the present invention proceeds, an apparatus used in the practice of the X-ray fluorescence analyzing method of the present invention, that is, an X-ray fluorescence spectrometer will be described in detail with particular reference to Figs. As shown in
Fig. 1 , the X-ray fluorescence spectrometer includes asample support 8 on which asample 3 to be analyzed is placed, anX-ray source 1 such as, for example, an X-ray tube for irradiating thesample 3 withprimary X-rays 2, and a detecting unit 9 for measuring respective intensities offluorescent X-rays 4 and scatteredX-rays 12 both emitted from thesample 3. The detecting unit 9 in turn includes a spectroscopic device 5 for monochromating thefluorescent X-rays 4 and thescattered X-rays 12, both emitted from thesample 3 as described above, and adetector 7 for measuring each of thefluorescent X-rays 6 and thescattered X-rays 12, which have been monochromated. It is to be noted that without the spectroscopic device 5 being employed, a detector having a high energy resolution may be employed for the detecting unit. In other words, the X-ray fluorescence spectrometer employed in the practice of the X-ray fluorescence analyzing method according to this embodiment of the present invention may be either a wavelength dispersion type or of an energy dispersion type. Also, radiation of theprimary X-rays 2 towards thesample 3 may also be either a top radiation, in which the radiation is made from top, or a bottom radiation, in which the radiation is made from bottom. - The illustrated X-ray fluorescence spectrometer also includes a calculating
unit 10 such as, for example, a computer for calculating the concentration of an element contained in thesample 3, based on the intensity, measured by the detecting unit 9, of thefluorescent X-rays 4 which have been emitted from each of the elements contained in thesample 3 and having the atomic number ranging from 9 to 20, and aninput unit 11 such as, for example, a mouse, a keyboard and/or a touch panel for inputting an instruction to cause the calculatingunit 10 to calculate the concentration of each element, contained in thesample 3, with the use of the scattered X-rays internal standard method and the respective wavelengths of thefluorescent X-rays 4 and thescattered X-rays 12 both to be measured by the detecting unit 9. Although not shown in detail inFig. 1 , an object to be analyzed by the X-ray fluorescence analyzing method according to the embodiment now under discussion is aliquid sample 3A containing, as a principal component, hydrogen and at least one element selected from the group consisting of carbon, oxygen and nitrogen (noting that the composition of the principal component varies depending on theliquid sample 3A), and thisliquid sample 3A is hermetically accommodated within any known holder having a window through which the X-rays are permitted to penetrate. - When the instruction to calculate the concentration of each element in the
sample 3 by the use of the scattered X-rays internal standard method and the respective wavelengths of thefluorescent X-rays 4 and thescattered X-rays 12, which are to be measured, are inputted to theinput unit 11, the calculatingunit 10 calculates the concentrations of the elements in thesample 3A, based on the ratio between the intensity, measured by the detecting unit 9, of thefluorescent X-rays 4 emitted from each of the elements contained in thesample 3A and having the atomic number ranging from 9 to 20, and the intensity, also measured by the detecting unit 9, of thescattered X-rays 12 caused by the continuous X-rays included in the primary X-rays. At this moment, setting is made so that the wavelength of the to-be-detected scattered X-rays caused by the continuous X-rays included in the primary X-rays may be shorter than the wavelength of thefluorescent X-rays 4 that will be emitted from each of the elements and, within the range of variation of the composition of theliquid sample 3A, the intensity measured of thescattered X-rays 12 caused by the continuous X-rays included in the primary X-rays and the mass absorption coefficient thereof may be inversely proportional relative to each other, and such setting is inputted. More specifically, the to-be-detected wavelength of the scattered X-rays 13 caused by the continuous X-rays included in the primary X-rays is set to be within the range of 0.1042 to 0.2505 nm and is then inputted. - In other words, the X-ray fluorescence analyzing method according to the embodiment of the present invention is an X-ray fluorescence analyzing method, in which the
liquid sample 3A containing, as a principal component, hydrogen ant at least one element selected from the group consisting of carbon, oxygen and nitrogen, is irradiated with theprimary X-rays 2, measuring the intensity of thefluorescent X-rays 4, emitted from each of the elements contained in theliquid sample 3A and having the atomic number ranging from 9 to 20, and the intensity of theX-rays 12 which are scattered from theliquid sample 3A as a result of excitation by the continuous X-rays included in the primary X-ray, and calculating the concentration of each of the elements contained in theliquid sample 3A, based on the ratio between the intensity of thefluorescent X-rays 4 emitted from each of the elements contained in thesample 3A and the intensity of thescattered X-rays 12 caused by the continuous X-rays included in the primary X-rays. At this moment, the wavelength of thescattered X-rays 12 caused by the continuous X-rays included in the primary X-rays is so set as to be shorter than the fluorescent X-ray emitted from each of the elements, and so set that within the range of variation of the composition of theliquid sample 3A, the intensity measured of thescattered X-rays 12 caused by the continuous X-rays included in the primary X-rays and the mass absorption coefficient thereof may be inversely proportional relative to each other, specifically, within the range of 0.1042 to 0.2505 nm. - The reason for the use of the scattered X-rays caused by the continuous X-rays included in the primary X-rays of such a wavelength as the internal standard line will now be described subsequently. Where the concentration of the element to be analyzed, which is a light element (which, in the present invention, means an element having the atomic number ranging from 9 to 20) such as, for example, sulfur is to be determined by applying the scattered X-rays internal standard method to the liquid sample such as, for example, oils, organic solvent or aqueous solution which contains, as a principal component, hydrogen and at least one element selected from the group consisting of carbon, oxygen and nitrogen, regarding scattered X-rays as an internal standard line, the proportion of the scattering power between the Compton scattering and the Thomson scattering is important in the first instance.
- Considering that the Compton scattering power makes little difference in the case of the elements having the atomic number of 2 or more, but is about twice that exhibited by any other elements having only hydrogen, the Compton scattering X-rays caused by the characteristic X-rays included in the primary X-rays such as, for example, the Compton scattering X-rays of Rh - Kα line cannot be used as the internal standard line where the sample contains a substantial amount of hydrogen. On the other hand, since the scattered X-rays caused by the continuous X-rays in the primary X-rays contain both of the Compton scattering X-rays and the Thomson scattering X-rays, the use as the internal standard line will now be examined. At the outset, the intensity of the scattered X-rays caused by the continuous X-rays when the sample has a finite thickness in terms of the X-rays, it can be expressed by the following formula (1) for simplicity:

wherein IScat represents the intensity of the scattered X-rays caused by the continuous X-rays; µSamp represents the mass absorption coefficient of the sample, PComp represents the Compton scattering power of the sample, PThom represents the Thomson scattering power of the sample, d represents the area density of the sample, and ks represents the constant. - When the sample has an infinite thickness in terms of the X-rays regarding this wavelength, the following formula (2) can be obtained:

- On the other hand, the intensity of the fluorescent X-rays of the same wavelength, when the sample has a finite thickness, can be expressed by the following formula (3) for simplicity:

wherein IF represents the intensity of the fluorescent X-rays, Fi represents the efficiency of generation of the fluorescent drays, and Wi represents the content of the element to be analyzed. - When the sample has an infinite thickness regarding the fluorescent X-rays of this wavelength, the following formula (4) can be obtained:

- Accordingly, the ratio between the intensity of the scattered X-rays caused by the continuous X-rays and the intensity of the fluorescent X-rays of the substantially same wavelength can be expressed by the following formula (5) regardless of the thickness of the sample:

- As can readily be understood from the formula (5) above, in order to compensate for an influence of the composition of the sample with the use of the scattered X-rays, caused by the continuous X-rays in the primary X-rays, as the internal standard line, the sum (PComp + PThom) of the Compton scattering power and the Thomson scattering power must be constant regardless of the composition of the sample. Also, as can readily be understood from the formula (2) above, that the sum of the Compton scattering power and the Thomson scattering power is constant regardless of the composition of the sample is equivalent to that regarding the sample having the infinite thickness, the intensity of the scattered X-rays caused by the continuous X-rays is inversely proportional to the mass absorption coefficient of the wavelength of such scattered X-rays.
- The proportion of the Compton scattering power and the Thomson scattering power depends on the wavelength of the scattered X-rays caused by the continuous X-rays and the longer the wavelength, the relatively higher the Thomson scattering power. Also, as discussed previously, with respect to the Compton scattering power, hydrogen exhibits about twice that in any other element, but with respect to the Thomson scattering power, hydrogen is conversely extremely small. In view of this, it may be expected that if the wavelength of the scattered X-rays caused by the continuous X-rays is properly chosen, the dependency of the total scattering power, which is the sum of the Compton and Thomson scattering powers, on the composition of the sample can be reduced.
- Accordingly, the relation with the mass absorption coefficient has been examined by measuring the intensity of the scattered X-rays caused by the continuous X-rays when the sample used has an infinite thickness. More specifically, using liquid samples of different compositions such as, for example, oils, but containing hydrogen, carbon and oxygen, the relation between the measured intensity (relative intensity) of the scattered X-rays of 0.1607 nm in wavelength, caused by the continuous X-rays, and the reciprocal number of the mass absorption coefficient thereof has been examined, the result of which is shown in
Fig. 2 . A similar examination has also been made with respect to the scattered X-rays of 0.2776 nm in wavelength caused by the continuous X-rays, the result of which is shown inFig. 3 . - Since during the measurement of the sample having the infinite thickness, the scattered X-rays are emitted from a deep region of the sample when excited by the X-rays of a short wavelength and it is shielded by, for example, a mask of a holder before they are detected, it has been confirmed that regarding the optical system of the apparatus used and the amount of the sample (depth of the sample), the scattered X-rays of the above described two wavelengths caused by the continuous X-rays and generated from the sample in a direction of detection could have been detected without being shielded. In this respect, a conceptual diagram of the detecting range and the depth of penetration of the
scattered X-rays 12, caused by the continuous X-rays in the primary X-rays, when theliquid sample 3A accommodated within aholder 14, which has its bottom surface formed with anwindow 14a defined therein for passage of X-rays therethrough, is irradiated from below with theprimary X-rays 2, is shown inFig. 4 . - It is to be noted that when confirmation was to be made, whether or not the intensity measured of the scattered X-rays of the above described two wavelengths, caused by the continuous X-rays, and the theoretical intensity thereof calculated by the fundamental parameter method (FP method) are linearly proportional to each other was examined with the sample amount of the same sample being gradually increased, and, then, the infinite thickness for each sample amount, at which the intensity does no longer increase, was determined. Where by the time the scattered X-rays emitted from the sample is detected, they are shielded by, for example, the mask of the holder, the measured intensity and the theoretical intensity depart from the proportional relation to each other as the sample amount is increased. In the case where polypropylene is used as a sample, an example, in which the measured intensity and the theoretical intensity exhibit the linear proportional relation to each other is shown in
Fig. 5A (the wavelength of the scattered X-rays being 0.1344 nm) andFig. 5B (the wavelength of the scattered X-rays being 0.1607 nm) and a case, in which they depart from the linear proportional relation is shown inFig. 6 (the wavelength of the scattered X-rays being 0.0653 nm). - As shown in
Fig. 2 , with respect to the scattered X-rays of 0.1607 nm in wavelength caused by the continuous X-rays, the measured intensity and the reciprocal number of the mass absorption coefficient is in a good proportion to each other, that is, the measured intensity and the mass absorption coefficient are in a good inverse proportion to each other. On the other hand, as shown inFig. 3 , with respect to the scattered X-rays of 0.2776 nm in wavelength caused by the continuous X-rays, no good correlation could have been obtained between the measured intensity and the reciprocal number of the mass absorption coefficient. The wavelength that results in the good correlation as shown inFig. 2 depends on the optical system of the apparatus, the kind of the liquid sample and the concentration of the element to be analyzed, but where mineral oil, vegetable oil, alcohol and water were used as respective liquid samples and sulfur of a concentration within the range of 0 to 5 mass% was chosen to be an element to be analyzed with the apparatus used during the experiment, a good correlation could have been obtained with respect to the scattered X-rays of 0.1042 to 0.2505 nm in wavelength caused by the continuous X-rays. - Also, the thickness of the sample too is important. In the prior art, in determining the content of a heavy element contained in a plastic material having an finite thickness, the ratio of intensity between the fluorescent X-rays, emitted from the element to be analyzed, and the background in the vicinity of the wavelength thereof is utilized, but the ratio of the intensity thereof is expressed by the following formula (6), which is identical with the formula (5) referred to previously.

- In other words, since the wavelength of the fluorescent X-rays emitted from the element to be analyzed and the wavelength of the background are substantially identical with each other, it can readily be understood that if the term of the scattering power is constant, an influence of the thickness of the sample and an influence of the composition of the sample can be corrected as shown by the formula (6) above.
- However, where the wavelength of the fluorescent X-rays emitted from the element to be analyzed and the wavelength of the scattered X-rays caused by the continuous X-rays in the primary X-rays are different from each other, it can be understood that the influence of the sample thickness and the influence of the sample composition can no longer be corrected as is clear from the following formula (7):

wherein µF Samp represents the mass absorption coefficient of the sample relative to the fluorescent X-rays and µS Samp represents the mass absorption coefficient of the sample relative to the scattered X-rays. - In order to alleviate the foregoing problem, if the amount of the sample results in an infinite thickness thereof as hereinbefore described and all of the fluorescent X-rays, generated from the sample and emitted from the element to be analyzed, and the scattered X-rays caused by the continuous X-rays in the primary X-rays are detected without being shielded, the ratio in intensity between the both can be expressed as shown by the following formula (8):

- As can readily be understood from the formula (8) above, when the scattered X-rays caused by the continuous X-rays in the primary X-rays are used as the internal standard line, the radio of the mass absorption coefficient µF samp relative to the fluorescent X-rays emitted from the element to be analyzed and the mass absorption coefficient µS samp relative to the scattered X-rays caused by the continuous X-rays in the primary X-rays must be constant regardless of whether or not the composition of the sample changes. Accordingly, assuming that the sample contains, as principal components, hydrogen, carbon, nitrogen and oxygen and also contains a minute quantity of sulfur as an element to be analyzed other than the principal components referred to above, the mass absorption coefficient (cm2/g) of each of the principal components relative to the fluorescent X-rays S - Kα line (0.5373 nm in wavelength) of the element to be analyzed, the mass absorption coefficient (cm2/g) of each of the principal components relative to the scattered X-rays (0.1607 nm in wavelength) caused by the continuous X-rays in the primary X-rays, and the ratio between those two mass absorption coefficients under the principal components referred to above are shown in Table 1 below.
Table 1 H C N O 0.5373 nm 0.7925 198.997 313.288 468.299 0.1607nm 0.3833 5.1527 8.261 13.0729 Mass Absorption Coefficient Ratio 2.0676 38.620 37.924 35.899 - According to Table 1 above, with the carbon, nitrogen and oxygen, the ratio between those two mass absorption coefficients referred to above attains the substantially same value and only the ratio of the mass absorption coefficient with the hydrogen attains a value considerably different from that with any other elements. In the next place, assuming two different compositions (
Composition 1 and Composition 2) consisting of only hydrogen, carbon and oxygen as shown in Table 2, the mass absorption coefficient (cm2/g) of each of the compositions relative to the fluorescent X-rays S - Kα line (0.5373 nm in wavelength) of the element to be analyzed, the mass absorption coefficient (cm2/g) of each of the compositions relative to the scattered X-rays (0.1607 nm in wavelength) caused by the continuous X-rays in the primary X-rays, and the ratio between those two mass absorption coefficients under the compositions referred to above are shown in Table 3 below.Table 2 Composition H (mass%) C (mass%) O (mass%) Composition 114.37 85.63 0.00 Composition 24.20 62.50 33.30 Table 3 Composition 1Composition 20.5373 nm 170.5 280.7 0.1607 nm 4.47 7.59 Ratio 38.2 37.0 - As can readily be understood from Table 3 above, the radio between the mass absorption coefficient relative to the fluorescent X-rays emitted from the element to be analyzed and the mass absorption coefficient relative to the scattered X-rays caused by the continuous X-rays in the primary X-rays is close to constant regardless of whether or not the composition changes. This is because as shown in Table 1, though the ratio between those two mass absorption coefficients of hydrogen differs considerably from the ratio of any other principal component, the absolute value of the mass absorption coefficient of hydrogen is sufficiently smaller than the absolute value of the mass absorption coefficient of any other principal component and, therefore, the influence brought about by the mass absorption coefficient of hydrogen on the mass absorption coefficient of the composition in its entirety becomes sufficiently minimized.
- Using a liquid paraffin, tetrahydronaphthalene, decahydronaphthalene, decane, xylene, turpentine oil, decanol, pentanol, hexanol, linolic acid and oleic acid as respective liquid samples and, also, sulfur of a concentration within the range of 0 to 0.54 mass% as an element to be analyzed, and while the calibration curve exhibited particularly when no correction was made is shown in
Fig. 7 , the calibration curve, exhibited when the scattered X-rays internal standard correction is carried out in accordance with the present invention when the scattered X-rays of 0.1607 nm in wavelength caused by the continuous X-rays in the primary X-rays was used as the internal standard line, is shown inFig. 8 . While the calibration curve shown inFig. 7 is unacceptable because it was considerably affected by the sample composition, the calibration curve shown inFig. 8 reveals that the influence brought about by the sample composition has been properly removed owning to the correction. In other words, unlike the case, in which in determining the content of a heavy element in a plastic material having a finite thickness with the use of the conventional technique, the background in the vicinity of the wavelength of the fluorescent X-rays emitted from the element to be analyzed is used as the internal standard line, the scattered X-rays caused by the continuous X-rays of a wavelength shorter than the wavelength of the fluorescent X-rays (S - Kα line of 0.5373 nm in wavelength in this instance) emitted from the element to be analyzed becomes effective as the internal standard line in the determination of the concentration of the element to be analyzed, which is contained in the liquid sample containing, as principal components hydrogen and at least one element selected from the group consisting of carbon, oxygen and nitrogen and which has the atomic number ranging from 9 to 20. - By the way, where the liquid sample is a lubricant oil, the sample contains a relatively high concentration of additive elements and depending on the kind of the lubricant oil, the base oil differs. By way of example, assuming that a lubricant oil containing calcium is a sample, the mass absorption coefficient (cm2/g) of the calcium relative to the fluorescent X-rays S - Kα line (0.5373 nm in wavelength) exhibited by the element to be analyzed, the mass absorption coefficient (cm2/g) of the calcium relative to the scattered X-rays (0.1607 nm in wavelength) caused by the continuous X-rays included in the primary X-rays, and the ratio between those two mass absorption coefficients are shown in Table 4 below: It is to be noted that the absorption edge of Ca - K is 0.307 nm and exists between the wavelength of the fluorescent X-rays S - Kα line exhibited by the element to be analyzed and the wavelength of the scattered X-rays caused by the continuous X-rays in the primary X-rays as the internal standard line.
Table 4 Ca 0.5373 nm 534.24 0.1607 nm 193.81 Absorption Coefficient Ratio 2.756 - Not only does the ratio between those two mass absorption coefficients exhibited with calcium differ considerably from the ratio exhibited with the carbon, nitrogen and oxygen shown in Table 1, but also unlike the case with the hydrogen, the absolute value of the mass absorption coefficient exhibited with calcium is greater than the absolute value of the mass absorption coefficient exhibited with the carbon, nitrogen and oxygen, and, therefore, any influence, which the mass absorption coefficient exhibited with calcium may bring about on the mass absorption coefficient exhibited with the sample as a whole cannot be negligible.
- As hereinabove discussed, where the element having the absorption edge lying between the wavelength of the fluorescent X-rays emitted from the element to be analyzed and the wavelength of the scattered X-rays caused by the continuous X-rays in the primary X-rays as the internal standard line is contained in the sample, a so-called matrix correction can be carried out following the formula (9) below, by using such element in a matrix correction factor and measuring the intensity of the fluorescent X-rays from such element:

wherein Wi represents the content of the element to be analyzed, A and B represents calibration curve constants, αj represents the matrix correction constant, and Wj represents the content of the element in a matrix correction factor. - The matrix correction constant αj shown in the formula (9) may be determined experimentally by a regression calculation after measurement has been made of a standard sample of a known composition, but containing the element to be analyzed and the element in a matrix correction factor or, alternatively, by calculating the theoretical intensity of the scattered X-rays and the fluorescent X-rays according to the FP method. In the latter case, the method will be a sort of the semi-fundamental parameter method (SFP method) of the calibration curve technique.
- The calibration curve, exhibited when the scattered X-rays internal standard correction in accordance with the present invention has been made using a lubricant oil and an oil, which is not a lubricant oil, as respective liquid samples, and, also, sulfur as an element to be analyzed and calcium as an element in a matrix correction factor and, also, using the scattered X-rays of 0.1607 nm in wavelength caused by the continuous X-rays in the primary X-rays as the internal standard line, is shown in
Fig. 9 . The calibration curve shown inFig. 9 makes it clear that the influence which may be brought about by the sample composition could have been properly removed by the correction. It is to be noted that although nothing was made during the preparation of the calibration curve shown inFig. 9 , even when the sample contains an element having an absorption edge at a site outside a site between the respective wavelengths of the fluorescent X-rays emitted from the element to be analyzed and the wavelength of the scattered X-rays caused by the continuous X-rays in the primary X-rays as the internal standard line, for the purpose of a further accurate analysis it is desirable to use such element as an element in a matrix correction factor, to measure the intensity of the fluorescent X-rays thereof and, then, to perform the matrix correction according to the formula (9) referred to above. - According to the method of the present invention as hereinabove fully described, since the scattered X-rays internal standard method, in which the scattered
X-rays 12 caused by the continuous X-rays included in the primary X-rays, of a wavelength set to a value as hereinbefore described as the internal standard line is applied to theliquid sample 3A containing, as principal components, hydrogen and at least one element selected from the group consisting of carbon, oxygen and nitrogen, the internal standard line can accurately reflect the composition of theliquid sample 3A and the concentration of the element to be analyzed, which has the atomic number ranging from 9 to 20, can be calculated accurately. - It is to be noted that although in the foregoing description, the embodiment of the present invention, in which the calibration curve method is utilized, has been described, the present invention can be equally applied to the X-ray fluorescence analyzing method in which the fundamental parameter method is utilized and even in this case, functions and effects similar to those described hereinbefore can be equally obtained. For example, the desirable apparatus sensitivity curve, which was obtained in connection with the ratio between the intensity of the fluorescent X-rays S - Kα line (0.5373 nm in wavelength) exhibited by the element to be analyzed and the intensity of the scattered X-rays (0.1344 nm in wavelength) caused by the continuous X-rays in the primary X-rays as the internal standard line, when the measurement was carried out with various oils used as liquid samples, is shown in
Fig. 10 . It will readily be understood that even in the X-ray fluorescence analyzing method utilizing the fundamental parameter method, the scattered X-rays internal standard correction according to the present invention is effective to properly remove the influence brought about by the sample composition. - The correlation between the calibration accuracy (ppm) and the
reciprocal number 1/λ (1/nm) of the wavelength of the scattered X-rays used as the internal standard line, caused by the continuous X-rays in the primary X-rays, which is exhibited in the calibration curve of sulfur (atomic number being 16) of 500 ppm level prepared by effecting the scattered X-rays internal standard correction according to the present invention, is shown inFig. 11 . According to the chart shown inFig. 11 , the calibration accuracy is 15 ppm or smaller at a wavelength within the range of 0.1042 to 0.2505 nm of the scattered X-ray caused by the continuous X-rays in the primary X-rays and, based on this, in the X-ray fluorescence analyzing method according to the foregoing embodiment of the present invention, the wavelength of the scattered X-rays caused by the continuous X-rays in the primary X-rays is chosen to be a value within the range of 0.1042 to 0.2505 nm relative to the element in the liquid sample, having the atomic number ranging from 9 to 20 with sulfur taken as a center. Also, the chart ofFig. 11 makes it clear that since the calibration accuracy is 5 ppm or smaller at a wavelength within the range of 0.123 to 0.193 nm of the wavelength of the scattered X-rays caused by the continuous X-rays in the primary X-rays, the wavelength of the scattered X-rays caused by the continuous X-rays in the primary X-rays is preferably set to a value within the range of 0.123 to 0.193 nm relative to the element in the liquid sample, having the atomic number ranging from 15 to 17 with sulfur taken as a center. - Although the present invention has been fully described in connection with the preferred embodiments thereof with reference to the accompanying drawings which are used only for the purpose of illustration, those skilled in the art will readily conceive numerous changes and modifications within the framework of obviousness upon the reading of the specification herein presented of the present invention. Accordingly, such changes and modifications are, unless they depart from the scope of the present invention as delivered from the claims annexed hereto, to be construed as included therein.
-
- 1:
- X-ray source
- 2:
- Primary X-rays
- 3:
- Sample
- 3A:
- Liquid sample
- 4:
- Fluorescent X-rays
- 9:
- Detecting unit
- 10:
- Calculating unit
- 11:
- Input unit
- 12:
- Scattered X-rays caused by continuous X-rays included in primary X-rays
Claims (3)
- An X-ray fluorescence analyzing method which comprises:with primary X-rays irradiating a liquid sample containing, as principal components, hydrogen and at least one element selected from the group consisting of carbon, oxygen and nitrogen;measuring the intensity of fluorescent X-rays, emitted from each of elements contained in the liquid sample and having the atomic number ranging from 9 to 20, and the intensity of scattered X-rays from the liquid sample caused by continuous X-rays in the primary X-rays; andcalculating the concentration of each of the elements in the liquid sample, based on the ratio between the measured intensity of the fluorescent X-rays, emitted from each of the elements, and the measured intensity of the scattered X-rays caused by the continuous X-rays in the primary X-rays;wherein the wavelength of the scattered X-rays caused by the continuous X-rays in the primary X-rays is so chosen as to be shorter than the wavelength of the fluorescent X-rays emitted from each of the elements and is so set that the measured intensity of the scattered X-rays, caused by the continuous X-rays in the primary X-rays, and the mass absorption coefficient thereof are inversely proportional to each other within the range of variation of a composition of the liquid sample.
- The X-ray fluorescence analyzing method as claimed in claim 1, in which the wavelength of the scattered X-rays caused by the continuous X-rays in the primary X-rays is chosen to be within the range of 0.1042 to 0.2505 nm.
- The X-ray fluorescence analyzing method as claimed in claim 1, in which the wavelength of the scattered X-rays caused by the continuous X-rays in the primary X-rays is chosen to be within the range of 0.123 to 0.193 nm relative to the element contained in the liquid sample and having the atomic number ranging from 15 to 17.
Applications Claiming Priority (2)
| Application Number | Priority Date | Filing Date | Title |
|---|---|---|---|
| JP2009205822 | 2009-09-07 | ||
| PCT/JP2010/061250 WO2011027613A1 (en) | 2009-09-07 | 2010-07-01 | Fluorescent x-ray analysis method |
Publications (3)
| Publication Number | Publication Date |
|---|---|
| EP2333529A1 true EP2333529A1 (en) | 2011-06-15 |
| EP2333529A4 EP2333529A4 (en) | 2011-09-07 |
| EP2333529B1 EP2333529B1 (en) | 2013-10-16 |
Family
ID=43638545
Family Applications (1)
| Application Number | Title | Priority Date | Filing Date |
|---|---|---|---|
| EP10813564.1A Active EP2333529B1 (en) | 2009-09-07 | 2010-07-01 | X-ray fluorescence analyzing method |
Country Status (6)
| Country | Link |
|---|---|
| US (1) | US8433035B2 (en) |
| EP (1) | EP2333529B1 (en) |
| JP (1) | JP4629158B1 (en) |
| CN (1) | CN102187208B (en) |
| BR (1) | BRPI1005172B8 (en) |
| WO (1) | WO2011027613A1 (en) |
Families Citing this family (18)
| Publication number | Priority date | Publication date | Assignee | Title |
|---|---|---|---|---|
| EP2333529B1 (en) | 2009-09-07 | 2013-10-16 | Rigaku Corporation | X-ray fluorescence analyzing method |
| US20110304437A1 (en) * | 2010-06-09 | 2011-12-15 | Plus Location Systems USA LLC | Antenna and Sensor System for Sharply Defined Active Sensing Zones |
| US9164047B2 (en) * | 2010-10-08 | 2015-10-20 | Bruker Axs Gmbh | Apparatus and method for supporting a liquid sample for measuring scattering of electromagnetic radiation |
| JP2013053873A (en) * | 2011-09-01 | 2013-03-21 | Jeol Ltd | Spectrum display device, spectrum display method, and program |
| DE102012204350B4 (en) | 2012-03-20 | 2021-12-02 | Siemens Healthcare Gmbh | Method for energy calibration of quantum-counting X-ray detectors in a dual-source computer tomograph |
| CN103940836A (en) * | 2013-01-22 | 2014-07-23 | 中国科学院青海盐湖研究所 | Liquid X ray scattering sample cell |
| WO2015056305A1 (en) * | 2013-10-15 | 2015-04-23 | 株式会社島津製作所 | X-ray fluorescence analysis method and x-ray fluorescence analysis device |
| FR3030043B1 (en) * | 2014-12-12 | 2017-12-22 | Commissariat Energie Atomique | METHOD FOR STUDYING A ZONE OF AN OBJECT TO DETERMINE A MASS THICKNESS AND A COMPOSITION USING AN ELECTRON BEAM AND INTENSITY MEASUREMENTS OF X-RAY |
| US10018748B2 (en) | 2015-01-16 | 2018-07-10 | Saudi Arabian Oil Company | Inline density and fluorescence spectrometry meter |
| US9784699B2 (en) * | 2015-03-03 | 2017-10-10 | Panalytical B.V. | Quantitative X-ray analysis—matrix thickness correction |
| CN107923859B (en) | 2015-08-28 | 2018-12-21 | 株式会社理学 | Fluorescent x-ray analyzer |
| CN106908466A (en) * | 2017-03-29 | 2017-06-30 | 中国科学院过程工程研究所 | A kind of online X-ray fluorescence spectra analysis system |
| CN110998300B (en) * | 2017-08-07 | 2022-12-09 | 上村工业株式会社 | Measuring method for fluorescent X-ray analysis and measuring device for fluorescent X-ray analysis |
| JP6979650B2 (en) * | 2018-03-13 | 2021-12-15 | 株式会社リガク | X-ray fluorescence analysis method, X-ray fluorescence analyzer or program |
| CN110132188B (en) * | 2019-06-19 | 2020-11-10 | 中国人民解放军空军工程大学 | Coating permeation layer thickness calculation method based on multi-element X-ray characteristic spectrum comprehensive analysis |
| JP7302504B2 (en) * | 2020-02-27 | 2023-07-04 | 株式会社島津製作所 | X-ray fluorescence analyzer |
| JP7497058B2 (en) | 2021-12-01 | 2024-06-10 | 株式会社リガク | X-ray fluorescence analyzer |
| EP4276452B1 (en) * | 2022-05-13 | 2024-07-03 | Bruker AXS GmbH | System and method for determining mass fractions in a test sample with wave-length dispersive x-ray fluorescence spectrometers |
Family Cites Families (14)
| Publication number | Priority date | Publication date | Assignee | Title |
|---|---|---|---|---|
| JPS5459193A (en) | 1977-10-19 | 1979-05-12 | Mitsubishi Electric Corp | Fluorescent x-ray sulfur analytical apparatus |
| JPS6482749A (en) | 1987-09-24 | 1989-03-28 | Nec Corp | Announcement machine |
| JPH01214748A (en) | 1988-02-24 | 1989-08-29 | Nippon I T S Kk | Method and apparatus for fluorescent x-ray analysis for minute amount of sample liquid |
| JP3059403B2 (en) * | 1996-07-18 | 2000-07-04 | 理学電機工業株式会社 | X-ray analysis method and apparatus |
| JP3569734B2 (en) * | 2000-09-04 | 2004-09-29 | 理学電機工業株式会社 | X-ray fluorescence analyzer |
| US7298817B2 (en) * | 2003-12-01 | 2007-11-20 | X-Ray Optical Systems, Inc. | Portable and on-line arsenic analyzer for drinking water |
| JP4247559B2 (en) * | 2005-06-07 | 2009-04-02 | 株式会社リガク | X-ray fluorescence analyzer and program used therefor |
| JP4262734B2 (en) * | 2005-09-14 | 2009-05-13 | 株式会社リガク | X-ray fluorescence analyzer and method |
| JP4908119B2 (en) * | 2005-10-19 | 2012-04-04 | 株式会社リガク | X-ray fluorescence analyzer |
| JP3950156B1 (en) | 2006-04-11 | 2007-07-25 | 理学電機工業株式会社 | X-ray fluorescence analyzer |
| EP1978354A1 (en) * | 2007-04-05 | 2008-10-08 | Panalytical B.V. | Wavelength dispersive X-ray Fluorescence Apparatus with energy dispersive detector in the form of a silicon drift detector to improve background supression |
| JP4514772B2 (en) | 2007-06-01 | 2010-07-28 | 株式会社リガク | X-ray fluorescence analyzer and method |
| JP2009205822A (en) | 2008-02-26 | 2009-09-10 | Panasonic Electric Works Co Ltd | Illumination fixture |
| EP2333529B1 (en) | 2009-09-07 | 2013-10-16 | Rigaku Corporation | X-ray fluorescence analyzing method |
-
2010
- 2010-07-01 EP EP10813564.1A patent/EP2333529B1/en active Active
- 2010-07-01 JP JP2010150813A patent/JP4629158B1/en active Active
- 2010-07-01 CN CN2010800029349A patent/CN102187208B/en active Active
- 2010-07-01 US US13/123,121 patent/US8433035B2/en active Active
- 2010-07-01 BR BRPI1005172A patent/BRPI1005172B8/en not_active IP Right Cessation
- 2010-07-01 WO PCT/JP2010/061250 patent/WO2011027613A1/en not_active Ceased
Non-Patent Citations (8)
| Title |
|---|
| BUI C ET AL: "Use of compton scattering in quantitative XRF analysis of stained glass", APPLIED RADIATION AND ISOTOPES, INTERNATIONAL JOURNAL OFRADIATION APPLICATIONS AND INSTRUMENTATION, PART A, PERGAMON PRESS LTD, GB, vol. 40, no. 5, 1 January 1989 (1989-01-01), pages 375-380, XP024706419, ISSN: 0883-2889, DOI: DOI:10.1016/0883-2889(89)90200-1 [retrieved on 1989-01-01] * |
| COUTURE: "A reexamination of absorption and enhancement effects in X-ray fluorescence trace element analysis", THE AMERICAN MINERALOGIST, vol. 81, no. 5-6, 1 January 1996 (1996-01-01), pages 639-650, XP55003424, ISSN: 0003-004X * |
| DAVID LEROY. TAYLOR ET AL: "Evaluation of an isolated atom model in the use of scattered radiation for internal standardization in x-ray fluorescence analysis", ANALYTICAL CHEMISTRY, vol. 43, no. 6, 1 May 1971 (1971-05-01), pages 712-716, XP55003486, ISSN: 0003-2700, DOI: 10.1021/ac60301a018 * |
| GEORGE R. AND M. SCHIEKEL: "Application Limits in using backscattered radiation for Matrix Correction in X-ray Fluorescence Analysis", JOURNAL OF RADIOANALYTICAL CHEMISTRY, vol. 79, no. 2, 1983, XP002652856, * |
| KIRK K. NIELSON: "Matrix corrections for energy dispersive x-ray fluorescence analysis of environmental samples with coherent/incoherent scattered x-rays", ANALYTICAL CHEMISTRY, vol. 49, no. 4, 1 April 1977 (1977-04-01), pages 641-648, XP55003101, ISSN: 0003-2700, DOI: 10.1021/ac50012a034 * |
| L. BONIZZONI ET AL: "Direct evaluation of self-absorption effects in dark matrices by Compton scattering measurements", X-RAY SPECTROMETRY, vol. 29, no. 6, 1 November 2000 (2000-11-01), pages 443-448, XP55003083, ISSN: 0049-8246, DOI: 10.1002/1097-4539(200011/12)29:6<443::AID- XRS451>3.3.CO;2-2 * |
| N. H. CLARK ET AL: "Scattered primary radiation as an internal standard in X-ray emission spectrometry: Use in the analysis of copper metallurgical products", X-RAY SPECTROMETRY, vol. 2, no. 2, 1 April 1973 (1973-04-01), pages 47-55, XP55003491, ISSN: 0049-8246, DOI: 10.1002/xrs.1300020203 * |
| See also references of WO2011027613A1 * |
Also Published As
| Publication number | Publication date |
|---|---|
| US8433035B2 (en) | 2013-04-30 |
| CN102187208A (en) | 2011-09-14 |
| JP2011075542A (en) | 2011-04-14 |
| BRPI1005172B1 (en) | 2019-09-10 |
| JP4629158B1 (en) | 2011-02-09 |
| CN102187208B (en) | 2013-12-04 |
| BRPI1005172A2 (en) | 2017-04-25 |
| EP2333529B1 (en) | 2013-10-16 |
| EP2333529A4 (en) | 2011-09-07 |
| WO2011027613A1 (en) | 2011-03-10 |
| BRPI1005172B8 (en) | 2020-09-08 |
| US20110243301A1 (en) | 2011-10-06 |
Similar Documents
| Publication | Publication Date | Title |
|---|---|---|
| EP2333529B1 (en) | X-ray fluorescence analyzing method | |
| DE102012112866B4 (en) | X-ray fluorescence spectrometer and X-ray fluorescence analyzer | |
| Markowicz | An overview of quantification methods in energy-dispersive X-ray fluorescence analysis | |
| EP2185921B1 (en) | Differentiation of lead in surface layers and in bulk samples by x-ray fluorescence | |
| US9606065B2 (en) | Quantitative analysis method for measuring target element in specimen using laser-induced plasma spectrum | |
| Omote et al. | X-ray fluorescence analysis utilizing the fundamental parameter method for the determination of the elemental composition in plant samples | |
| EP4105649B1 (en) | Quantitative analysis method, quantitative analysis program, and fluorescence x-ray analysis device | |
| EP1764612B1 (en) | X-ray fluorescence spectrometer and x-ray fluorescence measurement method | |
| CN118566278B (en) | A method and system for determining element content | |
| Kempenaers et al. | The use of synchrotron micro-XRF for characterization of the micro-heterogeneity of heavy metals in low-Z reference materials | |
| JP3965173B2 (en) | X-ray fluorescence analyzer and program used therefor | |
| EP1877760B1 (en) | Method and device for the online determination of the ash content of a substance conveyed on a conveying means, and device for carrying out such an online determination | |
| Li et al. | Investigation of a high-pressure pressed powder pellet technique for the analysis of coal by wavelength dispersive X-ray fluorescence spectroscopy | |
| Szilágyi et al. | Development of an X-ray fluorescence spectrometric method for the analysis of atmospheric aerosol samples | |
| RU2362149C1 (en) | Method of determining element concentration and phase of said element in substance with complex chemical composition | |
| RU2367933C1 (en) | Method for detection of sulphur concentration in oil and oil products | |
| Shi et al. | Rapid and Portable Detection of Heavy Metals in Plastic Food Packaging Materials Using ED-XRF with Monochromatic Excitation and Fundamental Parameter Calibration | |
| JP5618240B2 (en) | Quantitative analysis method | |
| Kempenaers et al. | Micro-heterogeneity study of trace elements in BCR CRM 680 by means of synchrotron micro-XRF | |
| Gething et al. | Assessment of laser induced breakdown spectroscopy (LIBS) for classification of preservative in CCA-treated lumber | |
| RU2524454C1 (en) | Method of determining concentration of element in substance of complex chemical composition | |
| Kunimura et al. | Optimization of a glancing angle for simultaneous trace elemental analysis by using a portable total reflection X-ray fluorescence spectrometer | |
| JP2022153952A (en) | Quantitative analysis method, quantitative analysis system, and program for quantitative analysis system | |
| US20260110650A1 (en) | X-ray fluorescence spectrometer | |
| Stec et al. | Comparison of different methods for calculating elemental concentrations in tissue sections based on μ-XRF measurements |
Legal Events
| Date | Code | Title | Description |
|---|---|---|---|
| PUAI | Public reference made under article 153(3) epc to a published international application that has entered the european phase |
Free format text: ORIGINAL CODE: 0009012 |
|
| 17P | Request for examination filed |
Effective date: 20110504 |
|
| AK | Designated contracting states |
Kind code of ref document: A1 Designated state(s): AL AT BE BG CH CY CZ DE DK EE ES FI FR GB GR HR HU IE IS IT LI LT LU LV MC MK MT NL NO PL PT RO SE SI SK SM TR |
|
| AX | Request for extension of the european patent |
Extension state: BA ME RS |
|
| RIC1 | Information provided on ipc code assigned before grant |
Ipc: G01N 23/203 20060101ALI20110727BHEP Ipc: G01N 23/223 20060101AFI20110727BHEP |
|
| A4 | Supplementary search report drawn up and despatched |
Effective date: 20110808 |
|
| DAX | Request for extension of the european patent (deleted) | ||
| 17Q | First examination report despatched |
Effective date: 20121121 |
|
| GRAP | Despatch of communication of intention to grant a patent |
Free format text: ORIGINAL CODE: EPIDOSNIGR1 |
|
| INTG | Intention to grant announced |
Effective date: 20130619 |
|
| GRAS | Grant fee paid |
Free format text: ORIGINAL CODE: EPIDOSNIGR3 |
|
| GRAA | (expected) grant |
Free format text: ORIGINAL CODE: 0009210 |
|
| AK | Designated contracting states |
Kind code of ref document: B1 Designated state(s): AL AT BE BG CH CY CZ DE DK EE ES FI FR GB GR HR HU IE IS IT LI LT LU LV MC MK MT NL NO PL PT RO SE SI SK SM TR |
|
| REG | Reference to a national code |
Ref country code: GB Ref legal event code: FG4D |
|
| REG | Reference to a national code |
Ref country code: CH Ref legal event code: EP |
|
| REG | Reference to a national code |
Ref country code: IE Ref legal event code: FG4D |
|
| REG | Reference to a national code |
Ref country code: AT Ref legal event code: REF Ref document number: 636729 Country of ref document: AT Kind code of ref document: T Effective date: 20131115 |
|
| REG | Reference to a national code |
Ref country code: DE Ref legal event code: R096 Ref document number: 602010011079 Country of ref document: DE Effective date: 20131212 |
|
| REG | Reference to a national code |
Ref country code: NL Ref legal event code: T3 |
|
| REG | Reference to a national code |
Ref country code: AT Ref legal event code: MK05 Ref document number: 636729 Country of ref document: AT Kind code of ref document: T Effective date: 20131016 |
|
| REG | Reference to a national code |
Ref country code: LT Ref legal event code: MG4D |
|
| PG25 | Lapsed in a contracting state [announced via postgrant information from national office to epo] |
Ref country code: IS Free format text: LAPSE BECAUSE OF FAILURE TO SUBMIT A TRANSLATION OF THE DESCRIPTION OR TO PAY THE FEE WITHIN THE PRESCRIBED TIME-LIMIT Effective date: 20140216 Ref country code: FI Free format text: LAPSE BECAUSE OF FAILURE TO SUBMIT A TRANSLATION OF THE DESCRIPTION OR TO PAY THE FEE WITHIN THE PRESCRIBED TIME-LIMIT Effective date: 20131016 Ref country code: BE Free format text: LAPSE BECAUSE OF FAILURE TO SUBMIT A TRANSLATION OF THE DESCRIPTION OR TO PAY THE FEE WITHIN THE PRESCRIBED TIME-LIMIT Effective date: 20131016 Ref country code: LT Free format text: LAPSE BECAUSE OF FAILURE TO SUBMIT A TRANSLATION OF THE DESCRIPTION OR TO PAY THE FEE WITHIN THE PRESCRIBED TIME-LIMIT Effective date: 20131016 Ref country code: NO Free format text: LAPSE BECAUSE OF FAILURE TO SUBMIT A TRANSLATION OF THE DESCRIPTION OR TO PAY THE FEE WITHIN THE PRESCRIBED TIME-LIMIT Effective date: 20140116 Ref country code: HR Free format text: LAPSE BECAUSE OF FAILURE TO SUBMIT A TRANSLATION OF THE DESCRIPTION OR TO PAY THE FEE WITHIN THE PRESCRIBED TIME-LIMIT Effective date: 20131016 Ref country code: SE Free format text: LAPSE BECAUSE OF FAILURE TO SUBMIT A TRANSLATION OF THE DESCRIPTION OR TO PAY THE FEE WITHIN THE PRESCRIBED TIME-LIMIT Effective date: 20131016 |
|
| PG25 | Lapsed in a contracting state [announced via postgrant information from national office to epo] |
Ref country code: CY Free format text: LAPSE BECAUSE OF FAILURE TO SUBMIT A TRANSLATION OF THE DESCRIPTION OR TO PAY THE FEE WITHIN THE PRESCRIBED TIME-LIMIT Effective date: 20131016 Ref country code: LV Free format text: LAPSE BECAUSE OF FAILURE TO SUBMIT A TRANSLATION OF THE DESCRIPTION OR TO PAY THE FEE WITHIN THE PRESCRIBED TIME-LIMIT Effective date: 20131016 Ref country code: AT Free format text: LAPSE BECAUSE OF FAILURE TO SUBMIT A TRANSLATION OF THE DESCRIPTION OR TO PAY THE FEE WITHIN THE PRESCRIBED TIME-LIMIT Effective date: 20131016 |
|
| PG25 | Lapsed in a contracting state [announced via postgrant information from national office to epo] |
Ref country code: PT Free format text: LAPSE BECAUSE OF FAILURE TO SUBMIT A TRANSLATION OF THE DESCRIPTION OR TO PAY THE FEE WITHIN THE PRESCRIBED TIME-LIMIT Effective date: 20140217 |
|
| REG | Reference to a national code |
Ref country code: DE Ref legal event code: R097 Ref document number: 602010011079 Country of ref document: DE |
|
| PG25 | Lapsed in a contracting state [announced via postgrant information from national office to epo] |
Ref country code: EE Free format text: LAPSE BECAUSE OF FAILURE TO SUBMIT A TRANSLATION OF THE DESCRIPTION OR TO PAY THE FEE WITHIN THE PRESCRIBED TIME-LIMIT Effective date: 20131016 |
|
| PLBE | No opposition filed within time limit |
Free format text: ORIGINAL CODE: 0009261 |
|
| STAA | Information on the status of an ep patent application or granted ep patent |
Free format text: STATUS: NO OPPOSITION FILED WITHIN TIME LIMIT |
|
| PG25 | Lapsed in a contracting state [announced via postgrant information from national office to epo] |
Ref country code: CZ Free format text: LAPSE BECAUSE OF FAILURE TO SUBMIT A TRANSLATION OF THE DESCRIPTION OR TO PAY THE FEE WITHIN THE PRESCRIBED TIME-LIMIT Effective date: 20131016 Ref country code: IT Free format text: LAPSE BECAUSE OF FAILURE TO SUBMIT A TRANSLATION OF THE DESCRIPTION OR TO PAY THE FEE WITHIN THE PRESCRIBED TIME-LIMIT Effective date: 20131016 Ref country code: SK Free format text: LAPSE BECAUSE OF FAILURE TO SUBMIT A TRANSLATION OF THE DESCRIPTION OR TO PAY THE FEE WITHIN THE PRESCRIBED TIME-LIMIT Effective date: 20131016 Ref country code: PL Free format text: LAPSE BECAUSE OF FAILURE TO SUBMIT A TRANSLATION OF THE DESCRIPTION OR TO PAY THE FEE WITHIN THE PRESCRIBED TIME-LIMIT Effective date: 20131016 Ref country code: RO Free format text: LAPSE BECAUSE OF FAILURE TO SUBMIT A TRANSLATION OF THE DESCRIPTION OR TO PAY THE FEE WITHIN THE PRESCRIBED TIME-LIMIT Effective date: 20131016 |
|
| 26N | No opposition filed |
Effective date: 20140717 |
|
| PG25 | Lapsed in a contracting state [announced via postgrant information from national office to epo] |
Ref country code: DK Free format text: LAPSE BECAUSE OF FAILURE TO SUBMIT A TRANSLATION OF THE DESCRIPTION OR TO PAY THE FEE WITHIN THE PRESCRIBED TIME-LIMIT Effective date: 20131016 |
|
| REG | Reference to a national code |
Ref country code: DE Ref legal event code: R097 Ref document number: 602010011079 Country of ref document: DE Effective date: 20140717 |
|
| PG25 | Lapsed in a contracting state [announced via postgrant information from national office to epo] |
Ref country code: SI Free format text: LAPSE BECAUSE OF FAILURE TO SUBMIT A TRANSLATION OF THE DESCRIPTION OR TO PAY THE FEE WITHIN THE PRESCRIBED TIME-LIMIT Effective date: 20131016 Ref country code: LU Free format text: LAPSE BECAUSE OF FAILURE TO SUBMIT A TRANSLATION OF THE DESCRIPTION OR TO PAY THE FEE WITHIN THE PRESCRIBED TIME-LIMIT Effective date: 20140701 |
|
| REG | Reference to a national code |
Ref country code: CH Ref legal event code: PL |
|
| GBPC | Gb: european patent ceased through non-payment of renewal fee |
Effective date: 20140701 |
|
| REG | Reference to a national code |
Ref country code: IE Ref legal event code: MM4A |
|
| REG | Reference to a national code |
Ref country code: FR Ref legal event code: ST Effective date: 20150331 |
|
| PG25 | Lapsed in a contracting state [announced via postgrant information from national office to epo] |
Ref country code: LI Free format text: LAPSE BECAUSE OF NON-PAYMENT OF DUE FEES Effective date: 20140731 Ref country code: CH Free format text: LAPSE BECAUSE OF NON-PAYMENT OF DUE FEES Effective date: 20140731 |
|
| PG25 | Lapsed in a contracting state [announced via postgrant information from national office to epo] |
Ref country code: FR Free format text: LAPSE BECAUSE OF NON-PAYMENT OF DUE FEES Effective date: 20140731 Ref country code: GB Free format text: LAPSE BECAUSE OF NON-PAYMENT OF DUE FEES Effective date: 20140701 |
|
| PG25 | Lapsed in a contracting state [announced via postgrant information from national office to epo] |
Ref country code: IE Free format text: LAPSE BECAUSE OF NON-PAYMENT OF DUE FEES Effective date: 20140701 |
|
| PG25 | Lapsed in a contracting state [announced via postgrant information from national office to epo] |
Ref country code: MC Free format text: LAPSE BECAUSE OF FAILURE TO SUBMIT A TRANSLATION OF THE DESCRIPTION OR TO PAY THE FEE WITHIN THE PRESCRIBED TIME-LIMIT Effective date: 20131016 Ref country code: SM Free format text: LAPSE BECAUSE OF FAILURE TO SUBMIT A TRANSLATION OF THE DESCRIPTION OR TO PAY THE FEE WITHIN THE PRESCRIBED TIME-LIMIT Effective date: 20131016 |
|
| PG25 | Lapsed in a contracting state [announced via postgrant information from national office to epo] |
Ref country code: MT Free format text: LAPSE BECAUSE OF FAILURE TO SUBMIT A TRANSLATION OF THE DESCRIPTION OR TO PAY THE FEE WITHIN THE PRESCRIBED TIME-LIMIT Effective date: 20131016 Ref country code: GR Free format text: LAPSE BECAUSE OF FAILURE TO SUBMIT A TRANSLATION OF THE DESCRIPTION OR TO PAY THE FEE WITHIN THE PRESCRIBED TIME-LIMIT Effective date: 20140117 Ref country code: BG Free format text: LAPSE BECAUSE OF FAILURE TO SUBMIT A TRANSLATION OF THE DESCRIPTION OR TO PAY THE FEE WITHIN THE PRESCRIBED TIME-LIMIT Effective date: 20131016 |
|
| PG25 | Lapsed in a contracting state [announced via postgrant information from national office to epo] |
Ref country code: HU Free format text: LAPSE BECAUSE OF FAILURE TO SUBMIT A TRANSLATION OF THE DESCRIPTION OR TO PAY THE FEE WITHIN THE PRESCRIBED TIME-LIMIT; INVALID AB INITIO Effective date: 20100701 Ref country code: TR Free format text: LAPSE BECAUSE OF FAILURE TO SUBMIT A TRANSLATION OF THE DESCRIPTION OR TO PAY THE FEE WITHIN THE PRESCRIBED TIME-LIMIT Effective date: 20131016 |
|
| PG25 | Lapsed in a contracting state [announced via postgrant information from national office to epo] |
Ref country code: ES Free format text: LAPSE BECAUSE OF FAILURE TO SUBMIT A TRANSLATION OF THE DESCRIPTION OR TO PAY THE FEE WITHIN THE PRESCRIBED TIME-LIMIT Effective date: 20131016 |
|
| PG25 | Lapsed in a contracting state [announced via postgrant information from national office to epo] |
Ref country code: MK Free format text: LAPSE BECAUSE OF FAILURE TO SUBMIT A TRANSLATION OF THE DESCRIPTION OR TO PAY THE FEE WITHIN THE PRESCRIBED TIME-LIMIT Effective date: 20131016 |
|
| PG25 | Lapsed in a contracting state [announced via postgrant information from national office to epo] |
Ref country code: AL Free format text: LAPSE BECAUSE OF FAILURE TO SUBMIT A TRANSLATION OF THE DESCRIPTION OR TO PAY THE FEE WITHIN THE PRESCRIBED TIME-LIMIT Effective date: 20131016 |
|
| PGFP | Annual fee paid to national office [announced via postgrant information from national office to epo] |
Ref country code: NL Payment date: 20230614 Year of fee payment: 14 |
|
| REG | Reference to a national code |
Ref country code: NL Ref legal event code: MM Effective date: 20240801 |
|
| PG25 | Lapsed in a contracting state [announced via postgrant information from national office to epo] |
Ref country code: NL Free format text: LAPSE BECAUSE OF NON-PAYMENT OF DUE FEES Effective date: 20240801 |
|
| PGFP | Annual fee paid to national office [announced via postgrant information from national office to epo] |
Ref country code: DE Payment date: 20250528 Year of fee payment: 16 |