EP2220249B1 - Nachweis von mikroorganismen in blut unter nutzung physikalischer und chemischer veränderungen im blut - Google Patents
Nachweis von mikroorganismen in blut unter nutzung physikalischer und chemischer veränderungen im blut Download PDFInfo
- Publication number
- EP2220249B1 EP2220249B1 EP08847250A EP08847250A EP2220249B1 EP 2220249 B1 EP2220249 B1 EP 2220249B1 EP 08847250 A EP08847250 A EP 08847250A EP 08847250 A EP08847250 A EP 08847250A EP 2220249 B1 EP2220249 B1 EP 2220249B1
- Authority
- EP
- European Patent Office
- Prior art keywords
- blood
- hemoglobin
- microorganisms
- spectra
- reflectance
- Prior art date
- Legal status (The legal status is an assumption and is not a legal conclusion. Google has not performed a legal analysis and makes no representation as to the accuracy of the status listed.)
- Not-in-force
Links
- 210000004369 blood Anatomy 0.000 title claims abstract description 170
- 239000008280 blood Substances 0.000 title claims abstract description 170
- 244000005700 microbiome Species 0.000 title claims abstract description 112
- 239000000126 substance Substances 0.000 title claims abstract description 47
- 108010054147 Hemoglobins Proteins 0.000 claims abstract description 146
- 102000001554 Hemoglobins Human genes 0.000 claims abstract description 146
- 238000001228 spectrum Methods 0.000 claims abstract description 107
- 210000003743 erythrocyte Anatomy 0.000 claims description 96
- 239000000203 mixture Substances 0.000 claims description 77
- 238000000034 method Methods 0.000 claims description 57
- 210000004027 cell Anatomy 0.000 claims description 54
- 238000005259 measurement Methods 0.000 claims description 51
- 230000012010 growth Effects 0.000 claims description 45
- 230000006870 function Effects 0.000 claims description 44
- 239000002245 particle Substances 0.000 claims description 39
- 108010002255 deoxyhemoglobin Proteins 0.000 claims description 36
- INGWEZCOABYORO-UHFFFAOYSA-N 2-(furan-2-yl)-7-methyl-1h-1,8-naphthyridin-4-one Chemical compound N=1C2=NC(C)=CC=C2C(O)=CC=1C1=CC=CO1 INGWEZCOABYORO-UHFFFAOYSA-N 0.000 claims description 27
- 238000010521 absorption reaction Methods 0.000 claims description 27
- 238000002834 transmittance Methods 0.000 claims description 27
- 230000029058 respiratory gaseous exchange Effects 0.000 claims description 23
- 230000003287 optical effect Effects 0.000 claims description 17
- 230000005670 electromagnetic radiation Effects 0.000 claims description 14
- 230000001419 dependent effect Effects 0.000 claims description 7
- 239000011159 matrix material Substances 0.000 claims description 5
- 230000008033 biological extinction Effects 0.000 claims description 4
- 238000005534 hematocrit Methods 0.000 claims description 4
- 239000006285 cell suspension Substances 0.000 claims description 3
- 230000004907 flux Effects 0.000 claims description 3
- 238000012512 characterization method Methods 0.000 claims description 2
- 108010036302 hemoglobin AS Proteins 0.000 claims description 2
- 230000003595 spectral effect Effects 0.000 abstract description 44
- 238000001514 detection method Methods 0.000 abstract description 36
- 238000013459 approach Methods 0.000 abstract description 7
- 238000002798 spectrophotometry method Methods 0.000 abstract description 5
- 238000001392 ultraviolet--visible--near infrared spectroscopy Methods 0.000 abstract 1
- 239000000523 sample Substances 0.000 description 120
- 238000009640 blood culture Methods 0.000 description 94
- CURLTUGMZLYLDI-UHFFFAOYSA-N Carbon dioxide Chemical compound O=C=O CURLTUGMZLYLDI-UHFFFAOYSA-N 0.000 description 56
- 238000000985 reflectance spectrum Methods 0.000 description 51
- 229910002092 carbon dioxide Inorganic materials 0.000 description 46
- 230000036961 partial effect Effects 0.000 description 39
- 108010064719 Oxyhemoglobins Proteins 0.000 description 32
- 230000002503 metabolic effect Effects 0.000 description 32
- 230000000813 microbial effect Effects 0.000 description 29
- 108010061951 Methemoglobin Proteins 0.000 description 26
- 230000000694 effects Effects 0.000 description 24
- 239000007789 gas Substances 0.000 description 24
- 238000002474 experimental method Methods 0.000 description 22
- 210000000265 leukocyte Anatomy 0.000 description 20
- 241000894006 Bacteria Species 0.000 description 19
- QVGXLLKOCUKJST-UHFFFAOYSA-N atomic oxygen Chemical compound [O] QVGXLLKOCUKJST-UHFFFAOYSA-N 0.000 description 17
- 239000001301 oxygen Substances 0.000 description 17
- 229910052760 oxygen Inorganic materials 0.000 description 17
- 238000006243 chemical reaction Methods 0.000 description 16
- 238000004519 manufacturing process Methods 0.000 description 16
- -1 oxy- Chemical class 0.000 description 16
- 239000000047 product Substances 0.000 description 16
- 230000001580 bacterial effect Effects 0.000 description 15
- 239000000306 component Substances 0.000 description 14
- 230000008859 change Effects 0.000 description 13
- 230000005540 biological transmission Effects 0.000 description 12
- 239000001569 carbon dioxide Substances 0.000 description 12
- 230000007423 decrease Effects 0.000 description 12
- 239000007791 liquid phase Substances 0.000 description 12
- 230000008569 process Effects 0.000 description 12
- 210000001772 blood platelet Anatomy 0.000 description 10
- 239000001963 growth medium Substances 0.000 description 10
- 241000194031 Enterococcus faecium Species 0.000 description 9
- 206010018910 Haemolysis Diseases 0.000 description 8
- MHAJPDPJQMAIIY-UHFFFAOYSA-N Hydrogen peroxide Chemical compound OO MHAJPDPJQMAIIY-UHFFFAOYSA-N 0.000 description 8
- 230000008588 hemolysis Effects 0.000 description 8
- 239000007788 liquid Substances 0.000 description 8
- 238000004088 simulation Methods 0.000 description 8
- 241000222122 Candida albicans Species 0.000 description 7
- 108010003320 Carboxyhemoglobin Proteins 0.000 description 7
- 239000012503 blood component Substances 0.000 description 7
- 230000009089 cytolysis Effects 0.000 description 7
- 239000000975 dye Substances 0.000 description 7
- 238000011067 equilibration Methods 0.000 description 7
- 239000000835 fiber Substances 0.000 description 7
- 244000052769 pathogen Species 0.000 description 7
- 239000012071 phase Substances 0.000 description 7
- 230000035945 sensitivity Effects 0.000 description 7
- 241000588724 Escherichia coli Species 0.000 description 6
- 230000008901 benefit Effects 0.000 description 6
- 230000002949 hemolytic effect Effects 0.000 description 6
- 238000012544 monitoring process Methods 0.000 description 6
- 230000000704 physical effect Effects 0.000 description 6
- 239000012808 vapor phase Substances 0.000 description 6
- 240000004808 Saccharomyces cerevisiae Species 0.000 description 5
- 241000191963 Staphylococcus epidermidis Species 0.000 description 5
- 238000010586 diagram Methods 0.000 description 5
- 238000009792 diffusion process Methods 0.000 description 5
- 230000008961 swelling Effects 0.000 description 5
- 230000007704 transition Effects 0.000 description 5
- 244000197813 Camelina sativa Species 0.000 description 4
- 102000016938 Catalase Human genes 0.000 description 4
- 108010053835 Catalase Proteins 0.000 description 4
- 102000004190 Enzymes Human genes 0.000 description 4
- 108090000790 Enzymes Proteins 0.000 description 4
- 230000003698 anagen phase Effects 0.000 description 4
- 230000015572 biosynthetic process Effects 0.000 description 4
- 239000006227 byproduct Substances 0.000 description 4
- 238000012258 culturing Methods 0.000 description 4
- 238000009826 distribution Methods 0.000 description 4
- 238000005516 engineering process Methods 0.000 description 4
- 238000011534 incubation Methods 0.000 description 4
- 238000011081 inoculation Methods 0.000 description 4
- 238000000691 measurement method Methods 0.000 description 4
- 239000002207 metabolite Substances 0.000 description 4
- 230000005855 radiation Effects 0.000 description 4
- 230000002829 reductive effect Effects 0.000 description 4
- 238000004611 spectroscopical analysis Methods 0.000 description 4
- 241000193468 Clostridium perfringens Species 0.000 description 3
- 108010016811 Sulfhemoglobin Proteins 0.000 description 3
- 238000004364 calculation method Methods 0.000 description 3
- 238000011109 contamination Methods 0.000 description 3
- 230000004060 metabolic process Effects 0.000 description 3
- MWUXSHHQAYIFBG-UHFFFAOYSA-N nitrogen oxide Inorganic materials O=[N] MWUXSHHQAYIFBG-UHFFFAOYSA-N 0.000 description 3
- 235000015097 nutrients Nutrition 0.000 description 3
- 230000036284 oxygen consumption Effects 0.000 description 3
- 230000001717 pathogenic effect Effects 0.000 description 3
- 239000003642 reactive oxygen metabolite Substances 0.000 description 3
- 230000009467 reduction Effects 0.000 description 3
- 230000002123 temporal effect Effects 0.000 description 3
- 230000009466 transformation Effects 0.000 description 3
- 238000000411 transmission spectrum Methods 0.000 description 3
- 210000005253 yeast cell Anatomy 0.000 description 3
- 239000002028 Biomass Substances 0.000 description 2
- 241000193985 Streptococcus agalactiae Species 0.000 description 2
- 230000004075 alteration Effects 0.000 description 2
- 238000004458 analytical method Methods 0.000 description 2
- 238000004820 blood count Methods 0.000 description 2
- 229940095731 candida albicans Drugs 0.000 description 2
- 239000003990 capacitor Substances 0.000 description 2
- 230000010261 cell growth Effects 0.000 description 2
- 230000006037 cell lysis Effects 0.000 description 2
- 239000000356 contaminant Substances 0.000 description 2
- 239000013068 control sample Substances 0.000 description 2
- 238000010494 dissociation reaction Methods 0.000 description 2
- 230000005593 dissociations Effects 0.000 description 2
- 150000003278 haem Chemical group 0.000 description 2
- 238000000338 in vitro Methods 0.000 description 2
- 230000002101 lytic effect Effects 0.000 description 2
- 239000000463 material Substances 0.000 description 2
- 230000007246 mechanism Effects 0.000 description 2
- 239000002609 medium Substances 0.000 description 2
- 238000012986 modification Methods 0.000 description 2
- 230000004048 modification Effects 0.000 description 2
- 238000002496 oximetry Methods 0.000 description 2
- 244000045947 parasite Species 0.000 description 2
- 238000001055 reflectance spectroscopy Methods 0.000 description 2
- 230000000241 respiratory effect Effects 0.000 description 2
- 230000000717 retained effect Effects 0.000 description 2
- 239000007787 solid Substances 0.000 description 2
- 241000894007 species Species 0.000 description 2
- 239000000758 substrate Substances 0.000 description 2
- 239000000725 suspension Substances 0.000 description 2
- 238000012546 transfer Methods 0.000 description 2
- MYPYJXKWCTUITO-UHFFFAOYSA-N vancomycin Natural products O1C(C(=C2)Cl)=CC=C2C(O)C(C(NC(C2=CC(O)=CC(O)=C2C=2C(O)=CC=C3C=2)C(O)=O)=O)NC(=O)C3NC(=O)C2NC(=O)C(CC(N)=O)NC(=O)C(NC(=O)C(CC(C)C)NC)C(O)C(C=C3Cl)=CC=C3OC3=CC2=CC1=C3OC1OC(CO)C(O)C(O)C1OC1CC(C)(N)C(O)C(C)O1 MYPYJXKWCTUITO-UHFFFAOYSA-N 0.000 description 2
- XLYOFNOQVPJJNP-UHFFFAOYSA-N water Substances O XLYOFNOQVPJJNP-UHFFFAOYSA-N 0.000 description 2
- 229910001868 water Inorganic materials 0.000 description 2
- ZIIUUSVHCHPIQD-UHFFFAOYSA-N 2,4,6-trimethyl-N-[3-(trifluoromethyl)phenyl]benzenesulfonamide Chemical compound CC1=CC(C)=CC(C)=C1S(=O)(=O)NC1=CC=CC(C(F)(F)F)=C1 ZIIUUSVHCHPIQD-UHFFFAOYSA-N 0.000 description 1
- OTLLEIBWKHEHGU-UHFFFAOYSA-N 2-[5-[[5-(6-aminopurin-9-yl)-3,4-dihydroxyoxolan-2-yl]methoxy]-3,4-dihydroxy-6-(hydroxymethyl)oxan-2-yl]oxy-3,5-dihydroxy-4-phosphonooxyhexanedioic acid Chemical compound C1=NC=2C(N)=NC=NC=2N1C(C(C1O)O)OC1COC1C(CO)OC(OC(C(O)C(OP(O)(O)=O)C(O)C(O)=O)C(O)=O)C(O)C1O OTLLEIBWKHEHGU-UHFFFAOYSA-N 0.000 description 1
- MYMOFIZGZYHOMD-UHFFFAOYSA-N Dioxygen Chemical compound O=O MYMOFIZGZYHOMD-UHFFFAOYSA-N 0.000 description 1
- 241000192125 Firmicutes Species 0.000 description 1
- 230000005526 G1 to G0 transition Effects 0.000 description 1
- 108010006464 Hemolysin Proteins Proteins 0.000 description 1
- 241000209035 Ilex Species 0.000 description 1
- 241000079899 Pedipes mirabilis Species 0.000 description 1
- 102000015439 Phospholipases Human genes 0.000 description 1
- 108010064785 Phospholipases Proteins 0.000 description 1
- 241000295644 Staphylococcaceae Species 0.000 description 1
- 241000191967 Staphylococcus aureus Species 0.000 description 1
- 241001251125 Staphylococcus aureus subsp. anaerobius Species 0.000 description 1
- 241001464905 Staphylococcus saccharolyticus Species 0.000 description 1
- 235000019892 Stellar Nutrition 0.000 description 1
- 241000194017 Streptococcus Species 0.000 description 1
- 208000005485 Thrombocytosis Diseases 0.000 description 1
- 108010059993 Vancomycin Proteins 0.000 description 1
- 241000222126 [Candida] glabrata Species 0.000 description 1
- 238000009825 accumulation Methods 0.000 description 1
- 230000000996 additive effect Effects 0.000 description 1
- 241001148470 aerobic bacillus Species 0.000 description 1
- 238000013019 agitation Methods 0.000 description 1
- 150000001298 alcohols Chemical class 0.000 description 1
- 150000001299 aldehydes Chemical class 0.000 description 1
- 230000003321 amplification Effects 0.000 description 1
- 238000000149 argon plasma sintering Methods 0.000 description 1
- 230000004888 barrier function Effects 0.000 description 1
- 230000004071 biological effect Effects 0.000 description 1
- 238000009530 blood pressure measurement Methods 0.000 description 1
- 230000003139 buffering effect Effects 0.000 description 1
- 208000032343 candida glabrata infection Diseases 0.000 description 1
- 210000002421 cell wall Anatomy 0.000 description 1
- 230000001413 cellular effect Effects 0.000 description 1
- 238000003889 chemical engineering Methods 0.000 description 1
- 239000003153 chemical reaction reagent Substances 0.000 description 1
- 238000004891 communication Methods 0.000 description 1
- 150000001875 compounds Chemical class 0.000 description 1
- 239000000470 constituent Substances 0.000 description 1
- 230000008602 contraction Effects 0.000 description 1
- 108010071981 cyanhemoglobin Proteins 0.000 description 1
- 230000006378 damage Effects 0.000 description 1
- 230000003247 decreasing effect Effects 0.000 description 1
- 230000002950 deficient Effects 0.000 description 1
- 230000003111 delayed effect Effects 0.000 description 1
- 238000006392 deoxygenation reaction Methods 0.000 description 1
- 238000011161 development Methods 0.000 description 1
- 230000018109 developmental process Effects 0.000 description 1
- 229910001882 dioxygen Inorganic materials 0.000 description 1
- 230000027721 electron transport chain Effects 0.000 description 1
- 230000007613 environmental effect Effects 0.000 description 1
- 210000003617 erythrocyte membrane Anatomy 0.000 description 1
- 239000002095 exotoxin Substances 0.000 description 1
- 231100000776 exotoxin Toxicity 0.000 description 1
- 108010045631 ferrylhemoglobin Proteins 0.000 description 1
- 239000012530 fluid Substances 0.000 description 1
- 238000009472 formulation Methods 0.000 description 1
- 239000007792 gaseous phase Substances 0.000 description 1
- 239000011521 glass Substances 0.000 description 1
- 239000003228 hemolysin Substances 0.000 description 1
- 238000005286 illumination Methods 0.000 description 1
- 238000001727 in vivo Methods 0.000 description 1
- 239000011261 inert gas Substances 0.000 description 1
- 230000000977 initiatory effect Effects 0.000 description 1
- 239000002054 inoculum Substances 0.000 description 1
- 208000032839 leukemia Diseases 0.000 description 1
- 238000009630 liquid culture Methods 0.000 description 1
- 230000002934 lysing effect Effects 0.000 description 1
- 238000013178 mathematical model Methods 0.000 description 1
- 239000012528 membrane Substances 0.000 description 1
- 230000007102 metabolic function Effects 0.000 description 1
- 230000037353 metabolic pathway Effects 0.000 description 1
- 230000037323 metabolic rate Effects 0.000 description 1
- 239000012569 microbial contaminant Substances 0.000 description 1
- 230000007269 microbial metabolism Effects 0.000 description 1
- 230000002906 microbiologic effect Effects 0.000 description 1
- 238000009629 microbiological culture Methods 0.000 description 1
- 230000000877 morphologic effect Effects 0.000 description 1
- 238000010606 normalization Methods 0.000 description 1
- 238000003199 nucleic acid amplification method Methods 0.000 description 1
- 239000002773 nucleotide Substances 0.000 description 1
- 125000003729 nucleotide group Chemical group 0.000 description 1
- 239000013307 optical fiber Substances 0.000 description 1
- 238000013488 ordinary least square regression Methods 0.000 description 1
- 150000002894 organic compounds Chemical class 0.000 description 1
- 230000005789 organism growth Effects 0.000 description 1
- 230000008520 organization Effects 0.000 description 1
- 230000033116 oxidation-reduction process Effects 0.000 description 1
- 238000006213 oxygenation reaction Methods 0.000 description 1
- 150000002978 peroxides Chemical class 0.000 description 1
- 230000001766 physiological effect Effects 0.000 description 1
- 230000010287 polarization Effects 0.000 description 1
- 238000012809 post-inoculation Methods 0.000 description 1
- 238000002360 preparation method Methods 0.000 description 1
- 239000011164 primary particle Substances 0.000 description 1
- 238000002106 pulse oximetry Methods 0.000 description 1
- 238000011002 quantification Methods 0.000 description 1
- 238000004445 quantitative analysis Methods 0.000 description 1
- 238000011158 quantitative evaluation Methods 0.000 description 1
- 230000035484 reaction time Effects 0.000 description 1
- 230000009257 reactivity Effects 0.000 description 1
- 230000019254 respiratory burst Effects 0.000 description 1
- 238000005070 sampling Methods 0.000 description 1
- 239000007790 solid phase Substances 0.000 description 1
- 238000012306 spectroscopic technique Methods 0.000 description 1
- 238000010183 spectrum analysis Methods 0.000 description 1
- 229940035637 spectrum-4 Drugs 0.000 description 1
- 238000010561 standard procedure Methods 0.000 description 1
- 238000007619 statistical method Methods 0.000 description 1
- 238000013179 statistical model Methods 0.000 description 1
- 238000012360 testing method Methods 0.000 description 1
- 230000008719 thickening Effects 0.000 description 1
- 150000003568 thioethers Chemical class 0.000 description 1
- 238000002371 ultraviolet--visible spectrum Methods 0.000 description 1
- 238000010200 validation analysis Methods 0.000 description 1
- MYPYJXKWCTUITO-LYRMYLQWSA-N vancomycin Chemical compound O([C@@H]1[C@@H](O)[C@H](O)[C@@H](CO)O[C@H]1OC1=C2C=C3C=C1OC1=CC=C(C=C1Cl)[C@@H](O)[C@H](C(N[C@@H](CC(N)=O)C(=O)N[C@H]3C(=O)N[C@H]1C(=O)N[C@H](C(N[C@@H](C3=CC(O)=CC(O)=C3C=3C(O)=CC=C1C=3)C(O)=O)=O)[C@H](O)C1=CC=C(C(=C1)Cl)O2)=O)NC(=O)[C@@H](CC(C)C)NC)[C@H]1C[C@](C)(N)[C@H](O)[C@H](C)O1 MYPYJXKWCTUITO-LYRMYLQWSA-N 0.000 description 1
- 229960003165 vancomycin Drugs 0.000 description 1
Images


Classifications
-
- C—CHEMISTRY; METALLURGY
- C12—BIOCHEMISTRY; BEER; SPIRITS; WINE; VINEGAR; MICROBIOLOGY; ENZYMOLOGY; MUTATION OR GENETIC ENGINEERING
- C12Q—MEASURING OR TESTING PROCESSES INVOLVING ENZYMES, NUCLEIC ACIDS OR MICROORGANISMS; COMPOSITIONS OR TEST PAPERS THEREFOR; PROCESSES OF PREPARING SUCH COMPOSITIONS; CONDITION-RESPONSIVE CONTROL IN MICROBIOLOGICAL OR ENZYMOLOGICAL PROCESSES
- C12Q1/00—Measuring or testing processes involving enzymes, nucleic acids or microorganisms; Compositions therefor; Processes of preparing such compositions
- C12Q1/02—Measuring or testing processes involving enzymes, nucleic acids or microorganisms; Compositions therefor; Processes of preparing such compositions involving viable microorganisms
- C12Q1/04—Determining presence or kind of microorganism; Use of selective media for testing antibiotics or bacteriocides; Compositions containing a chemical indicator therefor
-
- G—PHYSICS
- G01—MEASURING; TESTING
- G01N—INVESTIGATING OR ANALYSING MATERIALS BY DETERMINING THEIR CHEMICAL OR PHYSICAL PROPERTIES
- G01N21/00—Investigating or analysing materials by the use of optical means, i.e. using sub-millimetre waves, infrared, visible or ultraviolet light
- G01N21/17—Systems in which incident light is modified in accordance with the properties of the material investigated
- G01N21/25—Colour; Spectral properties, i.e. comparison of effect of material on the light at two or more different wavelengths or wavelength bands
- G01N21/31—Investigating relative effect of material at wavelengths characteristic of specific elements or molecules, e.g. atomic absorption spectrometry
-
- G—PHYSICS
- G01—MEASURING; TESTING
- G01N—INVESTIGATING OR ANALYSING MATERIALS BY DETERMINING THEIR CHEMICAL OR PHYSICAL PROPERTIES
- G01N21/00—Investigating or analysing materials by the use of optical means, i.e. using sub-millimetre waves, infrared, visible or ultraviolet light
- G01N21/17—Systems in which incident light is modified in accordance with the properties of the material investigated
- G01N21/47—Scattering, i.e. diffuse reflection
- G01N21/4738—Diffuse reflection, e.g. also for testing fluids, fibrous materials
- G01N21/474—Details of optical heads therefor, e.g. using optical fibres
-
- G—PHYSICS
- G01—MEASURING; TESTING
- G01N—INVESTIGATING OR ANALYSING MATERIALS BY DETERMINING THEIR CHEMICAL OR PHYSICAL PROPERTIES
- G01N21/00—Investigating or analysing materials by the use of optical means, i.e. using sub-millimetre waves, infrared, visible or ultraviolet light
- G01N21/17—Systems in which incident light is modified in accordance with the properties of the material investigated
- G01N21/25—Colour; Spectral properties, i.e. comparison of effect of material on the light at two or more different wavelengths or wavelength bands
- G01N21/31—Investigating relative effect of material at wavelengths characteristic of specific elements or molecules, e.g. atomic absorption spectrometry
- G01N21/314—Investigating relative effect of material at wavelengths characteristic of specific elements or molecules, e.g. atomic absorption spectrometry with comparison of measurements at specific and non-specific wavelengths
- G01N2021/3144—Investigating relative effect of material at wavelengths characteristic of specific elements or molecules, e.g. atomic absorption spectrometry with comparison of measurements at specific and non-specific wavelengths for oxymetry
-
- G—PHYSICS
- G01—MEASURING; TESTING
- G01N—INVESTIGATING OR ANALYSING MATERIALS BY DETERMINING THEIR CHEMICAL OR PHYSICAL PROPERTIES
- G01N21/00—Investigating or analysing materials by the use of optical means, i.e. using sub-millimetre waves, infrared, visible or ultraviolet light
- G01N21/17—Systems in which incident light is modified in accordance with the properties of the material investigated
- G01N21/25—Colour; Spectral properties, i.e. comparison of effect of material on the light at two or more different wavelengths or wavelength bands
- G01N21/31—Investigating relative effect of material at wavelengths characteristic of specific elements or molecules, e.g. atomic absorption spectrometry
- G01N21/314—Investigating relative effect of material at wavelengths characteristic of specific elements or molecules, e.g. atomic absorption spectrometry with comparison of measurements at specific and non-specific wavelengths
- G01N2021/3155—Measuring in two spectral ranges, e.g. UV and visible
-
- G—PHYSICS
- G01—MEASURING; TESTING
- G01N—INVESTIGATING OR ANALYSING MATERIALS BY DETERMINING THEIR CHEMICAL OR PHYSICAL PROPERTIES
- G01N21/00—Investigating or analysing materials by the use of optical means, i.e. using sub-millimetre waves, infrared, visible or ultraviolet light
- G01N21/17—Systems in which incident light is modified in accordance with the properties of the material investigated
- G01N21/47—Scattering, i.e. diffuse reflection
- G01N21/4738—Diffuse reflection, e.g. also for testing fluids, fibrous materials
- G01N21/474—Details of optical heads therefor, e.g. using optical fibres
- G01N2021/4742—Details of optical heads therefor, e.g. using optical fibres comprising optical fibres
- G01N2021/4747—Concentric bundles
-
- G—PHYSICS
- G01—MEASURING; TESTING
- G01N—INVESTIGATING OR ANALYSING MATERIALS BY DETERMINING THEIR CHEMICAL OR PHYSICAL PROPERTIES
- G01N21/00—Investigating or analysing materials by the use of optical means, i.e. using sub-millimetre waves, infrared, visible or ultraviolet light
- G01N21/84—Systems specially adapted for particular applications
- G01N21/85—Investigating moving fluids or granular solids
- G01N21/8507—Probe photometers, i.e. with optical measuring part dipped into fluid sample
Definitions
- the literature describes a variety of methods for determining the presence of microorganisms in blood.
- the presence of microorganisms typically is detected by means of an internal indicator for the production of a microbial metabolic product, such as CO 2 .
- Illustrative in this regard are optical monitoring of changes in a CO 2 -sensitive disk in the bottom of blood culture bottles ( U.S. patent No. 5,770,394 ) and pressure-sensitive techniques that measure increased production of CO 2 in the head space of a culture bottle.
- Other methodology has related changes in back-scattered light peak intensity at a few wavelengths to the presence of microorganisms. For example, see U.S. patent No. 5,427,920 .
- the constituency of a given spectrophotometric-indicator dye system determines its sensitivity to the presence of metabolic products, particularly in terms of the minimum detectable CO 2 concentration.
- the time to detection (TTD) depends on the sensitivity of the measurement technique, the time required to reach the minimum detectable CO 2 concentration, and on the transport and reaction time constants.
- the rate of growth and, therefore, the rate of production of metabolic CO 2 depends on the initial concentration of organisms (CFU/mL of blood) and on the incubation conditions (growth media, temperature, etc.), as well as the strain of organism itself.
- Existing detection systems require between 10 8 -10 9 microorganisms/mL for positive detection with an incubation or amplification time corresponding to the specific growth rate of each organism.
- these changes are measured by spectrophotometric procedures across the ultraviolet, the visible range, and/or the near-infrared (UV-Vis-NIR) portions of the electromagnetic spectrum.
- the spectral features are related to the physical and chemical properties of blood via correlational and/or spectral deconvolution techniques.
- the correlational approach relates features within portions of the measured spectra to specific changes in the properties of blood.
- the complete spectra or portions thereof also can be interpreted via spectral deconvolution techniques, which require an appropriate mathematical description of the data. This mathematical description of the data can be but is not necessarily limited to theoretical, empirical, and statistical descriptions.
- the present invention overcomes the disadvantages of current measurement techniques by allowing detection to occur in the absence of additional indicators or dyes. Changes in the physical and chemical properties of blood can be exploited to detect the presence of microbial activity directly (e.g., by particle counts) or indirectly by monitoring changes in the chemical composition of blood (e.g., by hemoglobin composition).
- the various embodiment of the present invention take advantage of the fact that hemoglobin is present in large concentrations, is well-dispersed through culture media either in free form or in red blood cells, and its spectrum changes as a function of ambient conditions. The distinct spectral differences between the different forms of hemoglobin allow for greater detection sensitivity by enabling small changes in hemoglobin chemical composition to be quantified. Moreover, simultaneous measurements of spectral signatures over multiple wavelengths result in improved statistical analyses.
- an apparatus configuration preferably includes: (i) at least one light source that can deliver illumination within the UV-Vis-NIR portion of the spectrum and (ii) devices such as fiber optics to deliver and collect light from the sample from a suitable number of wavelengths.
- spectroscopy configurations suitable for this purpose are diffuse reflectance and diffuse transmittance. These configurations take advantage of the absorption and multiple-scattering properties of blood, and, in contrast to an extant approach, do not require the placement of a fiber optic probe directly against the wall of the blood culture vessel.
- a method of the invention quantifies at least one form of hemoglobin.
- the deconvolution step (i) can comprises at least one of a linear model and a non-linear model and (ii) can resolve the spectra into the hemoglobin form.
- the assessing comprises detecting the presence or absence of microorganisms.
- the method further comprises extracting identifying characteristics of the microorganisms from the spectra.
- the identifying characteristics are selected from the group comprising kinetic growth parameters and physical characteristics.
- the growth parameters can include doubling times and respiration rates, and/or the physical characteristics may include size and shape.
- the presence or absence of microorganisms is assessed in accordance with changes in properties of blood induced by one or more microbial metabolites.
- the present disclosure also provides apparatus configured to assessing the presence of microorganisms, comprising (a) a spectrometer configured to measure spectra of a plurality of wavelengths emitting from a sample of blood, (b) a transmission cell and/or a reflectance probe that is operably connected to the spectrometer, and (c) a computer that (i) is operably connected to the spectrometer and (ii) is configured to perform deconvolution on the spectra, thereby to assess the presence or absence of microorganisms in the sample.
- the spectrometer includes a diode array.
- a reflectance probe is operably connected to the spectrometer and is configured such that it does not touch the container in which the sample is located.
- the present disclosure provides, in accordance with another of its aspects, a method of assessing the presence of at least one microorganism in blood, comprising (a) emitting electromagnetic radiation into at least one blood sample in a closed container, (b) measuring wavelength-dependent spectra of re-emitted electromagnetic radiation from the blood sample, wherein the measuring is of one or both of transmittance signals and reflectance signals, then (c) deconvoluting the spectra, (d) determining partial pressure values associated with at least one of oxygen and carbon dioxide in the headspace above the blood sample and (e) assessing the presence or absence of microorganisms in accordance with the partial pressure values.
- Figure 1 illustrates an exemplary absorption coefficients of the four common forms of hemoglobin: oxy-, deoxy-, carboxy-, and met-hemoglobin;
- Figure 2 depicts a reflectance measurement apparatus that may be used for conducting spectral measurements in accordance with the various embodiments of the present invention
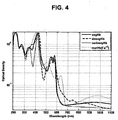
- Figure 3 shows a transmittance spectra associated different forms of hemglobin
- Figure 4 provides a logarithmic representation of the transmittance spectra shown in Figure 3 ;
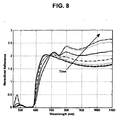
- Figure 5 illustrates a reflectance spectra associated with different forms of hemoglobin
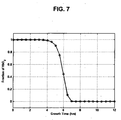
- Figure 7 illustrates oxy-hemoglobin conversion as a function of elapsed time due to the production of CO 2 by bacteria
- Figure 9 illustrates simulated reflectance spectra for the complete time course of the blood sample, with microbial growth, shown in Figures 6 and 7 ;
- Figure 11 illustrates a comparison between measured and calculated reflectance spectra of a blood sample in a blood culture bottle at a first time point
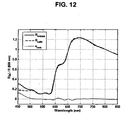
- Figure 12 depicts a comparison between measured and calculated reflectance spectra of a blood sample in a blood culture bottle at a second time point
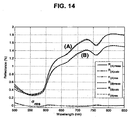
- Figure 14 illustrates the differences between the reflectance spectra associated with two different blood samples due to mean corpuscular volume of the scattering elements
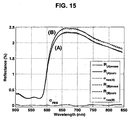
- Figure 15 illustrates the differences between the reflectance spectra associated with two different blood samples with different number density of particles
- Figure 16 presents the measured and calculated reflectance spectra of a blood sample contaminated with yeast, C . albicans
- Figure 17 illustrates the conversion of different forms of hemoglobin associated with a blood sample contaminated with C . albicans
- Figure 19 illustrates changes in hemoglobin composition as a function time for a blood sample that is contaminated with bacteria, E. Coli;
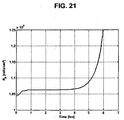
- Figure 21 illustrates changes in cell density over time, associated with the blood a a blood sample contaminated with C . perfingens
- Figure 22(A) shows the evolution of a single wavelength reflectance spectrum over time, associated with a blood sample contaminated with two microorganisms
- Figure 22(B) illustrates the evolution of the reflectance spectra over time associated with a blood sample contaminated with two microorganisms
- Figure 23 illustrates the differences between the measured and calculated reflectance spectra associated with a blood sample contaminated with multiple microorganisms
- Figure 24 is a table of exemplary parameters associated with various experiments conducted in accordance with various embodiments of the present invention.
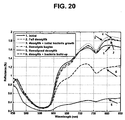
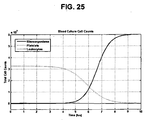
- Figure 2 5 depicts an evolution of total cell count over time associated with a blood sample
- Figure 2 6 illustrates an evolution of oxygen consumption over time associated with a blood sample
- Figure 27 illustrates an evolution of gas pressure profiles over time associated with a blood sample
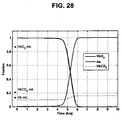
- Figure 28 shows a simulated evolution of hemoglobin composition profile over time associated with a blood sample
- Figure 29 illustrates the evolution of simulated hemoglobin ratios over time associated with two different blood samples
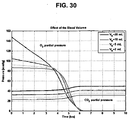
- Figure 30 represents the effects of blood volume on partial gas pressures associated with a blood sample
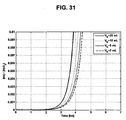
- Figure 31 illustrates the effects of blood volume on the ratio of hemoglobin forms associated with a blood sample
- Figure 32 shows the predicted effects of leukocyte concentration on oxygen uptake associated with a blood sample
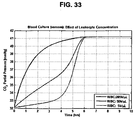
- Figure 33 illustrates the predicted effects of leukocyte concentration on partial gas pressures associated with a blood sample
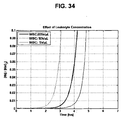
- Figure 3 4 illustrates the predicted effects of leukocyte concentration on the ratio of hemoglobin forms associated with a blood sample
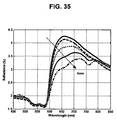
- Figure 35 illustrates the evolution of reflectance spectra over time, associated with a blood sample in a blood culture bottle
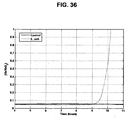
- Figure 36 illustrates the evolution of a ratio of hemoglobin forms over time, associated with a blood sample in a blood culture bottle
- Figure 37 illustrates the evolution of a ratio of partial gas pressures over time, associated with a blood sample in a blood culture bottle
- Figure 3 8 is a comparison between the measured and calculated reflectance spectra of a blood sample prior to and after hemoloysis
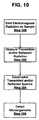
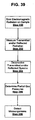
- Figure 39 is a flow diagram that illustrates various exemplary steps associated with detecting microorganisms, using partial gas pressures
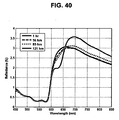
- Figure 40 illustrates an evolution of reflectance spectra over time, associated with a blood sample in a blood culture bottle, which sample is contaminated with bacteria, E. faecium ;
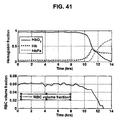
- Figure 4 1 illustrates the evolution of hemoglobin fraction and red blood cell volume fraction over time, associated with blood samples contaminated with bacteria E. faecium.
- microbial contamination in a blood sample may be detected via transmittance or reflectance measurements taken across a spectrum of light.
- the transmittance or reflectance is obtained after emitting light against the blood sample in a container.
- the data are subsequently deconvolved into its component parts using mathematical descriptions, such as theoretical models. See Jansson, P.A., DECONVOLUTION: WITH APPLICATIONS IN SPECTROSCOPY (Academic Press, 1984 ).
- the goal of this process is to determine the model parameters that relate to the state of the physical properties of blood, and relate to its chemical composition.
- the interpretation of the parameters in turn relates to characteristics such as doubling time, respiration range, size, and shape, and partial pressures of gases such as oxygen and carbon dioxide; thereby typifying microorganisms present in the sample.
- the present invention provides methodology for detecting microorganisms in blood, for instance, in a blood culture bottle. More specifically, the invention exploits changes in the physical and chemical properties in blood (e.g., hemoglobin composition), as well as partial pressures of gases such as oxygen and carbon dioxide in the head space of the blood culture, to detect the presence and identifying characteristics of organisms. These changes are detected via spectrophotometric procedures that accommodate or are suited to the UV-Vis-NIR portion of the electromagnetic spectrum. Pursuant to the various embodiment of the present invention, spectral measurements thus obtained are interpreted quantitatively by means of spectral deconvolution techniques. This approach encompasses real-time monitoring of the physical and chemical changes in blood.
- blood e.g., hemoglobin composition
- gases such as oxygen and carbon dioxide
- Diffuse transmission and diffuse reflectance are two techniques that can be applied in making such measurements. See, e.g., Mignani et al. "In Vivo Medical Sensors," in OPTICAL FIBER SENSORS, Dakin et al., eds. (1997 ); Kortum G. REFLECTANCE SPECTROSCOPY (1969 ). These techniques take advantage of the observation that blood and blood suspensions diffusely scatter light at concentrations typically used for in vitro cultures. Hapke, B. THEORY OF REFLECTANCE AND EMITTANCE (1993 ); Schmitt et al., Ann. of Biomed Eng. 14: 35-52 (1986 ); Reynolds et al., Appl. Optics 15: 2059-67 (1976 ); McRae et al., J. Opt. Soc. of America 51: 1366-72 (1961 ). In the case of reflectance measurements, this observation is particularly important.
- Diffuse reflectance measurements do not require the source (i.e., illuminating fiber) or the detector (i.e., receiving fiber) to be collimated. See Mignani et al., Kortum et al., and Hapkie et al., supra. Moreover, these measurements do not require probe placement directly on the surface of the sample container. See Kortum et al. and compare U.S. patent No. 5,427,920 , both discussed above. Figure 2 depicts an example of a commercially available fiber optic configuration suitable for diffuse reflectance measurements.
- the spectral region between 190-1100 nm is particularly suitable for collimated and diffuse transmittance measurements, whereas the spectral region between 400-1100 nm is ideal for angular and diffuse reflectance.
- collimated refers to the use of a parallel beam of photons impinging upon a sample. The stream of photons can be observed across the sample (transmittance) or from the reflected radiation. If the source is "diffuse” then the light will impinge on the sample from many directions. Accordingly, the direction of the transmitted and scattered light relative to the incident light may not be established. "Diffuse” reflectance pertains when light is reflected in all directions uniformly; hence, observations from any direction are equivalent.
- angular are a function of angle and, typically, are used in conjunction with collimated sources.
- Deconvolution techniques can be employed using different mathematical descriptions of the spectral data that may be associated with fundamental lineshapes, chromophoric groups, and scattering patterns, depending on what type of information is to be extracted from the blood sample.
- These mathematical descriptions include but are not limited to theoretical, empirical, and statistical models. These models may have representations that are (i) mathematical (i.e., comprising functions or equations), and/or (ii) statistical (i.e., comprising principal components or databases). In all cases, the parameters implicit in the description of the spectra are affected by the following exemplary variables:
- An additional variable is the rate of change of an indicator, such as hemoglobin, composition in blood culture, which may be a function of:
- a model has been implemented that is capable of describing the following four distinct time intervals relevant to changes in an indicator, such as hemoglobin, composition and other physical and chemical properties of the sample.
- This model is based on the analysis of different variables that affect the spectra, such as the variables listed above.
- the spectra obtained either by transmittance and/or reflectance, can, therefore, be resolved in terms of hemoglobin composition and/or the physical properties of blood at any point during the culturing process.
- the deconvolution can employ but is not limited to using a standard least-squares estimation. See Welch et al., J. Clin. Micro. 20: 881-83 (1984 ), Lawson et al., SOLVING LEAST SQUARES PROBLEMS (1974 ), and Jansson, supra.
- the standard least-squares solutions may be implemented from linear and non-linear interpretation models for both transmission and reflectance. These models are further described in greater detail in the sections that follow.
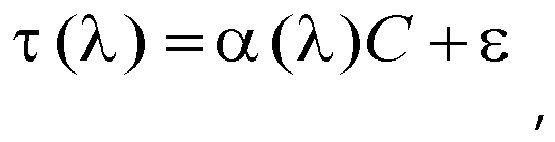
- Linear interpretation models can be derived for both transmission and reflectance measurements under appropriate approximations.
- ⁇ ( ⁇ ) represents the vector of optical densities as a function of wavelength
- ⁇ , ⁇ ( ⁇ ) is the matrix of absorption coefficients of the forms of hemoglobin as a function of wavelength
- C represents the vector of concentrations of the forms of hemoglobin considered
- ⁇ represents the error associated with the measurements.
- the notation (.) T represents the transpose of the matrix (.)
- the notation (.) -l represents the inverse of the matrix (.).
- Figure 22(A) the presence and type of the two microorganisms can be readily distinguished from the reflectance values.
- Figure 22(B) shows the time evolution of the reflectance spectra over a large span of wavelengths that can be used to assess the presence, absence and/or identity of multiple microorganisms.
- conventional systems cannot detect the presence of multiple pathogens and do not provide any information about the pathogen growth behavior.
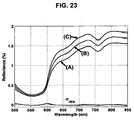
- Figure 23 illustrates a comparison between calculated and measured spectra for a blood sample at different time steps of a blood culture experiment with multiple contaminants, specifically bacterium Staphylococcus epidermidis and yeast Candida glabrata .
- Figure 23 illustrates the measured (R meas ) and predicted (R calc ) reflectance spectra and residuals ( ⁇ res ) for blood culture samples characterized by one particle population (erythrocytes) (designated as A), two particle populations (erythrocytes and bacterial cells) (designated as B), and three particle populations (erythrocytes, bacterial cells, and yeast cells) (designated as C) in the 500-850 nm spectral range.
- erythrocytes erythrocytes
- B two particle populations
- C three particle populations
- the respiration of white blood cells and platelets initially dominate the O 2 consumption causing a corresponding decrease in the oxygen partial pressure.
- the specific respiration rate of the white blood cells is such that the oxygen consumption is approximately the same for each population.
- the microorganisms are the most active population with a relatively high metabolic rate and have continuously increasing numbers.
- the microbial growth results in a high rate of oxygen consumption which is clearly evident during the exponential phase of the growth ( ⁇ 4-6 hours).
- the distribution of O 2 and CO 2 between the liquid and gaseous phases present in the culture bottles is shown in Figure 27 as a function of time for a control sample and a sample contaminated with 100 microbial CFU/mL of blood.
- the pressure in the vial is resulting from the contributions of water, oxygen and carbon dioxide (the system is under vacuum).
- the pressure stabilizes once the populations of white blood cells and platelets become inactive.
- the decrease in O 2 partial pressure continues unabated at a rate proportional to the bacterial growth: a function of its specific growth rate and respiration rate. The point at which the two lines separate can be used to detect the presence of microorganisms.
- the reflectance spectra are functions of the cell densities, the changes in the physical and chemical properties of blood, and the absorption and scattering properties of the cell populations present in the mixture.
- the effect of the chemical composition is introduced directly through the additive properties of the complex refractive index.
- the reflectance model is comprehensive relative to the measurement variables. The results reported herein focus on the variables relevant to changes in the chemical composition of hemoglobin.
- the reflectance spectra for the exemplary blood properties listed in Figure 24 were previously illustrated in Figure 5 , for different forms of hemoglobin, including the two principal forms, oxy- and deoxy-hemoglobin. Notice the distinct spectral features that are characteristic of each hemoglobin species; in the measurement mode, these distinct features enable an accurate quantitative spectral deconvolution.
- the hemoglobin composition can be readily corrected to enable the detection of microorganisms by use of the quantitative information pertaining to the hematocrit and the relative concentration of oxy- and deoxy-hemoglobin during the early stages of the blood culture.
- Figure 34 shows the evolution of the hemoglobin composition ([Hb]/[HbO2]) in a blood culture as function of time for the three leukocyte concentrations under consideration.
- Lysed erythrocytes change the volume fraction, number density and the mean cell volume of particulates in a blood sample. Since erthrocytes are the primary particle population in blood cultures, red blood cell lysis can have an impact on a reflectance signal as demonstrated in Figure 38 .
- Spectrum A in Figure 38 represents the diffuse reflectance signal from a blood culture sample prior to hemolysis and spectrum B shows the reflectance signal from the same sample after hemolysis. The observed spectral differences are the collective outcome of the physical changes in the sample, i.e., in the size, volume fraction and number density of particulates as erythrocytes rupture into pieces, and chemical changes resulting from the increased free hemoglobin in the media.
- Figure 39 provides a flow diagram describing the sequence of exemplary steps involved in the detection of microorganisms in a blood sample within a closed container in accordance with the principles of the present invention. Similar to the flow diagram of Figure 10 , in Step 200, one or more blood samples are irradiated with electromagnetic radiation. In Step 202, the reflected and/or transmitted radiations are measured. In Step 204, the detected spectra are deconvolved. In Step 206, the partial pressure of gasses, such as oxygen and carbon dioxide are obtained, using the spectrophotometric data, and in step 208, microorganisms are detected in accordance with at least the partial gas pressures obtained in step 206.
- gasses such as oxygen and carbon dioxide
- identification and/or classification of microorganisms may be also conducted, at least partially or initially, via the detection of changes in the properties of blood that is induced by microbial metabolites.
- Production of metabolites (such as peroxides, alcohols, aldehydes, sulfides, nitrogen oxides, phospholipase and other lytic enzymes, and the like) during the growth of microorganisms can induce certain modifications in the chemical and/or physical properties of blood components, primarily erythrocytes.
- Such modifications may include alterations in chemical composition of hemoglobin (i.e., formation of methemoglobin, sulfhemoglobin, nitrohemoglobin, cyanhemoglobin, ferrylhemoglobin, and the like) and/or alterations in morphological structure of erythrocytes (i.e., lysis, swelling, shape transformation, and the like).
- catalase-negative gram-positive bacteria may be discriminated by production of methemoglobin.
- Catalase is an enzyme that converts hydrogen peroxide, which is a typical by-product of microbial metabolic processes, to molecular oxygen and water.
- Catalase-negative bacteria lack this enzyme.
- the most commonly encountered catalase-negative bacteria are Enterococci ( E. faecium ) and Streptococci ( S. pneumoniae , S. pyogens (group A), Streptococcus agalactiae (group B)).
- Most staphylococci are catalase-positive with the exception of S . saccharolyticus and S. aureus subsp .
- catalase-negative S . aureus CNSA
- CNSA catalase-negative S . aureus
- One of the primary consequences of the lack of catalase is the production of elevated levels of hydrogen peroxide during the growth of catalase-negative bacteria (see, Moy et al., 2004).
- most of the catalase-negative bacteria possess hemolytic properties.
- S . pyogens is ⁇ -hemolytic streptococcus that causes partial lysis of erythrocytes and S. agalactiae and E. faecium are ⁇ -hemolytic that induce a complete rupture of erythrocytes.
- Hydrogen peroxide is one of the reactive oxygen species (ROS) that react with hemoglobin to produce methemoglobin (see, for example, Dudok et al., 2004). Therefore, the production of hydrogen peroxide by catalase-negative bacteria in a blood culture leads to the formation of large levels of methemoglobin. This metabolic pathway is different from the typical shift from oxy- to deoxy- hemoglobin, which is observed for the majority of the catalase-positive bacteria, thus enabling the partial identification of the catalase-negative bacteria. Since methemoglobin has unique optical signatures that differentiate this hemoglobin form from other forms of hemoglobin, detection of catalase-negative organisms may be effected using optical monitoring of blood culture bottles.
- ROS reactive oxygen species
- Lytic enzymes released by certain microorganisms during growth may cause hemolysis of erythrocyte, leading to the release of hemoglobin from the cells into the media.
- This feature is optically detectable since the destruction of erythrocytes modifies optical characteristics of the reflectance and/or transmittance spectra, and aids in partial identification of the microorganisms.
- Such hemolytic bacteria can be E. faecium, P. mirabilis , certain strains of S . aureus , and the like.
- ⁇ - and ⁇ - hemolytic microorganisms can be differentiated since ⁇ -hemolytic microorganisms cause only partial hemolysis while ⁇ -hemolytic microorganisms destruct red blood cells completely.
- the top panel of Figure 41 demonstrates temporal evolutions of the critical blood culture parameters for duplicate blood culture experiments with E. faecium. Note that in Figure 41 , the solid and dashed lines indicate the first and the second experiments, respectively. The sharp decline in oxyhemoglobin and increase in deoxyhemoglobin, evident at approximately 10 hours into the experiments, are consistent with the previous observations for microorganisms in blood culture. It has been shown that bacteria reach concentrations of 10 7 -10 8 cells per ml at this time point. Yet, rapid accumulation of methemoglobin occurred shortly afterwards, which is the characteristic of the ROS producing microorganism. In addition, the bottom panel of Figure 41 shows the temporal progression of the volume fraction of erythrocytes. As evident from Figure 41 , the volume fraction remains relatively constant during the first 9 hours and then starts to decline while reaching nearly zero at 13-14 hours. This complete rupture of erythrocytes is indicative of ⁇ -hemolytic microorganism.
Landscapes
- Chemical & Material Sciences (AREA)
- Health & Medical Sciences (AREA)
- Physics & Mathematics (AREA)
- Life Sciences & Earth Sciences (AREA)
- General Health & Medical Sciences (AREA)
- Analytical Chemistry (AREA)
- Immunology (AREA)
- Biochemistry (AREA)
- Organic Chemistry (AREA)
- General Physics & Mathematics (AREA)
- Pathology (AREA)
- Spectroscopy & Molecular Physics (AREA)
- Proteomics, Peptides & Aminoacids (AREA)
- Engineering & Computer Science (AREA)
- Wood Science & Technology (AREA)
- Zoology (AREA)
- Molecular Biology (AREA)
- Bioinformatics & Cheminformatics (AREA)
- General Engineering & Computer Science (AREA)
- Microbiology (AREA)
- Genetics & Genomics (AREA)
- Biotechnology (AREA)
- Biophysics (AREA)
- Toxicology (AREA)
- Investigating Or Analysing Materials By Optical Means (AREA)
- Investigating Or Analysing Biological Materials (AREA)
Claims (15)
- Verfahren zur Beurteilung des Vorhandenseins von Mikroorganismen im Blut, umfassend(a) Senden von elektromagnetischer Strahlung in mindestens eine Blutprobe;(b) Messen von wellenlängenabhängigen Spektren von von der Blutprobe wiederausgestrahlter elektromagnetischer Strahlung, wobei entweder Signale gestreuter Transmission oder Signale gestreuter Reflexion oder beides gemessen werden; und dann(c) Entfalten der Spektren zur Überwachung von Veränderungen der Hämoglobinzusammensetzung in der Blutprobe unter Verwendung von Vielfachstreuungsnäherungen, wodurch das Vorhandensein oder Nichtvorhandensein von Mikroorganismen in der Blutprobe beurteilt wird.
- Verfahren nach Anspruch 1, wobei die Spektren quantitativ in Bezug auf die physikalischen und chemischen Eigenschaften von Blut interpretiert werden.
- Verfahren nach Anspruch 1-2, wobei das Entfalten das Vorhandensein oder Nichtvorhandensein von mehreren Typen Mikroorganismen im Blut bestimmt.
- Verfahren nach Anspruch 1-3, wobei der Entfaltungsschritt (i) mindestens ein lineares oder nichtlineares Modell umfasst und (ii) die Spektren in eine teilchenbezogenen physikalischen Bestimmung auflöst.
- Verfahren nach Anspruch 1-4, wobei der Entfaltungsschritt mindestens eine Form von Hämoglobin identifiziert und quantifiziert.
- Verfahren nach Anspruch 5, wobei der Entfaltungsschritt (i) mindestens ein lineares Modell oder nichtlineares Modell umfasst und (ii) die Spektren in den Hämoglobinform auflöst.
- Verfahren nach Anspruch 1-6, weiterhin umfassend das Extrahieren von Identifizierungsmerkmalen der Mikroorganismen anhand der Spektren.
- Verfahren nach Anspruch 7, wobei die Identifizierungsmerkmale Vermehrungsparameter umfassen und die Vermehrungsparameter Verdopplungszeiten und Respirationsfrequenzen umfassen.
- Verfahren nach Anspruch 7, wobei die Identifizierungsmerkmale physikalische Merkmale umfassen und die physikalischen Merkmale Größe und Form beinhalten.
- Verfahren nach Anspruch 6, wobei das nichtlineare Modell ein Reflexionsmodell ist, das Näherungen beinhaltet, die jeweils durch die folgenden Gleichungen repräsentiert werden:
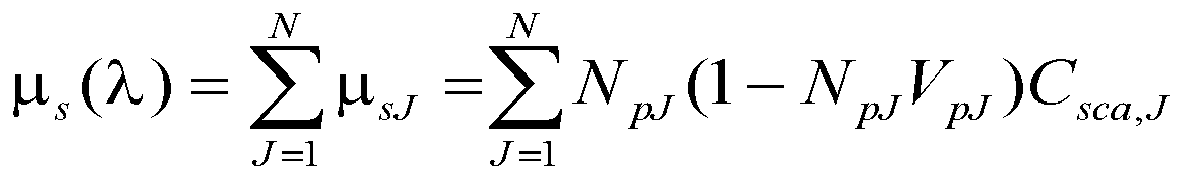
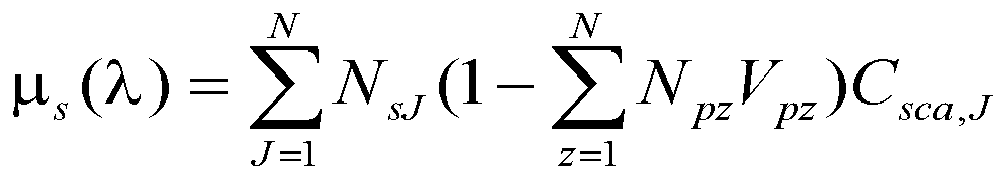
wobei µ s (λ) der gesamte makroskopische Streuungsquerschnitt in Abhängigkeit von der Wellenlänge λ ist; Csca der Streuungsquerschnitt eines einzelnen Teilchens ist; Np die Teilchenkonzentration ist; VpJ das durchschnittliche Volumen der J-ten Teilchenpopulation ist; und N die Population der Teilchen ist. - Verfahren nach Anspruch 6, wobei das Entfalten unter Verwendung von Messungen der gestreuten Transmission gemäß dem linearen Modell durchgeführt wird, repräsentiert durch:
wobei T(λ) ein Vektor optischer Dichten in Abhängigkeit von der Wellenlänge λ ist; α(λ) eine Matrix von Absorptionskoeffizienten der Hämoglobinformen in Abhängigkeit von der Wellenlänge λ ist; C ein Vektor der Konzentrationen der fraglichen Hämoglobinformen ist, und ε ein mit den Messungen der gestreuten Transmission verbundener Fehler ist. - Verfahren nach Anspruch 6, wobei das Entfalten unter Verwendung von Messungen der gestreuten Reflexion gemäß dem Kubelka-Munk-Reflexionsmodell durchgeführt wird, repräsentiert durch:

wobei R ∞(λ) die gestreute Reflexion einer unendlichen Schichtdicke in Abhängigkeit von der Wellenlänge λ ist; µα (λ) ein makroskopischer Absorptionsquerschnitt in Abhängigkeit von der Wellenlänge λ ist; und µst(λ) ein modifizierter makroskopischer Streuungsquerschnitt der Schicht und/oder Zellsuspension in Abhängigkeit von der Wellenlänge λ ist. - Verfahren nach Anspruch 6, wobei das Entfalten unter Verwendung von Messungen der gestreuten Transmission gemäß dem nichtlinearen Modell durchgeführt wird, repräsentiert durch:
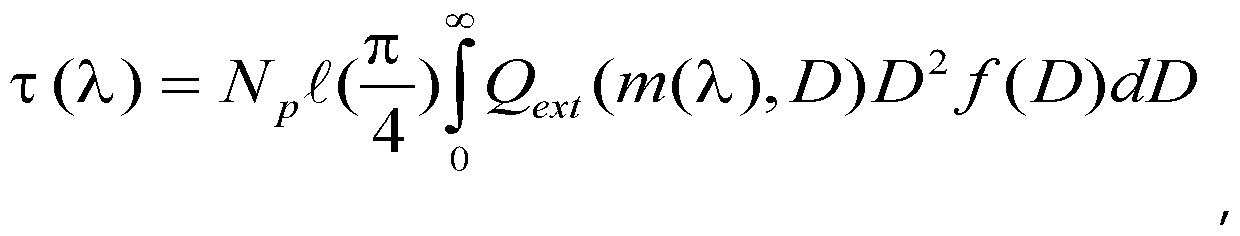
wobei T(λ) ein Vektor der optischen Dichten in Abhängigkeit von der Wellenlänge λ ist; Np die Anzahl der roten Blutkörperchen pro Volumeneinheit; ℓ die Weglänge ist; D die charakteristische Teilchendimension ist; Qext die Extinktionseffizienz; und m(λ) der komplexe Brechungsindex in Abhängigkeit von der Wellenlänge λ ist. - Verfahren nach Anspruch 6, wobei das Entfalten unter Verwendung von Messungen der gestreuten Reflexion gemäß dem nichtlinearen Modell durchgeführt wird, repräsentiert durch:

wobei RX(rx) die gestreute Reflexion (d. h. die mit dem einfallenden Lichtstrom normalisierte Rückstreuintensität) einer willkürlichen Detektorblende ist, rx; µ st (λ) ein modifizierter makroskopischer Streuungsquerschnitt der Reflexionsschicht und/oder Zellsuspension in Abhängigkeit von der Wellenlänge λ ist; a der Radius der elektromagnetischen Strahlungsquelle ist; kn der n-ten Eigenwert der Green'schen Funktion ist, z die Tiefe ist; und µst(λ) der Gesamtabsorptions- und Streuungsquerschnitt ist; und I1 und K1 die modifizierten Besselfunktionen erster Ordnung der ersten bzw. zweiten Art angeben. - Verfahren nach Anspruch 5, wobei der Entfaltungsschritt weiterhin mindestens einen Blutparameter identifiziert und quantifiziert, ausgewählt aus der Gruppe bestehend aus: Hämatokrit, Volumenfraktion der Erythrozyten, Dichtewerte der Erythrozyten, Volumenfraktion von Hämoglobin in Erythrozyten, durchschnittliches Zellvolumen von Erythrozyten, Fraktion der gelysten Erythrozyten, Konzentration an freiem Hämoglobin, Fraktion von Deoxyhämoglobin im Gesamthämoglobin und Restquadratsumme.
Applications Claiming Priority (2)
| Application Number | Priority Date | Filing Date | Title |
|---|---|---|---|
| US99619207P | 2007-11-06 | 2007-11-06 | |
| PCT/US2008/012408 WO2009061377A2 (en) | 2007-11-06 | 2008-11-03 | Detecting microorganisms in blood utilizing physical and chemical changes in blood |
Publications (2)
| Publication Number | Publication Date |
|---|---|
| EP2220249A2 EP2220249A2 (de) | 2010-08-25 |
| EP2220249B1 true EP2220249B1 (de) | 2012-08-01 |
Family
ID=40557452
Family Applications (1)
| Application Number | Title | Priority Date | Filing Date |
|---|---|---|---|
| EP08847250A Not-in-force EP2220249B1 (de) | 2007-11-06 | 2008-11-03 | Nachweis von mikroorganismen in blut unter nutzung physikalischer und chemischer veränderungen im blut |
Country Status (5)
| Country | Link |
|---|---|
| US (1) | US7952693B2 (de) |
| EP (1) | EP2220249B1 (de) |
| CN (1) | CN101918582A (de) |
| BR (1) | BRPI0818741A2 (de) |
| WO (1) | WO2009061377A2 (de) |
Families Citing this family (18)
| Publication number | Priority date | Publication date | Assignee | Title |
|---|---|---|---|---|
| EP2625505A1 (de) * | 2010-10-08 | 2013-08-14 | Edwards Lifesciences Corporation | Kontinuierliche messung des gesamthämoglobins |
| JP6076801B2 (ja) * | 2013-03-29 | 2017-02-08 | シスメックス株式会社 | 血球分析装置および血球分析方法 |
| US10285596B2 (en) * | 2016-04-11 | 2019-05-14 | Majelco Medical, Inc. | Apparatus and system for measuring volume of blood loss |
| US10690684B2 (en) * | 2013-05-10 | 2020-06-23 | Majelco Medical, Inc. | Apparatus and system for measuring volume of blood loss |
| CN103604499B (zh) * | 2013-11-19 | 2016-07-06 | 南京理工大学 | 基于反向双光路的光谱重建方法 |
| US10551293B2 (en) * | 2015-11-17 | 2020-02-04 | Korea Advanced Institute Of Science And Technology | Apparatus for detecting sample properties using chaotic wave sensor |
| SI3384001T1 (sl) * | 2015-12-03 | 2020-04-30 | Merck Patent Gmbh | Kemijsko definirana gojišča za odkrivanje mikroorganizmov |
| US11650197B2 (en) * | 2016-01-28 | 2023-05-16 | Siemens Healthcare Diagnostics Inc. | Methods and apparatus adapted to quantify a specimen from multiple lateral views |
| CN107727636B (zh) * | 2017-10-13 | 2020-02-14 | 中国科学院上海技术物理研究所 | 一种基于时域分辨紫外拉曼荧光谱的冻存血清分析方法 |
| CN108185992B (zh) * | 2018-01-23 | 2021-03-23 | 中国医学科学院生物医学工程研究所 | 一种无创光学脑组织氧代谢的测量方法 |
| CN108827936B (zh) * | 2018-06-15 | 2024-03-08 | 何坚 | 一种血液培养报阳检测装置与方法 |
| CN109554437B (zh) * | 2018-12-10 | 2022-05-17 | 湖南长沙天地人生物科技有限公司 | 一种双波长微生物生化反应动态判读检测方法 |
| JP7194030B2 (ja) * | 2019-01-30 | 2022-12-21 | 株式会社エビデント | 赤血球モニタリング装置 |
| JP7257182B2 (ja) * | 2019-02-27 | 2023-04-13 | 京セラ株式会社 | 検査装置および検査方法 |
| US11299701B2 (en) | 2019-03-19 | 2022-04-12 | Olympus Corporation | Culture-medium-monitoring apparatus |
| FR3103900B1 (fr) * | 2019-11-29 | 2024-07-19 | Univ Du Mans | Méthode d'identification rapide de microorganismes par analyse de matrices excitation-émission |
| CN114829904B (zh) * | 2019-12-18 | 2025-08-19 | 赛特加德股份有限公司 | 浓缩血小板控制 |
| US12546721B2 (en) | 2023-01-23 | 2026-02-10 | Lightsense Technology, Inc. | Multispectral detection and classification of bacteria utilizing scattering and/or absorbance, excitation, emissions utilizing machine learning |
Family Cites Families (12)
| Publication number | Priority date | Publication date | Assignee | Title |
|---|---|---|---|---|
| US4152213A (en) * | 1977-03-10 | 1979-05-01 | Johnston Laboratories, Inc. | Vacuum detection of bacteria |
| CA2092373A1 (en) * | 1992-04-24 | 1993-10-25 | Klaus W. Berndt | Methods and apparatus for detecting biological activities in a specimen |
| US5422720A (en) * | 1993-07-21 | 1995-06-06 | Becton Dickinson And Company | Blood culture sensor station utilizing two distinct light sources |
| US7027134B1 (en) * | 1995-02-08 | 2006-04-11 | University Of South Florida | Spectrophotometric system and method for the identification and characterization of a particle in a bodily fluid |
| US6984526B2 (en) * | 1995-02-08 | 2006-01-10 | University Of South Florida | Spectrophotometric method for determining the viability of a sample containing platelets |
| US20020122168A1 (en) * | 2000-07-12 | 2002-09-05 | Garcia-Rubio Luis Humberto | Spectrophotometric system and method for the identification and characterization of a particle in a bodily fluid |
| US5770394A (en) | 1996-05-22 | 1998-06-23 | Becton Dickinson And Company | Method and apparatus for detecting bacteria using a blood culture froth |
| US5983122A (en) * | 1997-12-12 | 1999-11-09 | Ohmeda Inc. | Apparatus and method for improved photoplethysmographic monitoring of multiple hemoglobin species using emitters having optimized center wavelengths |
| US6514277B1 (en) * | 1999-06-11 | 2003-02-04 | Photonics Research Ontario | Fiber optic multitasking probe |
| US6379920B1 (en) * | 1999-07-24 | 2002-04-30 | Georgia Tech Research Corp. | Spectroscopic diagnostics for bacteria in biologic sample |
| US6944485B1 (en) * | 2000-04-20 | 2005-09-13 | Keith W. Van Meter | Hyperbaric resuscitation system and method |
| US7027143B1 (en) * | 2002-10-15 | 2006-04-11 | Kla-Tencor Technologies Corp. | Methods and systems for inspecting reticles using aerial imaging at off-stepper wavelengths |
-
2008
- 2008-11-03 WO PCT/US2008/012408 patent/WO2009061377A2/en not_active Ceased
- 2008-11-03 EP EP08847250A patent/EP2220249B1/de not_active Not-in-force
- 2008-11-03 CN CN2008801238378A patent/CN101918582A/zh active Pending
- 2008-11-03 US US12/263,807 patent/US7952693B2/en not_active Expired - Fee Related
- 2008-11-03 BR BRPI0818741A patent/BRPI0818741A2/pt not_active IP Right Cessation
Non-Patent Citations (1)
| Title |
|---|
| DESLAURIERS R ET AL: "Oxygen consumption in Plasmodium berghei-infected murine red cells: A direct spectrophotometric assay in intact erythrocytes", BIOCHIMICA ET BIOPHYSICA ACTA. MOLECULAR CELL RESEARCH, ELSEVIER SCIENCE PUBLISHERS, AMSTERDAM, NL LNKD- DOI:10.1016/0167-4889(86)90166-7, vol. 886, no. 3, 29 May 1986 (1986-05-29), pages 319 - 326, XP025210893, ISSN: 0167-4889, [retrieved on 19860529] * |
Also Published As
| Publication number | Publication date |
|---|---|
| WO2009061377A3 (en) | 2009-09-03 |
| BRPI0818741A2 (pt) | 2018-07-17 |
| US20090115996A1 (en) | 2009-05-07 |
| US7952693B2 (en) | 2011-05-31 |
| CN101918582A (zh) | 2010-12-15 |
| EP2220249A2 (de) | 2010-08-25 |
| WO2009061377A2 (en) | 2009-05-14 |
| WO2009061377A4 (en) | 2009-11-12 |
Similar Documents
| Publication | Publication Date | Title |
|---|---|---|
| EP2220249B1 (de) | Nachweis von mikroorganismen in blut unter nutzung physikalischer und chemischer veränderungen im blut | |
| EP2318139B1 (de) | Verfahren zum nachweis und zur charakterisierung eines mikroorganismus in einer blutprobe | |
| AU657403B2 (en) | Methods and apparatus for detecting biological activities in a specimen | |
| EP2913404B1 (de) | Systeme und verfahren zur präsumptiven identifizierung eines mikroorganismustyps in einer kultur | |
| CA2101886C (en) | Method and apparatus for detecting microorganisms | |
| JP5616797B2 (ja) | 高い信頼性で微生物に対して陽性として培養物を認定するためのシステムおよび方法 | |
| US20100124763A1 (en) | Method for detection, characterization and/or identification of microorganisms in a sealed container | |
| US6984526B2 (en) | Spectrophotometric method for determining the viability of a sample containing platelets | |
| CA2086608A1 (en) | Method and apparatus to detect bacterial contamination of transfusable blood | |
| Bombalska et al. | Classification of the biological material with use of FTIR spectroscopy and statistical analysis | |
| Malhotra et al. | Detection and identification of a mixed cyanobacteria and microalgae culture using derivative spectrophotometry | |
| CN103940812B (zh) | 一种分光光度法快速检测大肠菌群的方法及应用 | |
| Zhu et al. | Raman spectroscopic measurement of relative concentrations in mixtures of oral bacteria | |
| Magrisso et al. | Fiber-optic biosensor to assess circulating phagocyte activity by chemiluminescence | |
| Smith et al. | A new method for the detection of microorganisms in blood cultures: Part I. Theoretical analysis and simulation of blood culture processes | |
| Chu et al. | Single step, rapid identification of pathogenic microorganisms in a culture bottle | |
| EP4537084B1 (de) | Eine methode zur unterscheidung von harnwegsinfektionen | |
| CA2715567C (en) | Systems and methods for determining an amount of blood in a blood culture | |
| Huffman et al. | New method for the detection of micro-organisms in blood: application of quantitative interpretation model to aerobic blood cultures | |
| Di Zhu | Examination of Potential Applicability of Fourier Transform Infrared (FTIR) Spectroscopy for Routine Identification of Pathogenic Bacteria and Fungi and for Human Saliva-Based Detection of Viral Infection | |
| Meirkhanova et al. | Analysis of microalgae autofluorescence using full-spectrum cytometry to discriminate and monitor microalgae and bacteria | |
| Maquelin | Confocal raman microspectroscopy: a novel diagnostic tool in medical microbiology | |
| Dzhongova et al. | Effect of sample thickness on the extracted near-infrared bulk optical properties of Bacillus subtilis in liquid culture | |
| TWM383733U (en) | Liquid crystal display, backlight module, light source module and lampshade | |
| Rebuffo-Scheer | Development of a rapid identification system for Listeria at species, and Listeria monocytogenes at the serovar level by Artificial Neural Network analysis of Fourier Transform Infrared Spectra |
Legal Events
| Date | Code | Title | Description |
|---|---|---|---|
| PUAI | Public reference made under article 153(3) epc to a published international application that has entered the european phase |
Free format text: ORIGINAL CODE: 0009012 |
|
| 17P | Request for examination filed |
Effective date: 20100531 |
|
| AK | Designated contracting states |
Kind code of ref document: A2 Designated state(s): AT BE BG CH CY CZ DE DK EE ES FI FR GB GR HR HU IE IS IT LI LT LU LV MC MT NL NO PL PT RO SE SI SK TR |
|
| AX | Request for extension of the european patent |
Extension state: AL BA MK RS |
|
| 17Q | First examination report despatched |
Effective date: 20101105 |
|
| DAX | Request for extension of the european patent (deleted) | ||
| REG | Reference to a national code |
Ref country code: HK Ref legal event code: DE Ref document number: 1146829 Country of ref document: HK |
|
| GRAP | Despatch of communication of intention to grant a patent |
Free format text: ORIGINAL CODE: EPIDOSNIGR1 |
|
| GRAS | Grant fee paid |
Free format text: ORIGINAL CODE: EPIDOSNIGR3 |
|
| GRAA | (expected) grant |
Free format text: ORIGINAL CODE: 0009210 |
|
| AK | Designated contracting states |
Kind code of ref document: B1 Designated state(s): AT BE BG CH CY CZ DE DK EE ES FI FR GB GR HR HU IE IS IT LI LT LU LV MC MT NL NO PL PT RO SE SI SK TR |
|
| REG | Reference to a national code |
Ref country code: GB Ref legal event code: FG4D |
|
| REG | Reference to a national code |
Ref country code: AT Ref legal event code: REF Ref document number: 568748 Country of ref document: AT Kind code of ref document: T Effective date: 20120815 Ref country code: CH Ref legal event code: EP |
|
| REG | Reference to a national code |
Ref country code: IE Ref legal event code: FG4D |
|
| REG | Reference to a national code |
Ref country code: DE Ref legal event code: R096 Ref document number: 602008017685 Country of ref document: DE Effective date: 20120920 |
|
| REG | Reference to a national code |
Ref country code: NL Ref legal event code: VDEP Effective date: 20120801 |
|
| REG | Reference to a national code |
Ref country code: AT Ref legal event code: MK05 Ref document number: 568748 Country of ref document: AT Kind code of ref document: T Effective date: 20120801 |
|
| REG | Reference to a national code |
Ref country code: LT Ref legal event code: MG4D Effective date: 20120801 |
|
| PG25 | Lapsed in a contracting state [announced via postgrant information from national office to epo] |
Ref country code: HR Free format text: LAPSE BECAUSE OF FAILURE TO SUBMIT A TRANSLATION OF THE DESCRIPTION OR TO PAY THE FEE WITHIN THE PRESCRIBED TIME-LIMIT Effective date: 20120801 Ref country code: IS Free format text: LAPSE BECAUSE OF FAILURE TO SUBMIT A TRANSLATION OF THE DESCRIPTION OR TO PAY THE FEE WITHIN THE PRESCRIBED TIME-LIMIT Effective date: 20121201 Ref country code: AT Free format text: LAPSE BECAUSE OF FAILURE TO SUBMIT A TRANSLATION OF THE DESCRIPTION OR TO PAY THE FEE WITHIN THE PRESCRIBED TIME-LIMIT Effective date: 20120801 Ref country code: FI Free format text: LAPSE BECAUSE OF FAILURE TO SUBMIT A TRANSLATION OF THE DESCRIPTION OR TO PAY THE FEE WITHIN THE PRESCRIBED TIME-LIMIT Effective date: 20120801 Ref country code: NO Free format text: LAPSE BECAUSE OF FAILURE TO SUBMIT A TRANSLATION OF THE DESCRIPTION OR TO PAY THE FEE WITHIN THE PRESCRIBED TIME-LIMIT Effective date: 20121101 Ref country code: LT Free format text: LAPSE BECAUSE OF FAILURE TO SUBMIT A TRANSLATION OF THE DESCRIPTION OR TO PAY THE FEE WITHIN THE PRESCRIBED TIME-LIMIT Effective date: 20120801 Ref country code: CY Free format text: LAPSE BECAUSE OF FAILURE TO SUBMIT A TRANSLATION OF THE DESCRIPTION OR TO PAY THE FEE WITHIN THE PRESCRIBED TIME-LIMIT Effective date: 20120801 |
|
| PGFP | Annual fee paid to national office [announced via postgrant information from national office to epo] |
Ref country code: DE Payment date: 20121128 Year of fee payment: 5 |
|
| PG25 | Lapsed in a contracting state [announced via postgrant information from national office to epo] |
Ref country code: SI Free format text: LAPSE BECAUSE OF FAILURE TO SUBMIT A TRANSLATION OF THE DESCRIPTION OR TO PAY THE FEE WITHIN THE PRESCRIBED TIME-LIMIT Effective date: 20120801 Ref country code: BE Free format text: LAPSE BECAUSE OF FAILURE TO SUBMIT A TRANSLATION OF THE DESCRIPTION OR TO PAY THE FEE WITHIN THE PRESCRIBED TIME-LIMIT Effective date: 20120801 Ref country code: PL Free format text: LAPSE BECAUSE OF FAILURE TO SUBMIT A TRANSLATION OF THE DESCRIPTION OR TO PAY THE FEE WITHIN THE PRESCRIBED TIME-LIMIT Effective date: 20120801 Ref country code: GR Free format text: LAPSE BECAUSE OF FAILURE TO SUBMIT A TRANSLATION OF THE DESCRIPTION OR TO PAY THE FEE WITHIN THE PRESCRIBED TIME-LIMIT Effective date: 20121102 Ref country code: LV Free format text: LAPSE BECAUSE OF FAILURE TO SUBMIT A TRANSLATION OF THE DESCRIPTION OR TO PAY THE FEE WITHIN THE PRESCRIBED TIME-LIMIT Effective date: 20120801 Ref country code: SE Free format text: LAPSE BECAUSE OF FAILURE TO SUBMIT A TRANSLATION OF THE DESCRIPTION OR TO PAY THE FEE WITHIN THE PRESCRIBED TIME-LIMIT Effective date: 20120801 Ref country code: PT Free format text: LAPSE BECAUSE OF FAILURE TO SUBMIT A TRANSLATION OF THE DESCRIPTION OR TO PAY THE FEE WITHIN THE PRESCRIBED TIME-LIMIT Effective date: 20121203 |
|
| PGFP | Annual fee paid to national office [announced via postgrant information from national office to epo] |
Ref country code: GB Payment date: 20121128 Year of fee payment: 5 |
|
| PG25 | Lapsed in a contracting state [announced via postgrant information from national office to epo] |
Ref country code: NL Free format text: LAPSE BECAUSE OF FAILURE TO SUBMIT A TRANSLATION OF THE DESCRIPTION OR TO PAY THE FEE WITHIN THE PRESCRIBED TIME-LIMIT Effective date: 20120801 |
|
| PGFP | Annual fee paid to national office [announced via postgrant information from national office to epo] |
Ref country code: FR Payment date: 20121214 Year of fee payment: 5 |
|
| PG25 | Lapsed in a contracting state [announced via postgrant information from national office to epo] |
Ref country code: RO Free format text: LAPSE BECAUSE OF FAILURE TO SUBMIT A TRANSLATION OF THE DESCRIPTION OR TO PAY THE FEE WITHIN THE PRESCRIBED TIME-LIMIT Effective date: 20120801 Ref country code: CZ Free format text: LAPSE BECAUSE OF FAILURE TO SUBMIT A TRANSLATION OF THE DESCRIPTION OR TO PAY THE FEE WITHIN THE PRESCRIBED TIME-LIMIT Effective date: 20120801 Ref country code: DK Free format text: LAPSE BECAUSE OF FAILURE TO SUBMIT A TRANSLATION OF THE DESCRIPTION OR TO PAY THE FEE WITHIN THE PRESCRIBED TIME-LIMIT Effective date: 20120801 Ref country code: EE Free format text: LAPSE BECAUSE OF FAILURE TO SUBMIT A TRANSLATION OF THE DESCRIPTION OR TO PAY THE FEE WITHIN THE PRESCRIBED TIME-LIMIT Effective date: 20120801 Ref country code: ES Free format text: LAPSE BECAUSE OF FAILURE TO SUBMIT A TRANSLATION OF THE DESCRIPTION OR TO PAY THE FEE WITHIN THE PRESCRIBED TIME-LIMIT Effective date: 20121112 |
|
| PG25 | Lapsed in a contracting state [announced via postgrant information from national office to epo] |
Ref country code: IT Free format text: LAPSE BECAUSE OF FAILURE TO SUBMIT A TRANSLATION OF THE DESCRIPTION OR TO PAY THE FEE WITHIN THE PRESCRIBED TIME-LIMIT Effective date: 20120801 Ref country code: SK Free format text: LAPSE BECAUSE OF FAILURE TO SUBMIT A TRANSLATION OF THE DESCRIPTION OR TO PAY THE FEE WITHIN THE PRESCRIBED TIME-LIMIT Effective date: 20120801 |
|
| PLBE | No opposition filed within time limit |
Free format text: ORIGINAL CODE: 0009261 |
|
| STAA | Information on the status of an ep patent application or granted ep patent |
Free format text: STATUS: NO OPPOSITION FILED WITHIN TIME LIMIT |
|
| REG | Reference to a national code |
Ref country code: CH Ref legal event code: PL |
|
| 26N | No opposition filed |
Effective date: 20130503 |
|
| PG25 | Lapsed in a contracting state [announced via postgrant information from national office to epo] |
Ref country code: BG Free format text: LAPSE BECAUSE OF FAILURE TO SUBMIT A TRANSLATION OF THE DESCRIPTION OR TO PAY THE FEE WITHIN THE PRESCRIBED TIME-LIMIT Effective date: 20121101 Ref country code: CH Free format text: LAPSE BECAUSE OF NON-PAYMENT OF DUE FEES Effective date: 20121130 Ref country code: LI Free format text: LAPSE BECAUSE OF NON-PAYMENT OF DUE FEES Effective date: 20121130 |
|
| REG | Reference to a national code |
Ref country code: IE Ref legal event code: MM4A |
|
| REG | Reference to a national code |
Ref country code: DE Ref legal event code: R097 Ref document number: 602008017685 Country of ref document: DE Effective date: 20130503 |
|
| PG25 | Lapsed in a contracting state [announced via postgrant information from national office to epo] |
Ref country code: IE Free format text: LAPSE BECAUSE OF NON-PAYMENT OF DUE FEES Effective date: 20121103 |
|
| PG25 | Lapsed in a contracting state [announced via postgrant information from national office to epo] |
Ref country code: MT Free format text: LAPSE BECAUSE OF FAILURE TO SUBMIT A TRANSLATION OF THE DESCRIPTION OR TO PAY THE FEE WITHIN THE PRESCRIBED TIME-LIMIT Effective date: 20120801 |
|
| PG25 | Lapsed in a contracting state [announced via postgrant information from national office to epo] |
Ref country code: TR Free format text: LAPSE BECAUSE OF FAILURE TO SUBMIT A TRANSLATION OF THE DESCRIPTION OR TO PAY THE FEE WITHIN THE PRESCRIBED TIME-LIMIT Effective date: 20120801 Ref country code: MC Free format text: LAPSE BECAUSE OF NON-PAYMENT OF DUE FEES Effective date: 20121130 |
|
| PG25 | Lapsed in a contracting state [announced via postgrant information from national office to epo] |
Ref country code: LU Free format text: LAPSE BECAUSE OF NON-PAYMENT OF DUE FEES Effective date: 20121103 |
|
| REG | Reference to a national code |
Ref country code: DE Ref legal event code: R119 Ref document number: 602008017685 Country of ref document: DE |
|
| GBPC | Gb: european patent ceased through non-payment of renewal fee |
Effective date: 20131103 |
|
| PG25 | Lapsed in a contracting state [announced via postgrant information from national office to epo] |
Ref country code: HU Free format text: LAPSE BECAUSE OF FAILURE TO SUBMIT A TRANSLATION OF THE DESCRIPTION OR TO PAY THE FEE WITHIN THE PRESCRIBED TIME-LIMIT Effective date: 20081103 |
|
| REG | Reference to a national code |
Ref country code: FR Ref legal event code: ST Effective date: 20140731 |
|
| PG25 | Lapsed in a contracting state [announced via postgrant information from national office to epo] |
Ref country code: DE Free format text: LAPSE BECAUSE OF NON-PAYMENT OF DUE FEES Effective date: 20140603 |
|
| REG | Reference to a national code |
Ref country code: DE Ref legal event code: R119 Ref document number: 602008017685 Country of ref document: DE Effective date: 20140603 |
|
| PG25 | Lapsed in a contracting state [announced via postgrant information from national office to epo] |
Ref country code: GB Free format text: LAPSE BECAUSE OF NON-PAYMENT OF DUE FEES Effective date: 20131103 Ref country code: FR Free format text: LAPSE BECAUSE OF NON-PAYMENT OF DUE FEES Effective date: 20131202 |
|
| REG | Reference to a national code |
Ref country code: HK Ref legal event code: WD Ref document number: 1146829 Country of ref document: HK |