EP2156152B1 - Detektion eines abnormen signals in einem zusammengesetzten abgetasteten signal - Google Patents
Detektion eines abnormen signals in einem zusammengesetzten abgetasteten signal Download PDFInfo
- Publication number
- EP2156152B1 EP2156152B1 EP08736920A EP08736920A EP2156152B1 EP 2156152 B1 EP2156152 B1 EP 2156152B1 EP 08736920 A EP08736920 A EP 08736920A EP 08736920 A EP08736920 A EP 08736920A EP 2156152 B1 EP2156152 B1 EP 2156152B1
- Authority
- EP
- European Patent Office
- Prior art keywords
- segments
- frequency
- ratios
- summed
- ratio
- Prior art date
- Legal status (The legal status is an assumption and is not a legal conclusion. Google has not performed a legal analysis and makes no representation as to the accuracy of the status listed.)
- Not-in-force
Links
Images


Classifications
-
- G—PHYSICS
- G01—MEASURING; TESTING
- G01R—MEASURING ELECTRIC VARIABLES; MEASURING MAGNETIC VARIABLES
- G01R31/00—Arrangements for testing electric properties; Arrangements for locating electric faults; Arrangements for electrical testing characterised by what is being tested not provided for elsewhere
- G01R31/08—Locating faults in cables, transmission lines, or networks
-
- G—PHYSICS
- G01—MEASURING; TESTING
- G01H—MEASUREMENT OF MECHANICAL VIBRATIONS OR ULTRASONIC, SONIC OR INFRASONIC WAVES
- G01H3/00—Measuring characteristics of vibrations by using a detector in a fluid
- G01H3/04—Frequency
- G01H3/08—Analysing frequencies present in complex vibrations, e.g. comparing harmonics present
-
- G—PHYSICS
- G06—COMPUTING; CALCULATING OR COUNTING
- G06F—ELECTRIC DIGITAL DATA PROCESSING
- G06F15/00—Digital computers in general; Data processing equipment in general
Definitions
- the present invention relates to signal detection, and in particular to the detection of an abnormal signal in a compound signal.
- a signal in a compound signal It is often necessary or desirable to detect a signal in a compound signal. For example, most motorists have detected an annoying sound in the cabin of their car while driving the car around.
- the annoying sound i.e. the signal
- background noise caused by the car engine and road noise, etc i.e. the compound signal
- one of a number of different techniques are used.
- a trained technician may, sit in the car whilst it is motion and use his trained ear to identify the annoying sound and its cause.
- the cause of the annoying sound may be, for example, due to a clutch clicking or a seat squeaking.
- a technician can identify the source of the annoying sound and then rectify it.
- the sound in the cabin of the car may be recorded and processed mathematically.
- Changes in the recorded signal may be attributed to the annoying sound, and these changes can be detected using the mathematical processing.
- One way of processing the signal is to discretise it into a number of points (or, conversely, recording the signal in a discretised manner, for example by sampling the signal).
- the discretised recorded signal can be split into a number of segments. These segments can be characterised by determining, in each segment, the standard deviation of the segments divided by the mean value of recorded data within the segment (which is sometimes referred to as the determining the variation coefficient for the segment).
- EP 1 462 777 discloses a method of detecting an abnormal signal in a compound sampled signal recorded in the time domain.
- the environment which causes the compound signal to be generated can be modelled.
- the environment which causes the compound signal to be generated can be modelled.
- By establishing a model of the environment it is possible to see how changes to the model results in changes to the compound signal generated. Conversely, it is possible to determine what changes in the model lead to the generation of certain signals.
- Faults can be modelled, and signals generated by the model can be compared with real world signals to determiner their origins.
- the environment is too complicated to model accurately, or to model with any expectation of reliable results.
- a method of detecting an abnormal signal in a compound sampled signal recorded in the time domain comprising: dividing the sampled signal recorded in the time domain into a plurality of sample segments; transforming each of the plurality of the sample segments from the time domain into the frequency domain to determine a plurality of transformed sample segments, each transformed sample segment having a plurality of frequency points, each frequency point having an amplitude associated with a certain frequency; for a frequency point in a given transformed sample segment, determining a ratio by dividing the amplitude of the frequency point by a value indicative of an average of the amplitudes of the frequency points at the same frequency across a plurality of transformed sample segments; repeating the determination of a ratio for a plurality of frequency points in each transformed sample segment to determine a plurality of ratios for each transformed sample segment; repeating the determination of a plurality of ratios for a plurality of transformed sample segments; and using the ratios to detect the abnormal signal in the compound sampled signal.
- a ratio is determined for a majority of the frequency points of each transformed sample segment. Most preferably, a ratio is determined for all of the frequency points of each transformed sample segment.
- the determination of a plurality of ratios is undertaken for a majority of the transformed sample segments. Most preferably, the determination of a plurality of ratios is undertaken for all of the transformed sample segments.
- the value indicative of an average of the amplitudes of the frequency points at the same frequency across a plurality of transformed sample segments is determined across a majority of transformed sample segments.
- the value indicative of an average of the amplitudes of the frequency points at the same frequency across a plurality of transformed sample segments is determined across all of the transformed sample segments.
- the value indicative of an average of the amplitudes of the frequency points at the same frequency across a plurality of transformed sample segments is indicative of the mean, median or mode value.
- the method further comprises adding the plurality of ratios together to determine a summed ratio for each transformed sample segment.
- each ratio of the plurality is squared before they are added together to determine a summed squared ratio for each transformed sample segment.
- detecting the abnormal signal comprises identifying the sample segments having the highest summed ratios or summed squared ratios.
- the summed ratios or summed squared ratios are deemed to be the highest if they exceed a predetermined threshold.
- the threshold is a percentage of a peak summed ratio or summed squared ratio. The threshold maybe 60% of the peak summed ratio summed squared ratio.
- the method may further comprise taking away from the frequency points of a transformed sample segment deemed to have a highest summed ratio or summed squared ratio the frequency points of a transformed sample segment deemed not to have a highest summed ratio or summed squared ratio.
- a location of transformed sample segments in the frequency domain having the highest summed ratios or summed squared ratios is used to identify the corresponding sample segments in the time domain.
- the transformed sample segment or segments having the highest summed ratios or summed squared ratios are transformed from the frequency domain into the time domain.
- the sample segment in the time domain is analysed to determine if the sample segment in the time domain contains some or all of the abnormal signal.
- the analysis may comprise playing the signal back to a human.
- the method may comprise using detection hardware or software to compare the sample segments in the time domain with a plurality of stored signals.
- a computer readable medium carrying computer readable instructions configured to cause a computer to carry out a method according to any preceding claim.
- a computer apparatus for detecting an abnormal signal in a compound sampled signal, comprising: a memory storing processor readable instructions; and a processor for reading and executing instructions stored in the memory; wherein the processor readable instructions comprise instructions configured to cause the processor to carry out the method of any preceding claim.
- Figure 1 depicts an outline of a car 1. Located within the car 1 is a microphone 2 for detecting acoustic signals within the car 1. The microphone 2 is connected to a recorder 3 for recording acoustic signals detected by the microphone 2. The recorder 3 is provided with an output 4 to allow data from the recorder 3 to be output to other apparatus, for example a computer or the like.
- the microphone 2 continuously detects acoustic signals within the car 1. These acoustic signals are recorded continuously by the recorder 3.
- a person (not shown) within the car 1 may hear a sound which they associate with a fault. For example, the person may hear a repetitious knocking sound or clicking sound indicative of a fault with a part of the car. Once such a sound is heard the person may provide an input to the recorder 2, for example by pressing a button (not shown). When the button is pressed the recorder may automatically store, for example, the last 20 seconds worth of recorded signals. The stored recording may then be processed at a later stage to identify the cause of the sound which the person attributed to a fault in the car 1. Such a button on the recorder 3 may be pressed any number of times to store any number of recorded signals for appropriate processing at a later stage. The stored recorded signals may be accessed via the output 4.
- the recorder 3 records signals detected by the microphone 2 in a discrete manner. Specifically, the recorder 3 samples the acoustic signals within the car 1 at a predetermined frequency.
- the sampling frequency may be any suitable frequency. If the acoustic signal attributable to the fault is audible then it is within the range of human hearing, that is within the range of 20 Hz to 20 kHz. An industry standard sampling rate of 44.1 kHz will therefore be suitable for capture acoustic signals in the range of 20 Hz to 20 kHz.
- FIG. 2a illustrates a stored recorded acoustic signal 10 (hereinafter referred to as 'the stored signal 10').
- the stored signal 10 is a compound signal.
- the stored signal 10 may comprise a mixture of road noise, engine noise, as well as the acoustic signal attributed to a fault within the car.
- Figure 2b shows that, in order to assist the detection and identification of the acoustic fault signal, the stored signal 10 is segmented into a number of segments S1, S2, S3, S4 and so on.
- a signal can be processed in the time domain or the frequency domain.
- Figure 3b shows the situation when the data in the segments is transformed from the time domain into the frequency domain. It can be seen that the phase sensitivity is removed such that the data within the segments can be directly compared. Thus, it is preferable to undertake further processing of the segments in the frequency domain.
- Each of the segments is now transformed from the time domain to the frequency domain.
- the transformation may be undertaken using, for example, well known Fast Fourier Transform techniques.
- Each transformed segment then contains a number of frequency points which represent the amplitude (i.e. value) of the recorded signal at specific frequencies (in the frequency domain).
- the value at the frequency point is divided by the mean of the values at the same frequency in all the segments. This process is undertaken for all frequency points within the segments. This results in a ratio for each frequency point in the segment (i.e. the frequency point's value divided by the mean value for the same frequency across all the segments).
- the ratio gives an indication of the deviation of the value at the frequency point from the mean value, and is thus referred to as a deviation ratio.
- Deviation of one or more points from the mean is caused by an increase in the frequency components for that point, which may be attributable to a fault in the car.
- the deviation ratios for each frequency point within a given segment are then summed together.
- the total of the ratios for each segment can then be compared to determine which segment contains frequency points that have deviated the most from their mean across the segments. For example, the higher the sum of the deviation ratios for the segments, the more likely it is that something other than constant background noise (e.g. engine and road noise) caused the deviation. This conclusion can be used to detect the fault signal.
- constant background noise e.g. engine and road noise
- each of the ratios may be squared before being added together. Such squaring determines an energy associated with each segment. Since the energy is associated with the summation of deviation ratios, the energy is hereinafter referred to as the deviation energy.
- the signal energy in the frequency domain is the same as the signal frequency in the time domain, which means that conclusions drawn form the energy in the frequency domain can be used to draw conclusions in the time domain.
- the segments with the highest summation of deviation ratios (or deviation energy) may indicate that a fault signal has some or all of its components in that segment.
- the segment transformed to the frequency domain corresponds to a segment in the time domain.
- the corresponding segment in the time domain can be played back to the people within the car so that they can confirm that the sound is attributable to the fault within the car.
- the fault signal is thus extracted from a compound.
- the segment can be cleaned up by taking away from it the values of frequency points in a segment with little or no deviation from its mean (i.e. a constant background reference) to leave only the fault signal.
- the segment in the time domain or frequency domain can be compared with a library of known signals to identify any similarities between the recorded signal and known faults signals to determine the nature and/or origin of the fault signal.
- a threshold may be imposed to help identify segments having deviation ratio sums or deviation energies above a certain level. This threshold may be derived from experience that comes with used of the method, from trial and error, from statistics etc. For example, all segments with deviation ratio sums or deviation energies higher than 60% of the peak value could be investigated further (where, statistically speaking, a vast majority of the peaks will be present). Each segment having a sum of deviation ratios or a deviation energy higher than the threshold can then be looked at in more detail.
- the present invention contrasts starkly to prior art methods, where the standard deviation of the value of points within a given segment was divided by the mean value of points within that segment. In short, because the present invention considers the deviation about individual points within each segment, a more sensitive detection mechanism is created.
- the word 'fault' is a subjective term. More objectively, what is being undertaken with the method according to the embodiment of the present invention is detection of an abnormal signal in a compound signal.
- the signal is usually different in some way to some or all of the signals in the compound signal (in other words, abnormal), thereby adding additional frequency components to the compound which can be identified and extracted as identified above.
- Practical examples of the use of the method according to the embodiment of the present invention are described in relation to Figures 4-8 , although it will be appreciated that other applications of the method are also possible.
- a compound signal comprising a mixture of acoustic signals in a car, is recorded and sampled over a period of time.
- the compound signal includes an acoustic signal from a clutch that is clicking (i.e. the fault signal).
- the recorded time signal is then divided into 32 segments, each segment comprising 8192 data points.
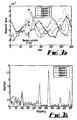
- Figure 4 is a plot of these segments laid alongside one another. It can be seen that there are a number of peaks contained in segments 26 to 30. Thus, in the time domain the fault signal would appear to be in segments 26 to 30.
- Figure 5a is a plot of the deviation energy for the segments. It can be seen that the deviation energy is particularly high for segments 26 to 30, which is in very good agreement with the acoustic peaks observed in the time domain segments of Figure 4 . This goes some way to proving the reliability of the use of deviation ratios and deviation energies to determine abnormal (e.g. fault) signals in a compound signal.
- the segments containing the highest deviation energy correspond to the same segments in the time domain.
- the segments in the time domain can be played back to the car driver, a technician or comparison software to determine if the segment contains the clutch click.
- Figure 5b shows the segment having the highest deviation energy transformed into the frequency domain, from which more information about the fault signal can be obtained.
- another compound signal comprising a mixture of acoustic signals is recorded and sampled in a car with a squeaking seat.
- the recorded signal is divided into 64 segments, each segment containing 8192 data points. These segments are shown alongside each other in the graph of Figure 6 . It can be seen that at first glance it is not that easy to determine the maximum peak in the time domain, since there is very little difference in the recorded acoustic signals between the different segments. Nevertheless, the maximum peak in the time domain can be found in segment 51 and segment 52. Using the variation coefficient method mentioned in the introduction above, the highest variation coefficients are present in segments 38 and 39.
- the deviation energy of the segments is highest in segments 38, 39, 40, and 45, 46, 47, 48, 49, 50, as shown in Figure 7a .
- the segments identified as potentially containing faults using the time domain method are not present in the segments identified as potentially containing faults using the method according to an embodiment of the present invention. It is therefore clear that one or both methods have not correctly identified the segments in which some or all of the fault signal is present. In order to identify which, if any, of the methods used to identify the segments containing fault signals are correct, further investigation needs to be undertaken.
- Figure 7b is a graph depicting segment 51 in the time domain, and which the time domain method identified as a segment containing at least a part of a fault signal.
- Figure 7c shows segment 39 in the time domain, and which the method according to an embodiment of the present invention identified as comprising all or some of a fault signal.
- the graphs of Figure 7b and 7c look fairly similar. It is only when these graphs are transformed into the frequency domain do the differences become more apparent.
- Figure 7d is a graph of segment 10 in the frequency domain. Segment 10 has been chosen since none of the methods used identify the segment as containing a fault signal. This segment can therefore be used as a zero level, or background against which the other segments can be judged.
- Figure 7e is a graph of segment 51 transformed into the frequency domain.
- Figure 7f is a graph of segment 39 transformed into the frequency domain. It can be seen that Figures 7d and 7e are very similar, in that the frequency components of segment 10 (i.e. the normal segment) are very similar to the frequency components of segment 51 (i.e. the segment which the time domain method identified as containing a fault signal). It can be concluded that the time domain method has incorrectly identified segment 51 as containing some or all of a fault signal.
- the graph of Figure 7f is quite different to both the graph of Figure 7d and of 7e, and therefore indicates that segment 39 is not normal, but contains some or all of an abnormal signal, i.e. the fault signal.
- the deviation energy method identified more segments in which faults or fault components may reside than any another prior art method, for example the time domain method or the variation coefficient method. This shows that the deviation energy method is a more sensitive method than those of the prior art, and that it can potentially be used to more easily detect and identify fault signals in a compound signal.
- Figure 7g illustrates the deviation ratios for all points in all of the segments. As expected, the deviation ratios are highest in segments where the deviation energies were calculated to be the highest. That is, the deviation ratios are highest in segments 38, 39, 40 and 45, 46, 47, 48, 49 and 50.
- Figure 7g illustrates how it is not essential to establish the deviation energy for each segment to determine if some or all of a fault signal is present in that segment. It can readily be seen that the determination of the deviation ratio alone can yield this information, however crudely.
- the number of deviation ratios above a certain threshold could be used to identify a segment potentially containing some or all of a fault signal.
- the deviation ratios may be used in any other number of ways to determine if a segment contains some or all of a fault signal.
- the sampling frequency is described as being 44.1 kHz. This is not essential, and any sampling frequency may be used which adequately samples the compound signal. 44.1 kHz is suitable for acoustic signals, since it covers the range of human hearing (i.e. 20 Hz to 20 kHz). For other applications, where the frequency range of interest, or change in frequency, is higher or lower than 20 Hz to 20 kHz, a higher or lower sampling rate may be preferable.
- the sampled recording was divided up into segments which contained enough data points to obtain a frequency resolution of 5.38 Hz.
- the number of data points within a segment, the sampling rate and the ultimate frequency resolution are all interrelated, and may be varied accordingly to achieve any desired resolution.
- a resolution of 5.38 Hz is by no means essential.
- the smaller the segments the more transforms that need to be undertaken from the time domain to the frequency domain. The fewer segments there are, the larger the segments are which need to be transformed into the frequency domain.
- processing implications e.g. computer processing time
- the value (i.e. amplitude) at the frequency point is divided by the mean of the values at all of the frequency points having the same frequency across all the segments.
- Use of the mean value is not essential. Any value indicative of an average of the values at all of the frequency points having the same frequency across all the segments may be used, for example the mode or median value.
- the deviation ratio is established for all or the majority of frequency points in a segment, although some resolution and frequency components information will be lost if this is not done. It is not essential the value indicative of an average value of a given frequency is derived from all or the majority of the segments, although some information may be lost if this is not done.
- the embodiments above have been described in relation to cars, car cabins and car faults. It will be appreciated that the invention is not so limited. The invention is applicable to any situation where it is desired to detect an abnormal signal in a compound.
- the method of the present invention could be used to detect a fault signal with a machine by monitoring its vibration using pressure sensors or microphones or the like.
- the method of the present invention could be used to detect a fault signal in an electrocardiogram, for example an irregular heartbeat interposed with a regular heartbeat, by direct monitoring and processing of the detected heart beat. It will be appreciated that the method of the present invention may be used in a wide range of applications.
- the signal, and/or compound signal may be any form of signal, and may be, or be generated by, or comprise for example: a pressure wave, a vibration of an object, an electrical signal, a magnetic signal, a capacitive signal, or an electromagnetic wave.
- Any suitable computer apparatus can be configured to carry out the methods described above.
- a standalone computer with appropriate software could be used or a purpose built machine.
Landscapes
- Physics & Mathematics (AREA)
- General Physics & Mathematics (AREA)
- Engineering & Computer Science (AREA)
- Theoretical Computer Science (AREA)
- Computer Hardware Design (AREA)
- General Engineering & Computer Science (AREA)
- Measurement Of Mechanical Vibrations Or Ultrasonic Waves (AREA)
- Radar Systems Or Details Thereof (AREA)
- Tests Of Electronic Circuits (AREA)
- Monitoring And Testing Of Transmission In General (AREA)
Claims (22)
- Verfahren zum Detektieren eines abnormalen Signals in einem zusammengesetzten abgetasteten Signal, das in der Zeitdomäne aufgenommen wurde, wobei das Verfahren umfasst:Teilen des abgetasteten Signals, das in der Zeitdomäne aufgenommen wurde, in eine Vielzahl von Probensegmenten;Umwandeln von jedem der Vielzahl der Probensegmente von der Zeitdomäne in die Frequenzdomäne, um eine Vielzahl von umgewandelten Probensegmenten zu bestimmen, wobei jedes umgewandelte Probensegment eine Vielzahl von Frequenzpunkten aufweist, wobei jeder Frequenzpunkt eine mit einer gewissen Frequenz assoziierte Amplitude aufweist;für einen Frequenzpunkt in einem bestimmten umgewandelten Probensegment Bestimmen eines Verhältnisses durch Teilen der Amplitude des Frequenzpunkts durch einen Wert, der für einen Durchschnitt der Amplituden der Frequenzpunkte in der gleichen Frequenz unter einer Vielzahl von umgewandelten Probensegmenten indikativ ist;Wiederholen des Bestimmens eines Verhältnisses für eine Vielzahl von Frequenzpunkten in jedem umgewandelten Probensegment, um eine Vielzahl von Verhältnissen für jedes umgewandelte Probensegment zu bestimmen;Wiederholen des Bestimmens einer Vielzahl von Verhältnissen für eine Vielzahl von umgewandelten Probensegmenten; undVerwenden der Verhältnisse, um das abnormale Signale in dem zusammengesetzten abgetasteten Signal zu detektieren.
- Verfahren nach Anspruch 1, wobei ein Verhältnis für einen Großteil der Frequenzpunkte von jedem umgewandelten Probensegment bestimmt wird.
- Verfahren nach Anspruch 2, wobei ein Verhältnis für alle Frequenzpunkte von jedem umgewandelten Probensegment bestimmt wird.
- Verfahren nach einem vorstehenden Anspruch, wobei das Bestimmen einer Vielzahl von Verhältnissen für einen Großteil der umgewandelten Probensegmente durchgeführt wird.
- Verfahren nach einem vorstehenden Anspruch, wobei das Bestimmen einer Vielzahl von Verhältnissen für alle umgewandelten Probensegmente durchgeführt wird.
- Verfahren nach einem vorstehenden Anspruch, wobei der Wert, der für einen Durchschnitt der Amplituden der Frequenzpunkte in der gleichen Frequenz unter einer Vielzahl von umgewandelten Probensegmenten indikativ ist, unter einem Großteil von umgewandelten Probensegmenten bestimmt wird.
- Verfahren nach einem vorstehenden Anspruch, wobei der Wert, der für einen Durchschnitt der Amplituden der Frequenzpunkte in der gleichen Frequenz unter einer Vielzahl von umgewandelten Probensegmenten indikativ ist, unter allen umgewandelten Probensegmenten bestimmt wird.
- Verfahren nach einem vorstehenden Anspruch, wobei der Wert, der für einen Durchschnitt der Amplituden der Frequenzpunkte in der gleichen Frequenz unter einer Vielzahl von umgewandelten Probensegmenten indikativ ist, für den mittleren, den medianen oder den Modalwert indikativ ist.
- Verfahren nach einem vorstehenden Anspruch, ferner umfassend das Addieren der Vielzahl von Verhältnissen, um ein summiertes Verhältnis für jedes umgewandelte Probensegment zu bestimmen.
- Verfahren nach Anspruch 9, wobei jedes Verhältnis der Vielzahl quadriert wird, bevor sie addiert werden, um ein summiertes quadriertes Verhältnis für jedes umgewandelte Probensegment zu bestimmen.
- Verfahren nach Anspruch 9 oder 10, wobei das Detektieren des abnormalen Signals das Identifizieren der Probensegmente mit den höchsten summierten Verhältnissen oder summierten quadrierten Verhältnissen umfasst.
- Verfahren nach Anspruch 11, wobei die summierten Verhältnisse oder summierten quadrierten Verhältnisse als die höchsten erachtet werden, wenn sie einen vorab definierten Schwellenwert übersteigen.
- Verfahren nach Anspruch 12, wobei der Schwellenwert ein prozentualer Anteil eines summierten Spitzenverhältnisses oder eines summierten quadrierten Spitzenverltältnisses ist.
- Verfahren nach Anspruch 13, wobei der Schwellenwert 60 % des summierten Spitzenverhältnisses summierten quadrierten Spitzenverhältnisses ist.
- Verfahren nach einem der Ansprüche 11 bis 14, ferner umfassend das Wegnehmen der Frequenzpunkte eines umgewandelten Probensegments, das als nicht ein höchstes summiertes Verhältnis oder summiertes quadriertes Verhältnis aufweisend erachtet wurde, von den Frequenzpunkten eines umgewandelten Probensegments, das als ein höchstes summiertes Verhältnis oder summiertes quadriertes Verhältnis aufweisend erachtet wurde.
- Verfahren nach einem der Ansprüche 11 bis 15, wobei das eine oder die mehreren umgewandelten Probensegmente mit den höchsten summierten Verhältnissen oder summierten quadrierten Verhältnissen von der Frequenzdomäne in die Zeitdomäne umgewandelt werden.
- Verfahren nach einem der Ansprüche 11 bis 16, wobei eine Position von umgewandelten Probensegmenten in der Frequenzdomäne mit den höchsten summierten Verhältnissen oder summierten quadrierten Verhältnissen verwendet wird, um die entsprechenden Probensegmente in der Zeitdomäne zu identifizieren.
- Verfahren nach Anspruch 16 oder 17, wobei das Probensegment in der Zeitdomäne analysiert wird, um zu bestimmen, ob das Probensegment in der Zeitdomäne einen Teil des abnormalen Signals oder das gesamte abnormale Signal enthält.
- Verfahren nach Anspruch 18, wobei die Analyse die Wiedergabe des Signals an einen Menschen umfasst.
- Verfahren nach Anspruch 18, wobei die Analyse das Verwenden von Detektionshardware oder -software umfasst, um die Probensegmente in der Zeitdomäne mit einer Vielzahl von gespeicherten Signalen zu vergleichen.
- Computerlesbares Medium, das computerlesbare Instruktionen beinhaltet, die konfiguriert sind, um zu bewirken, dass ein Computer ein Verfahren nach einem vorstehenden Anspruch ausführt.
- Computervorrichtung zum Detektieren eines abnormalen Signals in einem zusammengesetzten abgetasteten Signal, umfassend:einen Speicher, der prozessorlesbare Instruktionen speichert; undeinen Prozessor zum Lesen und Ausführen von Instruktionen, die in dem Speicher gespeichert sind;wobei die prozessorlesbaren Instruktionen Instruktionen umfassen, die konfiguriert sind, um zu bewirken, dass der Prozessor das Verfahren nach einem vorstehenden Anspruch ausführt.
Applications Claiming Priority (2)
| Application Number | Priority Date | Filing Date | Title |
|---|---|---|---|
| GBGB0709044.2A GB0709044D0 (en) | 2007-05-11 | 2007-05-11 | Signal detection |
| PCT/GB2008/001249 WO2008139134A2 (en) | 2007-05-11 | 2008-04-10 | Detection of an abnormal signal in a compound sampled signal |
Publications (3)
| Publication Number | Publication Date |
|---|---|
| EP2156152A2 EP2156152A2 (de) | 2010-02-24 |
| EP2156152B1 true EP2156152B1 (de) | 2013-02-27 |
| EP2156152B8 EP2156152B8 (de) | 2013-04-03 |
Family
ID=38219210
Family Applications (1)
| Application Number | Title | Priority Date | Filing Date |
|---|---|---|---|
| EP08736920A Not-in-force EP2156152B8 (de) | 2007-05-11 | 2008-04-10 | Detektion eines abnormen signals in einem zusammengesetzten abgetasteten signal |
Country Status (4)
| Country | Link |
|---|---|
| US (2) | US8326557B2 (de) |
| EP (1) | EP2156152B8 (de) |
| GB (1) | GB0709044D0 (de) |
| WO (1) | WO2008139134A2 (de) |
Cited By (1)
| Publication number | Priority date | Publication date | Assignee | Title |
|---|---|---|---|---|
| RU2570108C1 (ru) * | 2014-07-08 | 2015-12-10 | Открытое акционерное общество "Автомобильный завод "УРАЛ" (ОАО "АЗ "УРАЛ") | Способ идентификации источников внутреннего шума транспортного средства |
Families Citing this family (3)
| Publication number | Priority date | Publication date | Assignee | Title |
|---|---|---|---|---|
| US10372118B2 (en) * | 2016-09-26 | 2019-08-06 | Rockwell Automation Technologies, Inc. | State-based hierarchy energy modeling |
| GB201708467D0 (en) * | 2017-05-26 | 2017-07-12 | Microface Ltd | Methods and systems for noise vibration harshness testing |
| CN113790911B (zh) * | 2021-08-18 | 2023-05-16 | 中国长江电力股份有限公司 | 一种基于声音频谱统计学规律的异响检测方法 |
Family Cites Families (9)
| Publication number | Priority date | Publication date | Assignee | Title |
|---|---|---|---|---|
| DE19849319A1 (de) * | 1998-10-26 | 2000-04-27 | Rohde & Schwarz | Verfahren zur Anzeige des Modulationsfehlers eines Multiträger-Signals |
| JP4681163B2 (ja) * | 2001-07-16 | 2011-05-11 | パナソニック株式会社 | ハウリング検出抑圧装置、これを備えた音響装置、及び、ハウリング検出抑圧方法 |
| FR2842014B1 (fr) * | 2002-07-08 | 2006-05-05 | Lyon Ecole Centrale | Procede et appareil pour affecter une classe sonore a un signal sonore |
| JP2004079316A (ja) | 2002-08-15 | 2004-03-11 | Nisshinbo Ind Inc | 急速充電電池用充電システム |
| JP2004279316A (ja) * | 2003-03-18 | 2004-10-07 | Ricoh Co Ltd | 製品評価方法、製品評価装置、製品評価プログラムおよび製品評価プログラムを記録したコンピュータ読取可能な記録媒体 |
| EP1462777A1 (de) * | 2003-03-26 | 2004-09-29 | Ford Global Technologies, Inc., A subsidiary of Ford Motor Company | Verfahren und Vorrichtung zur quantitativen Analyse von Motorgeräuschen |
| US7139668B2 (en) * | 2003-05-12 | 2006-11-21 | Simmonds Precision Products, Inc. | Wire event detection |
| US6873921B1 (en) * | 2003-09-29 | 2005-03-29 | Ut-Battelle, Llc | Detecting persons concealed in a vehicle |
| JP4741476B2 (ja) * | 2004-04-23 | 2011-08-03 | パナソニック株式会社 | 符号化装置 |
-
2007
- 2007-05-11 GB GBGB0709044.2A patent/GB0709044D0/en not_active Ceased
-
2008
- 2008-04-10 EP EP08736920A patent/EP2156152B8/de not_active Not-in-force
- 2008-04-10 WO PCT/GB2008/001249 patent/WO2008139134A2/en active Application Filing
-
2009
- 2009-11-10 US US12/615,643 patent/US8326557B2/en not_active Expired - Fee Related
-
2012
- 2012-12-04 US US13/693,849 patent/US9772368B2/en not_active Expired - Fee Related
Cited By (1)
| Publication number | Priority date | Publication date | Assignee | Title |
|---|---|---|---|---|
| RU2570108C1 (ru) * | 2014-07-08 | 2015-12-10 | Открытое акционерное общество "Автомобильный завод "УРАЛ" (ОАО "АЗ "УРАЛ") | Способ идентификации источников внутреннего шума транспортного средства |
Also Published As
| Publication number | Publication date |
|---|---|
| US20100106441A1 (en) | 2010-04-29 |
| US9772368B2 (en) | 2017-09-26 |
| US8326557B2 (en) | 2012-12-04 |
| WO2008139134A2 (en) | 2008-11-20 |
| WO2008139134A3 (en) | 2009-04-30 |
| US20130096855A1 (en) | 2013-04-18 |
| EP2156152A2 (de) | 2010-02-24 |
| GB0709044D0 (en) | 2007-06-20 |
| EP2156152B8 (de) | 2013-04-03 |
Similar Documents
| Publication | Publication Date | Title |
|---|---|---|
| US10607632B2 (en) | Abnormal sound detection apparatus and detection method | |
| US5036857A (en) | Noninvasive diagnostic system for coronary artery disease | |
| US5109863A (en) | Noninvasive diagnostic system for coronary artery disease | |
| JP3521654B2 (ja) | 脈拍計 | |
| EP2409638A1 (de) | Verfahren zur überwachung biologischer parameter, computerprogramm und vorrichtung zur überwachung biologischer parameter | |
| US8050910B2 (en) | Pitch extraction with inhibition of harmonics and sub-harmonics of the fundamental frequency | |
| US11116478B2 (en) | Diagnosis of pathologies using infrasonic signatures | |
| US20210345991A1 (en) | Diagnosis of pathologies using infrasonic signatures | |
| US6876964B1 (en) | Apparatus for detecting fatigue and doze by voice, and recording medium | |
| US9772368B2 (en) | Detection of an abnormal signal in a compound sampled signal | |
| CN104490417A (zh) | 数字听诊器与心音信号的处理方法 | |
| JPH10267742A (ja) | 音質評価装置および音質評価方法 | |
| Millette et al. | Signal processing of heart signals for the quantification of non-deterministic events | |
| JP6534566B2 (ja) | 心疾患診断装置、心疾患診断プログラム及び媒体 | |
| JPWO2019049667A1 (ja) | 心拍検出装置、心拍検出方法及びプログラム | |
| Paul et al. | Noise reduction for heart sounds using a modified minimum-mean squared error estimator with ECG gating | |
| JP2021071586A (ja) | 音抽出システム及び音抽出方法 | |
| CN112461552B (zh) | 电子助力制动系统的检测方法、系统及可读存储介质 | |
| JP2003057210A (ja) | 故障診断方法およびその装置 | |
| Zeng et al. | Using short-time fourier transform and wavelet packet transform to attenuate noise from heart sound signal for wearable e-healthcare device | |
| JP7122225B2 (ja) | 処理装置、システム、処理方法、およびプログラム | |
| Kopyto et al. | Audio-Based Onset Detection applied to Chewing Cycle Segmentation | |
| Al Naggar et al. | Design two-channel instrument to record lung and heart sounds at the same time, and separate them using ANC-NLMS algorithm | |
| JP3130369B2 (ja) | ヘリコプタ音の抽出・識別装置 | |
| JP2004029274A (ja) | 信号パターン評価装置、信号パターン評価方法及び信号パターン評価プログラム |
Legal Events
| Date | Code | Title | Description |
|---|---|---|---|
| PUAI | Public reference made under article 153(3) epc to a published international application that has entered the european phase |
Free format text: ORIGINAL CODE: 0009012 |
|
| 17P | Request for examination filed |
Effective date: 20091112 |
|
| AK | Designated contracting states |
Kind code of ref document: A2 Designated state(s): AT BE BG CH CY CZ DE DK EE ES FI FR GB GR HR HU IE IS IT LI LT LU LV MC MT NL NO PL PT RO SE SI SK TR |
|
| AX | Request for extension of the european patent |
Extension state: AL BA MK RS |
|
| DAX | Request for extension of the european patent (deleted) | ||
| GRAP | Despatch of communication of intention to grant a patent |
Free format text: ORIGINAL CODE: EPIDOSNIGR1 |
|
| GRAS | Grant fee paid |
Free format text: ORIGINAL CODE: EPIDOSNIGR3 |
|
| GRAA | (expected) grant |
Free format text: ORIGINAL CODE: 0009210 |
|
| AK | Designated contracting states |
Kind code of ref document: B1 Designated state(s): AT BE BG CH CY CZ DE DK EE ES FI FR GB GR HR HU IE IS IT LI LT LU LV MC MT NL NO PL PT RO SE SI SK TR |
|
| REG | Reference to a national code |
Ref country code: GB Ref legal event code: FG4D |
|
| REG | Reference to a national code |
Ref country code: CH Ref legal event code: EP |
|
| RAP2 | Party data changed (patent owner data changed or rights of a patent transferred) |
Owner name: SPX CORPORATION |
|
| REG | Reference to a national code |
Ref country code: AT Ref legal event code: REF Ref document number: 598740 Country of ref document: AT Kind code of ref document: T Effective date: 20130315 |
|
| RAP2 | Party data changed (patent owner data changed or rights of a patent transferred) |
Owner name: SERVICE SOLUTIONS U.S. LLC |
|
| REG | Reference to a national code |
Ref country code: IE Ref legal event code: FG4D |
|
| REG | Reference to a national code |
Ref country code: DE Ref legal event code: R096 Ref document number: 602008022500 Country of ref document: DE Effective date: 20130425 |
|
| REG | Reference to a national code |
Ref country code: SE Ref legal event code: TRGR |
|
| REG | Reference to a national code |
Ref country code: AT Ref legal event code: MK05 Ref document number: 598740 Country of ref document: AT Kind code of ref document: T Effective date: 20130227 |
|
| REG | Reference to a national code |
Ref country code: LT Ref legal event code: MG4D |
|
| PG25 | Lapsed in a contracting state [announced via postgrant information from national office to epo] |
Ref country code: LT Free format text: LAPSE BECAUSE OF FAILURE TO SUBMIT A TRANSLATION OF THE DESCRIPTION OR TO PAY THE FEE WITHIN THE PRESCRIBED TIME-LIMIT Effective date: 20130227 Ref country code: ES Free format text: LAPSE BECAUSE OF FAILURE TO SUBMIT A TRANSLATION OF THE DESCRIPTION OR TO PAY THE FEE WITHIN THE PRESCRIBED TIME-LIMIT Effective date: 20130607 Ref country code: AT Free format text: LAPSE BECAUSE OF FAILURE TO SUBMIT A TRANSLATION OF THE DESCRIPTION OR TO PAY THE FEE WITHIN THE PRESCRIBED TIME-LIMIT Effective date: 20130227 Ref country code: BG Free format text: LAPSE BECAUSE OF FAILURE TO SUBMIT A TRANSLATION OF THE DESCRIPTION OR TO PAY THE FEE WITHIN THE PRESCRIBED TIME-LIMIT Effective date: 20130527 Ref country code: NO Free format text: LAPSE BECAUSE OF FAILURE TO SUBMIT A TRANSLATION OF THE DESCRIPTION OR TO PAY THE FEE WITHIN THE PRESCRIBED TIME-LIMIT Effective date: 20130527 Ref country code: IS Free format text: LAPSE BECAUSE OF FAILURE TO SUBMIT A TRANSLATION OF THE DESCRIPTION OR TO PAY THE FEE WITHIN THE PRESCRIBED TIME-LIMIT Effective date: 20130627 |
|
| PGFP | Annual fee paid to national office [announced via postgrant information from national office to epo] |
Ref country code: GB Payment date: 20130528 Year of fee payment: 6 Ref country code: SE Payment date: 20130530 Year of fee payment: 6 |
|
| REG | Reference to a national code |
Ref country code: NL Ref legal event code: VDEP Effective date: 20130227 |
|
| PG25 | Lapsed in a contracting state [announced via postgrant information from national office to epo] |
Ref country code: GR Free format text: LAPSE BECAUSE OF FAILURE TO SUBMIT A TRANSLATION OF THE DESCRIPTION OR TO PAY THE FEE WITHIN THE PRESCRIBED TIME-LIMIT Effective date: 20130528 Ref country code: LV Free format text: LAPSE BECAUSE OF FAILURE TO SUBMIT A TRANSLATION OF THE DESCRIPTION OR TO PAY THE FEE WITHIN THE PRESCRIBED TIME-LIMIT Effective date: 20130227 Ref country code: BE Free format text: LAPSE BECAUSE OF FAILURE TO SUBMIT A TRANSLATION OF THE DESCRIPTION OR TO PAY THE FEE WITHIN THE PRESCRIBED TIME-LIMIT Effective date: 20130227 Ref country code: PT Free format text: LAPSE BECAUSE OF FAILURE TO SUBMIT A TRANSLATION OF THE DESCRIPTION OR TO PAY THE FEE WITHIN THE PRESCRIBED TIME-LIMIT Effective date: 20130627 Ref country code: FI Free format text: LAPSE BECAUSE OF FAILURE TO SUBMIT A TRANSLATION OF THE DESCRIPTION OR TO PAY THE FEE WITHIN THE PRESCRIBED TIME-LIMIT Effective date: 20130227 Ref country code: SI Free format text: LAPSE BECAUSE OF FAILURE TO SUBMIT A TRANSLATION OF THE DESCRIPTION OR TO PAY THE FEE WITHIN THE PRESCRIBED TIME-LIMIT Effective date: 20130227 Ref country code: PL Free format text: LAPSE BECAUSE OF FAILURE TO SUBMIT A TRANSLATION OF THE DESCRIPTION OR TO PAY THE FEE WITHIN THE PRESCRIBED TIME-LIMIT Effective date: 20130227 |
|
| PGFP | Annual fee paid to national office [announced via postgrant information from national office to epo] |
Ref country code: IT Payment date: 20130522 Year of fee payment: 6 Ref country code: FR Payment date: 20130606 Year of fee payment: 6 |
|
| PG25 | Lapsed in a contracting state [announced via postgrant information from national office to epo] |
Ref country code: HR Free format text: LAPSE BECAUSE OF FAILURE TO SUBMIT A TRANSLATION OF THE DESCRIPTION OR TO PAY THE FEE WITHIN THE PRESCRIBED TIME-LIMIT Effective date: 20130227 |
|
| PG25 | Lapsed in a contracting state [announced via postgrant information from national office to epo] |
Ref country code: RO Free format text: LAPSE BECAUSE OF FAILURE TO SUBMIT A TRANSLATION OF THE DESCRIPTION OR TO PAY THE FEE WITHIN THE PRESCRIBED TIME-LIMIT Effective date: 20130227 Ref country code: EE Free format text: LAPSE BECAUSE OF FAILURE TO SUBMIT A TRANSLATION OF THE DESCRIPTION OR TO PAY THE FEE WITHIN THE PRESCRIBED TIME-LIMIT Effective date: 20130227 Ref country code: SK Free format text: LAPSE BECAUSE OF FAILURE TO SUBMIT A TRANSLATION OF THE DESCRIPTION OR TO PAY THE FEE WITHIN THE PRESCRIBED TIME-LIMIT Effective date: 20130227 Ref country code: DK Free format text: LAPSE BECAUSE OF FAILURE TO SUBMIT A TRANSLATION OF THE DESCRIPTION OR TO PAY THE FEE WITHIN THE PRESCRIBED TIME-LIMIT Effective date: 20130227 Ref country code: NL Free format text: LAPSE BECAUSE OF FAILURE TO SUBMIT A TRANSLATION OF THE DESCRIPTION OR TO PAY THE FEE WITHIN THE PRESCRIBED TIME-LIMIT Effective date: 20130227 Ref country code: CZ Free format text: LAPSE BECAUSE OF FAILURE TO SUBMIT A TRANSLATION OF THE DESCRIPTION OR TO PAY THE FEE WITHIN THE PRESCRIBED TIME-LIMIT Effective date: 20130227 |
|
| PG25 | Lapsed in a contracting state [announced via postgrant information from national office to epo] |
Ref country code: CY Free format text: LAPSE BECAUSE OF FAILURE TO SUBMIT A TRANSLATION OF THE DESCRIPTION OR TO PAY THE FEE WITHIN THE PRESCRIBED TIME-LIMIT Effective date: 20130227 Ref country code: MC Free format text: LAPSE BECAUSE OF FAILURE TO SUBMIT A TRANSLATION OF THE DESCRIPTION OR TO PAY THE FEE WITHIN THE PRESCRIBED TIME-LIMIT Effective date: 20130227 |
|
| REG | Reference to a national code |
Ref country code: CH Ref legal event code: PL |
|
| PLBE | No opposition filed within time limit |
Free format text: ORIGINAL CODE: 0009261 |
|
| STAA | Information on the status of an ep patent application or granted ep patent |
Free format text: STATUS: NO OPPOSITION FILED WITHIN TIME LIMIT |
|
| REG | Reference to a national code |
Ref country code: IE Ref legal event code: MM4A |
|
| PG25 | Lapsed in a contracting state [announced via postgrant information from national office to epo] |
Ref country code: LI Free format text: LAPSE BECAUSE OF NON-PAYMENT OF DUE FEES Effective date: 20130430 Ref country code: CH Free format text: LAPSE BECAUSE OF NON-PAYMENT OF DUE FEES Effective date: 20130430 |
|
| 26N | No opposition filed |
Effective date: 20131128 |
|
| REG | Reference to a national code |
Ref country code: DE Ref legal event code: R097 Ref document number: 602008022500 Country of ref document: DE Effective date: 20131128 |
|
| PG25 | Lapsed in a contracting state [announced via postgrant information from national office to epo] |
Ref country code: IE Free format text: LAPSE BECAUSE OF NON-PAYMENT OF DUE FEES Effective date: 20130410 |
|
| REG | Reference to a national code |
Ref country code: SE Ref legal event code: EUG |
|
| GBPC | Gb: european patent ceased through non-payment of renewal fee |
Effective date: 20140410 |
|
| REG | Reference to a national code |
Ref country code: FR Ref legal event code: ST Effective date: 20141231 |
|
| PG25 | Lapsed in a contracting state [announced via postgrant information from national office to epo] |
Ref country code: GB Free format text: LAPSE BECAUSE OF NON-PAYMENT OF DUE FEES Effective date: 20140410 Ref country code: SE Free format text: LAPSE BECAUSE OF NON-PAYMENT OF DUE FEES Effective date: 20140411 |
|
| PG25 | Lapsed in a contracting state [announced via postgrant information from national office to epo] |
Ref country code: FR Free format text: LAPSE BECAUSE OF NON-PAYMENT OF DUE FEES Effective date: 20140430 Ref country code: MT Free format text: LAPSE BECAUSE OF FAILURE TO SUBMIT A TRANSLATION OF THE DESCRIPTION OR TO PAY THE FEE WITHIN THE PRESCRIBED TIME-LIMIT Effective date: 20130227 |
|
| PG25 | Lapsed in a contracting state [announced via postgrant information from national office to epo] |
Ref country code: IT Free format text: LAPSE BECAUSE OF NON-PAYMENT OF DUE FEES Effective date: 20140410 |
|
| PG25 | Lapsed in a contracting state [announced via postgrant information from national office to epo] |
Ref country code: TR Free format text: LAPSE BECAUSE OF FAILURE TO SUBMIT A TRANSLATION OF THE DESCRIPTION OR TO PAY THE FEE WITHIN THE PRESCRIBED TIME-LIMIT Effective date: 20130227 |
|
| PG25 | Lapsed in a contracting state [announced via postgrant information from national office to epo] |
Ref country code: HU Free format text: LAPSE BECAUSE OF FAILURE TO SUBMIT A TRANSLATION OF THE DESCRIPTION OR TO PAY THE FEE WITHIN THE PRESCRIBED TIME-LIMIT; INVALID AB INITIO Effective date: 20080410 Ref country code: LU Free format text: LAPSE BECAUSE OF NON-PAYMENT OF DUE FEES Effective date: 20130410 |
|
| PGFP | Annual fee paid to national office [announced via postgrant information from national office to epo] |
Ref country code: DE Payment date: 20190627 Year of fee payment: 12 |
|
| REG | Reference to a national code |
Ref country code: DE Ref legal event code: R119 Ref document number: 602008022500 Country of ref document: DE |
|
| PG25 | Lapsed in a contracting state [announced via postgrant information from national office to epo] |
Ref country code: DE Free format text: LAPSE BECAUSE OF NON-PAYMENT OF DUE FEES Effective date: 20201103 |