EP2002243B1 - Raman analysis - Google Patents
Raman analysis Download PDFInfo
- Publication number
- EP2002243B1 EP2002243B1 EP07732297.2A EP07732297A EP2002243B1 EP 2002243 B1 EP2002243 B1 EP 2002243B1 EP 07732297 A EP07732297 A EP 07732297A EP 2002243 B1 EP2002243 B1 EP 2002243B1
- Authority
- EP
- European Patent Office
- Prior art keywords
- tablet
- raman
- dosage formulation
- radiation
- formulation
- Prior art date
- Legal status (The legal status is an assumption and is not a legal conclusion. Google has not performed a legal analysis and makes no representation as to the accuracy of the status listed.)
- Revoked
Links
Images


Classifications
-
- G—PHYSICS
- G01—MEASURING; TESTING
- G01N—INVESTIGATING OR ANALYSING MATERIALS BY DETERMINING THEIR CHEMICAL OR PHYSICAL PROPERTIES
- G01N21/00—Investigating or analysing materials by the use of optical means, i.e. using sub-millimetre waves, infrared, visible or ultraviolet light
- G01N21/62—Systems in which the material investigated is excited whereby it emits light or causes a change in wavelength of the incident light
- G01N21/63—Systems in which the material investigated is excited whereby it emits light or causes a change in wavelength of the incident light optically excited
- G01N21/65—Raman scattering
-
- A—HUMAN NECESSITIES
- A61—MEDICAL OR VETERINARY SCIENCE; HYGIENE
- A61B—DIAGNOSIS; SURGERY; IDENTIFICATION
- A61B5/00—Measuring for diagnostic purposes; Identification of persons
- A61B5/41—Detecting, measuring or recording for evaluating the immune or lymphatic systems
- A61B5/414—Evaluating particular organs or parts of the immune or lymphatic systems
- A61B5/417—Evaluating particular organs or parts of the immune or lymphatic systems the bone marrow
-
- G—PHYSICS
- G01—MEASURING; TESTING
- G01N—INVESTIGATING OR ANALYSING MATERIALS BY DETERMINING THEIR CHEMICAL OR PHYSICAL PROPERTIES
- G01N33/00—Investigating or analysing materials by specific methods not covered by groups G01N1/00 - G01N31/00
- G01N33/22—Fuels; Explosives
-
- G—PHYSICS
- G07—CHECKING-DEVICES
- G07D—HANDLING OF COINS OR VALUABLE PAPERS, e.g. TESTING, SORTING BY DENOMINATIONS, COUNTING, DISPENSING, CHANGING OR DEPOSITING
- G07D7/00—Testing specially adapted to determine the identity or genuineness of valuable papers or for segregating those which are unacceptable, e.g. banknotes that are alien to a currency
- G07D7/06—Testing specially adapted to determine the identity or genuineness of valuable papers or for segregating those which are unacceptable, e.g. banknotes that are alien to a currency using wave or particle radiation
- G07D7/12—Visible light, infrared or ultraviolet radiation
- G07D7/1205—Testing spectral properties
-
- G—PHYSICS
- G01—MEASURING; TESTING
- G01N—INVESTIGATING OR ANALYSING MATERIALS BY DETERMINING THEIR CHEMICAL OR PHYSICAL PROPERTIES
- G01N21/00—Investigating or analysing materials by the use of optical means, i.e. using sub-millimetre waves, infrared, visible or ultraviolet light
- G01N21/62—Systems in which the material investigated is excited whereby it emits light or causes a change in wavelength of the incident light
- G01N21/63—Systems in which the material investigated is excited whereby it emits light or causes a change in wavelength of the incident light optically excited
- G01N21/65—Raman scattering
- G01N2021/653—Coherent methods [CARS]
- G01N2021/656—Raman microprobe
Definitions
- the present invention relates to a method for determining one or more properties of a tablet pharmaceutical dosage formulation.
- US 6,919,556 discusses the need for manufacturers of pharmaceutical products to monitor properties of tablets and other dosage formulations as they are produced. Traditionally, this has been achieved by taking samples from a batch of products to a laboratory for post-production testing. US 6,919,556 discusses using Raman spectral analysis of pharmaceutical tablets on the production line itself. A laser beam is directed to a Raman probe in front of which a tablet is positioned. A small proportion of the illumination photons are inelastically Raman scattered in the surface region of the illuminated tablet. Backscattered Raman photons are collected by the probe and are directed to a spectrograph for analysis.
- WO97/22872 a continually changing surface region of a tablet is exposed to an incident laser beam through a conical aperture through which scattered Raman photons are also detected.
- the surface region is continually changed by rotating the tablet behind the apex of the conical aperture and varying the distance from the centre of rotation to the conical apex.
- the Raman signal is still heavily biased towards the illuminated surface of the tablet.
- US 2004/0263843 discloses a Raman spectroscopy system including an optical probe assembly including a photonic crystal fiber light guide, and a sample vial having single crystalline walls.
- WO 97/22872 describes Raman analysis of a pharmaceutical tablet using a backscattering geometry.
- WO 01/57500 relates to a sample presentation apparatus for use in analysing equipment for pharmaceutical products, for example solid dosage forms such as a tablet, a pellet, or a capsule.
- Kontoyannis and Orkoula, Talanta, Vol. 41, no. 11, 1994, pages 1981-1984 discusses quantitative non-destructive determination of salicylic acid acetate in aspirin tablets by Raman spectroscopy.
- the invention seeks to address these objects and the problems of the related prior art.
- a method of probing a sample in particular the bulk or interior, or an interior portion of a sample, and especially of a diffusely scattering or turbid sample, by directing incident radiation at a first surface, surface region, area or portion of the sample, collecting forward scattered radiation from a second surface, surface region, area or portion of the sample, and detecting Raman radiation, arising from Raman scattering of said incident radiation within said sample, in the collected radiation.
- This may be applied to the mass production of a plurality of similar discrete objects, by carrying out these steps on each object and, for each object, analysing the detected Raman radiation to determine one or more characteristics of each object.
- the forward scattered Raman radiation contains information from the full scattering depth between the first and second surface regions.
- use of a backscattering geometry only provides information from a shallow depth beneath the illuminated surface.
- the method may particularly be applied to diffusely scattering solid samples.
- the invention provides a method of determining one or more properties of a tablet pharmaceutical dosage formulation, as set out in claim 1.
- the analyzed Raman signal is less representative of the surface of the dosage formulation and more representative of the whole contents of the formulation, and therefore more representative of the material to which a subject given the formulation will be exposed, for example after digestion.
- a region of impurity away from the illuminated surface may be detected. Properties which may be detected in this way include the presence of different polymorphs, hydrated forms, solvates, and salt forms, in particular of active pharmaceutical substances. Other properties include the presence of remnant chemical reagents and other impurities.
- Analysis may be based on proximity of a measured Raman signal to an ideal or predefined template, on analytical decomposition of detected Raman spectra using known spectra of likely impurities, or by analysing features such as spectral shifts and widths of spectral lines and peaks.
- the pharmaceutical dosage formulation may be a coated tablet.
- the method may also be used to analyze a tablet dosage formulation contained within an envelope or package, such as a tablet in a blister pack.
- Methods of the invention may be used to test a plurality of pharmaceutical dosage formulations, for example on a mass production line or in a test facility, by applying the method to each of the dosage formulations.
- the method may also include collecting backscattered radiation, detecting Raman radiation in said backscattered radiation, and using the results of the detection in determining one or more properties of the formulation.
- the dosage formulation will be held or supported in a carrier.
- This carrier may have one or more inner surfaces facing said dosage formulation, and at least part of these surfaces may be mirrored so that radiation is reflected back into the formulation to increase the amount of detected Raman radiation and improve the sensitivity of the method.
- a suitably mirrored enclosure will have the effect of improving the degree to which the detected Raman radiation reflects properties of the whole formulation.
- the carrier may comprise a first aperture through which the first surface of said dosage formulation is exposed to said incident radiation, and a second aperture through which Raman radiation is received from the second surface of said dosage formulation.
- the incident radiation is generated using one or more lasers.
- Spectral information such as line strengths, widths, or full spectra, obtained from the detected Raman light, may be used in a variety of ways for further analysis, such as by comparison with template or "ideal" spectral information, by decomposition into two or more known or expected spectral data groups or spectra, or by measuring line shifts in frequency or width.
- Apparatus for putting methods of the invention into effect are also described, for example apparatus for analysing a pharmaceutical dosage formulation, comprising a carrier for retaining a dosage formulation, illumination optics arranged to direct incident radiation to a first surface region of a said formulation, and reception optics arranged to receive and detect transmitted Raman radiation from a second surface region of said formulation, the second region surface being spaced from said first surface region.
- the illumination optics may be as simple as a laser source abutted against or directed at the first surface region, or more sophisticated arrangements could be used.
- the reception optics will comprise collection optics, and a spectrometer, filters or other spectral selection apparatus arranged to detect or isolate one or more elements, wavelengths or other aspects of said Raman radiation.
- a Fourier Transform spectroscopy arrangement could be used, or one or more suitable spectral filters with one or more suitable photo detectors.
- the apparatus will also comprise an analyser implemented as a computer, dedicated electronics, or some mix of the two, and arranged to derive one or more properties of the dosage formulation from said detected Raman radiation.
- the apparatus will also comprise a laser source for generating the incident, or probe radiation.
- a pharmaceutical dosage formulation in the form of a tablet 10, which is held in a carrier 12 such that at least part of each of the upper 11 and lower 13 surfaces of the tablet are exposed.
- the carrier may be provided, for example, as part of a production line or a post-production testing facility.
- Light generated by a laser 14 is directed to illumination optics 16 above the carrier which cause the upper surface of the tablet to be exposed to the laser light.
- Receiving optics 18 are disposed below the carrier arranged to receive light scattering out of the lower surface of the tablet. This light is directed to a spectrographic detector 20, and results from the spectrographic detector 20 are passed to a computer implemented analyser 22.
- Suitable wavelengths for the incident laser light are around the near infrared part of the spectrum, for example at 827 nm with a laser power of about 88 mW as used in the example discussed below in the "Experimental Example” section, where further details of suitable optical arrangements for the illumination, receiving and detection optics can be found. However, any other suitable wavelengths may be used.
- Raman photons having particular wavelengths depends on the chemical structure of the tablet, so that chemical properties of the tablet such as polymorph types, degrees of hydration and the presence of impurities and undesired salt and solvate forms can be deduced by analysing the scattered Raman photons.
- the computer analyser 22 uses the spectral results from the detector 20 in this way to deduce one or more properties of the tablet. These properties could be used, for example, to reject a tablet because of excessive levels of a particular polymorph or impurity.
- the spectrographic detector could take a variety of known forms such as a conventional spectrograph, a Fourier Transform spectrograph, or one or more filters in conjunction with one or more photo detectors.
- FIG 2 an alternative construction of the carrier is illustrated.
- surfaces of the carrier abutting the tablet 10 are mirrored either in full or in part so as to reflect photons, which might have otherwise been absorbed at the carrier, back into the tablet.
- the density of photons within the tablet is thereby increased, and so is the intensity of Raman photons collected by receiving optics 18.
- the degree to which the carrier encloses the tablet may vary, for example providing only small apertures for illumination of the tablet and to receive forward scattered Raman photons.
- the carrier 30 of figure 2 is divided into upper 32 and lower 34 portions, and the tablet is accepted between the portions, but other geometries could be used. This mirroring may be used in other embodiments of the invention.
- Figure 3 illustrates an arrangement in which the illumination optics 40 also comprises receiving optics to collect backscattered Raman photons. These are passed to a separate spectrographic detector 42, or alternatively to the detector 20 used to detect forward scattered photons, for detection and subsequent analysis. In this way, forward scattered and back scattered photons may be detected and analysed at the same time, or at different times, and these various alternatives may be used in other embodiments of the invention.
- the tablet is of generally rectangular cross section, perhaps 10mm across and 4mm deep, and circular when viewed from above.
- the tablet is spherical and therefore contained in a suitably adapted carrier 50.
- the example of figure 4 also illustrates that to derive bulk properties of the tablet using a transmission geometry it is not necessary to place the illumination and receiving optics in confrontation, directly across a tablet, although this may frequently be a preferred configuration for evenly distributed sampling of the tablet bulk.
- the illumination optics face downwards and the receiving optics collect light emerging from an aperture in the side rather than the bottom of the carrier, transverse to the direction of illumination.
- the surface of the tablet illuminated by the illumination optics should at least be separated or spaced from the surface from which scattered light is received by the receiving optics.
- the general method described herein may be used to determine characteristics of a turbid medium such as a tablet or other dosage formulation when within an envelope such as packaging, for example a tablet already packaged for distribution and sale in a blister pack.
- a turbid medium such as a tablet or other dosage formulation
- an envelope such as packaging
- a tablet already packaged for distribution and sale in a blister pack This is illustrated in the example of figure 5 in which a tablet 10 within blister pack 55 is probed using illumination and receiving optics 16, 18 disposed laterally across the width of a tablet.
- This arrangement is useful in the conventional case of the upper membrane 57 of the blister pack being or comprising a metal or metalised foil, or other layer transmitting insufficient of the illumination photons. Comparing this arrangement with that of figure 1 , the blister pack 55 is acting as carrier 12.
- the lower blister pack membrane 57 is preferably translucent or transparent, for example being partly or wholly formed of a translucent white plastic, to enable light to pass sufficiently for the technique to work. If both the upper and lower membranes 56, 57 allowed sufficient light to pass, an arrangement of optics more like that of figure 1 could be used.
- the described techniques may be used to analyse not just tablets non-invasively, but also other forms of dosage formulations such as capsules, by suitable configuration of the carrier, illumination and receiving optics.
- the described method enables the suppression of interfering surface Raman and fluorescence signals, observed with conventional Raman backscattering approaches, originating from the capsule shell, and revealing of the Raman spectra of active pharmaceutical ingredients contained within the capsule.
- the same principals also apply to other turbid, scattering media, and may also be readily applied in other fields such as probing of living tissue in depth, non-invasively. For example, in-depth probing of bone, cartilage, bone marrow, brain, nerves, lipids, blood through skin and teeth may be probed.
- Such analysis of living tissue may, for example, be used to detect physiological conditions such as disease.
- Other examples include the characterization of jewellery, such as jades and pearls, or corn and other kernels and seeds for their oil or oleic acid concentrations in quality control and high throughput screening.
- a Monte Carlo model was used to simulate the transport of illumination and Raman photons scattering within a turbid medium such as the pharmaceutical tablet 10 of figure 1 to 4 .
- the model was used to calculate the relative intensities of backscattered and forward scattered Raman photons as a function of their depth within the turbid medium. Briefly, both the elastically (illumination) and non-elastically (Raman) scattered photons were individually followed as they propagated through the medium in random walk-like fashion in three-dimensional space. A simplified assumption was made that in each step a photon propagated in a straight line over a distance t and thereafter its direction was fully randomised at the next scattering event.
- the propagation distance, t over which the photon direction is randomised, can be crudely approximated as the transport length of the scattering medium ( lt ) ( Brenan C. and Hunter I., Journal of Raman Spectroscopy 27, p561, 1996 ) which is defined in a similar manner as the average distance photons must travel within the sample before deviating significantly from their original direction of propagation.
- the modelled sample 60 is illustrated in figure 6 .
- the sample was modelled as a uniform turbid medium apart from an intermediate-layer 66 having a different Raman signature to represent a heterogenous impurity, the intermediate layer having a thickness d2 with a top surface located at depth d1 .
- the bulk sample medium was located at depths z1 such that d1>z1>0 and d3>z1>(d1+d2) , and the intermediate layer of a different Raman signature at depths z2 such that d1+d2 ⁇ z2 ⁇ d1.
- the parameters d2 and d3 were fixed at 0.5 mm and 4 mm respectively, and d1 was varied from 0 to 3.5 mm to represent different depths of the interlayer 66 within the bulk of the sample 60.
- the model assumed that all the illumination photons were first placed at a depth equal to the transport length lt and symmetrically distributed around the origin of the co-ordinate system x,y.
- the beam radius of the incident light r was 3 mm and the beam was given a uniform 'top-hat' intensity profile with all the photons having equal probability of being injected into the sample at any point within its cross-section.
- the Raman light was collected firstly at the top sample surface 62 from the illumination area of the incident light, and separately on the opposite side of the sample 64 symmetrically around the projection axis of the top collection/laser illumination area.
- the laser beam photons were propagated through the medium by translating each individual photon in a random direction by a step t. At each step there was a given probability that the photon would be converted to a Raman photon. The absorption of photons was assumed to be insignificant in this simulation.
- This parameter is expressed as optical density for the conversion of laser beam photons to Raman light. That is, for example, an optical density (OD) of 1 or 2 per 1 mm corresponds to the 10-fold or 100-fold decrease of the number of illumination photons through conversion to Raman photons, respectively, passing through an overall propagation distance of 1 mm.
- the optical density accounting for the conversion of illumination photons into Raman photons was set to 0.01 per mm-.
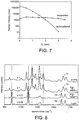
- the number of Raman photons originating in the intermediate layer 66 and collected as backscattered photons at the upper surface 62, and transmitted photons at the lower surface 64, are shown in figure 7 .
- the transmission geometry clearly provides a more representative sampling of the bulk of the sample interior than the conventional backscattering geometry, while permitting a satisfactory sensitivity.
- the model also reveals that an increase in sample thickness from 1 mm to 4 mm results in a 58% increase of the Raman signal detected in the backscattering geometry. In simplistic terms, this could be wrongly interpreted as extra Raman photons (amounting to 37 % of the overall Raman signal observed for 4 mm tablet) being produced in the extra 3 mm thickness added to the top 1 mm sample layer. However, the model of a 4 mm-thick sample indicates that 88 % of Raman signal originates in the top 1 mm layer and only 12 % originates within the remaining 3 mm of sample thickness.
- the extra 3 mm of material not only contributes with extra production of Raman photons but also reduces the loss of Raman photons originated within the 1 mm-layer at the lower surface 64.
- the increase in backscattered Raman photons through the addition of a further 3 mm of sample is also accomplished by returning Raman photons originating near the upper surface back towards the upper surface from where they may emerge and be collected.
- some illumination photons are scattered back towards the upper surface 62 allowing them to originate still more Raman photons within the top 1 mm layer.
- a two-layer sample was composed of a paracetamol tablet (500 mg, thickness 3.9 mm, circular diameter 12.8 mm, Tesco, PL Holder: The Wallis Laboratory Ltd. FOP234 MH/DRUGS/357) placed against a 2 mm thick fused silica cuvette with 300 ⁇ m windows filled with trans-stilbene ground powder. The cell width and length were 10 mm and 40 mm. Some measurements were taken with an illumination laser beam directed at the tablet, and some at the cuvette, in each case taking measurements of both backscattered and forward scattered (transmitted) Raman photons.
- the illumination laser beam was generated using an attenuated 115 mW temperature stabilised diode laser operated at 827 nm (Micro Laser Systems, Inc, L4 830S-115-TE).
- the laser power at the sample was 88 mW and the laser spot diameter was about 4 mm.
- the beam was spectrally purified by removing any residual amplified spontaneous emission components from its spectrum using two 830 nm band pass filters (Semrock). These were slightly tilted to optimise their throughput for the 827 nm laser wavelength.
- the beam was incident on the sample at about 45 degrees.
- the beam was polarised horizontally at the surface.
- the incident spot on the sample surface was therefore elliptical with the shorter radius being 2 mm and the longer 2.8 mm.
- Raman light was collected using a 50 mm diameter lens with a focal length of 60 mm.
- the scattered light was collimated and passed through a 50 mm diameter holographic notch filter (830 nm, Kaiser Optical Systems, Inc) to suppress the elastically scattered component of light.
- the filter was also slightly tilted to optimise suppression for the 827 nm elastic scatter.
- a second lens, identical to the first, was then used to image, with a magnification of 1:1, the sample surface onto the front face of an optical fibre probe.
- the laser illumination spot was imaged in such a way so that it coincided with the centre of the probe axis.
- the fibre probe was comprised of 7 fibres placed tightly packed at the centre of the probe.
- the fibres were made of silica with a core diameter of 200 ⁇ m, cladding diameter of 230 ⁇ m and numerical aperture of 0.37. Sleeves were stripped on both ends for tighter packing of the fibres.
- the bundle was custom made by C Technologies Inc.
- Raman spectra were collected using a deep depletion liquid nitrogen cooled CCD camera (Princeton Instruments, SPEC10 400BR LN Back-Illuminated Deep Depletion CCD, 1340 x 400 pixels) by binning the signal from all the 7 fibres vertically. The Raman spectra were not corrected for the variation of detection system sensitivity across the detected spectral range.
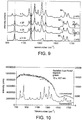
- FIG. 8 shows spectra obtained from a conventional backscattering geometry applied to the two layered sample with the paracetamol illuminated (curve 70) and the cuvette illuminated (curve 72). Backscatter results for the paracetamol only (curve 74) and the cuvette only (curve 76) are also shown for reference.
- Figure 9 shows spectra obtained using the transmission geometry with the paracetamol illuminated (curve 80) and the cuvette illuminated (curve 82), with transmission results for the paracetamol only (curve 84) and the cuvette only (curve 86) are also shown for reference.
- Figure 9 demonstrates how, in an environment where tablets are being tested, an anomalous layer will be detected irrespective of its position relative to the illuminating radiation. If the paracetamol tablet used in this experiment had a thick layer of an impurity at the back, a conventional backscattering approach would not be able to detect its presence. The transmission geometry approach would detect the impurity layer irrespective of its depth within the sample.
- the backscatter and transmission measurements using the paracetamol tablet without the cuvette show that the diminishment of the overall Raman intensity when going from the conventional backscattering to the transmission geometry was only by a factor of 12, thereby still allowing short exposure times to be used with reasonable sensitivity.
- a good Raman signal was observed in the transmission geometry even through a stack of two paracetamol tablets (7.8 mm thick) and it was still detectable through a stack of three paracetamol tablets (11.7 mm thick), with the signal diminishing by a factor of 16 and 400 respectively, compared with only one tablet monitored in the transmission geometry.
- the large illumination areas applicable in transmission geometry with pharmaceutical tablets and other dosage formulations also make it possible to use substantially higher laser powers without damaging the sample. This can be used to achieve further reductions in exposure times if required, in particular if combined with large area receiving optics.
- the same experimental arrangement was used to obtain a conventional backscatter Raman spectrum, and a transmission Raman spectrum, for a variety of different pharmaceutical capsules, having a variety of different coloured shell sections.
- the coloured capsule shells induced a large degree of fluorescence which had a deleterious effect on the signal to noise ratio of the measured Raman spectra.
- the upper curve is a spectrum obtained using the conventional backscatter geometry, with any Raman spectral features of the pharmaceutical ingredients completely obscured by a fluorescence signal.
- the lower curve is a spectrum obtained using the described forward scattering geometry and although weaker than the backscatter signal, the useful Raman spectral peaks are very clearly visible.
- the described technique may also be applied to diagnostic test technologies. Many clinical and other diagnostic tests are today carried out by an assay carried on a membrane. A sample which may contain a particular analyte is applied to the membrane, or to a pad coupled to the membrane, carrying one or more diagnostic reagants. Frequently, the results of a diagnostic test are detected optically, for example by means of a colour change, the visibility of a coloured band against a white membrane, or similar. Particular types of such diagnostic test arrangements include lateral flow, flow through, solid phase and agglutination formats.
- a typical lateral flow test arrangement is shown in figure 11 .
- a liquid sample containing the analyte to be detected is applied to a membrane 100 at entry point 102 and passes, by capillary action, along the membrane through a filter 104.
- the membrane is typically made of a translucent, light scattering material such as nitrocellulose, supported on a transparent or translucent substrate 105 which could, for example, be of glass, paper, or a plastic.
- the sample liquid is brought into contact with a signal reagant 106, with which relevant reactions occur as the liquid assay flows along the strip.
- the complex of the analyte and the signal reagant is captured and detected optically, for example using the illumination optics 110 and collection optics 112 illustrated, or as discussed elsewhere in this document .
- the signal reagant could be a biotag such as a Nanoplex (RTM) biotag provided by Oxonica Inc. A wide variety of alternatives and modifications to the illustrated arrangement are known.
- the described technique may be used in the optical detection stage of a lateral flow test such as that illustrated in figure 11 , or of other membrane based diagnostic tests.
- probe light is directed to a first surface of the membrane at the detection region 108.
- the probe light scatters within the membrane and scattered light is collected at the opposite, second surface, in a transmission geometry.
- Some of the scattering is Raman scattering from one or more optically active reagants, tags or markers which express optically the presence of the analyte by expression of particular Raman spectral features. Therefore, one or more Raman spectral features of the collected light can be used to determine or quantify presence of the analyte, or other characteristics of the material held within or upon the membrane at the detection region.
- Raman spectroscopy techniques may be used to enhance detection of the expressed Raman spectral features, including resonance Raman, Surface Enhanced Raman spectroscopy, and Surface Enhanced Resonance Raman spectroscopy.
Landscapes
- Health & Medical Sciences (AREA)
- Life Sciences & Earth Sciences (AREA)
- General Health & Medical Sciences (AREA)
- Physics & Mathematics (AREA)
- General Physics & Mathematics (AREA)
- Immunology (AREA)
- Pathology (AREA)
- Chemical & Material Sciences (AREA)
- Analytical Chemistry (AREA)
- Biochemistry (AREA)
- Toxicology (AREA)
- Engineering & Computer Science (AREA)
- Nuclear Medicine, Radiotherapy & Molecular Imaging (AREA)
- Hematology (AREA)
- Animal Behavior & Ethology (AREA)
- Vascular Medicine (AREA)
- Biophysics (AREA)
- Biomedical Technology (AREA)
- Heart & Thoracic Surgery (AREA)
- Medical Informatics (AREA)
- Molecular Biology (AREA)
- Surgery (AREA)
- Spectroscopy & Molecular Physics (AREA)
- Public Health (AREA)
- Veterinary Medicine (AREA)
- Medicinal Chemistry (AREA)
- Food Science & Technology (AREA)
- Investigating, Analyzing Materials By Fluorescence Or Luminescence (AREA)
- Optical Measuring Cells (AREA)
- Credit Cards Or The Like (AREA)
- Apparatus For Radiation Diagnosis (AREA)
Description
- The present invention relates to a method for determining one or more properties of a tablet pharmaceutical dosage formulation.
-
US 6,919,556 discusses the need for manufacturers of pharmaceutical products to monitor properties of tablets and other dosage formulations as they are produced. Traditionally, this has been achieved by taking samples from a batch of products to a laboratory for post-production testing.US 6,919,556 discusses using Raman spectral analysis of pharmaceutical tablets on the production line itself. A laser beam is directed to a Raman probe in front of which a tablet is positioned. A small proportion of the illumination photons are inelastically Raman scattered in the surface region of the illuminated tablet. Backscattered Raman photons are collected by the probe and are directed to a spectrograph for analysis. - Another Raman probe which could be used to analyse pharmaceutical tablets is discussed in
US6897951 . - The techniques used in this prior art yield an analysis of only a very limited portion of a tablet, because the backscattered Raman radiation originates from a small region around the point of incidence of the laser beam. Even if a wide area probe, such as that described in
WO2005/060622 is used, and almost all of the Raman radiation originates from a thin surface layer of the tablet. Therefore, characteristics of material in the interior or at other surfaces of the tablet are undetected. - In
WO97/22872 - The use of Raman spectroscopy to evaluate solid-state forms present in tablets is discussed in Taylor, L and F Langkilde, Journal of Pharmaceutical Sciences, Vol 89, No. 10, October 2000. Properties of interest include salt formation, solvate formation, polymorphism, and degree of crystallinity.
-
US 2004/0263843 discloses a Raman spectroscopy system including an optical probe assembly including a photonic crystal fiber light guide, and a sample vial having single crystalline walls.WO 97/22872 WO 01/57500 - It would be desirable to provide methods for analysis of tablet pharmaceutical dosage formulations, in which the Raman radiation detected and analysed to carry out the analysis represents more than just a surface region.
- It would also be desirable to be able to apply such methods to manufacture and testing of pharmaceutical dosage formulations.
- The invention seeks to address these objects and the problems of the related prior art.
- We describe a method of probing a sample, in particular the bulk or interior, or an interior portion of a sample, and especially of a diffusely scattering or turbid sample, by directing incident radiation at a first surface, surface region, area or portion of the sample, collecting forward scattered radiation from a second surface, surface region, area or portion of the sample, and detecting Raman radiation, arising from Raman scattering of said incident radiation within said sample, in the collected radiation. This may be applied to the mass production of a plurality of similar discrete objects, by carrying out these steps on each object and, for each object, analysing the detected Raman radiation to determine one or more characteristics of each object. Advantageously, the forward scattered Raman radiation contains information from the full scattering depth between the first and second surface regions. In contrast, use of a backscattering geometry only provides information from a shallow depth beneath the illuminated surface. The method may particularly be applied to diffusely scattering solid samples.
- In particular, the invention provides a method of determining one or more properties of a tablet pharmaceutical dosage formulation, as set out in
claim 1. - Using this method, the analyzed Raman signal is less representative of the surface of the dosage formulation and more representative of the whole contents of the formulation, and therefore more representative of the material to which a subject given the formulation will be exposed, for example after digestion. In particular, a region of impurity away from the illuminated surface may be detected. Properties which may be detected in this way include the presence of different polymorphs, hydrated forms, solvates, and salt forms, in particular of active pharmaceutical substances. Other properties include the presence of remnant chemical reagents and other impurities.
- Analysis may be based on proximity of a measured Raman signal to an ideal or predefined template, on analytical decomposition of detected Raman spectra using known spectra of likely impurities, or by analysing features such as spectral shifts and widths of spectral lines and peaks.
- The pharmaceutical dosage formulation may be a coated tablet.
- The method may also be used to analyze a tablet dosage formulation contained within an envelope or package, such as a tablet in a blister pack.
- Methods of the invention may be used to test a plurality of pharmaceutical dosage formulations, for example on a mass production line or in a test facility, by applying the method to each of the dosage formulations.
- When the Raman radiation is collected from said second surface, it has been scattered through the dosage formulation from the first surface, so that the first and second surfaces mutually define a transmission, or forward scattering geometry.
- In addition to detecting and analysing forward scattered Raman radiation, the method may also include collecting backscattered radiation, detecting Raman radiation in said backscattered radiation, and using the results of the detection in determining one or more properties of the formulation.
- Typically, the dosage formulation will be held or supported in a carrier. This carrier may have one or more inner surfaces facing said dosage formulation, and at least part of these surfaces may be mirrored so that radiation is reflected back into the formulation to increase the amount of detected Raman radiation and improve the sensitivity of the method. In particular, a suitably mirrored enclosure will have the effect of improving the degree to which the detected Raman radiation reflects properties of the whole formulation.
- The carrier may comprise a first aperture through which the first surface of said dosage formulation is exposed to said incident radiation, and a second aperture through which Raman radiation is received from the second surface of said dosage formulation.
- Typically, the incident radiation is generated using one or more lasers.
- Spectral information, such as line strengths, widths, or full spectra, obtained from the detected Raman light, may be used in a variety of ways for further analysis, such as by comparison with template or "ideal" spectral information, by decomposition into two or more known or expected spectral data groups or spectra, or by measuring line shifts in frequency or width.
- Apparatus for putting methods of the invention into effect are also described, for example apparatus for analysing a pharmaceutical dosage formulation, comprising a carrier for retaining a dosage formulation, illumination optics arranged to direct incident radiation to a first surface region of a said formulation, and reception optics arranged to receive and detect transmitted Raman radiation from a second surface region of said formulation, the second region surface being spaced from said first surface region.
- The illumination optics may be as simple as a laser source abutted against or directed at the first surface region, or more sophisticated arrangements could be used. Typically, the reception optics will comprise collection optics, and a spectrometer, filters or other spectral selection apparatus arranged to detect or isolate one or more elements, wavelengths or other aspects of said Raman radiation. For example, a Fourier Transform spectroscopy arrangement could be used, or one or more suitable spectral filters with one or more suitable photo detectors.
- Typically, the apparatus will also comprise an analyser implemented as a computer, dedicated electronics, or some mix of the two, and arranged to derive one or more properties of the dosage formulation from said detected Raman radiation. Typically, the apparatus will also comprise a laser source for generating the incident, or probe radiation.
- Embodiments of the invention will now be described, by way of example only, with reference to the accompanying drawings of which:
-
Figure 1 schematically illustrates the analysis of a tablet by transmission Raman spectroscopy; -
Figure 2 illustrates an alternative carrier for the tablet offigure 1 , with mirrored internal surfaces; -
Figure 3 shows the arrangement offigure 1 with further analysis of the tablet using backscattered Raman radiation; -
Figure 4 illustrates a spherical tablet held in an alternative carrier with transmitted Raman radiation emerging for detection at a surface orthogonal to the surface of illumination; this example falls outside the scope of the present invention; -
Figure 5 schematically illustrates the analysis of a tablet within packaging such as a blister this example falls outside the scope of the present invention; -
Figure 6 shows the geometry of a turbid sample for use in a Monte Carlo scattering simulation, the sample including an intermediate layer; -
Figure 7 shows graphs of transmitted and backscattered Raman radiation originating in the intermediate layer shown infigure 6 , dependent upon the depth of the layer d1; -
Figure 8 shows spectra of Raman radiation backscattered from a layered sample comprising a paracetamol tablet and a cuvette containing trans-stilbene powder, with paracetamol (p) only and trans-stilbene (t) only reference spectra; -
Figure 9 shows spectra of Raman radiation forward scattered through the layered sample used forfigure 8 , with the corresponding reference spectra; -
Figure 10 shows backscatter ("conventional") and transmission Raman spectra of radiation scattered in a Sudafed Dual Relief capsule; and -
Figure 11 illustrates use of the described technique in the optical interrogation of a diagnostic test such as a lateral flow test strip. - Referring now to
figure 1 there is shown a pharmaceutical dosage formulation in the form of atablet 10, which is held in acarrier 12 such that at least part of each of the upper 11 and lower 13 surfaces of the tablet are exposed. The carrier may be provided, for example, as part of a production line or a post-production testing facility. Light generated by alaser 14 is directed toillumination optics 16 above the carrier which cause the upper surface of the tablet to be exposed to the laser light. Receivingoptics 18 are disposed below the carrier arranged to receive light scattering out of the lower surface of the tablet. This light is directed to aspectrographic detector 20, and results from thespectrographic detector 20 are passed to a computer implementedanalyser 22. - Suitable wavelengths for the incident laser light are around the near infrared part of the spectrum, for example at 827 nm with a laser power of about 88 mW as used in the example discussed below in the "Experimental Example" section, where further details of suitable optical arrangements for the illumination, receiving and detection optics can be found. However, any other suitable wavelengths may be used.
- Some of the photons of the incident laser light undergo Raman scattering in the tablet. The production of Raman photons having particular wavelengths depends on the chemical structure of the tablet, so that chemical properties of the tablet such as polymorph types, degrees of hydration and the presence of impurities and undesired salt and solvate forms can be deduced by analysing the scattered Raman photons. The
computer analyser 22 uses the spectral results from thedetector 20 in this way to deduce one or more properties of the tablet. These properties could be used, for example, to reject a tablet because of excessive levels of a particular polymorph or impurity. - A number of different properties which can be determined using the invention are discussed in the related prior art, such as Taylor, L and F Langkilde, Journal of Pharmaceutical Sciences, Vol. 89, No. 10, October 2000, pp 1342 - 1353, and in references cited therein.
- Most of the Raman photons backscatter towards the illumination optics. Almost all of the backscattered Raman photons have been produced close to the illuminated upper surface of the tablet, so only allow properties of that surface region to be deduced. Raman photons also scatter forwards and emerge from the lower surface of the tablet. Although the number of forward scattered Raman photons is small compared with the number of backscattered photons, these forward scattered photons originate from a relatively even range of depths throughout the tablet, so allow bulk properties of the tablet as a whole to be deduced. The spectrographic detector could take a variety of known forms such as a conventional spectrograph, a Fourier Transform spectrograph, or one or more filters in conjunction with one or more photo detectors.
- In
figure 2 an alternative construction of the carrier is illustrated. In this example, surfaces of the carrier abutting thetablet 10 are mirrored either in full or in part so as to reflect photons, which might have otherwise been absorbed at the carrier, back into the tablet. The density of photons within the tablet is thereby increased, and so is the intensity of Raman photons collected by receivingoptics 18. The degree to which the carrier encloses the tablet may vary, for example providing only small apertures for illumination of the tablet and to receive forward scattered Raman photons. Thecarrier 30 offigure 2 is divided into upper 32 and lower 34 portions, and the tablet is accepted between the portions, but other geometries could be used. This mirroring may be used in other embodiments of the invention. -
Figure 3 illustrates an arrangement in which theillumination optics 40 also comprises receiving optics to collect backscattered Raman photons. These are passed to a separatespectrographic detector 42, or alternatively to thedetector 20 used to detect forward scattered photons, for detection and subsequent analysis. In this way, forward scattered and back scattered photons may be detected and analysed at the same time, or at different times, and these various alternatives may be used in other embodiments of the invention. - In the embodiments illustrated in
figures 1 to 3 the tablet is of generally rectangular cross section, perhaps 10mm across and 4mm deep, and circular when viewed from above. In the example offigure 4 the tablet is spherical and therefore contained in a suitably adaptedcarrier 50. The example offigure 4 also illustrates that to derive bulk properties of the tablet using a transmission geometry it is not necessary to place the illumination and receiving optics in confrontation, directly across a tablet, although this may frequently be a preferred configuration for evenly distributed sampling of the tablet bulk. In the arrangement offigure 4 the illumination optics face downwards and the receiving optics collect light emerging from an aperture in the side rather than the bottom of the carrier, transverse to the direction of illumination. Generally, however, the surface of the tablet illuminated by the illumination optics should at least be separated or spaced from the surface from which scattered light is received by the receiving optics. - Because the general method described herein has reduced sensitivity to surface composition, it may be used to determine characteristics of a turbid medium such as a tablet or other dosage formulation when within an envelope such as packaging, for example a tablet already packaged for distribution and sale in a blister pack. This is illustrated in the example of
figure 5 in which atablet 10 within blister pack 55 is probed using illumination and receivingoptics upper membrane 57 of the blister pack being or comprising a metal or metalised foil, or other layer transmitting insufficient of the illumination photons. Comparing this arrangement with that offigure 1 , the blister pack 55 is acting ascarrier 12. The lowerblister pack membrane 57 is preferably translucent or transparent, for example being partly or wholly formed of a translucent white plastic, to enable light to pass sufficiently for the technique to work. If both the upper andlower membranes figure 1 could be used. - The described techniques may be used to analyse not just tablets non-invasively, but also other forms of dosage formulations such as capsules, by suitable configuration of the carrier, illumination and receiving optics. The described method enables the suppression of interfering surface Raman and fluorescence signals, observed with conventional Raman backscattering approaches, originating from the capsule shell, and revealing of the Raman spectra of active pharmaceutical ingredients contained within the capsule. The same principals also apply to other turbid, scattering media, and may also be readily applied in other fields such as probing of living tissue in depth, non-invasively. For example, in-depth probing of bone, cartilage, bone marrow, brain, nerves, lipids, blood through skin and teeth may be probed. Such analysis of living tissue may, for example, be used to detect physiological conditions such as disease. Other examples include the characterization of jewellery, such as jades and pearls, or corn and other kernels and seeds for their oil or oleic acid concentrations in quality control and high throughput screening.
- A Monte Carlo model was used to simulate the transport of illumination and Raman photons scattering within a turbid medium such as the
pharmaceutical tablet 10 offigure 1 to 4 . The model was used to calculate the relative intensities of backscattered and forward scattered Raman photons as a function of their depth within the turbid medium. Briefly, both the elastically (illumination) and non-elastically (Raman) scattered photons were individually followed as they propagated through the medium in random walk-like fashion in three-dimensional space. A simplified assumption was made that in each step a photon propagated in a straight line over a distance t and thereafter its direction was fully randomised at the next scattering event. Although this picture is simplistic from the standpoint of individual scattering events, photons propagating through a turbid medium typically have to undergo a number of scattering events (e.g. 10-20) before their original direction of propagation becomes fully scrambled. This is due to the fact that individual scattering events are often strongly biased towards the forward direction. However, it has been shown that for large propagation distances such as those pertinent to the bulk analysis of tablets, as of interest here, the individual multiple scattering events can be approximated as a single composite event occurring over the 'randomisation length' t (Matousek P. et al., Applied Spectroscopy 59, p1485, 2005). This simplified assumption enables analysis of large propagation distances with modest computational expense. - The propagation distance, t, over which the photon direction is randomised, can be crudely approximated as the transport length of the scattering medium (lt) (Brenan C. and Hunter I., Journal of Raman Spectroscopy 27, p561, 1996) which is defined in a similar manner as the average distance photons must travel within the sample before deviating significantly from their original direction of propagation. The transport length is typically an order of magnitude longer than the mean free scattering length (ls) of photons in the medium; the precise relation is ls = (1-g)lt, where g is the anisotropy for the individual scattering event. In the present model it was also assumed that the wavelength of light propagating through the medium was substantially shorter than the scattering length ls.
- The modelled
sample 60 is illustrated infigure 6 . The sample was considered to extend to infinity in x and y directions, with an air-medium interface located at the top surface 62 z=0 and bottom surface 64 z=d3, where z is a Cartesian coordinate normal to the interface plane. The sample was modelled as a uniform turbid medium apart from an intermediate-layer 66 having a different Raman signature to represent a heterogenous impurity, the intermediate layer having a thickness d2 with a top surface located at depth d1. The overall modelled sample thickness was d3 (d3>=d1+d2). That is, the bulk sample medium was located at depths z1 such that d1>z1>0 and d3>z1>(d1+d2), and the intermediate layer of a different Raman signature at depths z2 such that d1+d2<z2<d1. In the simulations reported herein the parameters d2 and d3 were fixed at 0.5 mm and 4 mm respectively, and d1 was varied from 0 to 3.5 mm to represent different depths of the interlayer 66 within the bulk of thesample 60. - The model assumed that all the illumination photons were first placed at a depth equal to the transport length lt and symmetrically distributed around the origin of the co-ordinate system x,y. The beam radius of the incident light r was 3 mm and the beam was given a uniform 'top-hat' intensity profile with all the photons having equal probability of being injected into the sample at any point within its cross-section. In the model, the Raman light was collected firstly at the
top sample surface 62 from the illumination area of the incident light, and separately on the opposite side of thesample 64 symmetrically around the projection axis of the top collection/laser illumination area. - The laser beam photons were propagated through the medium by translating each individual photon in a random direction by a step t. At each step there was a given probability that the photon would be converted to a Raman photon. The absorption of photons was assumed to be insignificant in this simulation. This parameter is expressed as optical density for the conversion of laser beam photons to Raman light. That is, for example, an optical density (OD) of 1 or 2 per 1 mm corresponds to the 10-fold or 100-fold decrease of the number of illumination photons through conversion to Raman photons, respectively, passing through an overall propagation distance of 1 mm. The optical density accounting for the conversion of illumination photons into Raman photons was set to 0.01 per mm-. Although this value is higher than that of real conversion, it only affects the absolute number of Raman photons, and not the spatial dependencies of concern in the studied regime. When an illumination photon is converted into a Raman photon the layer where this occurred is identified and recorded. Raman photons are propagated in the same fashion as illumination photons. A dominant mechanism for photon escape exists at the sample-to-
air interfaces radius 3 mm centred on the axis of the laser beam are separately counted as detected Raman photons. Any photon emerging from the sample is eliminated from further calculations. - The numerical code for putting the model into effect was written in Mathematica 5.0 (Wolfram Research). 100,000 simulated photons were propagated, each over an overall distance of 40 mm which is in line with typical migration times observed in Raman spectroscopy in the absence of absorption. The step size used was t = 0.2 mm (i.e. 200 steps was used). This corresponds to a sample formed from a powder having particle sizes of 10 and 20 µm diameter for the anisotropy of 0.9 and 0.95, respectively. It was checked that upon these times the vast majority of photons were lost at sample-to-surface interfaces. This process was repeated 50-times. Hence the overall number of propagated photons was 106 with the total number of steps considered being approximately 109. All the detected Raman photons in these repeated runs were summed up.
- The number of Raman photons originating in the intermediate layer 66 and collected as backscattered photons at the
upper surface 62, and transmitted photons at thelower surface 64, are shown infigure 7 . The graphs show the number of backscattered and transmitted photons for eight different depths d1 of the intermediate layer 66 ranging from at the top surface where d1=0 mm to at the bottom surface where d1=3.5 mm. - From
figure 7 it is clear that the collection of Raman photons in backscattering geometry even from an aperture as large as 6 mm in diameter leads to an extremely strong bias towards the surface layers of the sample. The repositioning of the 0.5 mm thick intermediate layer from the illuminated surface to a depth of 1.5 mm reduces the Raman backscatter intensity by 97%. In most practical applications the Raman signal will already have become swamped by the Raman or fluorescence signal originating from the surface region of the medium. At a depth of 3 mm the Raman signal originating from the intermediate layer has fallen by 4 orders of magnitude from its original level at the zero depth. On the other hand the dependence of the intensity of transmitted Raman photons exhibits only a weak dependence on the position of the intermediate layer within the sample. As the intermediate layer is moved between depths of 0 mm and 3.5 mm the corresponding Raman signal varies only by a factor of about 2. The absolute intensity of the Raman signal from the intermediate layer is only about 20-times lower than that of the bulk medium making detection relatively straightforward. Therefore the transmission geometry clearly provides a more representative sampling of the bulk of the sample interior than the conventional backscattering geometry, while permitting a satisfactory sensitivity. - For backscattering geometry, the model also reveals that an increase in sample thickness from 1 mm to 4 mm results in a 58% increase of the Raman signal detected in the backscattering geometry. In simplistic terms, this could be wrongly interpreted as extra Raman photons (amounting to 37 % of the overall Raman signal observed for 4 mm tablet) being produced in the extra 3 mm thickness added to the top 1 mm sample layer. However, the model of a 4 mm-thick sample indicates that 88 % of Raman signal originates in the top 1 mm layer and only 12 % originates within the remaining 3 mm of sample thickness. The extra 3 mm of material not only contributes with extra production of Raman photons but also reduces the loss of Raman photons originated within the 1 mm-layer at the
lower surface 64. Thus the increase in backscattered Raman photons through the addition of a further 3 mm of sample is also accomplished by returning Raman photons originating near the upper surface back towards the upper surface from where they may emerge and be collected. In the same way, some illumination photons are scattered back towards theupper surface 62 allowing them to originate still more Raman photons within the top 1 mm layer. - In an experimental arrangement, a two-layer sample was composed of a paracetamol tablet (500 mg, thickness 3.9 mm, circular diameter 12.8 mm, Tesco, PL Holder: The Wallis Laboratory Ltd. FOP234 MH/DRUGS/357) placed against a 2 mm thick fused silica cuvette with 300 µm windows filled with trans-stilbene ground powder. The cell width and length were 10 mm and 40 mm. Some measurements were taken with an illumination laser beam directed at the tablet, and some at the cuvette, in each case taking measurements of both backscattered and forward scattered (transmitted) Raman photons.
- The illumination laser beam was generated using an attenuated 115 mW temperature stabilised diode laser operated at 827 nm (Micro Laser Systems, Inc, L4 830S-115-TE). The laser power at the sample was 88 mW and the laser spot diameter was about 4 mm. The beam was spectrally purified by removing any residual amplified spontaneous emission components from its spectrum using two 830 nm band pass filters (Semrock). These were slightly tilted to optimise their throughput for the 827 nm laser wavelength. The beam was incident on the sample at about 45 degrees. The beam was polarised horizontally at the surface. The incident spot on the sample surface was therefore elliptical with the shorter radius being 2 mm and the longer 2.8 mm.
- Raman light was collected using a 50 mm diameter lens with a focal length of 60 mm. The scattered light was collimated and passed through a 50 mm diameter holographic notch filter (830 nm, Kaiser Optical Systems, Inc) to suppress the elastically scattered component of light. The filter was also slightly tilted to optimise suppression for the 827 nm elastic scatter. A second lens, identical to the first, was then used to image, with a magnification of 1:1, the sample surface onto the front face of an optical fibre probe. The laser illumination spot was imaged in such a way so that it coincided with the centre of the probe axis. Two more filters (25 mm diameter holographic notch filter, 830 nm, Kaiser Optical Systems, Inc, and an edge filter, 830 nm, Semrock) were used just before the probe to suppress any residual elastically scattered light that passed through the first holographic filter.
- The fibre probe was comprised of 7 fibres placed tightly packed at the centre of the probe. The fibres were made of silica with a core diameter of 200 µm, cladding diameter of 230 µm and numerical aperture of 0.37. Sleeves were stripped on both ends for tighter packing of the fibres. The bundle was custom made by C Technologies Inc. The Raman light was propagated through the fibre systems with a length of about 1 m to a linear fibre end oriented vertically and placed in the input image plane of a Kaiser Optical Technologies Holospec f# = 1.4 NIR spectrograph with its slit removed. In this orientation the fibres themselves acted as the input slit of the spectrograph. Raman spectra were collected using a deep depletion liquid nitrogen cooled CCD camera (Princeton Instruments, SPEC10 400BR LN Back-Illuminated Deep Depletion CCD, 1340 x 400 pixels) by binning the signal from all the 7 fibres vertically. The Raman spectra were not corrected for the variation of detection system sensitivity across the detected spectral range.
- Results obtained using this experimental arrangement are shown in
figures 8 and9 .Figure 8 shows spectra obtained from a conventional backscattering geometry applied to the two layered sample with the paracetamol illuminated (curve 70) and the cuvette illuminated (curve 72). Backscatter results for the paracetamol only (curve 74) and the cuvette only (curve 76) are also shown for reference.Figure 9 shows spectra obtained using the transmission geometry with the paracetamol illuminated (curve 80) and the cuvette illuminated (curve 82), with transmission results for the paracetamol only (curve 84) and the cuvette only (curve 86) are also shown for reference. - It is clear from
figure 8 that using the backscattering geometry only Raman signal from the directly illuminated component of the sample is seen. Even by subtracting the pure Raman spectrum of the top layer it was not possible to detect the spectrum of the sample sublayer, which is in line with predictions using the Monte Carlo model described above. In contrast, in the transmission geometry results offigure 9 a relatively constant Raman intensity ratio between the surface and sublayer is observed irrespective of which component of the sample is illuminated. -
Figure 9 demonstrates how, in an environment where tablets are being tested, an anomalous layer will be detected irrespective of its position relative to the illuminating radiation. If the paracetamol tablet used in this experiment had a thick layer of an impurity at the back, a conventional backscattering approach would not be able to detect its presence. The transmission geometry approach would detect the impurity layer irrespective of its depth within the sample. - The backscatter and transmission measurements using the paracetamol tablet without the cuvette show that the diminishment of the overall Raman intensity when going from the conventional backscattering to the transmission geometry was only by a factor of 12, thereby still allowing short exposure times to be used with reasonable sensitivity. Notably, a good Raman signal was observed in the transmission geometry even through a stack of two paracetamol tablets (7.8 mm thick) and it was still detectable through a stack of three paracetamol tablets (11.7 mm thick), with the signal diminishing by a factor of 16 and 400 respectively, compared with only one tablet monitored in the transmission geometry. The large illumination areas applicable in transmission geometry with pharmaceutical tablets and other dosage formulations also make it possible to use substantially higher laser powers without damaging the sample. This can be used to achieve further reductions in exposure times if required, in particular if combined with large area receiving optics.
- The same experimental arrangement was used to obtain a conventional backscatter Raman spectrum, and a transmission Raman spectrum, for a variety of different pharmaceutical capsules, having a variety of different coloured shell sections. Generally, the coloured capsule shells induced a large degree of fluorescence which had a deleterious effect on the signal to noise ratio of the measured Raman spectra. Spectra measured using a Sudafed (RTM) Dual Relief capsule coloured green, using a ten second exposure time, as shown in
figure 10 . The upper curve is a spectrum obtained using the conventional backscatter geometry, with any Raman spectral features of the pharmaceutical ingredients completely obscured by a fluorescence signal. The lower curve is a spectrum obtained using the described forward scattering geometry and although weaker than the backscatter signal, the useful Raman spectral peaks are very clearly visible. - The described technique may also be applied to diagnostic test technologies. Many clinical and other diagnostic tests are today carried out by an assay carried on a membrane. A sample which may contain a particular analyte is applied to the membrane, or to a pad coupled to the membrane, carrying one or more diagnostic reagants. Frequently, the results of a diagnostic test are detected optically, for example by means of a colour change, the visibility of a coloured band against a white membrane, or similar. Particular types of such diagnostic test arrangements include lateral flow, flow through, solid phase and agglutination formats.
- For some tests, high sensitivity to small amounts of a target analyte species in the sample is critical, and various technologies have addressed this issue by using optical tags having distinct Raman spectral signatures which are expressed dependent upon the presence of the target analyte species. To increase the sensitivity further, colliodal gold is sometimes used to enable detection of the target species by means of the surface enhanced Raman spectroscopy technique.
- A typical lateral flow test arrangement is shown in
figure 11 . A liquid sample containing the analyte to be detected is applied to amembrane 100 atentry point 102 and passes, by capillary action, along the membrane through afilter 104. The membrane is typically made of a translucent, light scattering material such as nitrocellulose, supported on a transparent ortranslucent substrate 105 which could, for example, be of glass, paper, or a plastic. In the illustrated example, the sample liquid is brought into contact with asignal reagant 106, with which relevant reactions occur as the liquid assay flows along the strip. On reaching adetection region 108 the complex of the analyte and the signal reagant is captured and detected optically, for example using theillumination optics 110 andcollection optics 112 illustrated, or as discussed elsewhere in this document . The signal reagant could be a biotag such as a Nanoplex (RTM) biotag provided by Oxonica Inc. A wide variety of alternatives and modifications to the illustrated arrangement are known. - The described technique may be used in the optical detection stage of a lateral flow test such as that illustrated in
figure 11 , or of other membrane based diagnostic tests. As illustrated infigure 11 , probe light is directed to a first surface of the membrane at thedetection region 108. The probe light scatters within the membrane and scattered light is collected at the opposite, second surface, in a transmission geometry. Some of the scattering is Raman scattering from one or more optically active reagants, tags or markers which express optically the presence of the analyte by expression of particular Raman spectral features. Therefore, one or more Raman spectral features of the collected light can be used to determine or quantify presence of the analyte, or other characteristics of the material held within or upon the membrane at the detection region. - A number of different Raman spectroscopy techniques may be used to enhance detection of the expressed Raman spectral features, including resonance Raman, Surface Enhanced Raman spectroscopy, and Surface Enhanced Resonance Raman spectroscopy.
- It will be apparent to the skilled person that a variety of modifications and variations may be made to the described embodiments without departing from the scope of the invention.
Claims (15)
- A method of determining one or more properties of a tablet pharmaceutical dosage formulation (10), the tablet having opposite circular surfaces spaced apart by the minor axis of a generally rectangular cross section of the tablet, the method comprising:exposing a first surface (11) of said formulation to incident radiation;receiving radiation;detecting Raman scattered elements in said received radiation; anddetermining one or more of said properties from said detected Raman scattered elements, characterised in that:the step of receiving is a step of receiving from a second surface of said formulation spaced from said first surface, elements of said incident radiation forward scattered through said formulation from said first surface (11),and in that the first and second surfaces are the circular surfaces of the tablet.
- The method of claim 1 wherein said pharmaceutical dosage formulation is diffusely scattering of said incident radiation between said first and second surfaces.
- The method of claim 1 or 2 wherein the pharmaceutical dosage formulation (10) comprises a diffusely scattering solid material.
- The method of any of claims 1 to 3 further comprising collecting backscattered elements of said incident radiation, and detecting Raman scattered elements in said backscattered elements.
- The method of any preceding claim wherein said dosage formulation is retained in a carrier (12) having one or more inner surfaces facing said dosage formulation.
- The method of claim 5 wherein at least a portion of the inner surfaces is mirrored so as to reflect radiation back into said dosage formulation.
- The method of claim 6 wherein said carrier (12) comprises a first aperture through which the first surface of said dosage formulation is exposed to said incident radiation, and a second aperture through which the forward scattered elements are received from the second surface of said dosage formulation.
- The method of claim 7 wherein said incident radiation is generated using one or more lasers (14).
- A method of testing a plurality of pharmaceutical dosage formulations comprising applying the method of any preceding claim to each of the dosage formulations.
- The method of any preceding claim wherein the pharmaceutical dosage formulation comprises a turbid solid object.
- The method of any preceding claim wherein said one or more properties include one or more of a polymorph form property, a hydrated form property, a solvate form property, a salt form property, and a degree of crystallinity property.
- The method of any of claims 1 to 10 wherein said one or more properties include one or more indications of starting materials used in chemical reactions to form a component of said dosage formulation.
- A method of analysing the bulk of a tablet pharmaceutical dosage formulation comprising directing incident radiation at said dosage formulation and detecting Raman radiation scattered in the dosage formulation using a transmission geometry, according to any preceding claim.
- The method of any preceding claim wherein the pharmaceutical dosage formulation is a coated tablet, and the one or more properties are properties of an interior portion of the coated tablet.
- The method of any preceding claim wherein the pharmaceutical dosage formulation is a tablet in a blister pack.
Priority Applications (1)
| Application Number | Priority Date | Filing Date | Title |
|---|---|---|---|
| EP18209601.6A EP3477285B1 (en) | 2006-04-05 | 2007-04-05 | Raman analysis |
Applications Claiming Priority (2)
| Application Number | Priority Date | Filing Date | Title |
|---|---|---|---|
| GBGB0606891.0A GB0606891D0 (en) | 2006-04-05 | 2006-04-05 | Raman Analysis Of Pharmaceutical Tablets |
| PCT/GB2007/001249 WO2007113566A2 (en) | 2006-04-05 | 2007-04-05 | Raman analysis |
Related Child Applications (2)
| Application Number | Title | Priority Date | Filing Date |
|---|---|---|---|
| EP18209601.6A Division-Into EP3477285B1 (en) | 2006-04-05 | 2007-04-05 | Raman analysis |
| EP18209601.6A Division EP3477285B1 (en) | 2006-04-05 | 2007-04-05 | Raman analysis |
Publications (2)
| Publication Number | Publication Date |
|---|---|
| EP2002243A2 EP2002243A2 (en) | 2008-12-17 |
| EP2002243B1 true EP2002243B1 (en) | 2019-04-03 |
Family
ID=36539406
Family Applications (4)
| Application Number | Title | Priority Date | Filing Date |
|---|---|---|---|
| EP06808690.9A Active EP1952129B1 (en) | 2005-11-25 | 2006-11-27 | Security screening using raman analysis |
| EP07732306.1A Active EP2010042B1 (en) | 2006-04-05 | 2007-04-05 | Raman analysis of tissue |
| EP07732297.2A Revoked EP2002243B1 (en) | 2006-04-05 | 2007-04-05 | Raman analysis |
| EP18209601.6A Active EP3477285B1 (en) | 2006-04-05 | 2007-04-05 | Raman analysis |
Family Applications Before (2)
| Application Number | Title | Priority Date | Filing Date |
|---|---|---|---|
| EP06808690.9A Active EP1952129B1 (en) | 2005-11-25 | 2006-11-27 | Security screening using raman analysis |
| EP07732306.1A Active EP2010042B1 (en) | 2006-04-05 | 2007-04-05 | Raman analysis of tissue |
Family Applications After (1)
| Application Number | Title | Priority Date | Filing Date |
|---|---|---|---|
| EP18209601.6A Active EP3477285B1 (en) | 2006-04-05 | 2007-04-05 | Raman analysis |
Country Status (8)
| Country | Link |
|---|---|
| US (3) | US7911604B2 (en) |
| EP (4) | EP1952129B1 (en) |
| JP (2) | JP2009536317A (en) |
| CN (2) | CN101460091B (en) |
| AU (2) | AU2007232350A1 (en) |
| CA (2) | CA2648228A1 (en) |
| GB (3) | GB0606891D0 (en) |
| WO (2) | WO2007113566A2 (en) |
Families Citing this family (56)
| Publication number | Priority date | Publication date | Assignee | Title |
|---|---|---|---|---|
| EP1078959B1 (en) * | 1999-08-27 | 2002-03-13 | Degussa AG | Furnace black, process for its preparation and its use |
| GB0606891D0 (en) * | 2006-04-05 | 2006-05-17 | Council Cent Lab Res Councils | Raman Analysis Of Pharmaceutical Tablets |
| US8325337B2 (en) * | 2007-07-13 | 2012-12-04 | Purdue Research Foundation | Time resolved raman spectroscopy |
| SE531527C2 (en) * | 2007-10-01 | 2009-05-12 | Bioresonator Ab | Method and apparatus for unaffected material examination |
| SI2225230T1 (en) | 2007-12-07 | 2017-03-31 | Vertex Pharmaceuticals Incorporated | Solid forms of 3-(6-(1-(2,2-difluorobenzo(d)(1,3)dioxol-5-yl) cyclopropanecarboxamido)-3-methylpyridin-2-yl) benzoic acid |
| CN102883658B (en) * | 2009-11-19 | 2016-06-22 | 调节成像公司 | Method and apparatus for analyzing turbid media via single-element detection using structured illumination |
| US20120092663A1 (en) * | 2010-10-14 | 2012-04-19 | Kull Linda S | Transmission raman spectroscopy analysis of seed composition |
| DE102011002181A1 (en) * | 2011-04-19 | 2012-10-25 | Bundesdruckerei Gmbh | Method and device for checking security features in security documents |
| RU2014129036A (en) * | 2011-12-16 | 2016-02-10 | Глэксо Груп Лимитед | DEVICE FOR STUDYING SAMPLES USING RAMANOVSKII RADIATION |
| WO2013112804A1 (en) | 2012-01-25 | 2013-08-01 | Vertex Pharmaceuticals Incorporated | Formulations of 3-(6-(1-(2.2-difluorobenzo[d][1,3]dioxol-5-yl) cyclopropanecarboxamido)-3-methylpyridin-2-yl)benzoic acid |
| WO2013124164A1 (en) * | 2012-02-24 | 2013-08-29 | Paul Scherrer Institut | A system for non-invasively classification of different types of micro-calcifications in human tissue |
| BR112015010459B1 (en) | 2012-11-07 | 2021-01-26 | Modulated Imaging, Inc. | method for measuring a cloudy sample |
| WO2014124532A1 (en) * | 2013-02-14 | 2014-08-21 | Verisante Technology, Inc. | Optical standard for calibration of spectral measuring systems |
| US9606062B2 (en) * | 2013-05-27 | 2017-03-28 | Indian Institute Of Science | Method and a system for detection of hazardous chemicals in a non-metallic container |
| US9983136B2 (en) | 2013-05-27 | 2018-05-29 | Indian Institute Of Science | Method and an apparatus for obtaining sample specific signatures |
| KR20150010392A (en) * | 2013-07-19 | 2015-01-28 | 케이맥(주) | Inspection method and apparatus of crystallized silicon |
| US20150022802A1 (en) * | 2013-07-22 | 2015-01-22 | Frederick Harold LONG | Spectroscopy detection system and method for material identification |
| JP6963896B2 (en) * | 2013-11-12 | 2021-11-10 | バーテックス ファーマシューティカルズ インコーポレイテッドVertex Pharmaceuticals Incorporated | Methods of Preparing Pharmaceutical Compositions for the Treatment of CFTR-mediated Diseases |
| CN103743717B (en) * | 2013-12-03 | 2015-09-23 | 中国工程物理研究院化工材料研究所 | Explosive CL-20 crystal formation quantitative test raman signatures area determination method |
| CN104749158B (en) * | 2013-12-27 | 2020-12-11 | 同方威视技术股份有限公司 | Jewelry and jade identification method and device |
| US9295420B2 (en) | 2014-01-29 | 2016-03-29 | Hong Kong Applied Science and Technology Research Institute Company Limited | Transmission-reflectance swappable Raman probe for physiological detections |
| US10436716B2 (en) * | 2014-09-24 | 2019-10-08 | Smiths Detection, Inc. | Ubiquitous transmissive raman spectroscopy for stand-off detection |
| US10072984B2 (en) | 2014-10-02 | 2018-09-11 | Mks Technology, Inc. | Spectrometer |
| GB201503911D0 (en) * | 2015-03-09 | 2015-04-22 | Renishaw Plc | Transmission raman spectroscopy |
| CN104730060A (en) * | 2015-03-20 | 2015-06-24 | 扬州大学 | Method for controllably decreasing and rapidly detecting in-vitro simple simulation bone density |
| US10288814B2 (en) | 2015-03-25 | 2019-05-14 | Board Of Regents Of The University Of Texas System | Variable spatial offset fiber optic probe for optical spectography and imaging |
| GB201511574D0 (en) | 2015-07-01 | 2015-08-12 | Stfc Science & Technology | Clinical thermometer |
| WO2017066399A1 (en) * | 2015-10-15 | 2017-04-20 | The Usa, As Represented By The Secretary Of The Navy | Trace-gas raman spectroscopy in functionalized waveguides |
| US10365229B2 (en) | 2015-12-31 | 2019-07-30 | Kaiser Optical Systems, Inc. | Real-time characterization of pharmaceutical tablet coatings using Raman spectroscopy |
| CN109068991A (en) * | 2016-04-13 | 2018-12-21 | 皇家飞利浦有限公司 | The system and method for skin detection for human subjects |
| US11092494B1 (en) | 2016-05-31 | 2021-08-17 | MKS Technology | Spectrometer |
| GB201618260D0 (en) | 2016-10-28 | 2016-12-14 | Science And Tech Facilities Council The | Detection of pH |
| US10119917B2 (en) * | 2016-11-11 | 2018-11-06 | B & W Tek LLC | Apparatus and method for bidirectional Raman spectroscopy |
| US10119916B2 (en) * | 2016-11-11 | 2018-11-06 | B&W Tek Llc | Light delivery and collection device for measuring Raman scattering of a sample |
| JPWO2018134980A1 (en) | 2017-01-20 | 2019-12-12 | オリンパス株式会社 | Cartilage tissue analyzer |
| EP3610244B1 (en) | 2017-04-11 | 2022-06-08 | rap.ID Particle Systems GmbH | Liquid cell for the microscopic imaging and raman spectroscopic material analysis of particles suspensions |
| CN108398418B (en) * | 2018-03-16 | 2020-12-04 | 华东理工大学 | An internal reference surface-enhanced Raman test paper, preparation method and application |
| CN108577874B (en) * | 2018-05-21 | 2021-09-17 | 达影医疗(中山)有限公司 | Mammary gland displacement compression device and mammary gland X-ray photography system |
| JP7075285B2 (en) * | 2018-05-29 | 2022-05-25 | 株式会社堀場製作所 | Calibration curve setting method used for drug analysis |
| CN109060766A (en) * | 2018-09-27 | 2018-12-21 | 珠海彩晶光谱科技有限公司 | A kind of measurement method and detection device of the concentration in body fluid based on Surface enhanced Raman spectroscopy |
| GB2572662B (en) | 2018-10-05 | 2020-06-03 | Res & Innovation Uk | Raman spectrometer |
| GB2581154B (en) | 2019-02-05 | 2022-09-28 | Colvistec Ag | Amorphous pharmaceutical compositions |
| WO2020254594A1 (en) | 2019-06-19 | 2020-12-24 | Syddansk Universitet | Raman computed tomography (raman-ct) system and method |
| GB201910801D0 (en) * | 2019-07-29 | 2019-09-11 | Agilent Tech Lda Uk Limited | Raman analysis of pharmaceutical dosage forms |
| DE102019219949A1 (en) * | 2019-12-18 | 2021-06-24 | Robert Bosch Gmbh | Substrate |
| GB202004010D0 (en) | 2020-03-19 | 2020-05-06 | Res & Innovation Uk | Detection of water content in tissue |
| EP4127678B1 (en) | 2020-03-26 | 2025-03-19 | Innovative Photonic Solutions, Inc. | Method for selection of raman excitation wavelengths in multi-source raman probe |
| GB2594980B (en) * | 2020-05-14 | 2025-01-01 | Agilent Tech Lda Uk Limited | Spectral analysis of a sample |
| GB2596804A (en) | 2020-07-06 | 2022-01-12 | Agilent Tech Lda Uk Limited | Raman analysis of pharmaceutical dosage forms |
| JP7270582B2 (en) * | 2020-07-20 | 2023-05-10 | アンリツ株式会社 | Spectrometer |
| US11304605B2 (en) * | 2020-07-20 | 2022-04-19 | 123IV, Inc. | Self-administered, non-invasive, transcutaneous viral detector |
| US11898959B2 (en) * | 2020-12-07 | 2024-02-13 | Harry Owen | Solids analysis using Raman spectroscopy |
| CN114460058B (en) * | 2021-02-20 | 2025-07-22 | 海南聚能科技创新研究院有限公司 | Spectrometer detection device |
| US12279758B2 (en) * | 2021-09-27 | 2025-04-22 | Ai Biomed Corp. | Tissue detection systems and methods |
| US11974726B2 (en) | 2021-09-27 | 2024-05-07 | Ai Biomed Corp. | Tissue detection systems and methods |
| GB2615370B (en) | 2022-02-08 | 2025-03-26 | Res & Innovation Uk | Detection using SERS probes |
Citations (3)
| Publication number | Priority date | Publication date | Assignee | Title |
|---|---|---|---|---|
| US3442591A (en) * | 1965-03-06 | 1969-05-06 | Hitachi Ltd | Apparatus for measuring the raman effect of samples of infinitesimal quantities |
| FR2566903A1 (en) * | 1984-06-29 | 1986-01-03 | Schrader Bernhard | SAMPLE RECEIVING DEVICE FOR SPECTROMETRY, LUMINESCENCE AND DIFFUSION MEASUREMENT METHOD, AND APPLICATION OF SAMPLE RECEIVING DEVICE |
| WO2001057500A1 (en) * | 2000-01-31 | 2001-08-09 | Astrazeneca Ab | Apparatus and method for analysing |
Family Cites Families (111)
| Publication number | Priority date | Publication date | Assignee | Title |
|---|---|---|---|---|
| US3516744A (en) | 1966-05-20 | 1970-06-23 | Perkin Elmer Corp | Sampling arrangement for laser-raman systems |
| US3770350A (en) | 1972-07-24 | 1973-11-06 | Bell Telephone Labor Inc | Method utilizing an optical fiber raman cell |
| US3909132A (en) | 1974-06-11 | 1975-09-30 | Allied Chem | Spectroscopic temperature measurement |
| JPS6058820B2 (en) | 1979-07-31 | 1985-12-21 | 工業技術院長 | Surface analysis method for transparent materials |
| US4645340A (en) | 1983-06-01 | 1987-02-24 | Boston University | Optically reflective sphere for efficient collection of Raman scattered light |
| AU565295B2 (en) * | 1983-10-13 | 1987-09-10 | Matsushita Electric Industrial Co., Ltd. | Fluid deflecting assembly |
| US4570638A (en) | 1983-10-14 | 1986-02-18 | Somanetics Corporation | Method and apparatus for spectral transmissibility examination and analysis |
| US5139025A (en) | 1983-10-14 | 1992-08-18 | Somanetics Corporation | Method and apparatus for in vivo optical spectroscopic examination |
| GB8514992D0 (en) * | 1985-06-13 | 1985-07-17 | British Nuclear Fuels Plc | Differentiation technique |
| US4784486A (en) | 1987-10-06 | 1988-11-15 | Albion Instruments | Multi-channel molecular gas analysis by laser-activated Raman light scattering |
| US4945239A (en) | 1989-03-29 | 1990-07-31 | Center For Innovative Technology | Early detection of breast cancer using transillumination |
| GB9002360D0 (en) * | 1990-02-02 | 1990-04-04 | De La Rue Co Plc | Ink composition and components thereof |
| GB9009132D0 (en) * | 1990-04-24 | 1990-06-20 | Gersan Ets | Method and apparatus for examining an object |
| US5261410A (en) | 1991-02-07 | 1993-11-16 | Alfano Robert R | Method for determining if a tissue is a malignant tumor tissue, a benign tumor tissue, or a normal or benign tissue using Raman spectroscopy |
| EP0573535B1 (en) | 1991-02-26 | 2000-12-27 | Massachusetts Institute Of Technology | Systems and methods of molecular spectroscopy to provide for the diagnosis of tissue |
| US5194913A (en) * | 1991-03-20 | 1993-03-16 | The United States Of America As Represented By The United States Department Of Energy | Fiber-optic apparatus and method for measurement of luminescence and raman scattering |
| US5506678A (en) | 1992-02-24 | 1996-04-09 | Hewlett Packard Company | System for collecting weakly scattered electromagnetic radiation |
| JP3271304B2 (en) * | 1992-06-30 | 2002-04-02 | 株式会社島津製作所 | Time-of-flight ion scattering spectrometer |
| US5371368A (en) | 1992-07-23 | 1994-12-06 | Alfano; Robert R. | Ultrafast optical imaging of objects in a scattering medium |
| US5746210A (en) | 1993-02-26 | 1998-05-05 | David A. Benaron | Device and method for detection, localization, and characterization of inhomogeneities in turbid media |
| US5565982A (en) | 1994-05-31 | 1996-10-15 | Recon Exploration | Apparatus and method for time resolved spectroscopy |
| US5818047A (en) | 1994-08-20 | 1998-10-06 | Renishaw Plc | Detector for explosive substances |
| JP3295869B2 (en) | 1994-09-08 | 2002-06-24 | 株式会社ニコン | Raman spectroscopy method |
| US5625458A (en) | 1994-11-10 | 1997-04-29 | Research Foundation Of City College Of New York | Method and system for imaging objects in turbid media using diffusive fermat photons |
| US5660181A (en) | 1994-12-12 | 1997-08-26 | Physical Optics Corporation | Hybrid neural network and multiple fiber probe for in-depth 3-D mapping |
| US5919140A (en) | 1995-02-21 | 1999-07-06 | Massachusetts Institute Of Technology | Optical imaging using time gated scattered light |
| US5615673A (en) | 1995-03-27 | 1997-04-01 | Massachusetts Institute Of Technology | Apparatus and methods of raman spectroscopy for analysis of blood gases and analytes |
| BR9601329A (en) * | 1995-04-14 | 1998-01-13 | Fuji Xerox Co Ltd | Belt conveyor roll and image forming device |
| US5999836A (en) | 1995-06-06 | 1999-12-07 | Nelson; Robert S. | Enhanced high resolution breast imaging device and method utilizing non-ionizing radiation of narrow spectral bandwidth |
| US5636633A (en) | 1995-08-09 | 1997-06-10 | Rio Grande Medical Technologies, Inc. | Diffuse reflectance monitoring apparatus |
| US5760399A (en) | 1995-10-02 | 1998-06-02 | Foss Nirsystems, Inc. | Measurement of transmission spectra of pharmaceutical tablets |
| JPH09127001A (en) | 1995-10-31 | 1997-05-16 | Ajinomoto Co Inc | Nondestructive inspection method for sealed material |
| SE513163C2 (en) | 1995-12-20 | 2000-07-17 | Astrazeneca Ab | Apparatus and method of spectrometry |
| JPH09184809A (en) | 1995-12-30 | 1997-07-15 | Koyo Ozaki | Scattering light measuring apparatus |
| GB9609793D0 (en) * | 1996-05-10 | 1996-07-17 | Ciba Geigy Ag | Pigment compositions |
| US5866430A (en) | 1996-06-13 | 1999-02-02 | Grow; Ann E. | Raman optrode processes and devices for detection of chemicals and microorganisms |
| US5842995A (en) | 1996-06-28 | 1998-12-01 | Board Of Regents, The Univerisity Of Texas System | Spectroscopic probe for in vivo measurement of raman signals |
| US5873831A (en) | 1997-03-13 | 1999-02-23 | The University Of Utah Technology Transfer Office | Method and system for measurement of macular carotenoid levels |
| WO1999001750A1 (en) | 1997-07-02 | 1999-01-14 | Spectra Code, Inc. | Raman system for rapid sample identification |
| GB2328016B (en) | 1997-08-08 | 2001-04-25 | Pfizer Ltd | Spectrophotometric analysis |
| SE9704873D0 (en) | 1997-12-23 | 1997-12-23 | Astra Ab | Sampling apparatus |
| WO2000001295A1 (en) | 1998-07-07 | 2000-01-13 | Lightouch Medical, Inc. | Tissue modulation process for quantitative noninvasive in vivo spectroscopic analysis of tissues |
| SE9802690D0 (en) | 1998-08-07 | 1998-08-07 | Astra Ab | Mixing apparatus |
| GB9819732D0 (en) | 1998-09-11 | 1998-11-04 | Renishaw Plc | Tool conditioning monitoring |
| ATE314638T1 (en) | 1998-10-07 | 2006-01-15 | Ecole Polytech | METHOD FOR LOCAL AND SURFACE MEASURING THE SCATTERING AND ABSORPTION PROPERTIES OF TURBID MEDIA |
| US6352502B1 (en) | 1998-12-03 | 2002-03-05 | Lightouch Medical, Inc. | Methods for obtaining enhanced spectroscopic information from living tissue, noninvasive assessment of skin condition and detection of skin abnormalities |
| SE9903423D0 (en) | 1999-09-22 | 1999-09-22 | Astra Ab | New measuring technique |
| WO2001052739A1 (en) | 2000-01-21 | 2001-07-26 | Flock Stephen T | Optical measurements of bone composition |
| SE0000522D0 (en) | 2000-02-17 | 2000-02-17 | Astrazeneca Ab | Mixing apparatus |
| US6610351B2 (en) * | 2000-04-12 | 2003-08-26 | Quantag Systems, Inc. | Raman-active taggants and their recognition |
| US7113814B2 (en) | 2000-07-13 | 2006-09-26 | Virginia Commonwealth University | Tissue interrogation spectroscopy |
| JP2002085385A (en) | 2000-09-21 | 2002-03-26 | Sadako Honda | Method and apparatus for measuring blood sugar value |
| IL138683A0 (en) | 2000-09-25 | 2001-10-31 | Vital Medical Ltd | Apparatus and method for monitoring tissue vitality parameters |
| JP3836430B2 (en) * | 2000-10-04 | 2006-10-25 | 東京瓦斯株式会社 | Non-destructive reading method for isotope labeling |
| SE0100283D0 (en) | 2001-01-31 | 2001-01-31 | Astrazeneca Ab | Sampling apparatus |
| US6925514B1 (en) * | 2001-03-30 | 2005-08-02 | Agere Systems Inc. | Multi-protocol bus system and method of operation thereof |
| US6954667B2 (en) | 2001-06-28 | 2005-10-11 | Chemimage Corporation | Method for Raman chemical imaging and characterization of calcification in tissue |
| JP2003010189A (en) | 2001-07-04 | 2003-01-14 | Communication Research Laboratory | Biological function information imaging device |
| EP1430291B1 (en) | 2001-09-12 | 2007-02-14 | Gersan Establishment | Examining a diamond |
| US6610977B2 (en) | 2001-10-01 | 2003-08-26 | Lockheed Martin Corporation | Security system for NBC-safe building |
| US20050037615A1 (en) | 2001-11-06 | 2005-02-17 | Dario Cabib | In-line spectroscopy for process monitoring |
| US6825928B2 (en) | 2001-12-19 | 2004-11-30 | Wisconsin Alumni Research Foundation | Depth-resolved fluorescence instrument |
| US6975891B2 (en) * | 2001-12-21 | 2005-12-13 | Nir Diagnostics Inc. | Raman spectroscopic system with integrating cavity |
| US6873868B2 (en) | 2001-12-31 | 2005-03-29 | Infraredx, Inc. | Multi-fiber catheter probe arrangement for tissue analysis or treatment |
| US6654118B2 (en) | 2002-02-04 | 2003-11-25 | Ortho-Mcneil Pharmaceutical, Inc. | Method and apparatus for obtaining molecular data from a pharmaceutical specimen |
| EP1335199A1 (en) | 2002-02-11 | 2003-08-13 | Bayer Corporation | Non-invasive system for the determination of analytes in body fluids |
| AU2003211200A1 (en) | 2002-02-14 | 2003-09-04 | Toshinori Kato | Apparatus for evaluating biological function |
| US6919556B1 (en) | 2002-02-22 | 2005-07-19 | Monocle Technologies, Inc. | System and method for monitoring and evaluating solid and semi-solid materials |
| WO2003073082A1 (en) | 2002-02-28 | 2003-09-04 | Erasmus Universiteit Rotterdam | Depth selective ph measurement and uv exposure measurement |
| SE0200782D0 (en) | 2002-03-14 | 2002-03-14 | Astrazeneca Ab | Method of analyzing a pharmaceutical sample |
| US7647092B2 (en) | 2002-04-05 | 2010-01-12 | Massachusetts Institute Of Technology | Systems and methods for spectroscopy of biological tissue |
| US7197562B2 (en) | 2002-04-05 | 2007-03-27 | Infocus Corporation | Projector device management system |
| WO2004037287A2 (en) | 2002-05-23 | 2004-05-06 | Palomar Medical Technologies, Inc. | Phototreatment device for use with coolants and topical substances |
| IL151745A (en) | 2002-09-12 | 2007-10-31 | Uzi Sharon | Explosive detection and identification system |
| US20040142484A1 (en) | 2002-09-30 | 2004-07-22 | Intel Corporation | Spectroscopic analysis system and method |
| US8088628B2 (en) | 2002-09-30 | 2012-01-03 | Intel Corporation | Stimulated and coherent anti-stokes raman spectroscopic methods for the detection of molecules |
| WO2004051242A1 (en) | 2002-12-02 | 2004-06-17 | Erasmus Universiteit Rotterdam | Use of high wavenumber raman spectroscopy for measuring tissue |
| US6897951B2 (en) | 2003-02-14 | 2005-05-24 | Raman Systems, Inc. | Probe assemblies for Raman spectroscopy |
| JP4136704B2 (en) | 2003-02-19 | 2008-08-20 | 株式会社島津製作所 | Probe for optical measurement device and multichannel optical measurement device using the same |
| JP2004271220A (en) | 2003-03-05 | 2004-09-30 | Toshiba Ceramics Co Ltd | Apparatus and method for evaluating quartz glass |
| EP2301439A1 (en) | 2003-03-05 | 2011-03-30 | InfraReDx, Inc. | Catheter probe arrangement for tissue analysis by radiant energy delivery and radiant energy collection |
| JP2004294150A (en) | 2003-03-26 | 2004-10-21 | Univ Waseda | Spectroscopic analyzer and spectroscopic method |
| US7110109B2 (en) * | 2003-04-18 | 2006-09-19 | Ahura Corporation | Raman spectroscopy system and method and specimen holder therefor |
| EP1634061A4 (en) | 2003-04-30 | 2007-11-21 | Univ Mcgill | METHOD AND SYSTEM FOR MEASURING THE CONCENTRATION OF LACTATE IN VIVO |
| AU2003284845A1 (en) * | 2003-05-15 | 2004-12-03 | Alexei Alexeevich Agibalov | Method for forming a database for determining biological agents and chemical substances |
| US7242469B2 (en) | 2003-05-27 | 2007-07-10 | Opto Trace Technologies, Inc. | Applications of Raman scattering probes |
| RU2269116C2 (en) * | 2003-06-18 | 2006-01-27 | Глеб Игоревич Андреев | Device for forming database for biologic agents and chemical substances |
| US7396650B2 (en) | 2003-06-27 | 2008-07-08 | Commissariat A L'energie Atomique | Method for dosing a biological or chemical sample |
| JP4388318B2 (en) * | 2003-06-27 | 2009-12-24 | オリンパス株式会社 | Image processing device |
| JP2007524833A (en) | 2003-07-01 | 2007-08-30 | ザ リージェンツ オブ ザ ユニバーシティ オブ ミシガン | Method and apparatus for diagnosing bone tissue condition |
| JP2005070009A (en) | 2003-08-28 | 2005-03-17 | Toyota Motor Corp | Spectroscopic analyzer |
| US20060249423A1 (en) | 2003-11-28 | 2006-11-09 | Mika Reijonen | Method and apparatus to identify and separate medicinal preparations and dosages thereof |
| US7148963B2 (en) | 2003-12-10 | 2006-12-12 | Kaiser Optical Systems | Large-collection-area optical probe |
| US7697576B2 (en) | 2004-05-05 | 2010-04-13 | Chem Image Corporation | Cytological analysis by raman spectroscopic imaging |
| CN1584555A (en) | 2004-06-01 | 2005-02-23 | 浙江大学 | Petroleum products quality rapid measuring instrument based on low-resolution Raman spectra |
| US7796243B2 (en) | 2004-06-09 | 2010-09-14 | National Research Council Of Canada | Detection and monitoring of changes in mineralized tissues or calcified deposits by optical coherence tomography and Raman spectroscopy |
| WO2006091223A2 (en) * | 2004-06-30 | 2006-08-31 | Chemimage Corporation | Multimodal method for identifying hazardous agents |
| WO2006083316A2 (en) * | 2004-06-30 | 2006-08-10 | Chemimage Corporation | Multipoint method for identifying hazardous agents |
| WO2006005022A2 (en) | 2004-06-30 | 2006-01-12 | Chemimage Corporation | Dynamic chemical imaging of biological cells and other subjects |
| US7269245B2 (en) | 2004-07-30 | 2007-09-11 | Bruker Axs, Inc. | Combinatorial screening system and X-ray diffraction and Raman spectroscopy |
| GB0426993D0 (en) | 2004-12-09 | 2005-01-12 | Council Cent Lab Res Councils | Apparatus for depth-selective raman spectroscopy |
| WO2006078980A2 (en) | 2005-01-20 | 2006-07-27 | Chemimage Corporation | Method for raman computer tomography imaging spectroscopy |
| JP4595571B2 (en) * | 2005-02-04 | 2010-12-08 | セイコーエプソン株式会社 | Micro Raman spectroscopy apparatus and micro Raman spectroscopy measurement method |
| WO2006127766A1 (en) | 2005-05-25 | 2006-11-30 | Bayer Healthcare Llc | Methods of using raman spectral information in determining analyte concentrations |
| WO2007040589A1 (en) | 2005-09-16 | 2007-04-12 | The Regents Of The University Of Michigan | Method and system for measuring sub-surface composition of a sample |
| GB0606891D0 (en) | 2006-04-05 | 2006-05-17 | Council Cent Lab Res Councils | Raman Analysis Of Pharmaceutical Tablets |
| WO2007060467A1 (en) | 2005-11-25 | 2007-05-31 | The Science And Technology Facilities Council | Security screening using raman analysis |
| WO2007113570A1 (en) | 2006-04-05 | 2007-10-11 | The Science And Technology Facilities Council | Raman analysis of tissue |
| CA2661952A1 (en) | 2006-08-22 | 2008-02-28 | Bayer Healthcare Llc | Non-invasive methods of using spectral information in determining analyte concentrations |
| US7603151B2 (en) | 2006-08-22 | 2009-10-13 | Bayer Healthcare Llc | Non-invasive methods of using spectral information in determining analyte concentrations |
| JP4862730B2 (en) * | 2007-04-05 | 2012-01-25 | コニカミノルタセンシング株式会社 | Pulse wave data analysis method, system, program |
-
2006
- 2006-04-05 GB GBGB0606891.0A patent/GB0606891D0/en not_active Ceased
- 2006-08-17 GB GBGB0616376.0A patent/GB0616376D0/en not_active Ceased
- 2006-09-21 GB GB0618635A patent/GB2432661A/en active Pending
- 2006-11-27 US US12/085,346 patent/US7911604B2/en active Active
- 2006-11-27 EP EP06808690.9A patent/EP1952129B1/en active Active
-
2007
- 2007-04-05 WO PCT/GB2007/001249 patent/WO2007113566A2/en not_active Ceased
- 2007-04-05 EP EP07732306.1A patent/EP2010042B1/en active Active
- 2007-04-05 AU AU2007232350A patent/AU2007232350A1/en not_active Abandoned
- 2007-04-05 AU AU2007232354A patent/AU2007232354A1/en not_active Abandoned
- 2007-04-05 EP EP07732297.2A patent/EP2002243B1/en not_active Revoked
- 2007-04-05 CN CN2007800207096A patent/CN101460091B/en not_active Expired - Fee Related
- 2007-04-05 US US12/083,073 patent/US8085396B2/en active Active
- 2007-04-05 US US12/225,928 patent/US8259902B2/en active Active
- 2007-04-05 WO PCT/GB2007/001289 patent/WO2007113581A1/en not_active Ceased
- 2007-04-05 CA CA002648228A patent/CA2648228A1/en not_active Abandoned
- 2007-04-05 EP EP18209601.6A patent/EP3477285B1/en active Active
- 2007-04-05 CN CNA2007800207908A patent/CN101460831A/en active Pending
- 2007-04-05 JP JP2009503651A patent/JP2009536317A/en active Pending
- 2007-04-05 CA CA002647730A patent/CA2647730A1/en not_active Abandoned
- 2007-04-05 JP JP2009503653A patent/JP2009538156A/en active Pending
Patent Citations (3)
| Publication number | Priority date | Publication date | Assignee | Title |
|---|---|---|---|---|
| US3442591A (en) * | 1965-03-06 | 1969-05-06 | Hitachi Ltd | Apparatus for measuring the raman effect of samples of infinitesimal quantities |
| FR2566903A1 (en) * | 1984-06-29 | 1986-01-03 | Schrader Bernhard | SAMPLE RECEIVING DEVICE FOR SPECTROMETRY, LUMINESCENCE AND DIFFUSION MEASUREMENT METHOD, AND APPLICATION OF SAMPLE RECEIVING DEVICE |
| WO2001057500A1 (en) * | 2000-01-31 | 2001-08-09 | Astrazeneca Ab | Apparatus and method for analysing |
Non-Patent Citations (20)
| Title |
|---|
| B. SCHRADER, F. NERDEL, G. KRESZE: "Verfahren zur Aufnahme der RAMAN-Spektren von Festkoirpern als Presslingen", ZEITSCHRIFT FUR PHYSIKALISCHE CHEMIE, vol. 12, 1 January 1957 (1957-01-01), pages 132 - 138, XP055723923 |
| BERNHARD SCHRADER AND GERHARD BERGMANN: "Die Intensit�t des Ramanspektrums polykristalliner Substanzen", FRESENIUS' JOURNAL OF ANALYTICAL CHEMISTRY, vol. 225, no. 2, June 1967 (1967-06-01), pages 230 - 247, ISSN: 0937-0633 * |
| BERNHARD SCHRADER: "Fortschritte in Der Technik Der Ramanspektroskopie", CHEMIE-ING. TECHN., vol. 39, no. 17, 1 January 1967 (1967-01-01), pages 1008 - 1016, XP055723922 |
| CONFOCAL RAMAN MICROSCOPY-IMAGING IN PHARMACEUTICAL RESEARCH, March 2006 (2006-03-01) |
| ENGLISH TRANSLATION OF D15 |
| ENGLISH TRANSLATION OF D16 |
| JACQUES HAESLER: "Construction of a New Forward and Backward Scattering Raman Optical Activity Spectrometer and Graphical Analysis of Measured and Calculated Spectra for (R)- [2 H1,2H2,2H3]- Neopentane", THESIS, 16 March 2006 (2006-03-16), XP055671402 |
| JOHANSSON ET AL.: "Characterization of different laser irradiation methods for quantitative Raman tablet assessment", JOURNAL OF PHARMACEUTICAL AND BIOCHEMICAL ANALYSIS, vol. 39, 2005, pages 510 - 516, XP005039050 |
| JOHANSSON ET AL.: "Time-Resolved NIR/Vis Spectroscopy for Analysis of Solids: Pharmaceutical Tablets", vol. 56, no. 2, 2002, pages 725 - 7321, XP055671410 |
| KONTOYANNIS C G ET AL: "Quantitative non-destructive determination of salicylic acid acetate in aspirin tablets by Raman spectroscopy", TALANTA, ELSEVIER, AMSTERDAM, NL, vol. 41, no. 11, 1 November 1994 (1994-11-01), pages 1981 - 1984, XP026552396, ISSN: 0039-9140, [retrieved on 19941101], DOI: 10.1016/0039-9140(94)00169-3 * |
| KONTOYANNIS ET AL.: "Quantitative non-destructive determination of salicyclic acid acetate in aspirin tablets by Raman spectroscopy", TALANTA, vol. 41, no. 11, 1994, pages 1981 - 1984, XP026552396 |
| MATOUSEK ET AL.: "Bulk Raman Analysis of Pharmaceutical Tablets", APPLIED SPECTROSCOPY, vol. 60, no. 12, 1 December 2006 (2006-12-01), pages 1353, XP055671399 |
| MATOUSEK ET AL.: "Subsurface probing in diffusely scattering medium using spatially offset Raman spectroscopy", APPLIED SPECTROSCOPY, vol. 59, no. 4, 2005, pages 393 - 400, XP008075254 |
| MYRICK ET AL.: "Elimination of Background in Fiber-Optic Raman Measurements", APPLIED SPECTROSCOPY, vol. 44, no. 4, 1990, pages 565 - 570, XP000116784 |
| POTMA ET AL.: "optics and phonics news", CARS MICROSCOPY FOR BIOLOGY AND MEDICINE, 2004, pages 41 - 45, XP055671406 |
| PURE APPL. CHEM., vol. 69, 31 December 1997 (1997-12-31) - 1997, pages 1451 - 1468, Retrieved from the Internet <URL:http://old.iupac.org/reports/V/spectro/partXVIII.pdf> [retrieved on 20100204] * |
| SCHRADER ET AL., DIE INTERSITAT DES RAMANSPEKTRUMS POLYKRISTALLINER SUBSTANZEN, 2 November 1966 (1966-11-02) |
| SCHRADER ET AL.: "Laser -based molecular spectroscopy for chemical analysis:Raman scattering processes", INTERNATIONAL UNION OF PURE AND APPLIED CHEMISTRY, 1997, XP055671401 |
| THOMAS M. NIEMCZYK, MIRIAM M. DELGADO-LOPEZ, AND FRITZ S. ALLEN: "Quantitative Determination of Bucindolol Concentration in Intact Gel Capsules Using Raman Spectroscopy", ANAL. CHEM., vol. 70, no. 13, 1 July 1998 (1998-07-01), XP093258348, DOI: 10.1021/ac971252u * |
| VANKEIRSBILCK ET AL.: "Applications of Raman spectroscopy in pharmaceutical analysis", TRAC TRENDS IN ANALYTICAL CHEMISTRY, vol. 21, no. 12, 2002, pages 869 - 877, XP004399339 |
Also Published As
| Publication number | Publication date |
|---|---|
| JP2009538156A (en) | 2009-11-05 |
| AU2007232350A1 (en) | 2007-10-11 |
| CN101460091A (en) | 2009-06-17 |
| JP2009536317A (en) | 2009-10-08 |
| EP2010042B1 (en) | 2021-05-26 |
| EP2010042A1 (en) | 2009-01-07 |
| US20090141271A1 (en) | 2009-06-04 |
| CA2648228A1 (en) | 2007-10-11 |
| GB2432661A (en) | 2007-05-30 |
| WO2007113566A2 (en) | 2007-10-11 |
| CA2647730A1 (en) | 2007-10-11 |
| WO2007113581A1 (en) | 2007-10-11 |
| EP2002243A2 (en) | 2008-12-17 |
| GB0616376D0 (en) | 2006-09-27 |
| CN101460831A (en) | 2009-06-17 |
| US8259902B2 (en) | 2012-09-04 |
| EP1952129B1 (en) | 2021-10-27 |
| EP1952129A1 (en) | 2008-08-06 |
| CN101460091B (en) | 2011-12-14 |
| US20090244533A1 (en) | 2009-10-01 |
| US7911604B2 (en) | 2011-03-22 |
| EP3477285B1 (en) | 2025-04-23 |
| US20090238333A1 (en) | 2009-09-24 |
| AU2007232354A1 (en) | 2007-10-11 |
| US8085396B2 (en) | 2011-12-27 |
| GB0618635D0 (en) | 2006-11-01 |
| EP3477285A1 (en) | 2019-05-01 |
| GB0606891D0 (en) | 2006-05-17 |
| WO2007113566A3 (en) | 2007-11-29 |
Similar Documents
| Publication | Publication Date | Title |
|---|---|---|
| EP2002243B1 (en) | Raman analysis | |
| EP1828753B1 (en) | Apparatus for depth-selective raman spectroscopy | |
| Matousek et al. | Noninvasive Raman spectroscopy of human tissue in vivo | |
| EP2130029B1 (en) | Illumination of diffusely scattering media | |
| Matousek | Deep non-invasive Raman spectroscopy of living tissue and powders | |
| Matousek et al. | Bulk Raman analysis of pharmaceutical tablets | |
| US8054463B2 (en) | Method and system for measuring sub-surface composition of a sample | |
| AU2002243137B2 (en) | New measuring technique | |
| AU769370B2 (en) | Method and apparatus for spectrometric analysis of turbid, pharmaceutical samples | |
| Qin et al. | Introduction to Raman chemical imaging technology | |
| Duy et al. | Axially perpendicular offset Raman scheme for reproducible measurement of housed samples in a noncircular container under variation of container orientation | |
| JPH09145619A (en) | Method and instrument for spectroscopic measurement of scattered light and so on | |
| Baria | Multimodal imaging for tissue diagnostics by combined two-photon and Raman microscopy | |
| WO2007060467A1 (en) | Security screening using raman analysis |
Legal Events
| Date | Code | Title | Description |
|---|---|---|---|
| PUAI | Public reference made under article 153(3) epc to a published international application that has entered the european phase |
Free format text: ORIGINAL CODE: 0009012 |
|
| 17P | Request for examination filed |
Effective date: 20080328 |
|
| AK | Designated contracting states |
Kind code of ref document: A2 Designated state(s): AT BE BG CH CY CZ DE DK EE ES FI FR GB GR HU IE IS IT LI LT LU LV MC MT NL PL PT RO SE SI SK TR |
|
| 17Q | First examination report despatched |
Effective date: 20090324 |
|
| DAX | Request for extension of the european patent (deleted) | ||
| RAP1 | Party data changed (applicant data changed or rights of an application transferred) |
Owner name: AGILENT TECHNOLOGIES LDA UK LIMITED |
|
| GRAP | Despatch of communication of intention to grant a patent |
Free format text: ORIGINAL CODE: EPIDOSNIGR1 |
|
| STAA | Information on the status of an ep patent application or granted ep patent |
Free format text: STATUS: GRANT OF PATENT IS INTENDED |
|
| INTG | Intention to grant announced |
Effective date: 20181107 |
|
| GRAS | Grant fee paid |
Free format text: ORIGINAL CODE: EPIDOSNIGR3 |
|
| GRAA | (expected) grant |
Free format text: ORIGINAL CODE: 0009210 |
|
| STAA | Information on the status of an ep patent application or granted ep patent |
Free format text: STATUS: THE PATENT HAS BEEN GRANTED |
|
| AK | Designated contracting states |
Kind code of ref document: B1 Designated state(s): AT BE BG CH CY CZ DE DK EE ES FI FR GB GR HU IE IS IT LI LT LU LV MC MT NL PL PT RO SE SI SK TR |
|
| REG | Reference to a national code |
Ref country code: GB Ref legal event code: FG4D |
|
| REG | Reference to a national code |
Ref country code: CH Ref legal event code: EP Ref country code: AT Ref legal event code: REF Ref document number: 1116350 Country of ref document: AT Kind code of ref document: T Effective date: 20190415 |
|
| REG | Reference to a national code |
Ref country code: DE Ref legal event code: R096 Ref document number: 602007058010 Country of ref document: DE |
|
| REG | Reference to a national code |
Ref country code: IE Ref legal event code: FG4D |
|
| REG | Reference to a national code |
Ref country code: SE Ref legal event code: TRGR |
|
| REG | Reference to a national code |
Ref country code: NL Ref legal event code: MP Effective date: 20190403 |
|
| REG | Reference to a national code |
Ref country code: LT Ref legal event code: MG4D |
|
| REG | Reference to a national code |
Ref country code: AT Ref legal event code: MK05 Ref document number: 1116350 Country of ref document: AT Kind code of ref document: T Effective date: 20190403 |
|
| PG25 | Lapsed in a contracting state [announced via postgrant information from national office to epo] |
Ref country code: NL Free format text: LAPSE BECAUSE OF FAILURE TO SUBMIT A TRANSLATION OF THE DESCRIPTION OR TO PAY THE FEE WITHIN THE PRESCRIBED TIME-LIMIT Effective date: 20190403 |
|
| PG25 | Lapsed in a contracting state [announced via postgrant information from national office to epo] |
Ref country code: CZ Free format text: LAPSE BECAUSE OF FAILURE TO SUBMIT A TRANSLATION OF THE DESCRIPTION OR TO PAY THE FEE WITHIN THE PRESCRIBED TIME-LIMIT Effective date: 20190403 Ref country code: PT Free format text: LAPSE BECAUSE OF FAILURE TO SUBMIT A TRANSLATION OF THE DESCRIPTION OR TO PAY THE FEE WITHIN THE PRESCRIBED TIME-LIMIT Effective date: 20190803 Ref country code: ES Free format text: LAPSE BECAUSE OF FAILURE TO SUBMIT A TRANSLATION OF THE DESCRIPTION OR TO PAY THE FEE WITHIN THE PRESCRIBED TIME-LIMIT Effective date: 20190403 Ref country code: LT Free format text: LAPSE BECAUSE OF FAILURE TO SUBMIT A TRANSLATION OF THE DESCRIPTION OR TO PAY THE FEE WITHIN THE PRESCRIBED TIME-LIMIT Effective date: 20190403 Ref country code: FI Free format text: LAPSE BECAUSE OF FAILURE TO SUBMIT A TRANSLATION OF THE DESCRIPTION OR TO PAY THE FEE WITHIN THE PRESCRIBED TIME-LIMIT Effective date: 20190403 |
|
| PG25 | Lapsed in a contracting state [announced via postgrant information from national office to epo] |
Ref country code: LV Free format text: LAPSE BECAUSE OF FAILURE TO SUBMIT A TRANSLATION OF THE DESCRIPTION OR TO PAY THE FEE WITHIN THE PRESCRIBED TIME-LIMIT Effective date: 20190403 Ref country code: BG Free format text: LAPSE BECAUSE OF FAILURE TO SUBMIT A TRANSLATION OF THE DESCRIPTION OR TO PAY THE FEE WITHIN THE PRESCRIBED TIME-LIMIT Effective date: 20190703 Ref country code: GR Free format text: LAPSE BECAUSE OF FAILURE TO SUBMIT A TRANSLATION OF THE DESCRIPTION OR TO PAY THE FEE WITHIN THE PRESCRIBED TIME-LIMIT Effective date: 20190704 Ref country code: PL Free format text: LAPSE BECAUSE OF FAILURE TO SUBMIT A TRANSLATION OF THE DESCRIPTION OR TO PAY THE FEE WITHIN THE PRESCRIBED TIME-LIMIT Effective date: 20190403 |
|
| REG | Reference to a national code |
Ref country code: BE Ref legal event code: MM Effective date: 20190430 |
|
| REG | Reference to a national code |
Ref country code: DE Ref legal event code: R026 Ref document number: 602007058010 Country of ref document: DE |
|
| PG25 | Lapsed in a contracting state [announced via postgrant information from national office to epo] |
Ref country code: IS Free format text: LAPSE BECAUSE OF FAILURE TO SUBMIT A TRANSLATION OF THE DESCRIPTION OR TO PAY THE FEE WITHIN THE PRESCRIBED TIME-LIMIT Effective date: 20190803 Ref country code: LU Free format text: LAPSE BECAUSE OF NON-PAYMENT OF DUE FEES Effective date: 20190405 Ref country code: AT Free format text: LAPSE BECAUSE OF FAILURE TO SUBMIT A TRANSLATION OF THE DESCRIPTION OR TO PAY THE FEE WITHIN THE PRESCRIBED TIME-LIMIT Effective date: 20190403 |
|
| PLBI | Opposition filed |
Free format text: ORIGINAL CODE: 0009260 |
|
| PLAX | Notice of opposition and request to file observation + time limit sent |
Free format text: ORIGINAL CODE: EPIDOSNOBS2 |
|
| PG25 | Lapsed in a contracting state [announced via postgrant information from national office to epo] |
Ref country code: SK Free format text: LAPSE BECAUSE OF FAILURE TO SUBMIT A TRANSLATION OF THE DESCRIPTION OR TO PAY THE FEE WITHIN THE PRESCRIBED TIME-LIMIT Effective date: 20190403 Ref country code: MC Free format text: LAPSE BECAUSE OF FAILURE TO SUBMIT A TRANSLATION OF THE DESCRIPTION OR TO PAY THE FEE WITHIN THE PRESCRIBED TIME-LIMIT Effective date: 20190403 Ref country code: EE Free format text: LAPSE BECAUSE OF FAILURE TO SUBMIT A TRANSLATION OF THE DESCRIPTION OR TO PAY THE FEE WITHIN THE PRESCRIBED TIME-LIMIT Effective date: 20190403 Ref country code: DK Free format text: LAPSE BECAUSE OF FAILURE TO SUBMIT A TRANSLATION OF THE DESCRIPTION OR TO PAY THE FEE WITHIN THE PRESCRIBED TIME-LIMIT Effective date: 20190403 Ref country code: RO Free format text: LAPSE BECAUSE OF FAILURE TO SUBMIT A TRANSLATION OF THE DESCRIPTION OR TO PAY THE FEE WITHIN THE PRESCRIBED TIME-LIMIT Effective date: 20190403 |
|
| 26 | Opposition filed |
Opponent name: STRAWMAN LIMITED Effective date: 20191220 |
|
| PG25 | Lapsed in a contracting state [announced via postgrant information from national office to epo] |
Ref country code: BE Free format text: LAPSE BECAUSE OF NON-PAYMENT OF DUE FEES Effective date: 20190430 Ref country code: IT Free format text: LAPSE BECAUSE OF FAILURE TO SUBMIT A TRANSLATION OF THE DESCRIPTION OR TO PAY THE FEE WITHIN THE PRESCRIBED TIME-LIMIT Effective date: 20190403 |
|
| PG25 | Lapsed in a contracting state [announced via postgrant information from national office to epo] |
Ref country code: TR Free format text: LAPSE BECAUSE OF FAILURE TO SUBMIT A TRANSLATION OF THE DESCRIPTION OR TO PAY THE FEE WITHIN THE PRESCRIBED TIME-LIMIT Effective date: 20190403 |
|
| PG25 | Lapsed in a contracting state [announced via postgrant information from national office to epo] |
Ref country code: IE Free format text: LAPSE BECAUSE OF NON-PAYMENT OF DUE FEES Effective date: 20190405 |
|
| PG25 | Lapsed in a contracting state [announced via postgrant information from national office to epo] |
Ref country code: SI Free format text: LAPSE BECAUSE OF FAILURE TO SUBMIT A TRANSLATION OF THE DESCRIPTION OR TO PAY THE FEE WITHIN THE PRESCRIBED TIME-LIMIT Effective date: 20190403 |
|
| PLBB | Reply of patent proprietor to notice(s) of opposition received |
Free format text: ORIGINAL CODE: EPIDOSNOBS3 |
|
| PG25 | Lapsed in a contracting state [announced via postgrant information from national office to epo] |
Ref country code: CY Free format text: LAPSE BECAUSE OF FAILURE TO SUBMIT A TRANSLATION OF THE DESCRIPTION OR TO PAY THE FEE WITHIN THE PRESCRIBED TIME-LIMIT Effective date: 20190403 |
|
| PG25 | Lapsed in a contracting state [announced via postgrant information from national office to epo] |
Ref country code: HU Free format text: LAPSE BECAUSE OF FAILURE TO SUBMIT A TRANSLATION OF THE DESCRIPTION OR TO PAY THE FEE WITHIN THE PRESCRIBED TIME-LIMIT; INVALID AB INITIO Effective date: 20070405 Ref country code: MT Free format text: LAPSE BECAUSE OF FAILURE TO SUBMIT A TRANSLATION OF THE DESCRIPTION OR TO PAY THE FEE WITHIN THE PRESCRIBED TIME-LIMIT Effective date: 20190403 |
|
| RDAF | Communication despatched that patent is revoked |
Free format text: ORIGINAL CODE: EPIDOSNREV1 |
|
| APAH | Appeal reference modified |
Free format text: ORIGINAL CODE: EPIDOSCREFNO |
|
| APBM | Appeal reference recorded |
Free format text: ORIGINAL CODE: EPIDOSNREFNO |
|
| APBP | Date of receipt of notice of appeal recorded |
Free format text: ORIGINAL CODE: EPIDOSNNOA2O |
|
| APBQ | Date of receipt of statement of grounds of appeal recorded |
Free format text: ORIGINAL CODE: EPIDOSNNOA3O |
|
| P01 | Opt-out of the competence of the unified patent court (upc) registered |
Effective date: 20230711 |
|
| APBU | Appeal procedure closed |
Free format text: ORIGINAL CODE: EPIDOSNNOA9O |
|
| REG | Reference to a national code |
Ref country code: DE Ref legal event code: R064 Ref document number: 602007058010 Country of ref document: DE Ref country code: DE Ref legal event code: R103 Ref document number: 602007058010 Country of ref document: DE |
|
| RDAE | Information deleted related to despatch of communication that patent is revoked |
Free format text: ORIGINAL CODE: EPIDOSDREV1 |
|
| RDAF | Communication despatched that patent is revoked |
Free format text: ORIGINAL CODE: EPIDOSNREV1 |
|
| PGFP | Annual fee paid to national office [announced via postgrant information from national office to epo] |
Ref country code: SE Payment date: 20250310 Year of fee payment: 19 |
|
| PGFP | Annual fee paid to national office [announced via postgrant information from national office to epo] |
Ref country code: FR Payment date: 20250310 Year of fee payment: 19 |
|
| PGFP | Annual fee paid to national office [announced via postgrant information from national office to epo] |
Ref country code: GB Payment date: 20250306 Year of fee payment: 19 |
|
| PGFP | Annual fee paid to national office [announced via postgrant information from national office to epo] |
Ref country code: DE Payment date: 20250305 Year of fee payment: 19 |
|
| RDAG | Patent revoked |
Free format text: ORIGINAL CODE: 0009271 |
|
| STAA | Information on the status of an ep patent application or granted ep patent |
Free format text: STATUS: PATENT REVOKED |
|
| PGFP | Annual fee paid to national office [announced via postgrant information from national office to epo] |
Ref country code: CH Payment date: 20250501 Year of fee payment: 19 |
|
| REG | Reference to a national code |
Ref country code: CH Ref legal event code: PL |
|
| 27W | Patent revoked |
Effective date: 20250313 |
|
| GBPR | Gb: patent revoked under art. 102 of the ep convention designating the uk as contracting state |
Effective date: 20250313 |
|
| REG | Reference to a national code |
Ref country code: SE Ref legal event code: ECNC |