EP1756717B1 - 2d and 3d display system and method for furnace tube inspection - Google Patents
2d and 3d display system and method for furnace tube inspection Download PDFInfo
- Publication number
- EP1756717B1 EP1756717B1 EP05755505.4A EP05755505A EP1756717B1 EP 1756717 B1 EP1756717 B1 EP 1756717B1 EP 05755505 A EP05755505 A EP 05755505A EP 1756717 B1 EP1756717 B1 EP 1756717B1
- Authority
- EP
- European Patent Office
- Prior art keywords
- data
- furnace
- inspection
- inspection data
- readings
- Prior art date
- Legal status (The legal status is an assumption and is not a legal conclusion. Google has not performed a legal analysis and makes no representation as to the accuracy of the status listed.)
- Expired - Lifetime
Links
Images




Classifications
-
- F—MECHANICAL ENGINEERING; LIGHTING; HEATING; WEAPONS; BLASTING
- F27—FURNACES; KILNS; OVENS; RETORTS
- F27D—DETAILS OR ACCESSORIES OF FURNACES, KILNS, OVENS OR RETORTS, IN SO FAR AS THEY ARE OF KINDS OCCURRING IN MORE THAN ONE KIND OF FURNACE
- F27D21/00—Arrangement of monitoring devices; Arrangement of safety devices
-
- F—MECHANICAL ENGINEERING; LIGHTING; HEATING; WEAPONS; BLASTING
- F27—FURNACES; KILNS; OVENS; RETORTS
- F27D—DETAILS OR ACCESSORIES OF FURNACES, KILNS, OVENS OR RETORTS, IN SO FAR AS THEY ARE OF KINDS OCCURRING IN MORE THAN ONE KIND OF FURNACE
- F27D19/00—Arrangements of controlling devices
-
- G—PHYSICS
- G01—MEASURING; TESTING
- G01N—INVESTIGATING OR ANALYSING MATERIALS BY DETERMINING THEIR CHEMICAL OR PHYSICAL PROPERTIES
- G01N29/00—Investigating or analysing materials by the use of ultrasonic, sonic or infrasonic waves; Visualisation of the interior of objects by transmitting ultrasonic or sonic waves through the object
- G01N29/44—Processing the detected response signal, e.g. electronic circuits specially adapted therefor
- G01N29/4454—Signal recognition, e.g. specific values or portions, signal events, signatures
-
- G—PHYSICS
- G01—MEASURING; TESTING
- G01N—INVESTIGATING OR ANALYSING MATERIALS BY DETERMINING THEIR CHEMICAL OR PHYSICAL PROPERTIES
- G01N2291/00—Indexing codes associated with group G01N29/00
- G01N2291/26—Scanned objects
- G01N2291/263—Surfaces
- G01N2291/2636—Surfaces cylindrical from inside
Definitions
- the present invention relates generally to furnace tube inspection systems, and more particularly to a system and method for displaying inspection data in a two-dimensional and/or three-dimensional format to enable visual detection of problem areas within the furnace.
- a furnace is generally comprised of several hundred to several thousand metres of serpentine tubing that is characterized by straight tube segments (each of which is identified as reference numeral 10) interconnected by angled bends (each of which is identified as reference numeral 20).
- the bends allow tight stacking of the tube segments for maximum heat transfer and efficiency.
- medium length sections of tubing may also be used to interconnect furnace tubing located in different regions of the furnace. These sections of tubing are not part of the furnace geometry, but are employed so that an inspection tool (described below) can be operated in one pass, if possible, and thus significantly reduce plant downtime.
- the plant maintenance personnel need to repair or replace a worn section of the furnace, it is very important to accurately identify which tube segment contains the worn section and where the identified tube segment is located within the furnace. In addition, it is important to obtain information regarding hot spots in the furnace so that the plant maintenance personnel may adjust the furnace to reduce or eliminate the hot spots and thereby prolong the life of the furnace and reduce cost and future plant downtime.
- furnace tube inspection systems have been developed in which an inspection tool (identified as reference numeral 30) is flushed from a launcher (shown in FIG. 1A ) through the furnace (shown in FIG. 1B ) and to a receiver (shown in FIG. 1C ).
- the inspection tool collepts inspection data at pre-determined time intervals as it progresses through the furnace (although the inspection data may alternatively be collected via a position-based collection system).
- the inspection data includes readings of the inside radius of the furnace, readings of the wall thickness of the furnace, and the like.
- the collected inspection data is then extracted from the inspection tool, whereby the various readings are converted to calibrated engineering units. Finally, the converted inspection data may be examined by an engineer in order to identify thinning, bulging and other flaws within the furnace.
- furnace tube inspection systems of the prior art it is difficult to correlate the inspection data collected from the furnace with the physical geometry of the furnace. This is due to the fact that the inspection tool does not progress through the furnace at a constant rate. Instead, the inspection tool will often ebb and flow through the furnace and/or may become momentarily stuck at a point in the structure. Also, the inspection tool may take longer to traverse a bend in the furnace. In addition, the furnace may change in schedule size or diameter and thus retard or promote the passing of the inspection tool.
- the furnace could change from a schedule 40 to a schedule 80 (or vice versa) and thus change the rate of passage of the inspection tool, or, the furnace could change from a 10cm (4-inch) inside diameter to a 15cm (6-inch) inside diameter (or vice versa) and thus change the rate of passage of the inspection tool. All of these conditions generate a correlation (i.e ., mapping or scaling) problem between the collected inspection data and the precise location of the inspection tool with respect to the physical geometry of the furnace. As a result, an engineer may not be able to identify the precise locations of the worn sections and/or hot spots of the furnace.
- a correlation i.e ., mapping or scaling
- the inspection data is not displayed in a manner that readily "announces" problem areas within the furnace.
- the inspection data has been presented in a one-dimensional tabular format, which is deficient in that an engineer must peruse each line of data to determine if a potential problem has arisen. It can be appreciated that this method of examining the inspection data is time-consuming, inefficient, and does not readily permit a comparison between one section of tubing and another. As such, the engineer is not able to readily detect worn sectionsof the furnace, and, cannot determine if hot spots are occurring during the operation of the furnace that are common to a region of the furnace.
- each slice comprises inspection data collected from a short axial section (e.g., less than 30cm (a foot)) of the furnace. While this graphical representation of the inspection data is an improvement over the one-dimensional tabular format described above, the engineer may only view one slice of the inspection data at a time. This is a significant problem when attempting to identify overall trends in the inspection data and then apply them to the real world operation of the plant.
- the present invention provides therefore a system and a method for displaying inspection data collected from a furnace according to claims 1 and 13, respectively.
- a computer-readable medium having computer-executable instruction, which when executed by a computer, cause the computer to perform the method according to the present invention is as well provided.
- the invention provides a processing and display methodology that allows a large amount of inspection data to be correlated with the physical geometry of the furnace.
- the invention provides a convenient method for displaying the inspection data on a single page for rapid assessment of problem areas within the furnace and to facilitate the observation of trends within the inspection data.
- advantages of the invention will be apparent to one skilled in the art.
- the present invention is directed to a furnace tube inspection system for a furnace that comprises a plurality of tube segments connected by a plurality of bends, such as the furnace shown in FIGS. 1A-1C .
- an inspection tool is flushed through the furnace so as to collect inspection data and/or sensor data as the inspection tool progresses through the furnace.
- the inspection data and/or sensor data collected from the furnace may be analyzed to generate a plurality of data markers each of which identifies a physical feature of the furnace.
- the inspection data is then partitioned at the data markers so as to correlate the inspection data to the physical geometry ( e.g ., the appropriate tube segments) of the furnace. It will also be seen that the inspection data is displayed in a manner that enables the visual detection of problem areas within the furnace.
- a variety of different types of physical features may be identified to assist in correlating the inspection data to the physical geometry of the furnace.
- Examples of such physical features include the bends of the furnace, external raised surfaces in the convection section of the furnace (e.g., fins or studs), cross-over piping, thermal wells ( e.g ., Weld-O-Let welded to the pipe with a threaded hole in the middle), welds between two tube segments or between a tube segment and a bend, flanges, schedule changes between two tube segments and/or diameter changes between two tube segments. While the invention will be described in detail hereinbelow with respect to the identification of the furnace bends, it should be understood that many other types of physical features may also be used to correlate the inspection data to the physical geometry of the furnace.
- the inspection tool may include a variety of different devices for collecting inspection data and/or sensor data from the furnace.
- the inspection tool collects the data at a predetermined time-based rate (although the inspection tool could alternatively collect the data using a position-based collection system in which data is collected when the inspection tool has progressed a predetermined distance).
- the data density is determined by the data collection rate and the speed at which the inspection tool progresses through the furnace.
- the data collection rate will range from 30 to 50 Hz per transducer, and the speed of the inspection tool will range from 0.3 to 0.6 m/s (1 to 2 ft/sec) (although the average speed and the instantaneous speed can vary significantly in view of the fact that the inspection tool does not progress through the furnace at a constant rate).
- the speed of the inspection tool will range from 0.3 to 0.6 m/s (1 to 2 ft/sec) (although the average speed and the instantaneous speed can vary significantly in view of the fact that the inspection tool does not progress through the furnace at a constant rate).
- other data collection rates and tool speeds may also be used. Examples of the various types of devices that may be incorporated into the inspection tool will now be described.
- one or more ultrasonic transducers are used to collect inspection data from the furnace (although a single transducer with a rotating mirror may also be used).
- an array of 8, 16, 32, 64 or 128 transducers are positioned around the periphery of the inspection tool, although any number of transducers may be used.
- Each of the transducers is operable to measure the distance between the transducer and the inner wall of the furnace, whereby a plurality of "inside radius readings" are sequentially collected by the transducers as the inspection tool progresses through the furnace.
- Each of the transducers is also operable to measure the wall thickness of the furnace, whereby a plurality of"wall thickness readings" are sequentially collected by the transducers as the inspection tool progresses through the furnace. These readings may be used to detect inner surface anomalies of the furnace, such as pitting, corrosion, deformation and/or cracking of the furnace. It should be understood that the detection of such inner surface anomalies is indicative of problem areas within the furnace.
- the inspection data collected by the ultrasonic transducers is be used to identify the locations of the bends of the furnace and, thus, assist in correlating the inspection data to the physical geometry of the furnace. For example, a decrease in the number of inside radius readings and/or wall thickness readings within a particular time interval may provide a "data clue" as to the location of a bend. Missing data is more likely in a bend due to the fact that one or more of the transducers may not receive sufficient energy when the angle between the transducer and the inner wall of the furnace changes by more than a few degrees. Also, an increase in the variation of the inside radius readings and/or wall thickness readings within a particular time interval may provide another "data clue" as to the location of a bend.
- the readings from a particular transducer are more likely to vary from the readings of the other transducers as the inspection tool traverses a bend.
- the readings may be used to detect a change in the centering of the inspection tool to provide yet another "data clue" as to the location of a bend.
- a laser profilometer is operable to map the inner wall of the furnace by projecting a focused beam of light onto the surface and imaging its movement onto a position sensitive photosensor.
- the laser profilometer rotates as the inspection tool progresses though the furnace, thus creating a helical scan of the inner wall of the furnace.
- the result is a digital, high resolution image of the inner wall of the furnace that provides more accurate inside radius readings (as well as a larger number of inside radius readings for a given surface area) as compared to the ultrasonic transducers described above. These readings may also be used to detect a change in the centering of the inspection tool and, thus, provide "data clues" as to the locations of the bends.
- One or more auxiliary sensors may also be incorporated into the inspection tool for the purpose of collecting sensor data from the furnace.
- the sensor data may also provide "data clues" as to the locations of the bends and, thus, assist in correlating the inspection data to the physical geometry of the furnace.
- the sensor data is preferably collected simultaneously with the inspection data to assure that all of the data can be correlated in time.
- auxiliary sensor that may be used to collect sensor data from the furnace is an axial encoder.
- An axial encoder has roller wheels that contact the inner wall of the furnace and rotate as the inspection tool progresses through the furnace.
- Each output pulse from the axial encoder indicates that the inspection tool has moved a predetermined distance through the furnace (such as 6 or 12 mm (1 ⁇ 4 or 1 ⁇ 2 inch)).
- these output pulses are used to increment a counter that is read at each of the predetermined time intervals, whereby the counter readings are stored in the memory of the inspection tool. It should be understood that these counter readings may be converted to distance readings and then used in combination with the known geometry of the furnace to identify the locations of the bends.
- two axial encoders are employed to provide redundancy in the event that one becomes stuck as the inspection tool progresses through the furnace.
- an axial encoder may not provide an accurate measurement of the location of the inspection tool within the furnace.
- an axial encoder has a position error that is 2% to 4% the length of the furnace. For example, a 3km (10,000 foot) long furnace will typically result in a position error of 61 to 122 m (200 to 400 ft). This position error will not be consistent, but will vary based on the frictional characteristics of different sections of the furnace.
- an axial encoder may not provide accurate "data clues" as to the locations of the bends, other types of auxiliary sensors should preferably be used in conjunction with the axial encoder to assist in identifying the locations of the bends.
- auxiliary sensor that may be used to collect sensor data from the furnace is an accelerometer.
- An accelerometer is operable to detect an acceleration (i.e ., change in speed) of the inspection tool, which is more likely to occur in the bends.
- the voltage of the accelerometer is read at each of the predetermined time intervals, whereby the voltage readings are stored in the memory of the inspection tool. It should be understood that these voltage readings may be converted to acceleration readings to thereby identify the locations of the bends.
- the accelerometer may not provide accurate "data clues" as to the locations of the bends and, as such, other types of auxiliary sensors should preferably be used.
- the devices described above are merely examples of the types of devices that may be incorporated into the inspection tool.
- One skilled in the art will appreciate that many other types of devices could also be used, such as a roll encoder, a gyroscope or an inertial navigation system.
- the number of devices incorporated into the inspection tool may vary from a single device (e.g., a laser profilometer) to several devices (e.g., an array of ultrasonic transducers and several auxiliary sensors).
- System 100 comprises a computer 102 that is programmed to perform various processes (each of which will be described in detail hereinbelow). To perform these processes, computer 102 includes a processor 104 that is operable to execute computer-readable instructions stored on a computer-readable medium.
- the computer-readable instructions are preferably coded using the MatLab programming language, although other programming languages could also be used, such as C, C++, C # and Java.
- the computer-readable medium may comprise any type of computer memory, such as floppy disks, conventional hard disks, CD-ROMS, flash ROMS, nonvolatile ROM and RAM. Examples of computers that are suitable for use with the present invention include personal computers, server computers and multiprocessor computers, although other types of computers could also be used.
- system 100 also comprises a storage device 106, wherein computer 102 is programmed to maintain in storage device 106 a database 108 that identifies various types of relational data.
- the relational data comprises a plurality of time intervals 110 and corresponding inspection data 112 and sensor data 114 that have been downloaded from the memory of the inspection tool during each of the time intervals (as described above).
- the relational data is preferably maintained in a single table within database 108, although other database configurations could also be used.
- computer 102 may include any relational database software that is suitable for maintaining database 108 in storage device 106.
- inspection data 112 comprises a plurality of inspection readings collected from the furnace by an array of eight (8) ultrasonic transducers, namely, eight (8) wall thickness readings 116a-116h and eight (8) inside radius readings 118a-118h for each of time intervals 110.
- Sensor data 114 comprises a plurality of sensor readings collected from the furnace by a pair of axial encoders and an accelerometer, namely, two (2) position readings 120a and 120b and one (1) acceleration reading 122 for each of time intervals 110.
- each of time intervals 110 contains a total of nineteen (19) different readings collected from the furnace during that particular time interval.
- many different types of devices could be incorporated into the inspection tool such that the width of the data set will vary between different applications.
- computer 102 is programmed to generate a display of all of inspection data 112 collected from the furnace.
- a data analyst may then analyze the display of inspection data 112 (preferably in conjunction with sensor data 114) in order to identify the locations of the furnace bends.
- computer 102 is preferably programmed to generate a plurality of data markers that identify the locations of the furnace bends.
- visual indicators of such data markers are shown on the display in relation to inspection data 112.
- Computer 102 may also be programmed to partition inspection data 112 at the data markers so as to correlate inspection data 112 to the appropriate tube segments of the furnace.
- a data analyst may view the display of inspection data 112 to visually detect problem areas within the furnace so that the appropriate tube segments may be repaired or replaced by the plant maintenance personnel. Examples of this approach will be described with reference to "Example 1," “Example 2,” and “Example 3" below.
- computer 102 is programmed to analyze inspection data 112 and then, based upon this analysis, automatically generate a plurality of data markers that identify the locations of the furnace bends.
- Computer 102 is also programmed to partition inspection data 112 at the data markers so as to correlate inspection data 112 to the appropriate tube segments of the furnace.
- Computer 102 is further programmed to generate a display of the partitioned inspection data 112, wherein the display is a two-dimensional or three-dimensional representation of one or more of the tube segments of the furnace.
- a data analyst may view this display to visually detect problem areas within the furnace so that the appropriate tube segments may be repaired or replaced by the plant maintenance personnel. An example of this approach will be described with reference to "Example 4" below.
- the locations of the furnace bends may be identified by detecting one or more "data clues" in inspection data 112 and sensor data 114 collected from the furnace.
- these "data clues” include an increase in the variation of wall thickness readings 116a-116h and/or inside radius readings 118a-118h within a particular time interval 110, a decrease in the number of wall thickness readings 116a-116h and/or inside radius readings 118a-118h within a particular time interval 110, and/or a change in the centering of the inspection tool. All of these conditions are more likely to occur in the furnace bends.
- position readings 120a and 120b may be used to determine the distance traveled by the inspection tool during each of time intervals 110, which may be compared with the known geometry of the furnace to assist in identifying the locations the furnace bends.
- acceleration readings 122 may be used to determine the acceleration of the inspection tool during each of time intervals 110 to thereby assist in identifying the locations of the furnace bends.
- data clues may also be used to identify the locations of the furnace bends in accordance with the present invention.
- the data markers are included within the data set downloaded from the inspection tool.
- one or more of the sensors may be sufficiently reliable so as to detect the location of each physical feature, whereby a "1" in the data set indicates the detection of a physical feature and a "0" in the data set indicates no detection of a physical feature.
- Computer 102 is then programmed to partition inspection data 112 at the data markers so as to correlate inspection data 112 to the physical geometry of the furnace.
- Computer 102 is also programmed to generate a display of the partitioned inspection data 112, wherein the display is a two-dimensional or three-dimensional representation of one or more of the tube segments of the furnace.
- a data analyst may view this display to visually detect problem areas within the furnace so that the appropriate tube segments may be repaired or replaced by the plant maintenance personnel.
- the inspection tool geometry keeps the inspection tool approximately centered in the pipe as the tool traverses the furnace, gravity often causes the inspection tool to ride below the centerline in horizontal pipes.
- the inspection tool has a tendency to push to one side as it enters the bend. If the inspection tool is perfectly centered in a round pipe, each ultrasonic transducer will measure the same distance to the inner wall of the pipe (assuming there is no pitting or corrosion).
- the data set is preferably translated so that the data is displayed as if it had been collected from the centerline of the pipe.
- This centering process may use either the outside surface of the pipe or the inside surface of the pipe as the centering reference. If a data analyst is expecting corrosion on the inner wall of the pipe, the outside surface of the pipe is the preferred centering reference. However, if corrosion is expected on the outer wall of the pipe, the inside surface of the pipe is the preferred centering reference. In either case, the centering process is performed in order to reference the radius data (either inside radius data, or, outside radius data ( i.e ., inside radius plus wall thickness)) from the center of an undamaged pipe so as to visually emphasize problem areas in the furnace.
- the centering process uses the radius data to compute a least squares fit to a circle.
- the radius reading that is furthest from the best fit circle is eliminated.
- the fitting process may then be repeated, whereby the next radius reading that is furthest from the best fit circle is eliminated.
- This fitting process may be further repeated until the remaining radius readings are within a preset threshold from the best fit circle.
- the fitting process generates the x,y location of the center of the pipe relative to the data set and a mean radius for the pipe.
- the original radius values are then translated to the pipe center by a vector addition of the computed x,y location of the center of the pipe with the radius readings. It should be understood that this fitting process can be performed using the inside radius data or the outside radius data.
- the fitting process can be performed with an ellipse instead of a circle.
- This fitting process generates a major diameter, a minor diameter, an x,y location of the center of the pipe, and orientation.
- the fitting process can be extended to a cylinder where more than one slice of data is used in the fitting process.
- computer 102 is programmed to generate a two-dimensional display of the wall thickness readings and/or inside radius readings collected from a furnace, which may be viewed by a data analyst in order to identify the locations of the furnace bends. Then, based upon input from the data analyst, computer 102 is programmed to generate a plurality of data markers on the display to thereby correlate the various readings to the appropriate tube segments of the furnace. After generation of the data markers, the data analyst may view the display in order to visually detect problems areas within the furnace. This example will now be described in greater detail with reference to FIGS. 3 and 4 .
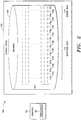
- computer 102 is programmed to generate a strip chart 300 in which all of the wall thickness readings for a plurality of time intervals are plotted across a plurality of horizontal strips.
- the wall thickness readings are plotted successively in time from left-to-right and bottom-to-top.
- the lower left-hand corner of the chart corresponds to the time when the inspection tool leaves the launcher (see FIG. 1A ) and the upper right-hand corner of the chart corresponds to the time when the inspection tool reaches the receiver (see FIG. 1C ).
- the wall thickness readings for each of the time intervals are plotted vertically across the height of the horizontal strips.
- the various wall thickness readings displayed on strip chart 300 are represented in gray scale in accordance with a legend 302. In this example, the wall thickness readings range from 4 to 9mm (0.15 inches to 0.35 inches).
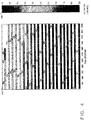
- computer 102 is also programmed to generate a strip chart 400 in which all of the inside radius readings for a plurality of time intervals are plotted across a plurality of horizontal strips. Again, the inside radius readings are plotted successively in time from left-to-right and bottom-to-top, and the inside radius readings for each of the time intervals are plotted vertically across the height of the horizontal strips. It can be seen that the various inside radius readings displayed on strip chart 400 are represented in gray scale in accordance with a legend 402. In this example, the inside radius readings range from 0 to 12.7 cm (0.00 inches to 5.00 inches)
- legends 302 and 402 may be customized as desired for different applications.
- the wall thickness readings and/or inside radius readings may be color-coded (as opposed to represented in gray scale) on the strip charts in order to readily “announce” differences between the various readings shown on the strip charts.
- each horizontal strip represents a 60 second period of time. Assuming that the speed of the inspection tool is 0.6 m/s (2 ft/s) and the data collection rate is 38 Hz per transducer, it can be calculated that each horizontal strip displays the readings collected from 36.6 m (120 feet) of furnace (i.e. 0.6 m/s (2 ft/s) x 60 seconds) over 2,280 different time intervals ( i.e .,38 Hz x 60 seconds). Because of the large number of readings displayed on strip charts 300 and 400, a zoom function is provided that allows a data analyst to examine desired sections of the horizontal strips in greater detail.
- a data analyst analyzes strip chart 300 and/or strip chart 400 in order to identify the locations of the furnace bends.
- the locations of the furnace bends may be identified by visually detecting one or more "data clues" on the strip charts.
- These "data clues” may comprise an increase in the variation of the wall thickness readings and/or inside radius readings within a particular time interval (which will be depicted as different shades of gray across the height of a horizontal strip) and/or a decrease in the number of wall thickness readings and/or inside radius readings within a particular time interval (which will be depicted as white spaces or gaps across the height of a horizontal strip).
- the data analyst will analyze strip chart 300 and/or strip chart 400 in conjunction with a mechanical drawing of the physical layout of the furnace to provide hints as to where the bends or ends of the tube segments should be located.
- the physical geometry of a furnace is not always consistent such that either the wall thickness or the inside radius of the furnace may change from one tube segment to another.
- strip chart 300 it is apparent from strip chart 300 that tube segments 1 through 30 have generally one wall thickness, tube segments 31 through 37 have generally another wall thickness, and tube segments 38 through 47 have generally another wall thickness.
- strip chart 400 it is apparent from strip chart 400 that tube segments 1 through 37 have generally one inside radius, while tube segments 38 through 47 have generally another inside radius.
- the known lengths of the various tube segments may be superimposed upon strip charts 300 and 400 to provide additional guidance in identifying the locations of the bends or ends of the tube segments.
- strip charts 300 and 400 readily "announce" problems areas within the furnace. For example, it is apparent from strip chart 300 that the wall thickness readings vary in tube segments 33 and 34 and to a lesser extent in tube segments 31, 36 and 37 (as shown by the variations in gray color along the length of these tube segments). These variations were immediately apparent with no more than a glance at strip chart 300. Potential problem areas can also be seen from strip chart 400. Using strip charts 300 and 400, the data analyst can determine that one or more of the tube segments are flawed and should be repaired or replaced by the plant maintenance personnel.
- strip charts 300 and 400 are merely examples of the types of displays that may be used to visually detect problem areas within the furnace.
- the wall thickness readings and/or inside radius readings could be displayed as a stacked set of bars wherein each bar represents one tube segment of the furnace.
- the wall thickness readings and/or inside radius readings could be displayed in a three-dimensional format in which the structure of the tube segments matches the actual physical geometry of the furnace.
- other types of displays may also be used in accordance with the present invention.
- computer 102 is programmed to generate a two-dimensional display of the wall thickness readings collected from the convection section of a furnace, whereby the display may be viewed by a data analyst in order to visually detect problems areas within the furnace.
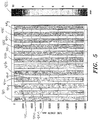
- computer 102 is programmed to generate the chart 410 shown in FIG. 5 , in which all of the wall thickness readings for a plurality of time intervals are plotted across a plurality of vertical bars. Each vertical bar displays the wall thickness readings from a single tube segment. The tube segments are positioned in their proper orientation (but with the connecting bends removed).
- the wall thickness readings displayed on chart 410 are represented in gray scale in accordance with a legend 412, wherein the readings range from 3 mm to 10 mm. It should be understood that the wall thickness readings may alternatively be color-coded (as opposed to represented in gray scale) on chart 410 in order to readily “announce" differences between the various readings shown on the chart.
- a data analyst can determine that the dark speckles on chart 410 are caused by the pins welded on the outside of the tube segments (which are used to increase the heat transfer area). These dark speckles are particularly predominant along the length of the vertical bars 414a-414g.
- the data analyst can also determine that the spaced dark blotches on chart 410 indicate areas of external corrosion on the tube segments. Examples of these spaced dark blotches can be seen at points 416a-416f. In this example, the spacing between these dark blotches indicates that the source of the problem is a slow leaking fixture located above the tube segments that is dripping fluid onto the furnace. Thus, both the problem areas of the furnace and their source can be readily determined from chart 410 of FIG. 5 .
- computer 102 is programmed to generate a two-dimensional display of the wall thickness readings collected from the convection section of another furnace, whereby the display may be viewed by a data analyst in order to visually detect problems areas within the furnace.
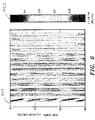
- computer 102 is programmed to generate the chart 420 shown in FIG. 6 , in which all of the wall thickness readings for a plurality of time intervals are plotted across a plurality of vertical bars. Similar to the chart of FIG. 5 , each vertical bar displays the wall thickness readings from a single tube segment, wherein the tube segments are positioned in their proper orientation (but with the connecting bends removed).
- the wall thickness readings displayed on chart 420 are represented in gray scale in accordance with a legend 422, wherein the readings range from 5 to 11mm (0.20 to 0.45 inches).
- the wall thickness readings may alternatively be color-coded (as opposed to represented in gray scale) on chart 420 in order to readily “announce” differences between the various readings shown on the chart.
- the swirling patterns on chart 420 are indicative of general wall thinning caused by flow patterns within the furnace. It should be noted that the swirling patterns are not caused by the rotation of the inspection tool within the furnace because the inside radius readings (not shown) do not indicate such rotation. Also, the inspection tool is typically de-centered in the furnace due to gravity. Thus, if the inspection tool is rotating, the readings of the ultrasonic transducer located closest to the inner wall of the furnace would change (which is not the case here). Thus, in this example, the problem areas caused by the flow patterns within the furnace readily announce themselves on chart o420 f FIG. 6 .
- computer 102 is programmed to analyze inspection data and sensor data collected from a furnace in order to automatically generate a plurality of composite data markers (which are derived from a plurality of individual data markers) that identify the locations of the furnace bends.
- Computer 102 is also programmed to partition the inspection data at the composite data markers to thereby correlate the inspection data to the appropriate tube segments of the furnace.
- Computer 102 is further programmed to generate a display of the partitioned inspection data that may be viewed by a data analyst in order to visually detect problem areas within the furnace. This example will now be described in greater detail with reference to FIGS. 7 , 8 and 9 .
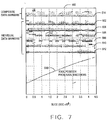
- computer 102 is programmed to generate a chart 500 in which a plurality of individual data markers are plotted on lines 502, 504, 506, 508, 510 and 512 and a plurality of composite data markers are plotted on line 514.
- Computer 102 is programmed to automatically generate the individual data markers on lines 502, 504, 506, 508, 510 and 512 based upon the detection of various "data clues" in the inspection data and sensor data. Each of these lines are described below:
- Computer 102 is also programmed to automatically generate the composite data markers on line 514 by combining the individual data markers shown on lines 502, 504, 506, 508, 510 and 512.
- the individual data markers are normalized so that one data marker does not dominate the other data markers within a particular time interval.
- each of the individual data markers may be normalized by dividing the array element by the maximum value found in the array. Then, the normalized individual data markers are combined using a root mean square calculation to generate the composite data markers (although other types of calculations or algorithms could also be used).
- each of the composite data markers is shown by a spike on line 514, wherein the length of the spike above the line (i.e ., on the positive side of the line) is an indicator of the degree of reliability for that composite data marker.
- the composite data markers provide a higher degree of reliability than any of the individual data markers alone.
- chart 500 also includes line 516, which is a plot of the position of the inspection tool as derived from the integral count from the axial encoders.
- Line 516 may be used to verify that the inspection tool did not become stuck at any point within the furnace. In this example, there are no flat sections along line 516 as would occur if the inspection tool had become stuck. If one or more flat sections were present, a data analyst could manually remove the redundant data collected during that particular time interval.
- computer 102 is also programmed to generate a chart 520 that depicts all of the composite data markers in relation to a predetermined threshold.
- a chart 520 depicts all of the composite data markers in relation to a predetermined threshold.
- all of the composite data markers shown on line 514 of chart 500 are plotted successively in time from left-to-right and top-to-bottom to form line 522 shown on chart 520 ( i.e., the line with the periodic peaks).
- line 524 shown on chart 520 represents a predetermined threshold that may be used to determine if the composite data markers are "valid" indicators of the locations of the furnace bends.
- a composite data marker is "valid" when the peak is located above the predetermined threshold and "invalid" when the peak is located below the predetermined threshold.
- a data analyst may analyze chart 520 in order to modify or "tweak" the algorithm used to generate the predetermined threshold.
- the composite data markers shown in FIGS. 7 and 8 comprise pointers operable to "point to" the positions in the database that correspond to the locations of the furnace bends.
- the composite data markers may be directly embedded within the database, or, may comprise file names for the various inspection data.
- a data analyst may simply use the composite data markers as a guide to partition the inspection data (described below).
- other types of composite data markers may also be used to correlate the inspection data to the physical geometry of the furnace in accordance with the present invention.
- computer 102 is programmed to partition the inspection data at the composite data markers so as to correlate the inspection data to the appropriate tube segments of the furnace.
- Computer 102 is also programmed to generate a display of the partitioned inspection data that may be viewed by a data analyst in order to visually detect problem areas within the furnace.
- This display may comprise a two-dimensional or three-dimensional representation of one or more of the tube segments of the furnace, which may be customized in accordance with customer requirements. For example, one customer may require a display that shows the wall thickness at five equally spaced positions along the length of a specific tube segment, while another customer may require a display that shows the minimum wall thickness for each tube segment of the furnace.
- this information may also be provided to the customer in the form of a written report that accompanies the display.
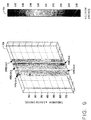
- FIG. 9 An example of a display that may be customized in accordance with particular customer requirements is shown in FIG. 9 .
- This display comprises a three-dimensional chart 700 that depicts the inside radius readings for five different tube segments of interest (with the connecting bends removed).
- the tube segments are displayed in a manner that matches the actual physical geometry of the furnace, and are labeled in accordance with the customer designations for those tube segments ( i.e., PIPE C4-1, PIPE C4-2, PIPE C4-3, PIPE C4-4 and PIPE C4-5).
- the various inside radius readings displayed on chart 700 are represented in gray scale in accordance with a legend 702. In this example, the inside radius readings range from 72 mm (2.86 inches) to 77mm (3.04 inches).
- chart 700 readily "announces" problems areas within the five tube segments of interest For example, it is apparent from chart 700 that that the inside radius readings vary in the tube segments labeled PIPE C4-1, PIPE C4-2, PIPE C4-3 and PIPE C4-5 (as shown by the variations in gray color within these tube segments). These variations were immediately apparent with no more than a glance at chart 700. Thus, using chart 700, a data analyst can determine that one or more of these tube segments are flawed and should be repaired or replaced by the plant maintenance personnel.
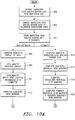
- step 800 the inspection data and sensor data collected from the furnace is extracted from the inspection tool.
- step 802 the extracted inspection data and sensor data is converted to calibrated engineering units. For example, the readings collected by an ultrasonic transducer are converted from time to distance (e.g., mm ( inches)), the readings collected by an axial encoder are converted from counter values to distance (e.g., mm (inches)), and the readings collected by an accelerometer are converted from voltage to acceleration (e.g., m/s2 (ft/sec 2 )).
- step 804 the converted inspection data and sensor data is stored in a database.
- steps 800-804 would not be necessary for the analysis of data sets that have been previously acquired and stored in a database.
- a plurality of data markers are generated that identify the locations of the furnace bends in relation to the inspection data stored in the database.
- the data markers may be generated either "semi-automatically” in steps 806 through 812 or “automatically” in steps 814 through 822.
- step 806 a computer is used to generate a two-dimensional or three-dimensional display that depicts some or all of the inspection data stored in the database (preferably on a single page).
- step 808 a data analyst views and analyzes the display in order to visually detect "data clues" that assist in identifying the locations of the furnace bends.
- step 810 the data analyst inputs information into the computer that identifies the locations of the furnace bends.
- step 812 the computer generates the data markers based upon the input from the data analyst
- a computer is used to analyze the inspection data and sensor data stored in the database in order to automatically generate a plurality of data markers.
- this analysis may comprise generating a plurality of individual data markers based upon the detection of "data clues" in the inspection data and sensor data, normalizing the individual data markers, and then combining the individual data markers to generate a plurality of composite data markers.
- the computer may compare the composite data markers against a predetermined threshold to determine if the composite data markers are "valid" indicators of the locations of the furnace bends.
- the inspection data is partitioned at the data markers so as to correlate the inspection data to the appropriate tube segments of the furnace in step 824.
- the data analyst inputs information relating to the display of the partitioned inspection data. This information may include customer requirements relating to the desired type of display (e.g ., two-dimensional format or three-dimensional format) and the desired tube segments to be displayed ( e.g ., all of the tube segments or specific tube segments).
- the computer generates the display in accordance with the customer requirements.
- the data analyst views and analyzes the display in order to identify overall trends in the inspection data and/or to visually detect problem areas within the furnace.
Landscapes
- Engineering & Computer Science (AREA)
- General Engineering & Computer Science (AREA)
- Mechanical Engineering (AREA)
- Immunology (AREA)
- Physics & Mathematics (AREA)
- Chemical & Material Sciences (AREA)
- Analytical Chemistry (AREA)
- Biochemistry (AREA)
- General Health & Medical Sciences (AREA)
- General Physics & Mathematics (AREA)
- Health & Medical Sciences (AREA)
- Pathology (AREA)
- Life Sciences & Earth Sciences (AREA)
- Signal Processing (AREA)
- Investigating Or Analyzing Materials By The Use Of Ultrasonic Waves (AREA)
- Length Measuring Devices Characterised By Use Of Acoustic Means (AREA)
- Length Measuring Devices With Unspecified Measuring Means (AREA)
- Blast Furnaces (AREA)
- Investigating Materials By The Use Of Optical Means Adapted For Particular Applications (AREA)
- Pipeline Systems (AREA)
Description
- The present invention relates generally to furnace tube inspection systems, and more particularly to a system and method for displaying inspection data in a two-dimensional and/or three-dimensional format to enable visual detection of problem areas within the furnace.
- As depicted in
FIGS. 1A-1C , a furnace is generally comprised of several hundred to several thousand metres of serpentine tubing that is characterized by straight tube segments (each of which is identified as reference numeral 10) interconnected by angled bends (each of which is identified as reference numeral 20). The bends allow tight stacking of the tube segments for maximum heat transfer and efficiency. Although not shown inFIGS. 1A-1C , medium length sections of tubing may also be used to interconnect furnace tubing located in different regions of the furnace. These sections of tubing are not part of the furnace geometry, but are employed so that an inspection tool (described below) can be operated in one pass, if possible, and thus significantly reduce plant downtime. - If the plant maintenance personnel need to repair or replace a worn section of the furnace, it is very important to accurately identify which tube segment contains the worn section and where the identified tube segment is located within the furnace. In addition, it is important to obtain information regarding hot spots in the furnace so that the plant maintenance personnel may adjust the furnace to reduce or eliminate the hot spots and thereby prolong the life of the furnace and reduce cost and future plant downtime.
- In this regard, furnace tube inspection systems have been developed in which an inspection tool (identified as reference numeral 30) is flushed from a launcher (shown in
FIG. 1A ) through the furnace (shown inFIG. 1B ) and to a receiver (shown inFIG. 1C ). Typically, the inspection tool collepts inspection data at pre-determined time intervals as it progresses through the furnace (although the inspection data may alternatively be collected via a position-based collection system). The inspection data includes readings of the inside radius of the furnace, readings of the wall thickness of the furnace, and the like. The collected inspection data is then extracted from the inspection tool, whereby the various readings are converted to calibrated engineering units. Finally, the converted inspection data may be examined by an engineer in order to identify thinning, bulging and other flaws within the furnace. - One problem with the furnace tube inspection systems of the prior art is that it is difficult to correlate the inspection data collected from the furnace with the physical geometry of the furnace. This is due to the fact that the inspection tool does not progress through the furnace at a constant rate. Instead, the inspection tool will often ebb and flow through the furnace and/or may become momentarily stuck at a point in the structure. Also, the inspection tool may take longer to traverse a bend in the furnace. In addition, the furnace may change in schedule size or diameter and thus retard or promote the passing of the inspection tool. For example, the furnace could change from a schedule 40 to a schedule 80 (or vice versa) and thus change the rate of passage of the inspection tool, or, the furnace could change from a 10cm (4-inch) inside diameter to a 15cm (6-inch) inside diameter (or vice versa) and thus change the rate of passage of the inspection tool. All of these conditions generate a correlation (i.e., mapping or scaling) problem between the collected inspection data and the precise location of the inspection tool with respect to the physical geometry of the furnace. As a result, an engineer may not be able to identify the precise locations of the worn sections and/or hot spots of the furnace.
- Another problem with the furnace tube inspection systems of the prior art is that the inspection data is not displayed in a manner that readily "announces" problem areas within the furnace. Conventionally, the inspection data has been presented in a one-dimensional tabular format, which is deficient in that an engineer must peruse each line of data to determine if a potential problem has arisen. It can be appreciated that this method of examining the inspection data is time-consuming, inefficient, and does not readily permit a comparison between one section of tubing and another. As such, the engineer is not able to readily detect worn sectionsof the furnace, and, cannot determine if hot spots are occurring during the operation of the furnace that are common to a region of the furnace.
- Recently, data visualization tools have been developed that allow a slice of the inspection data to be graphically displayed in a two-dimensional format, wherein each slice comprises inspection data collected from a short axial section (e.g., less than 30cm (a foot)) of the furnace. While this graphical representation of the inspection data is an improvement over the one-dimensional tabular format described above, the engineer may only view one slice of the inspection data at a time. This is a significant problem when attempting to identify overall trends in the inspection data and then apply them to the real world operation of the plant.
- Tom Cowling et al: "Innovative furnace inspection system" and Richard D. Roberts: "Advancements in Laser Profilometry Applied to Reformer Tubes for Detection of Creep Damage Provides a Step Change in Steam Methane Reformer (SMR) Management" can be referred to for further background.
- The present invention provides therefore a system and a method for displaying inspection data collected from a furnace according to
claims 1 and 13, respectively. A computer-readable medium having computer-executable instruction, which when executed by a computer, cause the computer to perform the method according to the present invention is as well provided. - The present invention has several advantages over the prior art. For example, the invention provides a processing and display methodology that allows a large amount of inspection data to be correlated with the physical geometry of the furnace. In addition, the invention provides a convenient method for displaying the inspection data on a single page for rapid assessment of problem areas within the furnace and to facilitate the observation of trends within the inspection data. Of course, other advantages of the invention will be apparent to one skilled in the art.
-
-
FIGS. 1A-1C are schematic diagrams of an inspection tool passing from a launcher (shown inFIG. 1A ) through a furnace (shown inFIG. 1B ) and to a receiver (shown inFIG. 1C ); -
FIG. 2 is a block diagram of a computer system for displaying inspection data in accordance with the present invention; -
FIG. 3 is a two-dimensional strip chart generated by the computer system ofFIG. 2 , which shows all of the wall thickness readings collected from a furnace in accordance with a first example of the present invention; -
FIG. 4 is a two-dimensional strip chart generated by the computer system ofFIG. 2 , which shows all of the inside radius readings collected from a furnace in accordance with the first example of the present invention; -
FIG. 5 is a two-dimensional chart generated by the computer system ofFIG. 2 , which shows all of the wall thickness readings collected from a convection section of a furnace in accordance with a second example of the present invention; -
FIG. 6 is a two-dimensional chart generated by the computer system ofFIG. 2 , which shows all of the wall thickness readings collected from a convection section of a furnace in accordance with a third example of the present invention; -
FIG. 7 is a chart generated by the computer system ofFIG. 2 , which shows the individual data markers and composite data markers that may be used to identify the locations of the furnace bends in accordance with a fourth example of the present invention; -
FIG. 8 is a chart generated by the computer system ofFIG. 2 , which shows the composite data markers in relation to an adaptive threshold that may be used to identify the locations of the furnace bends in accordance with the fourth example of the present invention; -
FIG. 9 is a three-dimensional chart generated by the computer system ofFIG. 2 , which shows various tube segments of a furnace with the connecting bends removed in accordance with the fourth example of the present invention; and -
FIGS. 10A and10B are flow charts of a method for displaying inspection data in accordance with the present invention. - The present invention is directed to a furnace tube inspection system for a furnace that comprises a plurality of tube segments connected by a plurality of bends, such as the furnace shown in
FIGS. 1A-1C . In accordance with the invention, an inspection tool is flushed through the furnace so as to collect inspection data and/or sensor data as the inspection tool progresses through the furnace. As will be described in greater detail hereinbelow, the inspection data and/or sensor data collected from the furnace may be analyzed to generate a plurality of data markers each of which identifies a physical feature of the furnace. The inspection data is then partitioned at the data markers so as to correlate the inspection data to the physical geometry (e.g., the appropriate tube segments) of the furnace. It will also be seen that the inspection data is displayed in a manner that enables the visual detection of problem areas within the furnace. - A variety of different types of physical features may be identified to assist in correlating the inspection data to the physical geometry of the furnace. Examples of such physical features include the bends of the furnace, external raised surfaces in the convection section of the furnace (e.g., fins or studs), cross-over piping, thermal wells (e.g., Weld-O-Let welded to the pipe with a threaded hole in the middle), welds between two tube segments or between a tube segment and a bend, flanges, schedule changes between two tube segments and/or diameter changes between two tube segments. While the invention will be described in detail hereinbelow with respect to the identification of the furnace bends, it should be understood that many other types of physical features may also be used to correlate the inspection data to the physical geometry of the furnace.
- The inspection tool may include a variety of different devices for collecting inspection data and/or sensor data from the furnace. Preferably, the inspection tool collects the data at a predetermined time-based rate (although the inspection tool could alternatively collect the data using a position-based collection system in which data is collected when the inspection tool has progressed a predetermined distance). Using a time-based collection system, the data density is determined by the data collection rate and the speed at which the inspection tool progresses through the furnace. In a typical application, the data collection rate will range from 30 to 50 Hz per transducer, and the speed of the inspection tool will range from 0.3 to 0.6 m/s (1 to 2 ft/sec) (although the average speed and the instantaneous speed can vary significantly in view of the fact that the inspection tool does not progress through the furnace at a constant rate). Of course, other data collection rates and tool speeds may also be used. Examples of the various types of devices that may be incorporated into the inspection tool will now be described.
- Typically, one or more ultrasonic transducers are used to collect inspection data from the furnace (although a single transducer with a rotating mirror may also be used). Preferably, an array of 8, 16, 32, 64 or 128 transducers are positioned around the periphery of the inspection tool, although any number of transducers may be used. Each of the transducers is operable to measure the distance between the transducer and the inner wall of the furnace, whereby a plurality of "inside radius readings" are sequentially collected by the transducers as the inspection tool progresses through the furnace. Each of the transducers is also operable to measure the wall thickness of the furnace, whereby a plurality of"wall thickness readings" are sequentially collected by the transducers as the inspection tool progresses through the furnace. These readings may be used to detect inner surface anomalies of the furnace, such as pitting, corrosion, deformation and/or cracking of the furnace. It should be understood that the detection of such inner surface anomalies is indicative of problem areas within the furnace.
- According to the present invention, the inspection data collected by the ultrasonic transducers is be used to identify the locations of the bends of the furnace and, thus, assist in correlating the inspection data to the physical geometry of the furnace. For example, a decrease in the number of inside radius readings and/or wall thickness readings within a particular time interval may provide a "data clue" as to the location of a bend. Missing data is more likely in a bend due to the fact that one or more of the transducers may not receive sufficient energy when the angle between the transducer and the inner wall of the furnace changes by more than a few degrees. Also, an increase in the variation of the inside radius readings and/or wall thickness readings within a particular time interval may provide another "data clue" as to the location of a bend. This is due to the fact that the readings from a particular transducer are more likely to vary from the readings of the other transducers as the inspection tool traverses a bend. In addition, the readings may be used to detect a change in the centering of the inspection tool to provide yet another "data clue" as to the location of a bend.
- Another type of device that may be used to collect inspection data from the furnace is a laser profilometer. A laser profilometer is operable to map the inner wall of the furnace by projecting a focused beam of light onto the surface and imaging its movement onto a position sensitive photosensor. The laser profilometer rotates as the inspection tool progresses though the furnace, thus creating a helical scan of the inner wall of the furnace. The result is a digital, high resolution image of the inner wall of the furnace that provides more accurate inside radius readings (as well as a larger number of inside radius readings for a given surface area) as compared to the ultrasonic transducers described above. These readings may also be used to detect a change in the centering of the inspection tool and, thus, provide "data clues" as to the locations of the bends.
- One or more auxiliary sensors may also be incorporated into the inspection tool for the purpose of collecting sensor data from the furnace. The sensor data may also provide "data clues" as to the locations of the bends and, thus, assist in correlating the inspection data to the physical geometry of the furnace. The sensor data is preferably collected simultaneously with the inspection data to assure that all of the data can be correlated in time.
- One type of auxiliary sensor that may be used to collect sensor data from the furnace is an axial encoder. An axial encoder has roller wheels that contact the inner wall of the furnace and rotate as the inspection tool progresses through the furnace. Each output pulse from the axial encoder indicates that the inspection tool has moved a predetermined distance through the furnace (such as 6 or 12 mm (¼ or ½ inch)). In a time-based collection system, these output pulses are used to increment a counter that is read at each of the predetermined time intervals, whereby the counter readings are stored in the memory of the inspection tool. It should be understood that these counter readings may be converted to distance readings and then used in combination with the known geometry of the furnace to identify the locations of the bends. Preferably, two axial encoders are employed to provide redundancy in the event that one becomes stuck as the inspection tool progresses through the furnace.
- One skilled in the art will understand that an axial encoder may not provide an accurate measurement of the location of the inspection tool within the furnace. Typically, an axial encoder has a position error that is 2% to 4% the length of the furnace. For example, a 3km (10,000 foot) long furnace will typically result in a position error of 61 to 122 m (200 to 400 ft). This position error will not be consistent, but will vary based on the frictional characteristics of different sections of the furnace. Because an axial encoder may not provide accurate "data clues" as to the locations of the bends, other types of auxiliary sensors should preferably be used in conjunction with the axial encoder to assist in identifying the locations of the bends.
- Another type of auxiliary sensor that may be used to collect sensor data from the furnace is an accelerometer. An accelerometer is operable to detect an acceleration (i.e., change in speed) of the inspection tool, which is more likely to occur in the bends. In a time-based collection system, the voltage of the accelerometer is read at each of the predetermined time intervals, whereby the voltage readings are stored in the memory of the inspection tool. It should be understood that these voltage readings may be converted to acceleration readings to thereby identify the locations of the bends. Of course, if the inspection tool is designed to flow reliably through the furnace, the acceleration in the bends may not be significantly different from other accelerations that the inspection tool might encounter. In these instances, the accelerometer may not provide accurate "data clues" as to the locations of the bends and, as such, other types of auxiliary sensors should preferably be used.
- It should be understood that the devices described above (namely, one or more ultrasonic transducers, a laser profilometer, an axial encoder, and an accelerometer) are merely examples of the types of devices that may be incorporated into the inspection tool. One skilled in the art will appreciate that many other types of devices could also be used, such as a roll encoder, a gyroscope or an inertial navigation system. In addition, the number of devices incorporated into the inspection tool may vary from a single device (e.g., a laser profilometer) to several devices (e.g., an array of ultrasonic transducers and several auxiliary sensors).
- Referring now to
FIG. 2 , an exemplary embodiment of a system that may be used in accordance with the present invention is designated generally asreference numeral 100.System 100 comprises acomputer 102 that is programmed to perform various processes (each of which will be described in detail hereinbelow). To perform these processes,computer 102 includes aprocessor 104 that is operable to execute computer-readable instructions stored on a computer-readable medium. The computer-readable instructions are preferably coded using the MatLab programming language, although other programming languages could also be used, such as C, C++, C # and Java. The computer-readable medium may comprise any type of computer memory, such as floppy disks, conventional hard disks, CD-ROMS, flash ROMS, nonvolatile ROM and RAM. Examples of computers that are suitable for use with the present invention include personal computers, server computers and multiprocessor computers, although other types of computers could also be used. - Referring still to
FIG. 2 ,system 100 also comprises astorage device 106, whereincomputer 102 is programmed to maintain in storage device 106 adatabase 108 that identifies various types of relational data. In this embodiment, the relational data comprises a plurality oftime intervals 110 andcorresponding inspection data 112 andsensor data 114 that have been downloaded from the memory of the inspection tool during each of the time intervals (as described above). The relational data is preferably maintained in a single table withindatabase 108, although other database configurations could also be used. It should be understood thatcomputer 102 may include any relational database software that is suitable for maintainingdatabase 108 instorage device 106. - In the exemplary embodiment of
FIG. 2 ,inspection data 112 comprises a plurality of inspection readings collected from the furnace by an array of eight (8) ultrasonic transducers, namely, eight (8)wall thickness readings 116a-116h and eight (8) inside radius readings 118a-118h for each oftime intervals 110.Sensor data 114 comprises a plurality of sensor readings collected from the furnace by a pair of axial encoders and an accelerometer, namely, two (2)position readings 120a and 120b and one (1) acceleration reading 122 for each oftime intervals 110. Thus, it can be seen that each oftime intervals 110 contains a total of nineteen (19) different readings collected from the furnace during that particular time interval. Of course, it should be understood that many different types of devices could be incorporated into the inspection tool such that the width of the data set will vary between different applications. - In accordance with one approach to implementing the present invention,
computer 102 is programmed to generate a display of all ofinspection data 112 collected from the furnace. A data analyst may then analyze the display of inspection data 112 (preferably in conjunction with sensor data 114) in order to identify the locations of the furnace bends. Then, based upon input from the data analyst,computer 102 is preferably programmed to generate a plurality of data markers that identify the locations of the furnace bends. Preferably, visual indicators of such data markers are shown on the display in relation toinspection data 112.Computer 102 may also be programmed to partitioninspection data 112 at the data markers so as to correlateinspection data 112 to the appropriate tube segments of the furnace. Finally, a data analyst may view the display ofinspection data 112 to visually detect problem areas within the furnace so that the appropriate tube segments may be repaired or replaced by the plant maintenance personnel. Examples of this approach will be described with reference to "Example 1," "Example 2," and "Example 3" below. - In accordance with the present invention,
computer 102 is programmed to analyzeinspection data 112 and then, based upon this analysis, automatically generate a plurality of data markers that identify the locations of the furnace bends.Computer 102 is also programmed to partitioninspection data 112 at the data markers so as to correlateinspection data 112 to the appropriate tube segments of the furnace.Computer 102 is further programmed to generate a display of the partitionedinspection data 112, wherein the display is a two-dimensional or three-dimensional representation of one or more of the tube segments of the furnace. Finally, a data analyst may view this display to visually detect problem areas within the furnace so that the appropriate tube segments may be repaired or replaced by the plant maintenance personnel. An example of this approach will be described with reference to "Example 4" below. - With both approaches, the locations of the furnace bends may be identified by detecting one or more "data clues" in
inspection data 112 andsensor data 114 collected from the furnace. Examples of these "data clues" include an increase in the variation ofwall thickness readings 116a-116h and/or inside radius readings 118a-118h within aparticular time interval 110, a decrease in the number ofwall thickness readings 116a-116h and/or inside radius readings 118a-118h within aparticular time interval 110, and/or a change in the centering of the inspection tool. All of these conditions are more likely to occur in the furnace bends. - Also,
position readings 120a and 120b may be used to determine the distance traveled by the inspection tool during each oftime intervals 110, which may be compared with the known geometry of the furnace to assist in identifying the locations the furnace bends. In addition,acceleration readings 122 may be used to determine the acceleration of the inspection tool during each oftime intervals 110 to thereby assist in identifying the locations of the furnace bends. Of course, it should be understood that other types of "data clues" may also be used to identify the locations of the furnace bends in accordance with the present invention. - In accordance with yet another approach to implementing the present invention, the data markers are included within the data set downloaded from the inspection tool. For example, one or more of the sensors may be sufficiently reliable so as to detect the location of each physical feature, whereby a "1" in the data set indicates the detection of a physical feature and a "0" in the data set indicates no detection of a physical feature.
Computer 102 is then programmed to partitioninspection data 112 at the data markers so as to correlateinspection data 112 to the physical geometry of the furnace.Computer 102 is also programmed to generate a display of the partitionedinspection data 112, wherein the display is a two-dimensional or three-dimensional representation of one or more of the tube segments of the furnace. Finally, a data analyst may view this display to visually detect problem areas within the furnace so that the appropriate tube segments may be repaired or replaced by the plant maintenance personnel. - To enhance the ability of a data analyst to visually detect problem areas within the furnace, it is preferable to remove the effects of tool de-centering from the display of the inspection data. Although the tool geometry keeps the inspection tool approximately centered in the pipe as the tool traverses the furnace, gravity often causes the inspection tool to ride below the centerline in horizontal pipes. In addition, when traversing a bend, the inspection tool has a tendency to push to one side as it enters the bend. If the inspection tool is perfectly centered in a round pipe, each ultrasonic transducer will measure the same distance to the inner wall of the pipe (assuming there is no pitting or corrosion). However, if the inspection tool is de-centered, there will be a near-sinusoidal variation in the distance readings collected by each of the ultrasonic transducers around the circumference of the inspection tool. If the de-centering is a significant percentage of the pitting or corrosion to be measured, it is very difficult to accurately determine the pit depth or corrosion by simply looking at the displayed inspection data.
- For this reason, the data set is preferably translated so that the data is displayed as if it had been collected from the centerline of the pipe. This centering process may use either the outside surface of the pipe or the inside surface of the pipe as the centering reference. If a data analyst is expecting corrosion on the inner wall of the pipe, the outside surface of the pipe is the preferred centering reference. However, if corrosion is expected on the outer wall of the pipe, the inside surface of the pipe is the preferred centering reference. In either case, the centering process is performed in order to reference the radius data (either inside radius data, or, outside radius data (i.e., inside radius plus wall thickness)) from the center of an undamaged pipe so as to visually emphasize problem areas in the furnace.
- For round pipes, the centering process uses the radius data to compute a least squares fit to a circle. The radius reading that is furthest from the best fit circle is eliminated. The fitting process may then be repeated, whereby the next radius reading that is furthest from the best fit circle is eliminated. This fitting process may be further repeated until the remaining radius readings are within a preset threshold from the best fit circle. The fitting process generates the x,y location of the center of the pipe relative to the data set and a mean radius for the pipe. The original radius values are then translated to the pipe center by a vector addition of the computed x,y location of the center of the pipe with the radius readings. It should be understood that this fitting process can be performed using the inside radius data or the outside radius data.
- In addition, for oval pipes or where the plant would like to compute the ovality of the pipe, the fitting process can be performed with an ellipse instead of a circle. This fitting process generates a major diameter, a minor diameter, an x,y location of the center of the pipe, and orientation. In addition, the fitting process can be extended to a cylinder where more than one slice of data is used in the fitting process.
- Various examples will now be provided to further describe the furnace tube inspection system of the present invention. These examples are provided merely to illustrate different approaches that may be used to correlate the inspection data to the physical geometry of the furnace and display the inspection data in a manner that enables the visual detection of problem areas within the furnace. Of course, it should be understood that other approaches may also be used and these examples do not in any way limit the scope of the present invention.
- In this example,
computer 102 is programmed to generate a two-dimensional display of the wall thickness readings and/or inside radius readings collected from a furnace, which may be viewed by a data analyst in order to identify the locations of the furnace bends. Then, based upon input from the data analyst,computer 102 is programmed to generate a plurality of data markers on the display to thereby correlate the various readings to the appropriate tube segments of the furnace. After generation of the data markers, the data analyst may view the display in order to visually detect problems areas within the furnace. This example will now be described in greater detail with reference toFIGS. 3 and4 . - Referring to
FIG. 3 ,computer 102 is programmed to generate astrip chart 300 in which all of the wall thickness readings for a plurality of time intervals are plotted across a plurality of horizontal strips. The wall thickness readings are plotted successively in time from left-to-right and bottom-to-top. As such, the lower left-hand corner of the chart corresponds to the time when the inspection tool leaves the launcher (seeFIG. 1A ) and the upper right-hand corner of the chart corresponds to the time when the inspection tool reaches the receiver (seeFIG. 1C ). The wall thickness readings for each of the time intervals are plotted vertically across the height of the horizontal strips. It can be seen that the various wall thickness readings displayed onstrip chart 300 are represented in gray scale in accordance with alegend 302. In this example, the wall thickness readings range from 4 to 9mm (0.15 inches to 0.35 inches). - Referring to
FIG. 4 ,computer 102 is also programmed to generate astrip chart 400 in which all of the inside radius readings for a plurality of time intervals are plotted across a plurality of horizontal strips. Again, the inside radius readings are plotted successively in time from left-to-right and bottom-to-top, and the inside radius readings for each of the time intervals are plotted vertically across the height of the horizontal strips. It can be seen that the various inside radius readings displayed onstrip chart 400 are represented in gray scale in accordance with alegend 402. In this example, the inside radius readings range from 0 to 12.7 cm (0.00 inches to 5.00 inches) - It should be understood that
legends legends - On
strip charts strip charts - In this example, a data analyst analyzes
strip chart 300 and/orstrip chart 400 in order to identify the locations of the furnace bends. As discussed above, the locations of the furnace bends may be identified by visually detecting one or more "data clues" on the strip charts. These "data clues" may comprise an increase in the variation of the wall thickness readings and/or inside radius readings within a particular time interval (which will be depicted as different shades of gray across the height of a horizontal strip) and/or a decrease in the number of wall thickness readings and/or inside radius readings within a particular time interval (which will be depicted as white spaces or gaps across the height of a horizontal strip). - While analyzing
strip chart 300 and/orstrip chart 400, the data analyst moves a mouse across the horizontal strips and marks the locations of the furnace bends by clicking on the appropriate positions on the strip charts. Based upon this input from the data analyst,computer 102 is programmed to generate the data markers and place a roman numeral (signifying the tube segment number) followed by an "x" above the positions marked by the data analyst. The various readings are thus partitioned at the data markers to thereby correlate the readings to the appropriate tube segments of the furnace. - Preferably, the data analyst will analyze
strip chart 300 and/orstrip chart 400 in conjunction with a mechanical drawing of the physical layout of the furnace to provide hints as to where the bends or ends of the tube segments should be located. As noted above, the physical geometry of a furnace is not always consistent such that either the wall thickness or the inside radius of the furnace may change from one tube segment to another. For example, it is apparent fromstrip chart 300 thattube segments 1 through 30 have generally one wall thickness, tube segments 31 through 37 have generally another wall thickness, and tube segments 38 through 47 have generally another wall thickness. Similarly, it is apparent fromstrip chart 400 thattube segments 1 through 37 have generally one inside radius, while tube segments 38 through 47 have generally another inside radius. It should be understood that the known lengths of the various tube segments may be superimposed uponstrip charts - It can be seen that strip charts 300 and 400 readily "announce" problems areas within the furnace. For example, it is apparent from
strip chart 300 that the wall thickness readings vary in tube segments 33 and 34 and to a lesser extent in tube segments 31, 36 and 37 (as shown by the variations in gray color along the length of these tube segments). These variations were immediately apparent with no more than a glance atstrip chart 300. Potential problem areas can also be seen fromstrip chart 400. Usingstrip charts - It should be understood that strip charts 300 and 400 are merely examples of the types of displays that may be used to visually detect problem areas within the furnace. For example, after generation of the data markers, the wall thickness readings and/or inside radius readings could be displayed as a stacked set of bars wherein each bar represents one tube segment of the furnace. Also, the wall thickness readings and/or inside radius readings could be displayed in a three-dimensional format in which the structure of the tube segments matches the actual physical geometry of the furnace. One skilled in the art will understand that other types of displays may also be used in accordance with the present invention.
- In this example,
computer 102 is programmed to generate a two-dimensional display of the wall thickness readings collected from the convection section of a furnace, whereby the display may be viewed by a data analyst in order to visually detect problems areas within the furnace. Specifically,computer 102 is programmed to generate thechart 410 shown inFIG. 5 , in which all of the wall thickness readings for a plurality of time intervals are plotted across a plurality of vertical bars. Each vertical bar displays the wall thickness readings from a single tube segment. The tube segments are positioned in their proper orientation (but with the connecting bends removed). - In this example, the wall thickness readings displayed on
chart 410 are represented in gray scale in accordance with a legend 412, wherein the readings range from 3 mm to 10 mm. It should be understood that the wall thickness readings may alternatively be color-coded (as opposed to represented in gray scale) onchart 410 in order to readily "announce" differences between the various readings shown on the chart. - When viewing all of the tube segments in their proper orientation, a data analyst can determine that the dark speckles on
chart 410 are caused by the pins welded on the outside of the tube segments (which are used to increase the heat transfer area). These dark speckles are particularly predominant along the length of the vertical bars 414a-414g. The data analyst can also determine that the spaced dark blotches onchart 410 indicate areas of external corrosion on the tube segments. Examples of these spaced dark blotches can be seen at points 416a-416f. In this example, the spacing between these dark blotches indicates that the source of the problem is a slow leaking fixture located above the tube segments that is dripping fluid onto the furnace. Thus, both the problem areas of the furnace and their source can be readily determined fromchart 410 ofFIG. 5 . - In this example,
computer 102 is programmed to generate a two-dimensional display of the wall thickness readings collected from the convection section of another furnace, whereby the display may be viewed by a data analyst in order to visually detect problems areas within the furnace. Specifically,computer 102 is programmed to generate thechart 420 shown inFIG. 6 , in which all of the wall thickness readings for a plurality of time intervals are plotted across a plurality of vertical bars. Similar to the chart ofFIG. 5 , each vertical bar displays the wall thickness readings from a single tube segment, wherein the tube segments are positioned in their proper orientation (but with the connecting bends removed). - In this example, the wall thickness readings displayed on
chart 420 are represented in gray scale in accordance with alegend 422, wherein the readings range from 5 to 11mm (0.20 to 0.45 inches). Again, the wall thickness readings may alternatively be color-coded (as opposed to represented in gray scale) onchart 420 in order to readily "announce" differences between the various readings shown on the chart. - When viewing all of the tube segments in their proper orientation, a data analyst can determine that the swirling patterns on
chart 420 are indicative of general wall thinning caused by flow patterns within the furnace. It should be noted that the swirling patterns are not caused by the rotation of the inspection tool within the furnace because the inside radius readings (not shown) do not indicate such rotation. Also, the inspection tool is typically de-centered in the furnace due to gravity. Thus, if the inspection tool is rotating, the readings of the ultrasonic transducer located closest to the inner wall of the furnace would change (which is not the case here). Thus, in this example, the problem areas caused by the flow patterns within the furnace readily announce themselves on chart o420 fFIG. 6 . - In this example,
computer 102 is programmed to analyze inspection data and sensor data collected from a furnace in order to automatically generate a plurality of composite data markers (which are derived from a plurality of individual data markers) that identify the locations of the furnace bends.Computer 102 is also programmed to partition the inspection data at the composite data markers to thereby correlate the inspection data to the appropriate tube segments of the furnace.Computer 102 is further programmed to generate a display of the partitioned inspection data that may be viewed by a data analyst in order to visually detect problem areas within the furnace. This example will now be described in greater detail with reference toFIGS. 7 ,8 and9 . - Referring to
FIG. 7 ,computer 102 is programmed to generate achart 500 in which a plurality of individual data markers are plotted onlines line 514.Computer 102 is programmed to automatically generate the individual data markers onlines -
Line 502 represents the individual data markers generated by detecting a decrease in the number of wall thickness readings within a particular time interval. -
Line 504 represents the individual data markers generated by detecting a decrease in the number of inside radius readings within a particular time interval. -
Line 506 represents the individual data markers generated by detecting an increase in the variation of wall thickness readings within a particular time interval. -
Line 508 represents the individual data markers generated by detecting an increase in the variation of inside radius readings within a particular time interval. -
Line 510 represents the individual data markers generated by detecting the de-centering of the inspection tool within a particular time interval. -
Line 512 represents the individual data markers generated by detecting an acceleration of the inspection tool within a particular time interval. -
Computer 102 is also programmed to automatically generate the composite data markers online 514 by combining the individual data markers shown onlines line 514, wherein the length of the spike above the line (i.e., on the positive side of the line) is an indicator of the degree of reliability for that composite data marker. Of course, it should be understood that the composite data markers provide a higher degree of reliability than any of the individual data markers alone. - It should be noted that
chart 500 also includesline 516, which is a plot of the position of the inspection tool as derived from the integral count from the axial encoders.Line 516 may be used to verify that the inspection tool did not become stuck at any point within the furnace. In this example, there are no flat sections alongline 516 as would occur if the inspection tool had become stuck. If one or more flat sections were present, a data analyst could manually remove the redundant data collected during that particular time interval. - Referring to
FIG. 8 ,computer 102 is also programmed to generate achart 520 that depicts all of the composite data markers in relation to a predetermined threshold. Specifically, all of the composite data markers shown online 514 ofchart 500 are plotted successively in time from left-to-right and top-to-bottom to form line 522 shown on chart 520 (i.e., the line with the periodic peaks). By contrast,line 524 shown onchart 520 represents a predetermined threshold that may be used to determine if the composite data markers are "valid" indicators of the locations of the furnace bends. In other words, a composite data marker is "valid" when the peak is located above the predetermined threshold and "invalid" when the peak is located below the predetermined threshold. - As an example, the predetermined threshold may be generated by: (1) applying a 50 point running average filter in both directions through the composite data markers (C_DataN) to generate a base signal (BaseN), wherein running the filter in both directions removes the time delay; (2) computing a running standard deviation of the composite data markers (C_DataN) with a block size of 1000 to create a standard deviation array (STDArrayN); and (3) computing a threshold array (ThreshN) by adding the base signal (BaseN) to 2.5 times the standard deviation array (STDArrayN) (i.e., ThreshN = BaseN + 2.5∗STDArrayN). One skilled in the art will appreciate that a data analyst may analyze chart 520 in order to modify or "tweak" the algorithm used to generate the predetermined threshold.
- In this example, the composite data markers shown in
FIGS. 7 and8 comprise pointers operable to "point to" the positions in the database that correspond to the locations of the furnace bends. Alternatively, the composite data markers may be directly embedded within the database, or, may comprise file names for the various inspection data. Furthermore, a data analyst may simply use the composite data markers as a guide to partition the inspection data (described below). Of course, other types of composite data markers may also be used to correlate the inspection data to the physical geometry of the furnace in accordance with the present invention. - After generation of the composite data markers,
computer 102 is programmed to partition the inspection data at the composite data markers so as to correlate the inspection data to the appropriate tube segments of the furnace.Computer 102 is also programmed to generate a display of the partitioned inspection data that may be viewed by a data analyst in order to visually detect problem areas within the furnace. This display may comprise a two-dimensional or three-dimensional representation of one or more of the tube segments of the furnace, which may be customized in accordance with customer requirements. For example, one customer may require a display that shows the wall thickness at five equally spaced positions along the length of a specific tube segment, while another customer may require a display that shows the minimum wall thickness for each tube segment of the furnace. Of course, this information may also be provided to the customer in the form of a written report that accompanies the display. - An example of a display that may be customized in accordance with particular customer requirements is shown in
FIG. 9 . This display comprises a three-dimensional chart 700 that depicts the inside radius readings for five different tube segments of interest (with the connecting bends removed). The tube segments are displayed in a manner that matches the actual physical geometry of the furnace, and are labeled in accordance with the customer designations for those tube segments (i.e., PIPE C4-1, PIPE C4-2, PIPE C4-3, PIPE C4-4 and PIPE C4-5). It can be seen that the various inside radius readings displayed onchart 700 are represented in gray scale in accordance with alegend 702. In this example, the inside radius readings range from 72 mm (2.86 inches) to 77mm (3.04 inches). - It can be seen that
chart 700 readily "announces" problems areas within the five tube segments of interest For example, it is apparent fromchart 700 that that the inside radius readings vary in the tube segments labeled PIPE C4-1, PIPE C4-2, PIPE C4-3 and PIPE C4-5 (as shown by the variations in gray color within these tube segments). These variations were immediately apparent with no more than a glance atchart 700. Thus, usingchart 700, a data analyst can determine that one or more of these tube segments are flawed and should be repaired or replaced by the plant maintenance personnel. - Referring to the flow charts of
FIGS. 10A and10B , an exemplary embodiment of the method of the present invention will now be described with reference to steps 800-830. First, instep 800, the inspection data and sensor data collected from the furnace is extracted from the inspection tool. Next, instep 802, the extracted inspection data and sensor data is converted to calibrated engineering units. For example, the readings collected by an ultrasonic transducer are converted from time to distance (e.g., mm (inches)), the readings collected by an axial encoder are converted from counter values to distance (e.g., mm (inches)), and the readings collected by an accelerometer are converted from voltage to acceleration (e.g., m/s2 (ft/sec2)). The conversions for other, types of readings will be apparent to one skilled in the ait Then, instep 804, the converted inspection data and sensor data is stored in a database. Of course, it should be understood that steps 800-804 would not be necessary for the analysis of data sets that have been previously acquired and stored in a database. - Next, a plurality of data markers are generated that identify the locations of the furnace bends in relation to the inspection data stored in the database. The data markers may be generated either "semi-automatically" in
steps 806 through 812 or "automatically" insteps 814 through 822. - Using the "semi-automatic" approach, in
step 806, a computer is used to generate a two-dimensional or three-dimensional display that depicts some or all of the inspection data stored in the database (preferably on a single page). Instep 808, a data analyst views and analyzes the display in order to visually detect "data clues" that assist in identifying the locations of the furnace bends. Then, instep 810, the data analyst inputs information into the computer that identifies the locations of the furnace bends. Finally, instep 812, the computer generates the data markers based upon the input from the data analyst - Using the "automatic" approach, in
step 814, a computer is used to analyze the inspection data and sensor data stored in the database in order to automatically generate a plurality of data markers. As shown insteps 816 through 820, this analysis may comprise generating a plurality of individual data markers based upon the detection of "data clues" in the inspection data and sensor data, normalizing the individual data markers, and then combining the individual data markers to generate a plurality of composite data markers. Then, instep 822, the computer may compare the composite data markers against a predetermined threshold to determine if the composite data markers are "valid" indicators of the locations of the furnace bends. - Once the data markers have been generated (either "semi-automatically" in
steps 806 through 812 or "automatically" insteps 814 through 822), the inspection data is partitioned at the data markers so as to correlate the inspection data to the appropriate tube segments of the furnace instep 824. Then, instep 826, the data analyst inputs information relating to the display of the partitioned inspection data. This information may include customer requirements relating to the desired type of display (e.g., two-dimensional format or three-dimensional format) and the desired tube segments to be displayed (e.g., all of the tube segments or specific tube segments). Instep 828, the computer generates the display in accordance with the customer requirements. Finally, instep 830, the data analyst views and analyzes the display in order to identify overall trends in the inspection data and/or to visually detect problem areas within the furnace. - While the present invention has been described and illustrated hereinabove with reference to exemplary embodiments, it should be understood that various modifications could be made to these embodiments without departing from the scope of the invention. Therefore, the invention is not to be limited to the exemplary embodiments described and illustrated hereinabove, except insofar as such limitations are included in the following claims.
Claims (31)
- A system for displaying inspection data collected from a furnace with a specified physical geometry, wherein said furnace comprises a plurality of tube segments (10) interconnected by a plurality of bends (20) so as to allow stacking of said tube segments (10), said system comprising:an inspection tool (30) configured to collect inspection data comprising a plurality of inside radius and/or wall thickness readings and configured to be flushed through the furnace;a storage device (106) for storing said inspection data; anda computer (102);
characterized in that the inspection tool (30) comprisesan array of ultrasonic transducers ora single transducer with a rotating mirror; andwherein the computer (102) is programmed to:generate data markers based upon an analysis of the inspection data collected from the furnace, each of which data markers identifies a location of a physical feature of said furnace;partition said inspection data at the data markers so as to correlate said inspection data to said physical geometry of said furnace; andgenerate a display of said partitioned inspection data arranged to represent said physical geometry of a plurality of said tube segments (10) to thereby enable visual detection of a problem area comprising one or more of said tube segments (10) within said furnace. - The system of Claim 1, wherein said display is comprised of a two-dimensional representation of one or more tube segments (10) of said furnace.
- The system of Claim 2, wherein said display comprises a plurality of two-dimensional bars arranged side-by-side, each bar displaying inspection data for a respective single tube segment of said plurality of tube segments (10).
- The system of Claim 1, wherein said display is comprised of a three- dimensional representation of one or more tube segments (10) of said furnace.
- The system of Claim 4, wherein said display comprises a plurality of three-dimensional bars arranged side-by-side, each bar displaying inspection data for a respective single tube segment of said plurality of tube segments (10).
- The system of any preceding claim, wherein said computer (102) is further programmed to generate said data markers based upon input from a data analyst.
- The system of any of claims 1 to 6, wherein said computer (102) is further programmed to analyze said inspection data and generate said data markers based upon said analysis of said inspection data.
- The system of any preceding claim, wherein said storage device (106) is configured to store sensor data collected from said furnace.
- The system of Claim 8, wherein said sensor data comprises a plurality of readings collected by one or more auxiliary sensors selected from the following group: an axial encoder, an accelerometer, a roll encoder, a gyroscope, an inertial navigation system, and combinations thereof.
- The system of any preceding claim, wherein said computer (102) is further programmed to generate said data markers, and wherein each of said data markers comprises a composite data marker derived from a plurality of individual data markers.
- The system of Claim 10, wherein said computer (102) is programmed to: generate said individual data markers; normalize said individual data markers; and generate said composite data marker by calculating a root mean square of said normalized individual data markers.
- The system of any preceding claim, wherein each of said physical features of said furnace is selected from the following group: a bend; an external raised surface; cross-over piping; a thermal well; a weld; a flange; a schedule change; a diameter change; and combinations thereof.
- A computerized method for displaying inspection data collected by an inspection tool (30) from a furnace with a specified physical geometry, wherein said furnace comprises a plurality of tube segments (10) interconnected by a plurality of bends (20) so as to allow stacking of said tube segments (10) and said inspection data comprises a plurality of inside radius and/or wall thickness readings, said method comprising:generating data markers based upon an analysis of the inspection data collected from the furnace, each of which data markers identifies a location of a physical feature of said furnace;partitioning said inspection data at a plurality of data markers so as to correlate said inspection data to said physical geometry of said furnace;generating a display of said partitioned inspection data arranged to represent said physical geometry of a plurality of said tube segments (10) to thereby enable visual detection of a problem area comprising one or more of said tube segments (10) within said furnace; andwherein said inspection data is collected by one or more ultrasonic transducers.
- The method of claim 13, wherein inspection data is additionally collected by a laser profilometer.
- The method of Claim 13 or claim 14, wherein said display is comprised of a two-dimensional representation of one or more tube segments (10) of said furnace.
- The method of Claim 15, wherein said display comprises a plurality of two-dimensional bars arranged side-by-side, each bar displaying inspection data for a respective single tube segment of said plurality of tube segments (10).
- The method of Claim 13 or claim 14, wherein said display is comprised of a three-dimensional representation of one or more tube segments (10) of said furnace.
- The method of Claim 17, wherein said display comprises a plurality of three-dimensional bars arranged side-by-side, each bar displaying inspection data for a respective single tube segment of said plurality of tube segments (10).
- The method of any one of Claims 13 to 18, further comprising receiving input from a data analyst and generating said data markers based upon said input from said data analyst.
- The method of any one of Claims 13 to 18, further comprising analyzing said inspection data and generating said data markers based upon said analysis of said inspection data.
- The method of any of claims 13 to 20, wherein said inspection data comprises a plurality of readings selected from the following group: wall thickness readings of said furnace, inside radius readings of said furnace, and combinations thereof.
- The method of Claims 13 to 21, wherein said inspection data is collected at predetermined time intervals within said furnace.
- The method of Claim 22, wherein said inspection data comprises a plurality of said readings within each of said time intervals.
- The method of Claim 23, wherein each of said data markers is generated by detecting a data clue selected from the following group: an increase in the variation of said wall thickness readings within one of said time intervals, a decrease in the number of said wall thickness readings within one of said time intervals, an increase in the variation of said inside radius readings within one of said time intervals, a decrease in the number of said inside radius readings within one of said time intervals, a change in the centering of said inspection tool (30), and combinations thereof.
- The method of Claims 13 to 24, further comprising analyzing sensor data collected from said furnace and generating said data markers based upon said analysis of said sensor data.
- The method of Claim 25, wherein said sensor data comprises a plurality of readings collected by one or more auxiliary sensors selected from the following group: an axial encoder, an accelerometer, a roll encoder, a gyroscope, an inertial navigation system, and combinations thereof.
- The method of any of Claims 13 to 26, wherein each of said data markers comprises a composite data marker derived from a plurality of individual data markers.
- The method of Claim 27, further comprising: generating said individual data markers; normalizing said individual data markers; and generating said composite data marker by calculating a root mean square of said normalized individual data markers.
- The method of any of Claims 13 to 28, wherein each of said physical features of said furnace is selected from the following group: a bend; an external raised surface; cross-over piping; a thermal well; a weld; a flange; a schedule change; a diameter change; and combinations thereof.
- The method of Claim 13, further comprising the step of identifying said bends (20) of said furnace in relation to said inspection data; and wherein the step of partitioning said inspection data comprises partitioning said inspection data at said bends (20) so as to correlate said inspection data to an appropriate one of said tube segments (10) of said furnace.
- A computer-readable medium having computer-executable instructions, which when executed by a computer, cause the computer to perform a method for displaying inspection data according to any one of claims 13 to 30.
Applications Claiming Priority (2)
| Application Number | Priority Date | Filing Date | Title |
|---|---|---|---|
| US57627604P | 2004-06-01 | 2004-06-01 | |
| PCT/US2005/019250 WO2005119567A2 (en) | 2004-06-01 | 2005-06-01 | 2d and 3d display system and method for furnace tube inspection |
Publications (3)
| Publication Number | Publication Date |
|---|---|
| EP1756717A2 EP1756717A2 (en) | 2007-02-28 |
| EP1756717A4 EP1756717A4 (en) | 2014-02-12 |
| EP1756717B1 true EP1756717B1 (en) | 2019-09-11 |
Family
ID=35463584
Family Applications (1)
| Application Number | Title | Priority Date | Filing Date |
|---|---|---|---|
| EP05755505.4A Expired - Lifetime EP1756717B1 (en) | 2004-06-01 | 2005-06-01 | 2d and 3d display system and method for furnace tube inspection |
Country Status (12)
| Country | Link |
|---|---|
| US (1) | US7542874B2 (en) |
| EP (1) | EP1756717B1 (en) |
| JP (1) | JP2008505308A (en) |
| CN (1) | CN100474264C (en) |
| AU (1) | AU2005251220B2 (en) |
| BR (1) | BRPI0511763B1 (en) |
| CA (1) | CA2568174C (en) |
| ES (1) | ES2760674T3 (en) |
| MX (1) | MXPA06013988A (en) |
| RU (1) | RU2392658C2 (en) |
| WO (1) | WO2005119567A2 (en) |
| ZA (1) | ZA200609598B (en) |
Families Citing this family (13)
| Publication number | Priority date | Publication date | Assignee | Title |
|---|---|---|---|---|
| ES2760674T3 (en) | 2004-06-01 | 2020-05-14 | Quest Integrity Usa Llc | 2D and 3D visualization system and method for the inspection of a furnace tube |
| US20090312986A1 (en) * | 2008-06-13 | 2009-12-17 | Geospatial Holdings, Inc. | Method and System for Determining Specified Data Related to Underground Installations |
| WO2010009367A1 (en) * | 2008-07-18 | 2010-01-21 | Geospatial Holdings, Inc. | Method, apparatus, and system for determining accurate location data related to underground installations |
| WO2010014581A2 (en) * | 2008-07-28 | 2010-02-04 | Geospatial Holdings, Inc. | Method, apparatus, and system for non-invasive monitoring of underground installations |
| US8300880B2 (en) * | 2009-06-05 | 2012-10-30 | Ali Esmaili | System and method for temperature data acquisition |
| US8219247B2 (en) * | 2009-11-19 | 2012-07-10 | Air Products And Chemicals, Inc. | Method of operating a furnace |
| US9201046B2 (en) | 2011-08-30 | 2015-12-01 | Georgia Tech Research Corporation | Weld analysis using laser generated narrowband Lamb waves |
| CN102339241A (en) * | 2011-09-01 | 2012-02-01 | 中国航空工业第六一八研究所 | Method for preventing backup machine from mistakenly taking over control right of host bus |
| CA2873505C (en) | 2012-03-30 | 2020-07-14 | Atomic Energy Of Canada Limited | Support structure detection |
| CN103925473B (en) * | 2014-04-25 | 2018-01-12 | 华能南京金陵发电有限公司 | The explosion-proof three-dimension monitor system of four main tubes of boiler abrasionproof |
| US10279380B2 (en) | 2016-04-29 | 2019-05-07 | Chevron Phillips Chemical Company Lp | Cleaning coke deposits from process equipment |
| US10746470B2 (en) * | 2017-06-29 | 2020-08-18 | Air Products & Chemicals, Inc. | Method of operating a furnace |
| CN115755717B (en) * | 2022-11-29 | 2023-08-29 | 潮州市索力德机电设备有限公司 | Kiln equipment operation detecting system based on thing networking |
Citations (3)
| Publication number | Priority date | Publication date | Assignee | Title |
|---|---|---|---|---|
| US1756717A (en) | 1928-04-27 | 1930-04-29 | Gustav Wiedeke Company | Wrench |
| US20020011124A1 (en) | 2000-05-17 | 2002-01-31 | John Phipps | Pipeline pig |
| EP1756717A2 (en) | 2004-06-01 | 2007-02-28 | Quest Trutec, LP | 2d and 3d display system and method for furnace tube inspection |
Family Cites Families (19)
| Publication number | Priority date | Publication date | Assignee | Title |
|---|---|---|---|---|
| US5125745A (en) * | 1987-09-30 | 1992-06-30 | Armco Inc. | Automatic BOF vessel remaining lining profiler and method |
| US4893933A (en) * | 1987-09-30 | 1990-01-16 | Armco Inc. | Automatic BOF vessel remaining lining profiler and method |
| RU1528177C (en) * | 1987-12-21 | 1995-12-10 | Научно-производственная фирма "Геофизика" | Porosity simulator |
| US5247154A (en) * | 1991-01-17 | 1993-09-21 | Westinghouse Electric Corp. | Method and apparatus for monitoring the laser marking of a bar code label |
| JPH04364499A (en) * | 1991-06-11 | 1992-12-16 | Toshiba Corp | Preventive maintenance support system fo control rod driving mechanism |
| JP2531488B2 (en) * | 1993-08-10 | 1996-09-04 | 株式会社機動技研 | In-pipe measurement method |
| JP3174673B2 (en) * | 1993-10-19 | 2001-06-11 | 株式会社竹中工務店 | Progress management system |
| JPH10207900A (en) * | 1997-01-21 | 1998-08-07 | Hitachi Ltd | Book and equipment data management system using virtual equipment |
| JP3550984B2 (en) * | 1997-12-01 | 2004-08-04 | 株式会社日立製作所 | Pipe inspection equipment |
| US6359434B1 (en) * | 1998-09-30 | 2002-03-19 | Hydroscope Cananda Inc. | Method and system for determining pipeline circumferential and non-circumferential wall loss defects in a water pipeline |
| NL1011525C2 (en) * | 1999-03-11 | 2000-09-12 | A Hak Ind Services B V | Device for internal inspection of pipes and tubes or the like. |
| JP4113654B2 (en) * | 2000-05-10 | 2008-07-09 | 株式会社東芝 | Laser ultrasonic inspection equipment |
| JP3630617B2 (en) * | 2000-05-12 | 2005-03-16 | Jfeプラント&サービス株式会社 | Thickness measuring device and thickness measuring method |
| JP2002310653A (en) * | 2001-04-12 | 2002-10-23 | Kansai Electric Power Co Inc:The | Underground equipment drawing creation apparatus, method and recording medium storing underground equipment drawing creation program |
| RU2209796C1 (en) * | 2001-12-26 | 2003-08-10 | Федеральное государственное унитарное предприятие "Всероссийский научно-исследовательский институт авиационных материалов" | Thermal stability testing apparatus for structural ceramics |
| JP4149179B2 (en) * | 2002-03-05 | 2008-09-10 | 東京都下水道サービス株式会社 | Endotracheal examination diagnosis support device, intratracheal inspection diagnosis support method, and storage medium storing intratracheal inspection diagnosis support program |
| US7010759B2 (en) * | 2002-04-05 | 2006-03-07 | U-Tech Enviromental Manufacturing Supply, Inc. | Method for real time display of maintenance device location in an internal space |
| JP3691454B2 (en) * | 2002-05-14 | 2005-09-07 | 服部測量設計株式会社 | Ground displacement positioning system |
| US6745136B2 (en) | 2002-07-02 | 2004-06-01 | Varco I/P, Inc. | Pipe inspection systems and methods |
-
2005
- 2005-06-01 ES ES05755505T patent/ES2760674T3/en not_active Expired - Lifetime
- 2005-06-01 CN CNB2005800178732A patent/CN100474264C/en not_active Expired - Fee Related
- 2005-06-01 MX MXPA06013988A patent/MXPA06013988A/en active IP Right Grant
- 2005-06-01 EP EP05755505.4A patent/EP1756717B1/en not_active Expired - Lifetime
- 2005-06-01 AU AU2005251220A patent/AU2005251220B2/en not_active Ceased
- 2005-06-01 WO PCT/US2005/019250 patent/WO2005119567A2/en not_active Ceased
- 2005-06-01 JP JP2007515533A patent/JP2008505308A/en active Pending
- 2005-06-01 US US11/142,776 patent/US7542874B2/en not_active Expired - Lifetime
- 2005-06-01 CA CA002568174A patent/CA2568174C/en not_active Expired - Fee Related
- 2005-06-01 BR BRPI0511763A patent/BRPI0511763B1/en not_active IP Right Cessation
- 2005-06-01 RU RU2006147273/09A patent/RU2392658C2/en not_active IP Right Cessation
-
2006
- 2006-11-17 ZA ZA200609598A patent/ZA200609598B/en unknown
Patent Citations (3)
| Publication number | Priority date | Publication date | Assignee | Title |
|---|---|---|---|---|
| US1756717A (en) | 1928-04-27 | 1930-04-29 | Gustav Wiedeke Company | Wrench |
| US20020011124A1 (en) | 2000-05-17 | 2002-01-31 | John Phipps | Pipeline pig |
| EP1756717A2 (en) | 2004-06-01 | 2007-02-28 | Quest Trutec, LP | 2d and 3d display system and method for furnace tube inspection |
Non-Patent Citations (3)
| Title |
|---|
| "Fired heater inspection services", I.C.E, 27 March 2015 (2015-03-27), pages 1 - 8, XP055646802 |
| RICHARD D. ROBERTS: "Advancements In Laser Profilometry Applied To Reformer Tubes For Detection Of Creep Damage Provides A Step Change In Steam Methane Reformer (SMR) Management", NDT.NET, vol. 9, no. 9, 30 September 2003 (2003-09-30), pages 1 - 7, XP055116920 * |
| RICHARD D. ROBERTS: "intelligent pigging technology to inspect process heaters colis", INSPECTIONEERING JOURNAL, 200412200, XP055646797 |
Also Published As
| Publication number | Publication date |
|---|---|
| JP2008505308A (en) | 2008-02-21 |
| AU2005251220A1 (en) | 2005-12-15 |
| CA2568174A1 (en) | 2005-12-15 |
| EP1756717A4 (en) | 2014-02-12 |
| BRPI0511763A (en) | 2008-01-08 |
| CN100474264C (en) | 2009-04-01 |
| ES2760674T3 (en) | 2020-05-14 |
| WO2005119567A3 (en) | 2006-10-19 |
| WO2005119567A2 (en) | 2005-12-15 |
| BRPI0511763B1 (en) | 2017-06-06 |
| WO2005119567B1 (en) | 2007-01-04 |
| RU2006147273A (en) | 2008-07-20 |
| AU2005251220B2 (en) | 2010-02-11 |
| CA2568174C (en) | 2009-09-08 |
| US20050267703A1 (en) | 2005-12-01 |
| CN1981267A (en) | 2007-06-13 |
| MXPA06013988A (en) | 2007-05-15 |
| US7542874B2 (en) | 2009-06-02 |
| RU2392658C2 (en) | 2010-06-20 |
| EP1756717A2 (en) | 2007-02-28 |
| ZA200609598B (en) | 2008-04-30 |
Similar Documents
| Publication | Publication Date | Title |
|---|---|---|
| AU2005251220B2 (en) | 2D and 3D display system and method for furnace tube inspection | |
| CA2559170C (en) | Method for inspection of metal tubular goods | |
| CN105115976B (en) | A kind of rail abrasion defect detecting system and method | |
| US6925145B2 (en) | High speed digital radiographic inspection of piping | |
| RU2719177C2 (en) | Inspection of pipe section and flaw detector | |
| ES3058500T3 (en) | Method for steam generator tube analysis for detection of tube degradation | |
| JP6512157B2 (en) | Thickness measurement apparatus, thickness evaluation apparatus, thickness measurement method and thickness evaluation method | |
| JP5083821B2 (en) | Corrosion state inspection method for conduit using inspection device with ultrasonic sensor and conduit structure suitable for application of corrosion state inspection method | |
| JP2024139952A (en) | Evaluation method | |
| KR20070030850A (en) | 2-D and 3-D Display Systems and Methods for Furnace Tube Inspection | |
| JP2012159209A (en) | Inspection system and inspection method for heat transfer pipe | |
| WO2009152505A2 (en) | Method and system for determining specified data related to underground installations | |
| JP2501237B2 (en) | Device for measuring outer diameter and wall thickness of steel pipe ends | |
| KR101516599B1 (en) | Maintenance and physical examination system for sewer pipe with GIS | |
| CN118968313B (en) | Engineering safety supervision system and method based on artificial intelligence | |
| Bruce | The Inertial Geometry Pig | |
| CN120232376A (en) | A method for detecting and evaluating corrosion of the wall panels of vertical atmospheric pressure storage tanks | |
| Kinley | New Developments in Calipering Heat Exchanger Tubes | |
| JP2005300301A (en) | Bend measuring method and instrument for rod-like body |
Legal Events
| Date | Code | Title | Description |
|---|---|---|---|
| PUAI | Public reference made under article 153(3) epc to a published international application that has entered the european phase |
Free format text: ORIGINAL CODE: 0009012 |
|
| 17P | Request for examination filed |
Effective date: 20061207 |
|
| AK | Designated contracting states |
Kind code of ref document: A2 Designated state(s): AT BE BG CH CY CZ DE DK EE ES FI FR GB GR HU IE IS IT LI LT LU MC NL PL PT RO SE SI SK TR |
|
| AX | Request for extension of the european patent |
Extension state: AL BA HR LV MK YU |
|
| REG | Reference to a national code |
Ref country code: HK Ref legal event code: DE Ref document number: 1097625 Country of ref document: HK |
|
| DAX | Request for extension of the european patent (deleted) | ||
| RAP1 | Party data changed (applicant data changed or rights of an application transferred) |
Owner name: QUEST INTEGRITY USA, LLC |
|
| A4 | Supplementary search report drawn up and despatched |
Effective date: 20140113 |
|
| RIC1 | Information provided on ipc code assigned before grant |
Ipc: G06F 11/30 20060101AFI20140107BHEP Ipc: G01N 29/44 20060101ALI20140107BHEP |
|
| 17Q | First examination report despatched |
Effective date: 20140513 |
|
| STAA | Information on the status of an ep patent application or granted ep patent |
Free format text: STATUS: EXAMINATION IS IN PROGRESS |
|
| TPAC | Observations filed by third parties |
Free format text: ORIGINAL CODE: EPIDOSNTIPA |
|
| REG | Reference to a national code |
Ref country code: DE Ref legal event code: R079 Ref document number: 602005056245 Country of ref document: DE Free format text: PREVIOUS MAIN CLASS: G06F0011300000 Ipc: G01N0029440000 |
|
| GRAP | Despatch of communication of intention to grant a patent |
Free format text: ORIGINAL CODE: EPIDOSNIGR1 |
|
| STAA | Information on the status of an ep patent application or granted ep patent |
Free format text: STATUS: GRANT OF PATENT IS INTENDED |
|
| RIC1 | Information provided on ipc code assigned before grant |
Ipc: F27D 21/00 20060101ALI20181112BHEP Ipc: F27D 19/00 20060101ALI20181112BHEP Ipc: G01N 29/44 20060101AFI20181112BHEP |
|
| INTG | Intention to grant announced |
Effective date: 20181212 |
|
| GRAS | Grant fee paid |
Free format text: ORIGINAL CODE: EPIDOSNIGR3 |
|
| GRAA | (expected) grant |
Free format text: ORIGINAL CODE: 0009210 |
|
| STAA | Information on the status of an ep patent application or granted ep patent |
Free format text: STATUS: THE PATENT HAS BEEN GRANTED |
|
| AK | Designated contracting states |
Kind code of ref document: B1 Designated state(s): AT BE BG CH CY CZ DE DK EE ES FI FR GB GR HU IE IS IT LI LT LU MC NL PL PT RO SE SI SK TR |
|
| REG | Reference to a national code |
Ref country code: GB Ref legal event code: FG4D |
|
| REG | Reference to a national code |
Ref country code: CH Ref legal event code: EP |
|
| REG | Reference to a national code |
Ref country code: AT Ref legal event code: REF Ref document number: 1179099 Country of ref document: AT Kind code of ref document: T Effective date: 20190915 |
|
| REG | Reference to a national code |
Ref country code: DE Ref legal event code: R096 Ref document number: 602005056245 Country of ref document: DE Ref country code: IE Ref legal event code: FG4D |
|
| REG | Reference to a national code |
Ref country code: DE Ref legal event code: R026 Ref document number: 602005056245 Country of ref document: DE |
|
| PLBI | Opposition filed |
Free format text: ORIGINAL CODE: 0009260 |
|
| 26 | Opposition filed |
Opponent name: COKEBUSTERS LTD Effective date: 20191014 |
|
| REG | Reference to a national code |
Ref country code: NL Ref legal event code: FP |
|
| REG | Reference to a national code |
Ref country code: LT Ref legal event code: MG4D |
|
| PG25 | Lapsed in a contracting state [announced via postgrant information from national office to epo] |
Ref country code: SE Free format text: LAPSE BECAUSE OF FAILURE TO SUBMIT A TRANSLATION OF THE DESCRIPTION OR TO PAY THE FEE WITHIN THE PRESCRIBED TIME-LIMIT Effective date: 20190911 Ref country code: LT Free format text: LAPSE BECAUSE OF FAILURE TO SUBMIT A TRANSLATION OF THE DESCRIPTION OR TO PAY THE FEE WITHIN THE PRESCRIBED TIME-LIMIT Effective date: 20190911 Ref country code: FI Free format text: LAPSE BECAUSE OF FAILURE TO SUBMIT A TRANSLATION OF THE DESCRIPTION OR TO PAY THE FEE WITHIN THE PRESCRIBED TIME-LIMIT Effective date: 20190911 Ref country code: BG Free format text: LAPSE BECAUSE OF FAILURE TO SUBMIT A TRANSLATION OF THE DESCRIPTION OR TO PAY THE FEE WITHIN THE PRESCRIBED TIME-LIMIT Effective date: 20191211 |
|
| PG25 | Lapsed in a contracting state [announced via postgrant information from national office to epo] |
Ref country code: GR Free format text: LAPSE BECAUSE OF FAILURE TO SUBMIT A TRANSLATION OF THE DESCRIPTION OR TO PAY THE FEE WITHIN THE PRESCRIBED TIME-LIMIT Effective date: 20191212 |
|
| PLBP | Opposition withdrawn |
Free format text: ORIGINAL CODE: 0009264 |
|
| REG | Reference to a national code |
Ref country code: AT Ref legal event code: MK05 Ref document number: 1179099 Country of ref document: AT Kind code of ref document: T Effective date: 20190911 |
|
| PG25 | Lapsed in a contracting state [announced via postgrant information from national office to epo] |
Ref country code: PT Free format text: LAPSE BECAUSE OF FAILURE TO SUBMIT A TRANSLATION OF THE DESCRIPTION OR TO PAY THE FEE WITHIN THE PRESCRIBED TIME-LIMIT Effective date: 20200113 Ref country code: RO Free format text: LAPSE BECAUSE OF FAILURE TO SUBMIT A TRANSLATION OF THE DESCRIPTION OR TO PAY THE FEE WITHIN THE PRESCRIBED TIME-LIMIT Effective date: 20190911 Ref country code: PL Free format text: LAPSE BECAUSE OF FAILURE TO SUBMIT A TRANSLATION OF THE DESCRIPTION OR TO PAY THE FEE WITHIN THE PRESCRIBED TIME-LIMIT Effective date: 20190911 Ref country code: EE Free format text: LAPSE BECAUSE OF FAILURE TO SUBMIT A TRANSLATION OF THE DESCRIPTION OR TO PAY THE FEE WITHIN THE PRESCRIBED TIME-LIMIT Effective date: 20190911 Ref country code: AT Free format text: LAPSE BECAUSE OF FAILURE TO SUBMIT A TRANSLATION OF THE DESCRIPTION OR TO PAY THE FEE WITHIN THE PRESCRIBED TIME-LIMIT Effective date: 20190911 |
|
| REG | Reference to a national code |
Ref country code: ES Ref legal event code: FG2A Ref document number: 2760674 Country of ref document: ES Kind code of ref document: T3 Effective date: 20200514 |
|
| PG25 | Lapsed in a contracting state [announced via postgrant information from national office to epo] |
Ref country code: IS Free format text: LAPSE BECAUSE OF FAILURE TO SUBMIT A TRANSLATION OF THE DESCRIPTION OR TO PAY THE FEE WITHIN THE PRESCRIBED TIME-LIMIT Effective date: 20200224 Ref country code: SK Free format text: LAPSE BECAUSE OF FAILURE TO SUBMIT A TRANSLATION OF THE DESCRIPTION OR TO PAY THE FEE WITHIN THE PRESCRIBED TIME-LIMIT Effective date: 20190911 Ref country code: CZ Free format text: LAPSE BECAUSE OF FAILURE TO SUBMIT A TRANSLATION OF THE DESCRIPTION OR TO PAY THE FEE WITHIN THE PRESCRIBED TIME-LIMIT Effective date: 20190911 |
|
| PLAX | Notice of opposition and request to file observation + time limit sent |
Free format text: ORIGINAL CODE: EPIDOSNOBS2 |
|
| PG2D | Information on lapse in contracting state deleted |
Ref country code: IS |
|
| PG25 | Lapsed in a contracting state [announced via postgrant information from national office to epo] |
Ref country code: DK Free format text: LAPSE BECAUSE OF FAILURE TO SUBMIT A TRANSLATION OF THE DESCRIPTION OR TO PAY THE FEE WITHIN THE PRESCRIBED TIME-LIMIT Effective date: 20190911 Ref country code: IS Free format text: LAPSE BECAUSE OF FAILURE TO SUBMIT A TRANSLATION OF THE DESCRIPTION OR TO PAY THE FEE WITHIN THE PRESCRIBED TIME-LIMIT Effective date: 20200112 |
|
| PG25 | Lapsed in a contracting state [announced via postgrant information from national office to epo] |
Ref country code: SI Free format text: LAPSE BECAUSE OF FAILURE TO SUBMIT A TRANSLATION OF THE DESCRIPTION OR TO PAY THE FEE WITHIN THE PRESCRIBED TIME-LIMIT Effective date: 20190911 |
|
| PLBB | Reply of patent proprietor to notice(s) of opposition received |
Free format text: ORIGINAL CODE: EPIDOSNOBS3 |
|
| PLBD | Termination of opposition procedure: decision despatched |
Free format text: ORIGINAL CODE: EPIDOSNOPC1 |
|
| REG | Reference to a national code |
Ref country code: DE Ref legal event code: R100 Ref document number: 602005056245 Country of ref document: DE |
|
| REG | Reference to a national code |
Ref country code: HK Ref legal event code: WD Ref document number: 1097625 Country of ref document: HK |
|
| PG25 | Lapsed in a contracting state [announced via postgrant information from national office to epo] |
Ref country code: MC Free format text: LAPSE BECAUSE OF FAILURE TO SUBMIT A TRANSLATION OF THE DESCRIPTION OR TO PAY THE FEE WITHIN THE PRESCRIBED TIME-LIMIT Effective date: 20190911 |
|
| REG | Reference to a national code |
Ref country code: CH Ref legal event code: PL |
|
| PLBM | Termination of opposition procedure: date of legal effect published |
Free format text: ORIGINAL CODE: 0009276 |
|
| PG25 | Lapsed in a contracting state [announced via postgrant information from national office to epo] |
Ref country code: LU Free format text: LAPSE BECAUSE OF NON-PAYMENT OF DUE FEES Effective date: 20200601 |
|
| REG | Reference to a national code |
Ref country code: NL Ref legal event code: RC Free format text: DETAILS LICENCE OR PLEDGE: RIGHT OF PLEDGE, ESTABLISHED, 1E PANDRECHT Name of requester: CITIBANK, N.A Effective date: 20210309 |
|
| REG | Reference to a national code |
Ref country code: BE Ref legal event code: MM Effective date: 20200630 |
|
| 27C | Opposition proceedings terminated |
Effective date: 20201213 |
|
| PG25 | Lapsed in a contracting state [announced via postgrant information from national office to epo] |
Ref country code: IE Free format text: LAPSE BECAUSE OF NON-PAYMENT OF DUE FEES Effective date: 20200601 Ref country code: LI Free format text: LAPSE BECAUSE OF NON-PAYMENT OF DUE FEES Effective date: 20200630 Ref country code: CH Free format text: LAPSE BECAUSE OF NON-PAYMENT OF DUE FEES Effective date: 20200630 |
|
| PG25 | Lapsed in a contracting state [announced via postgrant information from national office to epo] |
Ref country code: BE Free format text: LAPSE BECAUSE OF NON-PAYMENT OF DUE FEES Effective date: 20200630 |
|
| PGFP | Annual fee paid to national office [announced via postgrant information from national office to epo] |
Ref country code: ES Payment date: 20210705 Year of fee payment: 17 |
|
| PG25 | Lapsed in a contracting state [announced via postgrant information from national office to epo] |
Ref country code: TR Free format text: LAPSE BECAUSE OF FAILURE TO SUBMIT A TRANSLATION OF THE DESCRIPTION OR TO PAY THE FEE WITHIN THE PRESCRIBED TIME-LIMIT Effective date: 20190911 Ref country code: CY Free format text: LAPSE BECAUSE OF FAILURE TO SUBMIT A TRANSLATION OF THE DESCRIPTION OR TO PAY THE FEE WITHIN THE PRESCRIBED TIME-LIMIT Effective date: 20190911 |
|
| REG | Reference to a national code |
Ref country code: NL Ref legal event code: RF Free format text: RIGHT OF PLEDGE, REMOVED Effective date: 20220527 Ref country code: NL Ref legal event code: RC Free format text: DETAILS LICENCE OR PLEDGE: RIGHT OF PLEDGE, ESTABLISHED, TWEEDE PANDRECHT Name of requester: ECLIPSE BUSINESS CAPITAL LLC Effective date: 20220527 |
|
| REG | Reference to a national code |
Ref country code: NL Ref legal event code: RF Free format text: RIGHT OF PLEDGE, REMOVED Effective date: 20230301 |
|
| REG | Reference to a national code |
Ref country code: ES Ref legal event code: FD2A Effective date: 20230726 |
|
| PGFP | Annual fee paid to national office [announced via postgrant information from national office to epo] |
Ref country code: NL Payment date: 20230511 Year of fee payment: 19 Ref country code: IT Payment date: 20230613 Year of fee payment: 19 Ref country code: FR Payment date: 20230509 Year of fee payment: 19 Ref country code: DE Payment date: 20230509 Year of fee payment: 19 |
|
| PG25 | Lapsed in a contracting state [announced via postgrant information from national office to epo] |
Ref country code: ES Free format text: LAPSE BECAUSE OF NON-PAYMENT OF DUE FEES Effective date: 20220602 |
|
| PGFP | Annual fee paid to national office [announced via postgrant information from national office to epo] |
Ref country code: GB Payment date: 20230510 Year of fee payment: 19 |
|
| REG | Reference to a national code |
Ref country code: DE Ref legal event code: R119 Ref document number: 602005056245 Country of ref document: DE |
|
| REG | Reference to a national code |
Ref country code: NL Ref legal event code: MM Effective date: 20240701 |
|
| GBPC | Gb: european patent ceased through non-payment of renewal fee |
Effective date: 20240601 |
|
| PG25 | Lapsed in a contracting state [announced via postgrant information from national office to epo] |
Ref country code: NL Free format text: LAPSE BECAUSE OF NON-PAYMENT OF DUE FEES Effective date: 20240701 |
|
| PG25 | Lapsed in a contracting state [announced via postgrant information from national office to epo] |
Ref country code: NL Free format text: LAPSE BECAUSE OF NON-PAYMENT OF DUE FEES Effective date: 20240701 |
|
| PG25 | Lapsed in a contracting state [announced via postgrant information from national office to epo] |
Ref country code: DE Free format text: LAPSE BECAUSE OF NON-PAYMENT OF DUE FEES Effective date: 20250101 |
|
| PG25 | Lapsed in a contracting state [announced via postgrant information from national office to epo] |
Ref country code: FR Free format text: LAPSE BECAUSE OF NON-PAYMENT OF DUE FEES Effective date: 20240630 |
|
| PG25 | Lapsed in a contracting state [announced via postgrant information from national office to epo] |
Ref country code: IT Free format text: LAPSE BECAUSE OF NON-PAYMENT OF DUE FEES Effective date: 20240601 Ref country code: GB Free format text: LAPSE BECAUSE OF NON-PAYMENT OF DUE FEES Effective date: 20240601 |
|
| P01 | Opt-out of the competence of the unified patent court (upc) registered |
Free format text: CASE NUMBER: UPC_APP_4291_1756717/2025 Effective date: 20250825 |