EP1219919A2 - Verfahren, Anordnung und System zur Ermittlung von Prozessgrössen - Google Patents
Verfahren, Anordnung und System zur Ermittlung von Prozessgrössen Download PDFInfo
- Publication number
- EP1219919A2 EP1219919A2 EP01128293A EP01128293A EP1219919A2 EP 1219919 A2 EP1219919 A2 EP 1219919A2 EP 01128293 A EP01128293 A EP 01128293A EP 01128293 A EP01128293 A EP 01128293A EP 1219919 A2 EP1219919 A2 EP 1219919A2
- Authority
- EP
- European Patent Office
- Prior art keywords
- vectors
- code book
- intensity
- vector
- axes
- Prior art date
- Legal status (The legal status is an assumption and is not a legal conclusion. Google has not performed a legal analysis and makes no representation as to the accuracy of the status listed.)
- Granted
Links
Images


Classifications
-
- G—PHYSICS
- G01—MEASURING; TESTING
- G01N—INVESTIGATING OR ANALYSING MATERIALS BY DETERMINING THEIR CHEMICAL OR PHYSICAL PROPERTIES
- G01N21/00—Investigating or analysing materials by the use of optical means, i.e. using sub-millimetre waves, infrared, visible or ultraviolet light
- G01N21/17—Systems in which incident light is modified in accordance with the properties of the material investigated
- G01N21/25—Colour; Spectral properties, i.e. comparison of effect of material on the light at two or more different wavelengths or wavelength bands
- G01N21/31—Investigating relative effect of material at wavelengths characteristic of specific elements or molecules, e.g. atomic absorption spectrometry
Definitions
- the invention relates to a method for determining process variables.
- these are process variables that cannot be measured directly based on local correlations used in the evaluation and presentation of the data determined in fluorescence microscopy occur.
- the invention relates to an arrangement for performing the Method for determining these process variables during the operation of a Fluorescence microscope, embedding in a system and use in Applications.
- the invention relates to a system for determining Process variables in a microscope system.
- the system in particular concerns a scanning microscope, the light in parallel or sequentially over an object leads to several detectors that emit light from the object Determine intensities from different spectral ranges, one Processing unit, a computer, an input unit and a display, the interact in an appropriate manner.
- the aim of image formation with structures colored by immunofluorescence in an object is that dyes can be clearly identified within the volume defined by the object.
- the detector can be a photosensor or an array with several photosensors (CCD chips are used when high dynamics are not absolutely necessary).
- CCD chips are used when high dynamics are not absolutely necessary.
- a plurality of intensities I i are detected from the associated sample volume, which can be used for imaging while simultaneously recording location coordinates.
- the size of interest to the user is ⁇ that is measurable size I ,
- the noise separates into the components: auto-fluorescence, light-induced noise and electronic noise.
- the mixture matrix M is not known a priori, since many parts of the described information chain (eg exact course of spectra with chemical environmental parameters, tolerances of components) are only insufficiently known at the time of the measurement. Because of the limited number of detectors, q ⁇ n generally applies in microscopy . For this reason, M generally performs an irreversible information reduction. More information is retained in spectroscopy because the dimension of the detected vector is larger.
- microscopy data sets break down into several Subsets that are characterized by local correlation (slopes of the straight line in the Difference).
- the localization of the straight lines in the Intensity space provides information about the material in the sample volume
- the position of the measured value on the straight line provides information about the quantity.
- the cytofluorogram techniques introduced by Demandolx and Davoust visualize an ensemble of two-dimensional intensities ⁇ I i ⁇ (in microscopy the pixels of an image, voxel of a volume or a series of the same in succession, in cytofluorometry the measurements of several samples) as a two-dimensional scatter plot, which essentially represents a two-dimensional frequency distribution.
- I an estimate of the composite probability function of the intensities is obtained I , a process that is state of the art in mathematical data analysis and the quality of which only depends on the size of the ensemble.
- a suitable color coding and graphic representation give an image of the intensity distribution in which the straight line can be located as widened traces by the user's eye. The broadening exists due to all forms of noise and possibly chemical influences acting in the background.
- cytofluorogram based methods manipulate large Amounts of data in the block, what they are from use during the Excludes measuring processes. They are not on-line algorithms because too many calculations / data manipulations are not available a profitable computer model or in electronics these tasks in flight To run. For this reason, these methods are also based Setting algorithms, which are possible and necessary as shown below, not viable.
- the measurement model described above is also required to actively carry out system settings of the microscope system.
- the configuration and design of fluorescence microscopes, more complex microscopy systems and spectroscopy systems can be illustrated using the above model.
- a good microscope design aims at a mixture matrix M in the form of a diagonal matrix. This corresponds to a 1-1 relationship between the dyes to be detected and the detectors.
- the measured channels should then be largely independent during the measurement. This clearly means that the images of the straight lines should be as vertical as possible.
- Design criteria to achieve this goal are e.g. the selection of lasers, optical filters, detectors or, in the case of the SP2 module developed by Leica, predefined filter macros for spectral separation with their help such a diagonalization is to be achieved. By a suitable one The configuration of such elements gets closer to this goal.
- German patent application DE-A-198 29 944 discloses a possibility of finding a possible device configuration on the basis of a database by means of inference (logical conclusions). Due to the fact that all of these methods can only work with limited prior knowledge, this goal can only be partially achieved. Multiple excitations, spectral crosstalk, tolerances and aging of used assemblies, the limited steepness of the edges of optical filters and the physico-chemical environmental parameters (pH value, temperature, age and responsiveness of biological objects) exert a further influence that is inherently lacking due to such configuration processes a priori knowledge must be neglected. The spectral crosstalk alone leads to a degeneracy of M into a triangular matrix.
- this invention solves, among other things, the task of adequately quantifying the internal processes in real time, making the actual and target status ascertainable and making this optimization method accessible.
- the mechanisms described in the method have the necessary properties (eg monotony of the error functions) in order to optimally use them in optimization tasks.
- the present invention is based on the object of a method for Establish local correlation that allows large amounts of data to process in real time.
- all the data recorded on the Evaluation can be used and that the user an efficient and convenient examination of the samples for these correlation measures is possible.
- This object is achieved by a method according to characterizing features of claim 1.
- Another object of the invention is to provide an arrangement for determining local correlation, which allows large amounts of data to be processed in real time, which uses all of the recorded data for evaluation and which enables the user to examine the samples efficiently.
- the arrangement is used to determine the setting, the microscope configuration being derived on the basis of representations of tracks, local correlations and their deviation from the ideal setting steps.
- An additional object of the invention is a microscope system for Establish local correlation that allows large amounts of data to process in real time that all recorded data for evaluation and the user an efficient examination of the samples allows.
- An advantage of this invention is that through the microscope system System design is demonstrated by an appropriate one Processing unit determining representations of the traces of Correlations in the intensity space determined during normal operation and be made available to the user. This happens because the user the determined data in graphic form on a display being represented. Based on the representation, the user can then Make changes to the setting of the microscope system to to get a better evaluation of the measurement data.
- the correction according to the invention makes Measured data recorded in real time with regard to expected parasitic Measurement errors possible. For this purpose, on the basis of representations of Traces of local correlations performed a reproducible correction.
- Another advantage of this invention is the creation of Reproducibility.
- the microscope system according to the invention with adaptive correction is reduced the spectral crosstalk between the individual detection channels and allows large amounts of data to be processed in real time.
- a suitable one Processing unit determines representations of the traces of correlations in the intensity room during normal operation.
- the certain one Correction rule allows the measurement data to be corrected and the user to provide.
- the microscope system has the property of being material-specific Imaging, which makes it possible to view large amounts of data in real time to process.
- This microscope system has a suitable one Processing unit that determines the representations of the traces of Correlations in the intensity space determined during normal operation. A reclassification of the measurement data to the Performs correlation representations and provides the user with an image Provided.
- Another advantage of the invention is the fact that the described Solutions through the use of suitable software for others Measurement methods for parameters that cannot be measured directly but on Traces of correlations in the intensity space, with a suitable formation Intensity space, let it lead back.
- the quantification of photo-destructive effects also is possible. There are time-shifted intensities of the same place Representations of local traces of correlations are examined and used Determination of the bleaching rate used. Furthermore, the microscope system present the photodestructive effects with integrated quantification. This is by a delayed supply of intensity vectors in a real-time processing unit for determining local correlations with subsequent quantification of the bleaching rate and the display on one Display enables.
- the light beam 3 coming from an illumination system 1 is from a beam splitter 5 to the scan module 7, which reflects a gimbal Suspended scanning mirror 9 includes the light beam 3 through the Microscope optics 13 leads over or through the object 15.
- the Light beam 3 is in the case of non-transparent objects 15 via the Object surface led. For biological objects 15 (preparations) or The light beam 3 can also pass transparent objects through the object 15 be performed. This means that different focus levels of the object 15 can be scanned in succession by the light beam 3.
- the ex post Composition then results in a three-dimensional image of the object 15.
- the light beam 3 coming from the lighting system 1 is as shown by solid line.
- the light 17 emanating from the object 15 passes through the microscope optics 13 and via the scan module 7 Beam splitter 5 passes this and strikes at least one detector 19 which is designed as a photomultiplier. If in certain applications on the CCD sensors also find high dynamics of the photomultiplier use as detectors.
- the light 17 emanating from the object 15 is shown as a dashed line.
- In the detector 19 are electrical, for Power of the light 17 emanating from the object proportional Detection signals 21 are generated and sent to the processing unit 23 passed.
- the detector 19 consists of several detectors can, the individual spectral ranges of the object 15 Detect light.
- the one in the scan module 7 using an inductive or capacitive one Position sensor 11 detected position signals 25 are also sent to the Transfer processing unit 23. It is for a professional of course, that the position of the scanning mirror 9 is also via the Adjustment signals can be determined.
- the incoming, analog signals are first digitized in the processing unit 23.
- the signals are transferred to a computer 34 on which an input unit 33 connected.
- the user can Representation of the data by means of the input unit 33 corresponding Make selections. 1 is a mouse as an input unit 33 shown. However, it goes without saying for any professional that too Keyboard and the like can be used as input unit 33.
- On a display 27 is e.g.
- an image 35 of the object 15, a representation of the determined code book vectors in a coordinate system Visualizations of correlation traces and the like are shown.
- setting elements 29, 31 for the image acquisition can be displayed.
- the setting elements 29, 31 are shown as a slide. Any other Design lies in the technical skills of a specialist.
- the Position and detection signals are processed in the processing unit 23 in Depending on the settings selected and composed shown on the display 27. That with a confocal scanning microscope Illuminated pinhole 39, and that usually provided Detection pinhole 41 are schematic for completeness located. Are omitted because of the better clarity however, some optical elements for guiding and shaping the Light beams. These are a specialist in this field well known.
- the data relating to the fluorescence properties of the object 15 to be examined are recorded with corresponding detectors 19 and fed to various calculation methods.
- the intensities determined by a plurality of detectors 19 are fed to a means 49, which forms an intensity vector therefrom.
- the intensity vector I is formed from the components I 1 , I 2 , ..., I n , which come from the different spectral ranges of a measurement process.
- the vector standard is calculated with a means 50 and the value is used to decide whether it is autofluorescence noise and background or a useful signal (threshold value check).
- a means 50 for calculating the norm of the intensity vector is used for this.
- the test decides whether the data vector as a useful signal is subject to further processing or not.
- the Euclidean norm lends itself, since this is physically comparable to energies.
- a generalization to other metrics of linear algebra is possible.
- the useful signal from the detectors 19 is standardized and its dimensionality is reduced.
- the extracted useful signal is forwarded to a vector quantizer 58, which internally contains a set of intensity vectors which represent the representations of the traces of local correlation and are available as a result of the method.
- the amount of vectors present in the vector quantizer 58 reflects the expectations of the system developer, or can be determined and changed from the a priori knowledge of the user or by means of suitable software in the computer 34.
- code book vectors These vectors are referred to as code book vectors in the following.
- the comparison of measured values and representations is carried out by the vector quantizer 58, the possible functions of which are described in detail below.
- the code book vectors are read out from the vector quantizer 58 as representations of traces of local correlation using a corresponding means 60.
- the method described above is implemented in a device 45.
- the device 45 compares incoming vectors (intensity vector I ) with code book vectors to make the incoming vectors more and more similar to the code book vectors and to adapt the representations to the input distribution.
- the measured intensities I 1 , I 2 , ..., I n become an intensity vector I summarized.
- the intensities I 1, I 2, ..., I n with the at least one detector 19 which is provided in the microscope system.
- the intensity vector I is fed to a means 50 for forming the amount or for calculating a norm.
- the amount (Euclidean length) R of the vector is calculated, which, as mentioned above, is comparable to the energy.
- the intensity vectors I are fed to a separating means 52. There are only intensity vectors I considered, the amount of which is greater than a predetermined threshold value SW in order to exclude image background, noise, poorly pronounced co-localizations and not to be used for the subsequent calculation. If the amount is too small, those intensity vectors become I sorted out, which is represented by a switch 54 in FIG. 2. Those intensity vectors I that have not been sorted out are normalized by a normalization unit 56, which is equivalent to the projection of an n-dimensional problem onto the (n-1) -dimensional partial surface of the unit hyperball in the positive quadrant, with one position adequately describing correlation traces in the original space. The normalized intensity vectors I are fed to the learning vector quantizer 58 via an additional filter element 57.
- the adaptively designed vector quantizer 58 measures the similarity of the incoming vectors to the vectors from the code book and makes the most similar ones even more similar. Through the initialization and the learning process, the vector quantizer 58 tracks the code book vectors in such a way that they approximate the data as best as possible.
- Vector quantizers in general form the link between continuous vectorial distributions (here intensities) with a discrete world of representations and are state of the art in telecommunications and signal processing.
- Vector quantizers are used in particular for the lossy transmission of vector signals (see, inter alia, Moon and Stirling, Mathematical Methods and Algorithms for Signal Processing. London: Prentice Hall, 2000).
- the vector quantizer (58) used here has relatively few internal code book vectors, since a high compression of the measurement data is carried out on a very simple model with high loss and is adaptive.
- the intensity vectors supplied are compared with all code book vectors simultaneously, a subset of the most similar code book vectors being selected and adapted.
- the degree of similarity and the subset is a degree of freedom of the method and can vary.
- the selection becomes the current intensity vector I made something more similar. In the simplest case, this is always the most similar code book vector. This is done using mathematical methods such as distance measurements with vector standards, local aggregation, recursively moving averaging, but is designed differently for different types of learnable vector quantizers.
- a multitude of different methods come into consideration for a configuration according to the invention and has an extremely large number of straight lines of freedom in the real configuration. The design options are sufficiently well known to the person skilled in the art and are briefly outlined below.
- Luo and Unbehauen beat one among others Class of competitive learning neural architectures for the task before vector quantization (Luo and Unbehauen, Applied Neural Networks for Signal Processing, Cambridge: CUP, 1997).
- Such procedures result from the simulation of representation-forming thought processes Competitive learning of individual neurons and also generate strong ones simplified representations of computer science already good representations.
- the direct simulation of competitive learning between neurons can be too lead an expression of the vector quantizer 58.
- the input vector is presented to a set of neurons, with additional a lateral connection between the neurons is activated, whose Weighting local connections strengthened (positive connection) and further distant inhibits (negative connection).
- the forest becomes one Hebb's learning rule exposed the correlations between input and Outputs reinforced.
- the vector quantizer 58 With a constant learning rate, the vector quantizer 58 remains adaptive. When using a learning rate that is inversely proportional to the number of gains, one obtains the so-called “k-means” method, which lies exactly in the mean values of the distribution. By choosing exponentially decreasing learning rates, you can create any intermediate state, but other variants are also used.
- One variant is the so-called “neural gas” algorithm, in which a ranking of the winners based on the winning functions, also at tough competitive learning process. Based on this Ranking, an adaptation function calculates the degree of adaptation Winner with the best rank is adapted more than a winner with lower rank. The adaptation influence is often reduced over time.
- “Growing Neural Gas” is about one Information technology or error minimization criterion the number of Vectors in the code book increased until a sufficient operation was guaranteed is.
- the code book vectors overlaid a topology.
- the learning process always adapted a neighborhood of the winner, as a rule closer neighbors more adapted and distant neighbors less adapted and the influence of neighborhood learning is reduced over time becomes. This is comparable to an x-dimensional rubber blanket that you put in the distribution creaks without tearing.
- the advantage of this procedure is the preservation of topological properties.
- Newer approaches are characterized by mixed forms in which Topology preservation by the graphs superimposed on the vectors as with the Self-organizing characteristics map with growth criteria as with Growing neural gas can be linked. Examples are e.g. "Growing Cell Structures "," Growing Grid ".
- the vectors in the code book and the adaptation process are in one set up of this type before the experiment during initialization. This can vary from application to application.
- a vector quantizer 58 that has exactly as many code book vectors as channels and those in the Order of the channels with orthonormal unit vectors of the channel space are pre-initialized.
- a vector quantizer 58 is also conceivable, which is for everyone Channel an orthonormal unit vector and for every possible Mixed state has an oblique (diagonal in the signal space) unit vector. This variant works statistically more stable when co-localizations occur.
- a counter (not shown) can be used to determine how often which one Code book vector was changed to use to co-localizations track. The counter can be used for simple statistical significance tests can be used because the number of adaptation steps the frequency corresponds to the corresponding measured values.
- the detectors 19 are shown in this embodiment as PMTs (Photo Multiplier Tubes).
- the measured values are used to evaluate local correlations from the PMTs an electronic device 45 supplied that the corresponding Assessment as described above.
- the device 45 is a means 62 for selecting a subset from the plurality of code book vectors downstream.
- the selected code book vectors will be an evaluation and visualization unit, which e.g. as display 27 of the computer 34 can be formed.
- the evaluation and Visualization unit is connected to a spectrophotometer 64.
- the Spectrophotometer 64 can e.g. be designed as a multiband detector, the crosstalk based on the determined correlation representations determined and performs an automatic adjustment to the crosstalk to minimize the individual detection channels.
- the read out code book vectors are used to evaluate the Setting the spectrophotometer 64 used. It should be noted that ideally, the angle between two code book vectors should be 90 °. This fact can be used to calculate a monotonous linear Use quality function where 0 ° of a quality of 0% and 90 ° of a quality of Corresponds to 100%. This quality can be used in a tuning algorithm for tuning use the spectrophotometer 64.
- the device 45 is in this Arrangement preferably implemented in FPGA or DSP technology.
- the Evaluation could preferably also on the computer 34, which is also as Control computer can be used, or done on the FPGA, DSP, since the timing is not critical here.
- the code book vectors can also be shown on the display 27 be displayed to the user about the quality of the measurement enlighten.
- the code book vectors to be displayed are in one Coordinate system entered. Based on the slope of the code book vectors to the coordinate axes can easily the quality of the Measurement can be read.
- the selection of the subset of the code book vectors is limited to those code book vectors that match the axes of one Coordinate system are closest.
- Each represents one Coordinate axis the detection in a detection channel of the Multiband detector.
- the slope of the code book vectors to the Coordinate axes and among themselves are used to determine the Crosstalk of the individual detection channels used. With 2-dimensional Selections can be used directly for visualization become. It should also be noted that for visual representation too
- the axes of the coordinate system can be represented in triples, the closest code book vectors to these axes in can be entered accordingly with respect to the coordinate axes.
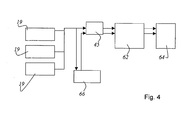
- Fig. 4 an arrangement is shown schematically, which the bleaching rate in the examining object 15 measures. To do this, the same channel is detected staggered in time, and builds from the staggered data the vector together. As a result, structures can be found different bleaching rates on different straight lines, which are characterized by the different vectors are represented. To do this, a Storage element 66 can be consulted. As shown in Fig. 4 the values from the detectors 19, e.g. PMTs, saved. The The illustrated embodiment uses three detectors 19, but what in should not be considered a limitation in any way. The measurement data of the detectors 19 are always in the Storage element 66 filed.
- the data of an image are always which is recorded at the time t with the data of the image, which at Time t-1 was recorded, the device 45 fed.
- the Storage element 66 must work pixel-synchronously for this. It is that Sufficiently known to those skilled in the art that such a synchronization also Linen, frame or volume based can be done and only location-synchronized the scanning movement of the light beam 3 must be coupled.
- On Embodiment is a RAM coupled to the device 45 as Memory element 66 to use, or that the memory element 66 directly is implemented in the computer 34.
- the Means 45 means 62 for selecting a subset from the Variety of code book vectors downstream. The selected code book vectors are fed to an evaluation and visualization unit, e.g.
- the bleaching rate can be read from the selected code book vectors. From the Inclination of a code book vector at time t compared to the inclination a code book vector at time t + 1 in the coordinate system can Bleaching rate or the bleaching behavior can be determined. The information about the bleaching rate can also be used for system settings, since the light sensitivity of the dyes present in the sample is determined directly becomes. There is also textual information to the user through the display 27 conceivable.
- the code book vectors essentially contain the necessary ones Information to correct the measurement data. For this purpose these are combined into a matrix and then inverted.
- the Summary on the matrix may vary depending on whether there is a Information separation or correction of parasitic spectral Crosstalk phenomena is sought, which is usually only from channels high to low energy channels.
- the inversion of a matrix is State of the art. This can be done with an additional electronic component (not shown) in the data path or in the computer 34.
- the correction accessible are crosstalk, intensity reduction through bleaching and Combinations of these.
- the code book vectors also contain information about the material in the sample volume. For this purpose, the measured values are classified back on the next codebook entry. Such operations are carried out in the Usually performed in computer 34. With suitable visualization of such A map of different materials in the image is obtained from image data. This should not be confused with those used in US Patent 5,719,024 mathematical method of decorrelation, which there as Preprocessing step. The same won't happen here explicitly required.
Landscapes
- Physics & Mathematics (AREA)
- Spectroscopy & Molecular Physics (AREA)
- Biochemistry (AREA)
- Life Sciences & Earth Sciences (AREA)
- Chemical & Material Sciences (AREA)
- Analytical Chemistry (AREA)
- Health & Medical Sciences (AREA)
- General Health & Medical Sciences (AREA)
- General Physics & Mathematics (AREA)
- Immunology (AREA)
- Pathology (AREA)
- Investigating, Analyzing Materials By Fluorescence Or Luminescence (AREA)
- Microscoopes, Condenser (AREA)
- Measurement Of Current Or Voltage (AREA)
Abstract
Hieraus wird eine Norm des Intensitätsvektors (
Description
Obige Aufgabe wird gelöst durch eine Anordnung mit den Merkmalen des kennzeichnenden Teils des Anspruchs 10.
- Fig. 1
- eine schematische Darstellung eines Systems mit einem Konfokalmikroskop;
- Fig. 2
- eine schematische Darstellung zur Realisierung eines Verfahrens zur Bewertung und Einstellung von Prozessgrößen;
- Fig. 3
- eine schematische Darstellung einer Realisierung des Prozesses zur Messung der spektralen Trenngüte; und
- Fig. 4
- eine schematische Darstellung einer Realisierung des Prozesses zur Messung der Bleichrate.
- 1
- Beleuchtungssystem
- 2
- Scanmikroskop
- 3
- Lichtstrahl
- 5
- Strahlteiler
- 7
- Scanmodul
- 9
- Scanspiegel
- 11
- Positionssensor
- 13
- Mikroskopoptik
- 15
- Objekt
- 17
- Lichtstrahl
- 19
- Detektor
- 21
- Detektionssignale
- 23
- Verarbeitungseinheit
- 25
- Positionssignale
- 27
- Display
- 29
- Einstellelement
- 31
- Einstellelement
- 33
- Eingabeeinheit
- 34
- Rechner
- 35
- Abbild
- 37
- Leitung
- 39
- Beleuchtungspinhole
- 41
- Detektionspinhole
- 45
- Einrichtung
- 49
- Mittel zum Bilden eines Intensitätsvektors
- 50
- Mittel zum Berechnen
- 52
- Vergleichselement
- 54
- Schalter
- 56
- Normierungseinheit
- 57
- Filterelement
- 58
- Vektorquantisierer
- 60
- Mittel zum Auslesen
- 62
- Mittel zum Auswählen
- 64
- Spektralphotometer
- 66
- Speicherelement
- I1, I2, ...,In
- Intensitäten
- I
- Intensitätsvektor
- SW
- Schwellwert
Claims (27)
- Verfahren zur Ermittlung von Prozessgrößen mit einem Mikroskopsystem, wobei das Verfahren durch folgenden Schritte gekennzeichnet ist:a) Zusammenfassen der von einer Vielzahl von Detektoren (19) ermittelten Intensitäten aus unterschiedlichen Spektralbereichen eines Messvorgangs zu einem Intensitätsvektor (
I ),b) Berechnen einer Norm des Intensitätsvektors (I ),c) Aussondern derjenigen Intensitätsvektoren deren Norm kleiner ist als ein vorgebbarer Schwellwert (SW), damit diese Vektoren im weiteren Verfahren unberücksichtigt bleiben,d) Normieren der Intensitätsvektoren (I ),e) Zuleiten der Intensitätsvektoren zu einem Vektorquantisierer (58) und Verarbeitung der Intensitätsvektoren (I ) durch den Vektorquantisierer (58), undf) Auslesen von Code-Book-Vektoren aus dem Vektorquantisierer (58). - Verfahren nach Anspruch 1, dadurch gekennzeichnet, dass das Berechnen der Norm der euklidische Abstand zu einem Koordinatenursprung ist.
- Verfahren nach Anspruch 1, gekennzeichnet durch die folgenden Schritte:Auswählen einer Untermenge aus der Vielzahl der Code-Book-Vektoren, undZuführen der ausgewählten Code-Book-Vektoren an eine Auswerte-und Visualisierungseinheit.
- Verfahren nach Anspruch 3, dadurch gekennzeichnet, dass die Neigung der Code-Book-Vektoren zu den Koordinatenachsen sowie untereinander zur Ermittlung des Übersprechens der einzelnen Detektionskanäle herangezogen wird.
- Verfahren nach Anspruch 3, dadurch gekennzeichnet, dass tupel- oder tripelweise die Achsen des Koordinatensystems visuell dargestellt werden und die nächsten zu diesen Achsen gelegenen Code - Book - Vektoren eingetragen werden.
- Verfahren nach einem der Ansprüche 3, dadurch gekennzeichnet, dass jeder visuellen Darstellung der Achsen des Koordinatensystems ein Zähler zugeordnet ist, der zur Visualisierung der Signifikanz des durch den jeweiligen Code-Book-Vektor repräsentierten Signalanteils dient.
- Verfahren nach Anspruch 1 kennzeichnet durch die folgenden Schritte:Erfassen der Ortskoordinaten in einem Objekt 15 während des Scanvorgangs und der den Ortskoordinaten zugeordneten Intensitäten ( I1 , I2 , ... , In ),Vergleichen der Intensitätsvektoren (
I ) mit den Code-Book-Vektoren, undKlassifikation der Intensitätsvektoren (I ) auf den nächsten Code-Book-Vektor. - Verfahren nach Anspruch 1, gekennzeichnet durch die folgenden Schritte, die vor den Schritten a bis f ausgeführt werden:Zeitversetztes, blockbasiertes Zwischenspeichen der Intensitätsvektoren, undBilden von Vektoren aus den jeweils aktuellen Intensitätsvektor und dem vor dem jeweils aktuellen und zwischengespeicherten Intensitätsvektor aufgenommenen zeitversetzten Intensitätsvektor, wobei beide Vektoren vom selben Ort des Objekts (15) stammen.
- Verfahren nach Anspruch 1, gekennzeichnet durch die folgenden Schritte:Berechnen einer Korrekturmatrix aus den Code-Book-Vektoren undAnwendung der Korrekturmatrix auf die aktuell gemessenen Intensitätsvektoren bei gleichzeitigen Bildaufbau.
- Anordnung zur Ermittlung von Prozessgrößen in einem Mikroskopsystem, gekennzeichnet durch:a) Mittel (49) zum Zusammenfassen der von einer Vielzahl von Detektoren (19) ermittelten Intensitäten ( I1 , I2 , ... ,In ) aus unterschiedlichen Spektralbereichen eines Messvorgangs zu einem Intensitätsvektor (
I ),b) Mittel (50) zum Berechnen einer Norm des Intensitätsvektors (I ),c) Mittel (52) zum Aussondern derjenigen Intensitätsvektoren deren Norm kleiner ist als ein vorgebbarer Schellwert (SW),d) Mittel (56) zum Normieren der Intensitätsvektoren,e) einen Vektorquantisierer (58) der die Intensitätsvektoren verarbeitet, undf) Mittel (60) zum Auslesen von Code-Book-Vektoren aus dem Vektorquantisierer (58). - Anordnung nach Anspruch 10, dadurch gekennzeichnet, dass die Mittel (56) zum Normieren die Berechnung des euklidischen Abstandes zu einem Koordinatenursprung durchführen.
- Anordnung nach Anspruch 10, dadurch gekennzeichnet, dass der Vektorquantisierer (58) als "Learning Vektorquantiziser", oder als wettbewerbslernendes neuronales Netz ausgebildet ist oder aus diesem im Kontext der mathematische Annäherung ab- oder hergeleitet werden kann.
- Anordnung nach Anspruch 10, dadurch gekennzeichnet, dass ein Multibanddetektor vorgesehen ist, der an Hand des ermittelten Übersprechens eine automatische Einstellung durchführt, um das Übersprechen der einzelnen Detektionskanäle zu minimieren, wobei eine Auswahl der Untermenge der Code-Book-Vektoren auf diese Code-Book-Vektoren beschränkt ist, die den Achsen eines Koordinatensystems am nächsten sind, wobei jeweils eine Koordinatenachse die Detektion in einem Detektionskanal repräsentiert, und dass die Neigung der Code-Book-Vektoren zu den Koordinatenachsen sowie untereinander zur Ermittlung des Übersprechens der einzelnen Detektionskanäle heranziehbar ist.
- Anordnung nach Anspruch 13, dadurch gekennzeichnet, dass ein Mittel (27) zur visuellen Darstellung vorgesehen ist, und dass tupel- oder tripelweise die Achsen des Koordinatensystems darstellbar und die nächsten zu diesen Achsen gelegenen Code-Book-Vektoren eintragbar sind, oder dass paarweise die Achsen des Koordinatensystems darstellbar und die nächsten zu diesen Achsen gelegenen Code-Book-Vektoren eintragbar sind.
- Anordnung nach einem der Ansprüche 13 oder 14, dadurch gekennzeichnet, dass jeder visuellen Darstellung der Achsen des Koordinatensystems ein Zähler zugeordnet ist, der die Signifikanz des durch den jeweiligen Code-Book-Vektor repräsentierten Signalanteils verifiziert.
- Anordnung nach Anspruch 10, dadurch gekennzeichnet, dass:Mittel zum Erfassen der Ortskoordinaten eines Objekts (15) während des Scanvorgangs und der den Ortskoordinaten zugeordneten Intensitäten,Mittel zum Vergleichen der Intensitätsvektoren mit den Code-Book-Vektoren, undMittel zur Klassifikation der Intensitätsvektoren auf den nächsten Code-Book-Vektor vorgesehen sind.
- Anordnung nach Anspruch 10, dadurch gekennzeichnet, dassMittel (66) zum zeitversetzten, blockbasierten Zwischenspeichen der Intensitätsvektoren, undMittel (45) zum Bilden von Vektoren aus den jeweils aktuellen Intensitätsvektor und dem vor dem jeweils aktuellen und zwischengespeicherten Intensitätsvektor aufgenommenen zeitversetzten Intensitätsvektor vorgesehen sind, wobei beide Vektoren vom selben Ort des Objekts (15) stammen.
- Anordnung nach Anspruch 17, dadurch gekennzeichnet, dass Mittel zum Auswerten der die Neigung der Code-Book-Vektoren vorgesehen sind, um das Bleichverhalten oder Einflüsse aktiver Stellparameter zu ermitteln und auf dem Mittel (27) zur visuellen Darstellung zu visualisieren.
- Anordnung nach Anspruch 10, dadurch gekennzeichnet, dassMittel zum Berechnen einer Korrekturmatrix aus den Code-Book-Vektoren undMittel zur Anwendung der Korrekturmatrix auf die aktuell gemessenen Intensitätsvektoren bei gleichzeitigen Bildaufbau vorgesehen sind.
- Ein System zur Ermittlung von Prozessgrößen in einem Mikroskopsystem umfasst ein abtastendes Mikroskop (2), das einen Lichtstrahl (3) parallel oder sequentiell über ein Objekt (15) führt, mehrere Detektoren (19), die aus dem vom Objekt (15) ausgehenden Licht (17) Intensitäten aus unterschiedlichen Spektralbereichen ermitteln, eine Verarbeitungseinheit (23), einen Rechner(34), eine Eingabeeinheit (33) und ein Display (27), dadurch gekennzeichnet, dass:a) in der Verarbeitungseinheit (23) Mittel zum Zusammenfassen der von Detektoren (19) ermittelten Intensitäten ( I1 , I2 , ... In ) aus unterschiedlichen Spektralbereichen eines Messvorgangs zu einem Intensitätsvektor,b) Mittel (50) zum Berechnen einer Norm des Intensitätsvektors,c) Mittel (52) zum Aussondern derjenigen Intensitätsvektoren deren Norm kleiner ist als ein vorgebbarer Schwellwert (SW),d) Mittel (56) zum Normieren der Intensitätsvektoren,e) ein Vektorquantisierer (58), der die Intensitätsvektoren verarbeitet, undf) Mittel (60) zum Auslesen von Code-Book-Vektoren aus dem Vektorquantisierer (58) vorgesehen sind.
- System nach Anspruch 20, dadurch gekennzeichnet, dassMittel (62) zum Auswählen einer Untermenge aus der Vielzahl der Code-Book-Vektoren, undMittel zum Zuführen der ausgewählten Code-Book-Vektoren an eine Auswerte- und Visualisierungseinheit vorgesehen sind.
- System nach Anspruch 21, dadurch gekennzeichnet, dass die Visualisierungseinheit ein Display (27) ist, auf dem in mindestens einem Fenster die Code-Book-Vektoren visuell in einen Koordinatensystem darstellbar sind.
- System nach Anspruch 21, dadurch gekennzeichnet, dass ein Multibanddetektor vorgesehen ist, der an Hand des ermittelten Übersprechens eine automatische Einstellung durchführt, um das Übersprechen der einzelnen Detektionskanäle zu minimieren, wobei eine Auswahl der Untermenge der Code- Book-Vektoren auf diese Code-Book-Vektoren beschränkt ist, die den Achsen eines Koordinatensystems am nächsten sind, wobei jeweils eine Koordinatenachse die Detektion in einem Detektionskanal repräsentiert, und dass die Neigung der Code-Book-Vektoren zu den Koordinatenachsen sowie untereinander zur Ermittlung des Übersprechens der einzelnen Detektionskanäle heranziehbar ist.
- System nach einem der Ansprüche 20 bis 23, dadurch gekennzeichnet, dass jeder visuellen Darstellung der Achsen des Koordinatensystems auf dem Display (27) ein Zähler zugeordnet ist, der die Signifikanz des durch den jeweiligen Code-Book-Vektor repräsentierten Signalanteils verifiziert.
- System nach Anspruch 20, dadurch gekennzeichnet, dassMittel zum Erfassen der Ortskoordinaten einer Probe während des Scanvorgangs und der den Ortskoordinaten zugeordneten Intensitäten,Mittel zum Vergleichen der Intensitätsvektoren mit den Code-Book-Vektoren, undMittel zur Klassifikation der Intensitätsvektoren auf den nächsten Code-Book-Vektor vorgesehen sind.
- System nach Anspruch 20, dadurch gekennzeichnet, dassMittel (66) zum zeitversetzten, blockbasierten Zwischenspeichen der Intensitätsvektoren, undMittel (45) zum Bilden von Vektoren aus dem jeweils aktuellen Intensitätsvektor und dem vor dem jeweils aktuellen und zwischengespeicherten Intensitätsvektor aufgenommenen zeitversetzten Intensitätsvektor vorgesehen sind, wobei beide Vektoren vom selben Ort des Objekts (15) stammen.
- System nach Anspruch 26, dadurch gekennzeichnet, dass Mittel zum Auswerten der die Neigung der Code-Book-Vektoren vorgesehen sind, um das Bleichverhalten oder Einflüsse aktiver Stellparameter zu ermitteln und auf dem Display (27) zu visualisieren.
Applications Claiming Priority (2)
| Application Number | Priority Date | Filing Date | Title |
|---|---|---|---|
| DE10065783A DE10065783B4 (de) | 2000-12-30 | 2000-12-30 | Verfahren, Anordnung und System zur Ermittlung von Prozessgrößen |
| DE10065783 | 2000-12-30 |
Publications (3)
| Publication Number | Publication Date |
|---|---|
| EP1219919A2 true EP1219919A2 (de) | 2002-07-03 |
| EP1219919A3 EP1219919A3 (de) | 2003-07-30 |
| EP1219919B1 EP1219919B1 (de) | 2015-05-27 |
Family
ID=7669468
Family Applications (1)
| Application Number | Title | Priority Date | Filing Date |
|---|---|---|---|
| EP01128293.6A Expired - Lifetime EP1219919B1 (de) | 2000-12-30 | 2001-11-29 | Verfahren, Anordnung und System zur Ermittlung von Prozessgrössen |
Country Status (3)
| Country | Link |
|---|---|
| US (1) | US20020085763A1 (de) |
| EP (1) | EP1219919B1 (de) |
| DE (1) | DE10065783B4 (de) |
Families Citing this family (3)
| Publication number | Priority date | Publication date | Assignee | Title |
|---|---|---|---|---|
| DE10231776B4 (de) | 2002-07-13 | 2021-07-22 | Leica Microsystems Cms Gmbh | Verfahren zur Scanmikroskopie und Scanmikroskop |
| DE10250100A1 (de) | 2002-10-28 | 2004-05-13 | Leica Microsystems Heidelberg Gmbh | Mikroskopsystem und Verfahren zur Analyse und Auswertung von Mehrfachfärbungen eines mikroskopischen Objekts |
| DE10355150B4 (de) * | 2003-11-26 | 2021-01-14 | Leica Microsystems Cms Gmbh | Verfahren und System zur Analyse von Co-Lokalisationen |
Family Cites Families (9)
| Publication number | Priority date | Publication date | Assignee | Title |
|---|---|---|---|---|
| DE3485716D1 (de) * | 1983-09-06 | 1992-06-17 | Mitsubishi Electric Corp | Vektor-quantisiergeraet fuer bildinformation. |
| US5719024A (en) * | 1993-08-18 | 1998-02-17 | Applied Spectral Imaging Ltd. | Method for chromosome classification by decorrelation statistical analysis and hardware therefore |
| US5798262A (en) * | 1991-02-22 | 1998-08-25 | Applied Spectral Imaging Ltd. | Method for chromosomes classification |
| US5812700A (en) * | 1994-09-26 | 1998-09-22 | California Institute Of Technology | Data compression neural network with winner-take-all function |
| US5734796A (en) * | 1995-09-29 | 1998-03-31 | Ai Ware, Inc. | Self-organization of pattern data with dimension reduction through learning of non-linear variance-constrained mapping |
| DE19540309A1 (de) * | 1995-10-28 | 1997-04-30 | Philips Patentverwaltung | Halbleiterbauelement mit Passivierungsaufbau |
| US6404923B1 (en) * | 1996-03-29 | 2002-06-11 | Microsoft Corporation | Table-based low-level image classification and compression system |
| US5826225A (en) * | 1996-09-18 | 1998-10-20 | Lucent Technologies Inc. | Method and apparatus for improving vector quantization performance |
| DE19829944C2 (de) * | 1998-07-04 | 2002-03-28 | Zeiss Carl Jena Gmbh | Verfahren und Anordnung zur Gerätekonfiguration eines Fluoreszenz-Laserscanmikroskops |
-
2000
- 2000-12-30 DE DE10065783A patent/DE10065783B4/de not_active Expired - Fee Related
-
2001
- 2001-11-29 EP EP01128293.6A patent/EP1219919B1/de not_active Expired - Lifetime
- 2001-12-17 US US10/023,490 patent/US20020085763A1/en not_active Abandoned
Also Published As
| Publication number | Publication date |
|---|---|
| EP1219919A3 (de) | 2003-07-30 |
| EP1219919B1 (de) | 2015-05-27 |
| US20020085763A1 (en) | 2002-07-04 |
| DE10065783B4 (de) | 2007-05-03 |
| DE10065783A1 (de) | 2002-07-11 |
Similar Documents
| Publication | Publication Date | Title |
|---|---|---|
| DE102011088393B4 (de) | Bestimmen einer Gesamtzahl an Personen in einem IR-Bild, das mittels eines IR-Bilderzeugungssystems gewonnen wird | |
| DE60226043T2 (de) | Verfahren für quantitative video-mikroskopie und vorrichtung und programm zur durchführung des verfahrens | |
| DE60037437T2 (de) | Optimierung einer lichtleitersonde für spektroskopische messungen | |
| DE69322095T2 (de) | Verfahren und gerät zur identifizierung eines objekts mittels eine geordneten folge von grenz-pixel-parametern | |
| WO2003098313A2 (de) | Verfahren und anordnung zur untersuchung von proben | |
| DE2823490A1 (de) | Verfahren zur analyse von organismus- zellen | |
| EP1610270A2 (de) | Verfahren zur qualitativen Beurteilung eines Materials mit mindestens einem Erkennungsmerkmal | |
| DE2344528A1 (de) | Verfahren und vorrichtung zur analyse unter verwendung von farb-algebra und von bild-verarbeitungsverfahren | |
| EP4016081B1 (de) | Verfahren und vorrichtung zum detektieren einer präsenz eines fluoreszenzmustertyps auf einem organschnitt mittels immunfluoreszenzmikroskopie | |
| DE19829944A1 (de) | Verfahren und Anordnung zur Gerätekonfiguration von konfokalen Mikroskopen | |
| EP3598195A1 (de) | Verfahren zur mikroskopischen auswertung | |
| DE112022003311T5 (de) | Informationsverarbeitungsvorrichtung, system zur beobachtung biologischer proben und bilderzeugungsverfahren | |
| DE10250100A1 (de) | Mikroskopsystem und Verfahren zur Analyse und Auswertung von Mehrfachfärbungen eines mikroskopischen Objekts | |
| WO2003098174A1 (de) | Verfahren und vorrichtung zur spektral differenzierenden, bildgebenden messung von fluoreszenzlicht | |
| DE102021114288A1 (de) | Synthetische fluoreszenzbilder mit proben-spezifischer referenz | |
| DE10339312A1 (de) | Verfahren zur Trennung von Fluoreszenzspektren von in einer Probe vorhandenen Farbstoffen | |
| DE102023110122A1 (de) | Lichtmikroskopisches verfahren, recheneinheit, lichtmikroskop und computerprogrammprodukt | |
| DE112022002756T5 (de) | Informationsverarbeitungsvorrichtung, system zur beobachtung biologischer proben und bilderzeugungsverfahren | |
| DE10065783B4 (de) | Verfahren, Anordnung und System zur Ermittlung von Prozessgrößen | |
| DE102017215158B4 (de) | Detektionssystem | |
| DE10317669B4 (de) | Verfahren zur Separierung von Detektionskanälen eines mikroskopischen Systems | |
| DE10355150B4 (de) | Verfahren und System zur Analyse von Co-Lokalisationen | |
| DE102021114307A1 (de) | Digitale kontrastnachbearbeitung von mikroskopiebildern | |
| WO2021008927A1 (de) | Verfahren zur untersuchung von substanzen, computerprogrammprodukt zur verwendung in diesem verfahren, sowie mobiles elektronisches gerät | |
| DE102024106574A1 (de) | Virtuelle färbung basierend auf mehreren sätzen von bildgebungsdaten mit mehreren phasenkontrasten |
Legal Events
| Date | Code | Title | Description |
|---|---|---|---|
| PUAI | Public reference made under article 153(3) epc to a published international application that has entered the european phase |
Free format text: ORIGINAL CODE: 0009012 |
|
| AK | Designated contracting states |
Kind code of ref document: A2 Designated state(s): AT BE CH CY DE DK ES FI FR GB GR IE IT LI LU MC NL PT SE TR |
|
| AX | Request for extension of the european patent |
Free format text: AL;LT;LV;MK;RO;SI |
|
| PUAL | Search report despatched |
Free format text: ORIGINAL CODE: 0009013 |
|
| AK | Designated contracting states |
Designated state(s): AT BE CH CY DE DK ES FI FR GB GR IE IT LI LU MC NL PT SE TR |
|
| AX | Request for extension of the european patent |
Extension state: AL LT LV MK RO SI |
|
| RIC1 | Information provided on ipc code assigned before grant |
Ipc: 7G 01B 9/04 A Ipc: 7G 01N 21/31 B Ipc: 7G 02B 21/00 B |
|
| 17P | Request for examination filed |
Effective date: 20030912 |
|
| AKX | Designation fees paid |
Designated state(s): DE FR GB |
|
| RAP1 | Party data changed (applicant data changed or rights of an application transferred) |
Owner name: LEICA MICROSYSTEMS CMS GMBH |
|
| 17Q | First examination report despatched |
Effective date: 20080910 |
|
| GRAP | Despatch of communication of intention to grant a patent |
Free format text: ORIGINAL CODE: EPIDOSNIGR1 |
|
| INTG | Intention to grant announced |
Effective date: 20140729 |
|
| GRAS | Grant fee paid |
Free format text: ORIGINAL CODE: EPIDOSNIGR3 |
|
| GRAP | Despatch of communication of intention to grant a patent |
Free format text: ORIGINAL CODE: EPIDOSNIGR1 |
|
| INTG | Intention to grant announced |
Effective date: 20141223 |
|
| GRAA | (expected) grant |
Free format text: ORIGINAL CODE: 0009210 |
|
| AK | Designated contracting states |
Kind code of ref document: B1 Designated state(s): DE FR GB |
|
| REG | Reference to a national code |
Ref country code: GB Ref legal event code: FG4D Free format text: NOT ENGLISH |
|
| REG | Reference to a national code |
Ref country code: DE Ref legal event code: R096 Ref document number: 50116480 Country of ref document: DE |
|
| REG | Reference to a national code |
Ref country code: FR Ref legal event code: PLFP Year of fee payment: 15 |
|
| REG | Reference to a national code |
Ref country code: DE Ref legal event code: R097 Ref document number: 50116480 Country of ref document: DE |
|
| PLBE | No opposition filed within time limit |
Free format text: ORIGINAL CODE: 0009261 |
|
| STAA | Information on the status of an ep patent application or granted ep patent |
Free format text: STATUS: NO OPPOSITION FILED WITHIN TIME LIMIT |
|
| 26N | No opposition filed |
Effective date: 20160301 |
|
| REG | Reference to a national code |
Ref country code: FR Ref legal event code: PLFP Year of fee payment: 16 |
|
| REG | Reference to a national code |
Ref country code: FR Ref legal event code: PLFP Year of fee payment: 17 |
|
| PGFP | Annual fee paid to national office [announced via postgrant information from national office to epo] |
Ref country code: FR Payment date: 20181129 Year of fee payment: 18 Ref country code: GB Payment date: 20181130 Year of fee payment: 18 |
|
| PGFP | Annual fee paid to national office [announced via postgrant information from national office to epo] |
Ref country code: DE Payment date: 20190131 Year of fee payment: 18 |
|
| REG | Reference to a national code |
Ref country code: DE Ref legal event code: R119 Ref document number: 50116480 Country of ref document: DE |
|
| GBPC | Gb: european patent ceased through non-payment of renewal fee |
Effective date: 20191129 |
|
| PG25 | Lapsed in a contracting state [announced via postgrant information from national office to epo] |
Ref country code: DE Free format text: LAPSE BECAUSE OF NON-PAYMENT OF DUE FEES Effective date: 20200603 Ref country code: GB Free format text: LAPSE BECAUSE OF NON-PAYMENT OF DUE FEES Effective date: 20191129 Ref country code: FR Free format text: LAPSE BECAUSE OF NON-PAYMENT OF DUE FEES Effective date: 20191130 |