EP1012599B1 - Analytical method and apparatus therefor - Google Patents
Analytical method and apparatus therefor Download PDFInfo
- Publication number
- EP1012599B1 EP1012599B1 EP98942856A EP98942856A EP1012599B1 EP 1012599 B1 EP1012599 B1 EP 1012599B1 EP 98942856 A EP98942856 A EP 98942856A EP 98942856 A EP98942856 A EP 98942856A EP 1012599 B1 EP1012599 B1 EP 1012599B1
- Authority
- EP
- European Patent Office
- Prior art keywords
- test mixture
- gradient
- pka
- fluid
- test
- Prior art date
- Legal status (The legal status is an assumption and is not a legal conclusion. Google has not performed a legal analysis and makes no representation as to the accuracy of the status listed.)
- Expired - Lifetime
Links
Images


Classifications
-
- G—PHYSICS
- G01—MEASURING; TESTING
- G01N—INVESTIGATING OR ANALYSING MATERIALS BY DETERMINING THEIR CHEMICAL OR PHYSICAL PROPERTIES
- G01N31/00—Investigating or analysing non-biological materials by the use of the chemical methods specified in the subgroup; Apparatus specially adapted for such methods
- G01N31/16—Investigating or analysing non-biological materials by the use of the chemical methods specified in the subgroup; Apparatus specially adapted for such methods using titration
- G01N31/166—Continuous titration of flowing liquids
-
- G—PHYSICS
- G01—MEASURING; TESTING
- G01N—INVESTIGATING OR ANALYSING MATERIALS BY DETERMINING THEIR CHEMICAL OR PHYSICAL PROPERTIES
- G01N21/00—Investigating or analysing materials by the use of optical means, i.e. using sub-millimetre waves, infrared, visible or ultraviolet light
- G01N21/75—Systems in which material is subjected to a chemical reaction, the progress or the result of the reaction being investigated
- G01N21/77—Systems in which material is subjected to a chemical reaction, the progress or the result of the reaction being investigated by observing the effect on a chemical indicator
- G01N21/78—Systems in which material is subjected to a chemical reaction, the progress or the result of the reaction being investigated by observing the effect on a chemical indicator producing a change of colour
- G01N21/79—Photometric titration
-
- B—PERFORMING OPERATIONS; TRANSPORTING
- B01—PHYSICAL OR CHEMICAL PROCESSES OR APPARATUS IN GENERAL
- B01J—CHEMICAL OR PHYSICAL PROCESSES, e.g. CATALYSIS OR COLLOID CHEMISTRY; THEIR RELEVANT APPARATUS
- B01J2219/00—Chemical, physical or physico-chemical processes in general; Their relevant apparatus
- B01J2219/00274—Sequential or parallel reactions; Apparatus and devices for combinatorial chemistry or for making arrays; Chemical library technology
- B01J2219/0068—Means for controlling the apparatus of the process
- B01J2219/00702—Processes involving means for analysing and characterising the products
- B01J2219/00707—Processes involving means for analysing and characterising the products separated from the reactor apparatus
Definitions
- the present invention relates to an improved analytical method and apparatus therefor, in particular to a method and apparatus for titration.
- Many compounds have physicochemical properties which vary according to their chemical or physical environment, which properties can be investigated by changing that environment and observing the effects on the test compound.
- properties are ionisation state, solubility, partitioning between e.g. organic and aqueous phases or into micelles or liposomes, the strength of ligand binding or metal complexing and hydrophobicity, which can vary with environmental parameters such as pH, ionic strength, or the concentrations of other species in the system.
- Analytical chemists studying the properties of chemical or biological molecules have long counted titration amongst the major tools of their trade as it allows one parameter of a system, e.g. the pH of a solution, to be varied by dropwise addition of one or more reagents whilst other parameters of the system remain essentially constant, allowing the effects of the variation to be studied effectively in isolation.
- An example of a property which can be determined by titration is the pKa (or dissociation constant) of an ionisable group of a compound, which can be defined as the pH at which the group is 50% ionised.
- the level of ionisation of a given ionisable group at any pH can be directly calculated once the pKa is accurately known.
- a given molecule may have multiple pKas if it contains more than one ionisable group. As a molecule's state of ionisation can alter other properties such as hydrophobicity and aqueous solubility, knowledge of the pKa(s) of a potential drug molecule is of great importance.
- 5,192,509 describes an automated titration apparatus and method in which a mixture formed from a sample solution and two or more titrants is passed through a colour detector, utilising a constant volume and flow of sample and indicator with a variable (e.g. increasing) flow of titrant such that the total volume and flow of the mixture varies (e.g. increases) with time.
- a variable e.g. increasing
- the present invention provides a method of continuous titration in which at least one parameter of at least one compound in a test mixture may be monitored as the composition of the mixture is continuously varied.
- the continuous variation may be characterised by changing concentration of one or more species or components in the mixture, for example a continuous, preferably linear increase or decrease in the concentration of the species or component.
- the present method has the further advantage that, as solutions are not added dropwise but are continuously mixed in varying proportions, the accuracy is no longer limited by the size of drops added. Furthermore, the process can be speeded up considerably; as mixing is continuous, there is no waiting time whilst the mixture equilibrates after addition of each drop. The limiting step may then be the flow rate achievable through the pumps, mixers and tubes used.
- a further advantage of the present method is that it can better take advantage of the rate of data sampling at the detector which, in a modern instrument such as a diode array spectrophotometric detector with fixed geometry optics, can be very high e.g. 100 readings per second may be possible although in practical embodiments, 10-30 readings per second, e.g. 20 per second may be taken.
- High data sampling rates allow the option of "data smoothing" or noise reduction. For example if 20 readings per second are taken, these can be averaged over 10 readings to give an effective sampling rate of 2 per second. This averaging can provide more sensitive detection than conventional methods of spectrophotometric detection.
- the % volumes of the second and third components are preferably variable in inverse proportion to one another; as the % volume of one rises, the % volume of the other falls, so as to keep the total volume of the mixture constant.
- the variable components may comprise buffer solutions, solvents, test reagents, organic and aqueous phases or other fluid components which may be varied relative to one another to alter the physical or chemical environment of the compound under test.
- further fluid components may be included in the test mixture, at constant or variable volume.
- salt solutions may be employed to maintain a chosen ionic strength
- indicators may be added or the amount of water (or other solvent) may be adjusted to compensate for changes made to the volume of other fluid components.
- variable components comprise two linearising buffers - that is two buffers whose relative proportions may be altered to produce a linear pH gradient.
- These buffers will desirably be formed from components such as an acid and a basic salt of the same compound so that the overall chemical composition of the mixture remains constant during titration and no additional ionic species are introduced.
- This uniformity of chemical environment gives a measure of predictability to the behaviour of compounds introduced into the titration system, as the behaviour of some compounds can alter if the chemical environment changes significantly even, in rare cases, leading to the compound precipitating from solution as a solid salt forms.
- the present invention provides an analytical device comprising at least two input ports in fluid communication with a common channel, and a detection zone having an input in fluid communication with the common channel and an output, the device further comprising a spectrophotometric detector for monitoring fluid flowing through the detection zone and producing data relating to at least one chemical or physical characteristic of a component of the fluid.
- Control means may be associated with the input ports for controlling the relative amounts of fluid introduced into the common channel through each port.
- the detector may be any suitable spectrophotometric (i.e. radiation-detecting) analytical detector e.g. an ultraviolet or visible range spectrophotometer, a fluorimeter, a polarimeter, a colourimeter, or a light scattering, optical rotation or circular dichroism detector.
- spectrophotometric i.e. radiation-detecting
- analytical detector e.g. an ultraviolet or visible range spectrophotometer, a fluorimeter, a polarimeter, a colourimeter, or a light scattering, optical rotation or circular dichroism detector.
- the control means for controlling the relative amounts of fluid introduced into the common channel through each port may be e.g. a pump controller such as is commonly used with HPLC instruments.
- one or more of the input ports may have associated with it a syringe by which a fluid may be introduced through the port into the common channel, the plungers of the syringes being moved mechanically under the control of e.g. a computer.
- the skilled man will be able to envisage other means by which the input of fluids into the common channel may be controlled, such that the proportions of the fluids making up the test mixture and the rate of flow of the test mixture along the common channel through the detection zone may be controlled.
- an HPLC mixer pump is connected to reservoirs of each fluid component of the test mixture.
- the mixer pump takes the fluid containing the test compound at a constant rate and mixes it with a first buffer solution pumped at an increasing rate and a second buffer solution pumped at a decreasing rate, so that the total volume and flow rate of the resulting mixture remains constant, but the relative amounts of each component of the flowing mixture change over time.
- the changing proportions of the two linearising buffer solutions in the mixture preferably result in changing the pH of the mixture as a whole and are desirably controlled to give a linear pH change over time.
- Such a system may be used to determine e.g. the pKa(s) of a test compound.
- an autosampler carousel contains reservoirs of a number of solubilised compounds to be tested, and a number of automatic syringes each contain a reservoir of one other fluid component of the test mixture, for example a first and a second buffer solution.
- the first buffer solution is then pumped at an increasing rate from a first automatic syringe to a mixing chamber and a second buffer solution is pumped to the mixing chamber at a decreasing rate, so that the total volume and flow rate of the resulting mixture remains constant, but the relative amounts of each component of the flowing mixed buffer stream change over time.
- DMPC liposomes but the skilled man will be able to select an appropriate mixture to suit the test compound, from his own knowledge.
- a linear pH gradient test mixture stream may be formed as discussed above and brought into contact with a flowing organic phase (e.g. octanol) stream, for example using a microscale chemical processing device being developed by CRL (Central Research Laboratories Ltd., associated with EMI Group plc) and BNFL (British Nuclear Fuels Limited). This device is specifically designed to allow aqueous and organic phases to flow in contact with each other and then be clearly separated. Details may be found in "Eureka, Transfers Technology" October 1997, page 42. From the difference in the pKa of the test compound with and without contact with the organic phase, the partition coefficient may be calculated.
- the fluids whose proportions are to be varied may include one or both of the binding reagents themselves, and/or salt solutions or buffers for controlling the ionic strength and/or pH of the mixture.
- test solute may be introduced in the manner discussed above, as a constant proportion of the test mixture.
- pH being varied as a function of time by the mixing of e.g. two buffers
- the ligand of interest is titrated against water or a solvent of relevance in the presence of solute, thus giving a continuous, preferably linear, gradient of ligand concentration.
- An example of such a system is nickel(II):Ethylenediamine.
- Possible interactions which could be studied using the techniques and apparatus of the present invention include those between enzymes and their substrates or cofactors, chelators and metal ions, receptors and their agonists or antagonists, antibodies and their antigens, or the strength of interaction in any form of complex or specific binding pair.
- the data produced could be analysed using traditional techniques. This approach could be advantageous over other approaches as no dilution factor need be corrected for.
- the automatic syringes, or reservoirs and mixer pump, discussed above may be replaced by other pumping systems which can handle very small volumes with high precision and accuracy.
- Other suitable pumping systems include peristaltic pumps (although these may lead to pulsing of the pumped mixture) and digital on-off valve pumps in microtubing.
- the apparatus may comprise two or more different sorts of pump. Where a mixer pump is not employed, desirably some other means of efficiently mixing the components of the test mixture stream will be used, for example a mixing coil, a mixer T-piece or a spin-mixer.
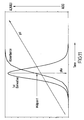
- the mid-point (inflexion point) of this curve can be determined by curve-fitting, or by taking the 1 st derivative of the absorbance readings against pH, which gives a peak corresponding to the point of inflexion.
- Use of the first derivative plot allows pKas which lie close to the ends of the pH gradient to be determined, as the gradient need only run a short way past the inflexion point for the first derivative plot to peak and begin its down-turn.
- the inflexion point of the curve-fitted absorbance trace can only easily be determined if the lowest and highest absorbance levels can be seen on the trace, which requires a longer span of the pH gradient, as can be seen from figure 11 .
- TFA target factor analysis
- PCA - refs D. Perez-Bendito, Analyst, Vol. 115, 689-698 (1990 ) and E.R. Malinowski, Factor Analysis in Chemistry, 2nd Ed. 1991, pub. Wiley, New York
- PCA - refs D. Perez-Bendito, Analyst, Vol. 115, 689-698 (1990 ) and E.R. Malinowski, Factor Analysis in Chemistry, 2nd Ed. 1991, pub. Wiley, New York
- the present invention is particularly advantageous in the analysis of poorly soluble compounds, as only very small concentrations and volumes of solutions are required i.e. 100s down to 10s of micrograms per millilitre, and 100s of microlitres, rather than 100s of millilitres for traditional methods. Also, the use of highly sensitive detectors combined with high data sampling rates allows the introduction of noise-reduction techniques and means that much less concentrated test solutions may be used. Furthermore, it is not necessary to know the concentration of the test compound, because the output can be presented graphically and the changes in e.g. absorbance are plotted rather than absolute values, graphical shape changes showing the changing ionisation state, phase or other changes in the test compound. It is sufficient that the concentration is such that the chromophore is detectable by the spectrophotometer.
- the present invention provides methods and apparatus which will assist in overcoming these problems.
- problems in relation to sample purity when compounds are synthesised as part of a library and the level of automation achievable by the use of continuous titration methodology as described herein may provide a means for overcoming those problems also.
- the apparatus was assembled from equipment already available in the laboratory, and consisted of the following units:
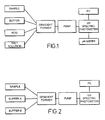
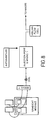
- the system initially developed used four solutions mixed into a linear gradient ( Fig. 1 ).
- the sample at constant % volume was titrated with acid (as in Fig. 1 ) or base and the % volume of salt solution was decreased as the acid or base increased, to maintain ionic strength within acceptable limits.
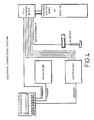
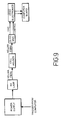
- the system was buffered by a constant % volume of buffer solution. Refinement of the buffering system has allowed this to be reduced to three components; a sample solution, the amount of which is not varied over the time that the gradient is run, and two linearising buffer solutions, one acidic and one basic, which are varied linearly over time in inverse proportion to one another. See Fig. 2 .
- the sample containing the test compound is drawn at a constant rate from the autosampler into channel A of the HP1050 pump.
- varying amounts of the other components are drawn into the pump.
- Universal buffer component B (basic component, see further below) is drawn into channel B from a reservoir.
- universal buffer compound A (acidic component) is drawn into channel C.
- One of the buffer components rises from zero or a low % volume of the test mixture at the start of the gradient to e.g. 80% or more of the mixture at the end.
- the other buffer falls from e.g. 80% or more of the mixture to zero or a low final concentration.
- test compound solution channel A
- other components e.g. water, surfactant micelles, reactant(s)
- the mixed components pass from the outlet of the HPLC pump to the Spectrophotometer (Kontron 440DAD) and then to waste, optionally via a pH meter which may be used to monitor the correct operation of the system, e.g. to check the linearity of the pH gradient formed.
- Kontron 440DAD Spectrophotometer
- pH meter which may be used to monitor the correct operation of the system, e.g. to check the linearity of the pH gradient formed.
- Tubing may suitably be 1/16" OD PEEK or stainless steel tubing.
- the apparatus can be set to run through a repeating cycle during which there may be four distinct phases: 1) The buffers and any other components are pumped through the HPLC pump at constant rates in fixed ratios to give a stable starting point for the gradient. 2) The gradient is run by varying the ratios of the buffer components. 3) The final conditions of the gradient may be maintained for a short period before 4) the system recycles (which may include flushing with water of other suitable solvent at the end of the cycle), in preparation for the drawing up of the next sample.
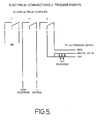
- the autosampler is connected to the pump, spectrophotometer and terminal block. These contacts are digital signals which specify the start and finish of the experimental cycle, these contact closure events are driven by the autosampler.
- the signals to the pump and spectrophotometer are contact closures, the signal to the terminal block is a contact opening. This is shown in more detail in figure 5 .
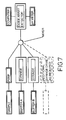
- Figure 7 shows a similar apparatus arrangement to that of figure 2 , but the buffer components are introduced into the mixer from automatic syringes rather than being drawn up by the mixer pump from a reservoir. Any extra components such as micelle suspension for a partitioning experiment may also be introduced by syringe as may the test samples, if desired, although if multiple samples are to be tested the use of an autosampler instead of a pump or a syringe provides a convenient means of automation.
- This apparatus uses the following units:
- the two flow streams from the syringe dispensers are mixed using a mixing T which has a total volume of 4 ⁇ l.
- the flow stream then passes through a coil to aid mixing and then on to the injection port, located on the autosampler.
- the autosampler can inject samples in to the flow stream at this point. From the injection site, the stream flows on to the spectrophotometer's remote flow cell and then out to waste.
- FIG 9 can be seen the electrical and fiberoptic connections associated with the detector used with the apparatus of Fig. 8 .
- the deuterium lamp is controlled via a transistor-transistor logic (TTL) signal which in-turn controls the power circuitry in the power supply.
- TTL transistor-transistor logic
- the deuterium lamp should be warmed up before commencing experiments. This is typically for about half an hour.
- the TTL signal is controlled via the computer, allowing the lamp to be turned off and on automatically.
- a transmission fibre optic runs from the lamp to transmit the light from the lamp to the cell holder.
- the cell holder is used to position the flow cell in-line with the light path.
- the position of the receiving fibre can be adjusted within the cell holder, and then fixed in place using a locking screw.
- This fibre then connects to the MMS spectrophotometer.
- the MMS 12-bit adapter electronics perform the data capture from the spectrophotometer, under the control of signals from the CIO-DAS 16jr computer board.
- the main control program has been programmed as a LabView Virtual Instrument. It is used to control the main peripherals :
- the main control program initially configures all the external peripherals and brings them into a ready state.
- the user can select a filename for where they want all the data to be saved from the run about to commence. Once this is completed, the instrument enters a holding state where the user can either run experiments individually totally under their control, or they can set a programmed number of samples to run continuously until completion.
- the Sirius Gradient System includes an 80C552 microprocessor based control board, two Sirius syringe dispensers, a Datavision LCD and a keypad.
- the LCD and keypad provides a simple user interface that allows a user to programme gradient control variables for the flow stream.
- the gradient system can also be controlled via an RS-232 interface.
- the gradient module has an embedded software program that allows the user to set up experimental parameters for generating the gradient.
- the set up parameters for the gradient control are :
- the gradient control protocol can be started using an external trigger signal, supplied automatically from the main control computer. When this signal is detected the gradient module begins its operational run, at the end of which it automatically reloads, then waits for the next trigger signal for the start of the next experiment.
- FIG. 10 shows a flow chart of the autosampler control.
- the arm then moves to the injection point.
- a trigger is sent to the gradient module to start the gradient flow and also to the deuterium lamp.
- data collection begins at 0.5 second intervals.
- the sample is injected into the gradient stream.
- the instrument actually captures six scans from the spectrophotometer, averages the last five scans and uses this average as the stored scan. This is done by calling a CIN (Code interface node) which liaises with the CIO-DAS 16/Jr board, collects the 256-absorbance spectra and returns this data array to the VI which saves it on disk in the specified file.
- CIN Code interface node
- the data capture routine has been simplified by implementing hardware to control and time the data acquisition of the signal from the diode array.
- the hardware is encompassed in the Zeiss electronics, along with the signal conditioning electronics.
- the data capture routine is required to send a trigger signal to indicate that a scan is required.
- the Zeiss electronics controls the diode array and the data capture board.
- the Zeiss electronics also conditions the signal from 0V to +2.5V, making full use of the resolution of the Analogue-to-digital converter (ADC).
- ADC Analogue-to-digital converter
- a dark scan (lamp off) is made, and this result is subtracted from all other scans (lamp on).
- the signal is sampled six times, the first scan is discarded and the remaining five scans are then averaged. This averaged scan is then saved to disk. This takes about 300ms. Scans are recorded at 500ms intervals.
- the resultant data file contains 256 wavelengths of data for each sample.
- the convert program allows the user to specify which wavelengths need to be extracted for use in the data processing algorithm, and formats the resultant data file.
- the 1 st derivative program must be run first to calculate the pH gradient.
- the pH gradient is calculated by using data from compounds that have well defined pKas, and have thus been termed 'standards'. This then provides the pH scale required for the TFA algorithm.
- a blank sample (just water or appropriate solvent) and calibration standards must be run.
- the blank sample provides a blank profile, providing absorption information due to the gradient and the water. This must be subtracted from all the standard/sample runs. This then provides an absorption profile purely due to the standard/sample.
- the data processing algorithm uses a linear fit algorithm to smooth the data and then performs the derivative upon the slope of the linear fit. The user is able to specify the number of points over which the fit is applied (it must be an odd number of points). The data processing algorithm is applied to each point in the data file. Once this has been completed, peaks need to be found. This is done by dividing the data into cells (user specified size), and in each cell, searching for peaks that fit the criteria for a minimum or maximum peak.
- Figure 2 shows a diagrammatic representation of apparatus used to form a buffered linear pH gradient. The following pKa determination experiment was performed on this apparatus.
- a linear pH gradient was created by mixing a sample solution, the amount of which is not varied over the time that the gradient is run, and two buffer solutions, one acidic and one basic, which are varied linearly over time in inverse proportion to one another.
- the two buffers have a common component to which an acidic component is added to form buffer A and a basic component is added to form buffer B.
- the buffers were made up as follows:
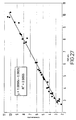
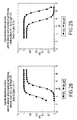
- Figure 18 shows that the pH gradient is essentially linear from pH 3 to 11.
- Compounds of known pKa were run in a continuous (rather than stepped) gradient on the apparatus of Fig. 2 , in which the amount of buffer A ran from 80% to 0% and of buffer B from 0% to 80% of the test mixture over 4 minutes.
- the sample solution was kept constant at 20%.
- the HP1050 pump was used again with buffer B introduced via channel B and buffer A via channel C.
- the flow rate of the test mixture stream from the mixer to the detector was 1 cm 3 min -1 .
- the absorbance changes at 240nm, 265nm, 290nm and 315nm were recorded and the peak maxima of the 1 st derivative plots determined.
- a calibration curve ( Fig. 12 ) was created from the time to peak maxima and the known pKa values (determined by conventional titration) of the standards. Compounds of known pKa were also determined as test solutes.
- Time to peak maximum is from the start of the instrument cycle (when the autosampler first goes into a new sample container).
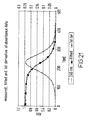
- Figs. 13,14 and 15 show the calibration curve ( Fig. 13 ) with the absorbance curve at 290nm ( Fig. 14 ) and the 1st derivative plot ( Fig. 15 ) for 4-CN phenol run on the above gradient.
- the pKa value corresponding to the time of the peak maximum (361 seconds) is read from the calibration curve for this pH gradient, the pKa derived is 7.64.
- the expected result is 7.7 (derived from traditional stepwise titration using the Sirius PCA101 instrument).
- the method could be further enhanced by incorporation of the calibration curve into the data handling routines, for example the computer which stores the absorbance readings generated by the detector may be programmed to find the first derivatives of these readings, determine the time of the peak reading and, for example using a look-up table derived from the calibration curve absorbance readings, produce an output reading giving the pKa of the sample.
- the pKa reading would then be the only output - no calculations would be required on the part of the operator.
- the buffer recipes have been further optimised to improve gradient linearity while maintaining physiological ionic strength without significantly reducing the buffer capacity.
- the Components were also chosen with minimal UV/visible absorption characteristics. Recipes are shown below and compared to the recipe of Example 2A above:
- Component A acidic buffer
- Example 2A Optimised recipe recipe TRIS (M) 0.020 0.01237 Boric acid (M) 0.020 0.01397 Butylamine (M) 0.020 0.01514 Citric acid (M) 0.020 0.01391 KH 2 PO 4 (M) 0.020 0.01264 HCl (M) 0.035 0.03
- Component B (basic buffer): Example 2A Optimised recipe recipe TRIS (M) 0.020 0.01237 Boric acid (M) 0.020 0.01397 Butylamine (M) 0.020 0.01514 K 3 Citrate (M) 0.020 0.01391 K 2 HPO 4 (M) 0.020 0.01264 KOH (M) 0.020
- buffer component B is dispensed at a flow-rate of 1 ml/min and sample injected downstream (from the CAVRO autosampler) at a flow-rate of 0.25ml/min to produce a total flow of 1.25ml/min. Before each experiment a dark spectrum (lamp off) is recorded. After the flow has reached the Hellma flow-cell (model 178.713, path length 10mm, volume 8 ⁇ L) the deuterium lamp (Cathodeon) is switched on from the Cathodeon C720 deuterium pulsed lamp power supply and a reference energy spectrum recorded with sample and buffer B present.
- the deuterium lamp Cathodeon
- the gradient is started and run over a time period of 240 seconds during which the buffer components are varied linearly over time in inverse proportion to one another, starting with component B (basic buffer) and changing to component A (acidic buffer) at the end of the 240s time period.
- the total gradient flow-rate is maintained at 1ml/min.
- buffer A and sample are allowed to run through for a short period of time to push the end of the gradient through the flow-cell before switching back to buffer B, to restore the initial conditions ready for the next sample.
- spectra are recorded at 0.5 second intervals for the duration of the gradient using a Zeiss 256 wavelength photodiode array and 12-bit data capture electronics. Each spectrum consists of the average of five scans using an integration time of 50 milliseconds and records the energy count per diode channel minus the dark current.
- a 1-10mg sample is weighed into a vial to which 1ml methanol is dispensed, to aid sample dissolution, followed by 10ml de-ionised water (>10 14 M ⁇ ).
- the solutions are drawn into 5ml disposable syringes and dispensed directly into test tubes through disposable nylon filters to remove undissolved solid.
- the test-tubes are transferred directly to the Cavro autosampler unit for sample analysis.
- the sample flow makes up 20% of the total flow so that typical sample concentrations at the flow-cell detector are 10 -3 - 10 -5 M.
- the first stage is to establish the pH scale using the peak maximum time in the first derivative of the absorbance curve.
- Blanks are processed first and subtracted from all sample and standard spectra. Peak times of the standards are plotted against the known pKa values and the calibration history saved to file. For a given set of experimental conditions the calibration regression equation has been shown to be remarkably consistent for periods of weeks reducing the necessity of more than daily calibration.
- sample data can be processed. Typically, up to twenty evenly spaced wavelengths are selected for sample analysis ranging from 210 - 350nm and energy counts converted to absorbance as above. Internal referencing can also be applied by selecting a non-absorbing region of the spectrum (usually 420-440nm) and establishing a baseline from a Blank to correct for any drift.
- Target Factor Analysis is applied to determine the pKa values of samples.
- the first derivative method can also be applied to samples with non-overlapping pKa values.
- the continuous titration method has proven an accurate method for determination of pKas across a wide pH range and for compounds with multiple pKas which have been difficult to determine by traditional methods.
- This behaviour can be studied using the continuous titration method and apparatus described above by including a fourth component in the gradient mixture.
- This component comprises micelles formed from surfactants such as sodium dodecyl sulphate (SDS).
- SDS sodium dodecyl sulphate
- concentration of surfactant in the fourth component must be high enough that in the final test stream, mixed from the four components, the surfactant is present in excess of its critical micelle concentration (CMC) and micelles are formed.
- CMC critical micelle concentration
- the continuous titration apparatus was set up with the following sample queue: 1. Blank (water only) 10. E 2. Blank (water only) 11. F 3. Blank (water only) 12. G 4. STD1 13. H 5. STD2 14. I 6. A 15. STD1 7. B 16. STD2 8. C 17. Blank (water only) 9. D 18. Blank (water only)
- Vo is taken as the volume of SDS micelles.
- KHP potassium hydrogen phthalate
- test solute KHP
- the test solute KHP was introduced in the sample stream of the apparatus of Fig. 2 at a constant 20% of the final mixture, as in Example 2 above.
- the two components of the gradient (from 80% to zero and zero to 80% respectively) are 0.05M KOH and water.
- the end-point indicator was introduced via the sample stream (2 drops phenolphthalein solution in 20cm 3 of sample).
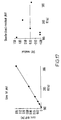
- test solute KHP was titrated by the KOH stream. As soon as all compound has been titrated there is a large increase in pH and rapid change of the ionisation state of the indicator and hence a rapid colour change.
- the system was calibrated by the use of KHP standards of known concentration.
- Example traces obtained are shown in Figure 16 .
- the diode away detector was set up to detect at four wavelengths: 540nm, 550nm, 560nm and 570nm.
- Solvent A H 2 O Solvent B: 0.05N KOH
- the solvents were dispensed from 5cm 3 syringes.
- the flow rate through the flow cell was 0.8cm 3 min -1 .
- Gradient time was 240s with a pre-gradient flow of 75s and post-gradient flow of 90s followed by a post-gradient restoration period of 45s, giving a 7.5 minute cycle time overall.
- the autosampler was set up with a dispensing rate of 0.2cm 3 min -1 and a 7.5 minute cycle time. Blanks, standards and samples were run in the following order:
- Zinc ions form a complex with Xylenol orange to give an intense red colour absorbing at 580nm.
- EDTA ethylenediaminetetracetic acid
- the Zn ++ preferentially forms a complex with the EDTA. Once all the Zn ++ has formed the EDTA-Zn ++ complex, then the Xylenol orange is once again in the free form, which is yellow in appearance and so a corresponding decrease in absorbance at 580nm is observed.
- the Zn ++ concentration in the measurement stream must be less than 14.976mM.
- 1.03g of Zn(NO 3 ) 2 .6H 2 O was weighed out and dissolved in 50cm 3 0.1 N acetate buffer (pH 4.9) to give a zinc stock solution of concentration 69.25mM.
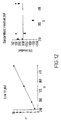
- the autosampler was set up with the 7.5 minute cycle time and a 0.2mM min -1 dispensing rate and the standards were run against the EDTA gradient to establish a calibration curve (see Fig. 20 ).
- the first derivative curve could not be fitted to the absorbance data involving high concentration standards. This is thought to be due to insufficient buffering of the standard solutions, which therefore did not give a clear colour change in the xylenol orange indicator.
- a linear calibration curve was obtained ( Fig. 20 ). This experiment shows clearly that the continuous titration method can be used for complexometric titrations. In the example shown here buffering capacity was insufficient, but this could be improved by using buffer for making up the EDTA solution.
- the third method of analysis which can be applied to the data generated in the continuous titration spectroscopic methods of the present invention is "curve fitting".
- This method of analysis can be used with much smaller spectral changes, is fairly insensitive to non-linearity in the pH gradient, requires data from only a single wavelength, does not require data smoothing and is not very computationally intensive.
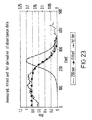
- the raw data, fitted curves and (for comparison) first derivative curves are plotted for each wavelength in Figs. 21 to 24 .
- log P log ( 10 ch ⁇ pKa - pKa ⁇ - 1 ) / R
- pKa pKa in H 2
- pKa' pKa in the presence of organic phase
- ch charge in molecule (-1 for acids, +1 for bases)
- volume ratio volume of organic phase ⁇ volume of aqueous phase.
- log P is approximately equivalent to the difference between pKa and pKa'.
- A % ionised 100 ⁇ A 1 + 100 - % ionised 100 ⁇ A 0
Landscapes
- Health & Medical Sciences (AREA)
- Chemical & Material Sciences (AREA)
- Physics & Mathematics (AREA)
- Life Sciences & Earth Sciences (AREA)
- General Physics & Mathematics (AREA)
- Immunology (AREA)
- Pathology (AREA)
- Analytical Chemistry (AREA)
- Biochemistry (AREA)
- General Health & Medical Sciences (AREA)
- Molecular Biology (AREA)
- Engineering & Computer Science (AREA)
- Chemical Kinetics & Catalysis (AREA)
- Plasma & Fusion (AREA)
- Investigating Or Analyzing Non-Biological Materials By The Use Of Chemical Means (AREA)
- Investigating Or Analysing Materials By The Use Of Chemical Reactions (AREA)
- Investigating Or Analysing Materials By Optical Means (AREA)
- Investigating Or Analysing Biological Materials (AREA)
- Sampling And Sample Adjustment (AREA)
- Saccharide Compounds (AREA)
- Preparation Of Compounds By Using Micro-Organisms (AREA)
- Medicines Containing Antibodies Or Antigens For Use As Internal Diagnostic Agents (AREA)
Applications Claiming Priority (3)
| Application Number | Priority Date | Filing Date | Title |
|---|---|---|---|
| GB9719142 | 1997-09-09 | ||
| GBGB9719142.3A GB9719142D0 (en) | 1997-09-09 | 1997-09-09 | Analytical method and apparatus therefor |
| PCT/GB1998/002711 WO1999013328A1 (en) | 1997-09-09 | 1998-09-09 | Analytical method and apparatus therefor |
Publications (2)
| Publication Number | Publication Date |
|---|---|
| EP1012599A1 EP1012599A1 (en) | 2000-06-28 |
| EP1012599B1 true EP1012599B1 (en) | 2009-01-07 |
Family
ID=10818787
Family Applications (1)
| Application Number | Title | Priority Date | Filing Date |
|---|---|---|---|
| EP98942856A Expired - Lifetime EP1012599B1 (en) | 1997-09-09 | 1998-09-09 | Analytical method and apparatus therefor |
Country Status (12)
| Country | Link |
|---|---|
| US (1) | US6913930B2 (enExample) |
| EP (1) | EP1012599B1 (enExample) |
| JP (1) | JP2001516054A (enExample) |
| CN (1) | CN1157600C (enExample) |
| AT (1) | ATE420350T1 (enExample) |
| AU (1) | AU742335B2 (enExample) |
| CA (1) | CA2303205C (enExample) |
| DE (1) | DE69840450D1 (enExample) |
| ES (1) | ES2319469T3 (enExample) |
| GB (1) | GB9719142D0 (enExample) |
| HU (1) | HUP0004774A3 (enExample) |
| WO (1) | WO1999013328A1 (enExample) |
Cited By (3)
| Publication number | Priority date | Publication date | Assignee | Title |
|---|---|---|---|---|
| US9182353B2 (en) | 2010-07-22 | 2015-11-10 | Hach Company | Lab-on-a-chip for alkalinity analysis |
| US9180449B2 (en) | 2012-06-12 | 2015-11-10 | Hach Company | Mobile water analysis |
| USD768872S1 (en) | 2012-12-12 | 2016-10-11 | Hach Company | Cuvette for a water analysis instrument |
Families Citing this family (26)
| Publication number | Priority date | Publication date | Assignee | Title |
|---|---|---|---|---|
| EP1250587A1 (en) | 2000-01-28 | 2002-10-23 | Pion, Inc. | MEASUREMENT OF SOLUBILITY-pH PROFILES |
| CA2525880C (en) * | 2003-05-16 | 2011-10-11 | Cryobiophysica, Inc. | External gradient chromatofocusing |
| US7926024B2 (en) * | 2004-06-14 | 2011-04-12 | Hyperformix, Inc. | Method and apparatus for managing complex processes |
| WO2007087433A2 (en) * | 2006-01-26 | 2007-08-02 | University Of Montana | Titration method using a tracer to quantify the titrant |
| JP2007263632A (ja) * | 2006-03-28 | 2007-10-11 | Miura Co Ltd | キレート剤の測定方法およびキレート剤の測定キット |
| EP2061571A4 (en) * | 2006-08-29 | 2012-06-06 | Cryobiophysica Inc | INDEPENDENT, SIMULTANEOUS, MULTI-COMPONENT MULTI-GRADIENT SYSTEM FOR LIQUID CHROMATOGRAPHY |
| JP5151904B2 (ja) * | 2008-10-23 | 2013-02-27 | 株式会社三菱化学アナリテック | 電位差滴定方法および電位差滴定装置 |
| US8382974B2 (en) * | 2009-08-18 | 2013-02-26 | Ceramatec, Inc. | Sensor to measure a concentration of alkali alcoholate |
| US8706426B2 (en) | 2010-04-16 | 2014-04-22 | University Of Central Florida Research Foundation, Inc. | Systems and methods for identifying classes of substances |
| US9321851B2 (en) * | 2011-03-07 | 2016-04-26 | Hercules Incorporated | Water soluble polymer powder formulation having improved dispersing properties |
| JP5681548B2 (ja) * | 2011-03-31 | 2015-03-11 | 日本光電工業株式会社 | 培地溶液のpH計測方法及びpH計測装置 |
| US8921113B2 (en) | 2012-12-21 | 2014-12-30 | Dionex Corporation | Buffer kit and method of generating a linear pH gradient |
| CN105301174B (zh) * | 2014-07-16 | 2017-07-18 | 中国科学院苏州纳米技术与纳米仿生研究所 | 用于微流控芯片的试剂滴定方法及装置、微流控芯片 |
| KR20160081669A (ko) * | 2014-12-31 | 2016-07-08 | 삼성전자주식회사 | 반응 장치, 검사 장치 및 검사 방법 |
| CN105115918A (zh) * | 2015-08-12 | 2015-12-02 | 泉州装备制造研究所 | 基于吸收光谱的pH值快速在线检测装置及方法 |
| US10871475B2 (en) * | 2017-02-21 | 2020-12-22 | Becs Technology, Inc. | Automated titration in a recirculating fluid system |
| US11231360B2 (en) | 2017-06-29 | 2022-01-25 | Hydrite Chemical Co. | Automatic titration device |
| US11397171B2 (en) * | 2017-09-18 | 2022-07-26 | Ecolab Usa Inc. | Adaptive range flow titration systems and methods with sample conditioning |
| BR112020020717B1 (pt) * | 2018-04-09 | 2023-10-24 | Ecolab Usa Inc | Sistema de titulação automatizado, e, método para quantificar uma concentração de analito alvo em uma corrente de amostra |
| US11397170B2 (en) * | 2018-04-16 | 2022-07-26 | Ecolab Usa Inc. | Repetition time interval adjustment in adaptive range titration systems and methods |
| CN110161164A (zh) * | 2019-04-16 | 2019-08-23 | 大连诚泽检测有限公司 | 一种流动式化学计量点测定装置及其应用 |
| US11022585B2 (en) | 2019-06-09 | 2021-06-01 | Dionex Corporation | Methods and systems for optimizing buffer conditions with liquid chromatography |
| DE102019120415A1 (de) | 2019-07-29 | 2021-02-04 | Endress+Hauser Conducta Gmbh+Co. Kg | Verfahren zur Bestimmung einer chemischen Aufnahmekapazität eines Prozessmediums in einer Messstelle sowie Messstelle zur Bestimmung einer chemischen Aufnahmekapazität eines Prozessmediums |
| EP3901621B1 (de) * | 2020-04-22 | 2022-05-04 | Safechem Europe GmbH | Vorrichtung und verfahren zur bestimmung von flüssigkeitsspezifischen parametern und/oder bestandteilen |
| CN116440724A (zh) * | 2023-04-19 | 2023-07-18 | 四川中测标物科技有限公司 | 一种基于临界流技术的浓度连续可调的稀释装置 |
| CN119619398B (zh) * | 2024-12-18 | 2025-10-14 | 湖北百杰瑞新材料股份有限公司 | 测定磷酸二氢锂纯度的方法 |
Family Cites Families (9)
| Publication number | Priority date | Publication date | Assignee | Title |
|---|---|---|---|---|
| US3484170A (en) | 1966-04-14 | 1969-12-16 | Technicon Corp | Automatic analysis method and apparatus |
| US3732164A (en) * | 1971-08-30 | 1973-05-08 | Administrator Of The Environme | Nitrogen removal from waste water by breakpoint chlorination |
| HU174711B (hu) | 1976-04-20 | 1980-03-28 | Egyt Gyogyszervegyeszeti Gyar | Sposob i ustrojstvo analiza prob zhidkostej |
| HUT61104A (en) | 1987-03-11 | 1992-11-30 | Gyoergy Horvai | Method for potenciometric detecting concentration of a component in a liquid sample |
| JPS6478164A (en) * | 1987-09-19 | 1989-03-23 | Nihon Parkerizing | Automatic analysis apparatus for phosphate chemical conversion bath liquid |
| US4810331A (en) | 1987-10-13 | 1989-03-07 | The Clorox Company | Surfactant sensing electrode for potentiometric titrations |
| US5149661A (en) * | 1988-06-08 | 1992-09-22 | Sarasep, Inc. | Fluid analysis with particulate reagent suspension |
| US5192509A (en) * | 1991-08-22 | 1993-03-09 | Halliburton Company | Apparatus for automatic titration |
| US5447612A (en) * | 1993-02-01 | 1995-09-05 | Protein Technologies, Inc. | Buffering system and its use in electrophoretic processes |
-
1997
- 1997-09-09 GB GBGB9719142.3A patent/GB9719142D0/en not_active Ceased
-
1998
- 1998-09-09 HU HU0004774A patent/HUP0004774A3/hu unknown
- 1998-09-09 JP JP2000511061A patent/JP2001516054A/ja active Pending
- 1998-09-09 CA CA2303205A patent/CA2303205C/en not_active Expired - Fee Related
- 1998-09-09 DE DE69840450T patent/DE69840450D1/de not_active Expired - Lifetime
- 1998-09-09 ES ES98942856T patent/ES2319469T3/es not_active Expired - Lifetime
- 1998-09-09 WO PCT/GB1998/002711 patent/WO1999013328A1/en not_active Ceased
- 1998-09-09 AT AT98942856T patent/ATE420350T1/de not_active IP Right Cessation
- 1998-09-09 AU AU90834/98A patent/AU742335B2/en not_active Ceased
- 1998-09-09 EP EP98942856A patent/EP1012599B1/en not_active Expired - Lifetime
- 1998-09-09 CN CNB988106876A patent/CN1157600C/zh not_active Expired - Fee Related
-
2003
- 2003-08-05 US US10/633,517 patent/US6913930B2/en not_active Expired - Fee Related
Cited By (3)
| Publication number | Priority date | Publication date | Assignee | Title |
|---|---|---|---|---|
| US9182353B2 (en) | 2010-07-22 | 2015-11-10 | Hach Company | Lab-on-a-chip for alkalinity analysis |
| US9180449B2 (en) | 2012-06-12 | 2015-11-10 | Hach Company | Mobile water analysis |
| USD768872S1 (en) | 2012-12-12 | 2016-10-11 | Hach Company | Cuvette for a water analysis instrument |
Also Published As
| Publication number | Publication date |
|---|---|
| AU9083498A (en) | 1999-03-29 |
| GB9719142D0 (en) | 1997-11-12 |
| AU742335B2 (en) | 2001-12-20 |
| EP1012599A1 (en) | 2000-06-28 |
| ES2319469T3 (es) | 2009-05-07 |
| ATE420350T1 (de) | 2009-01-15 |
| HUP0004774A2 (hu) | 2001-06-28 |
| CN1157600C (zh) | 2004-07-14 |
| WO1999013328A1 (en) | 1999-03-18 |
| CA2303205C (en) | 2010-06-01 |
| DE69840450D1 (de) | 2009-02-26 |
| HUP0004774A3 (en) | 2003-11-28 |
| US6913930B2 (en) | 2005-07-05 |
| HK1026479A1 (en) | 2000-12-15 |
| CN1278331A (zh) | 2000-12-27 |
| CA2303205A1 (en) | 1999-03-18 |
| JP2001516054A (ja) | 2001-09-25 |
| US20040023405A1 (en) | 2004-02-05 |
Similar Documents
| Publication | Publication Date | Title |
|---|---|---|
| EP1012599B1 (en) | Analytical method and apparatus therefor | |
| US6358745B2 (en) | Continuously variable volume chamber for flow injection analysis | |
| McGown et al. | Phase-resolved fluorescence spectroscopy | |
| EP0047130A2 (en) | Flow analysis | |
| US20100055802A1 (en) | Analysis using separation combined with chemical conversion followed by optical spectroscopy | |
| US20130277542A1 (en) | Mass analyzing apparatus, analyzing method and calibration sample | |
| Sultan et al. | Chemiluminescence assay of promethazine hydrochloride using acidic permanganate employing flow injection mode operated with syringe and peristaltic pumps | |
| Crouch et al. | Automated stopped-flow systems for fast reaction-rate methods | |
| HK1026479B (en) | Analytical method and apparatus therefor | |
| Owens et al. | Pulsed-flow instrument for measurement of fast reactions in solution | |
| US20110207616A1 (en) | Solid state synthesis hydroxyl radicals for high throughput structure determination of proteins and nucleic acids by oxidative footprinting | |
| Ji et al. | From at-line to online NMR: coupling probe-based autosampler with benchtop NMR | |
| Kuehl et al. | The quantitative analysis of a model fermentation broth | |
| Neudert et al. | On‐line NMR in process engineering | |
| Burakham et al. | Flow-injection and sequential-injection determinations of paracetamol in pharmaceutical preparations using nitrosation reaction | |
| Wang et al. | Batch injection analysis using fiber-optic fluorometric detection | |
| CZ2000876A3 (cs) | Způsob kontinuální titrace a zařízení k provádění způsobu | |
| Al-Shwaiyat et al. | Simultaneous determination of two active components of pharmaceutical preparations by sequential injection method using heteropoly complexes | |
| Atsuya et al. | Low-pressure microwave-induced plasma emission spectrometry method for the determination of nanogram quantities of arsenic in monoarsanilazoTyr-248 carboxypeptidase | |
| Nickolaisen et al. | Pressure-dependent yields and product branching ratios in the broadband photolysis of chlorine nitrate | |
| Dighe et al. | Analytical Method Development and Validation of Linezolidine-A Review | |
| Nieuwland et al. | Flow markers in microreactors: a generally applicable chromatographic method for monitoring flow rates during reactions | |
| Weber et al. | High precision titrimetry, ion chromatography and ICP-optical emission spectrometry for the estimation of inhomogeneities in aqueous calibration solutions for metrological purposes | |
| Alibrandi | Alternative accelerated methods for studying drug stability: variable-parameter kinetics | |
| Bartels et al. | Automation of wet chemical analysis with AMICA |
Legal Events
| Date | Code | Title | Description |
|---|---|---|---|
| PUAI | Public reference made under article 153(3) epc to a published international application that has entered the european phase |
Free format text: ORIGINAL CODE: 0009012 |
|
| 17P | Request for examination filed |
Effective date: 20000307 |
|
| AK | Designated contracting states |
Kind code of ref document: A1 Designated state(s): AT BE CH CY DE DK ES FI FR GB GR IE IT LI LU MC NL PT SE |
|
| AX | Request for extension of the european patent |
Free format text: AL PAYMENT 20000307;LT PAYMENT 20000307;LV PAYMENT 20000307;MK PAYMENT 20000307;RO PAYMENT 20000307;SI PAYMENT 20000307 |
|
| 17Q | First examination report despatched |
Effective date: 20071005 |
|
| GRAP | Despatch of communication of intention to grant a patent |
Free format text: ORIGINAL CODE: EPIDOSNIGR1 |
|
| GRAS | Grant fee paid |
Free format text: ORIGINAL CODE: EPIDOSNIGR3 |
|
| GRAA | (expected) grant |
Free format text: ORIGINAL CODE: 0009210 |
|
| AK | Designated contracting states |
Kind code of ref document: B1 Designated state(s): AT BE CH CY DE DK ES FI FR GB GR IE IT LI LU MC NL PT SE |
|
| AX | Request for extension of the european patent |
Extension state: AL LT LV MK RO SI |
|
| REG | Reference to a national code |
Ref country code: GB Ref legal event code: FG4D |
|
| REG | Reference to a national code |
Ref country code: CH Ref legal event code: EP |
|
| REG | Reference to a national code |
Ref country code: IE Ref legal event code: FG4D |
|
| REF | Corresponds to: |
Ref document number: 69840450 Country of ref document: DE Date of ref document: 20090226 Kind code of ref document: P |
|
| REG | Reference to a national code |
Ref country code: ES Ref legal event code: FG2A Ref document number: 2319469 Country of ref document: ES Kind code of ref document: T3 |
|
| PG25 | Lapsed in a contracting state [announced via postgrant information from national office to epo] |
Ref country code: NL Free format text: LAPSE BECAUSE OF FAILURE TO SUBMIT A TRANSLATION OF THE DESCRIPTION OR TO PAY THE FEE WITHIN THE PRESCRIBED TIME-LIMIT Effective date: 20090107 |
|
| NLV1 | Nl: lapsed or annulled due to failure to fulfill the requirements of art. 29p and 29m of the patents act | ||
| REG | Reference to a national code |
Ref country code: HK Ref legal event code: GR Ref document number: 1026479 Country of ref document: HK |
|
| LTIE | Lt: invalidation of european patent or patent extension |
Effective date: 20090107 |
|
| PG25 | Lapsed in a contracting state [announced via postgrant information from national office to epo] |
Ref country code: FI Free format text: LAPSE BECAUSE OF FAILURE TO SUBMIT A TRANSLATION OF THE DESCRIPTION OR TO PAY THE FEE WITHIN THE PRESCRIBED TIME-LIMIT Effective date: 20090107 |
|
| PG25 | Lapsed in a contracting state [announced via postgrant information from national office to epo] |
Ref country code: SE Free format text: LAPSE BECAUSE OF FAILURE TO SUBMIT A TRANSLATION OF THE DESCRIPTION OR TO PAY THE FEE WITHIN THE PRESCRIBED TIME-LIMIT Effective date: 20090407 Ref country code: PT Free format text: LAPSE BECAUSE OF FAILURE TO SUBMIT A TRANSLATION OF THE DESCRIPTION OR TO PAY THE FEE WITHIN THE PRESCRIBED TIME-LIMIT Effective date: 20090608 Ref country code: AT Free format text: LAPSE BECAUSE OF FAILURE TO SUBMIT A TRANSLATION OF THE DESCRIPTION OR TO PAY THE FEE WITHIN THE PRESCRIBED TIME-LIMIT Effective date: 20090107 |
|
| PG25 | Lapsed in a contracting state [announced via postgrant information from national office to epo] |
Ref country code: DK Free format text: LAPSE BECAUSE OF FAILURE TO SUBMIT A TRANSLATION OF THE DESCRIPTION OR TO PAY THE FEE WITHIN THE PRESCRIBED TIME-LIMIT Effective date: 20090107 |
|
| PLBE | No opposition filed within time limit |
Free format text: ORIGINAL CODE: 0009261 |
|
| STAA | Information on the status of an ep patent application or granted ep patent |
Free format text: STATUS: NO OPPOSITION FILED WITHIN TIME LIMIT |
|
| 26N | No opposition filed |
Effective date: 20091008 |
|
| PG25 | Lapsed in a contracting state [announced via postgrant information from national office to epo] |
Ref country code: MC Free format text: LAPSE BECAUSE OF NON-PAYMENT OF DUE FEES Effective date: 20090930 |
|
| REG | Reference to a national code |
Ref country code: CH Ref legal event code: PL |
|
| PG25 | Lapsed in a contracting state [announced via postgrant information from national office to epo] |
Ref country code: IE Free format text: LAPSE BECAUSE OF NON-PAYMENT OF DUE FEES Effective date: 20090909 |
|
| PG25 | Lapsed in a contracting state [announced via postgrant information from national office to epo] |
Ref country code: LI Free format text: LAPSE BECAUSE OF NON-PAYMENT OF DUE FEES Effective date: 20090930 Ref country code: GR Free format text: LAPSE BECAUSE OF FAILURE TO SUBMIT A TRANSLATION OF THE DESCRIPTION OR TO PAY THE FEE WITHIN THE PRESCRIBED TIME-LIMIT Effective date: 20090408 Ref country code: CH Free format text: LAPSE BECAUSE OF NON-PAYMENT OF DUE FEES Effective date: 20090930 |
|
| PG25 | Lapsed in a contracting state [announced via postgrant information from national office to epo] |
Ref country code: LU Free format text: LAPSE BECAUSE OF NON-PAYMENT OF DUE FEES Effective date: 20090909 |
|
| PG25 | Lapsed in a contracting state [announced via postgrant information from national office to epo] |
Ref country code: CY Free format text: LAPSE BECAUSE OF FAILURE TO SUBMIT A TRANSLATION OF THE DESCRIPTION OR TO PAY THE FEE WITHIN THE PRESCRIBED TIME-LIMIT Effective date: 20090107 |
|
| PGFP | Annual fee paid to national office [announced via postgrant information from national office to epo] |
Ref country code: GB Payment date: 20120829 Year of fee payment: 15 |
|
| PGFP | Annual fee paid to national office [announced via postgrant information from national office to epo] |
Ref country code: IT Payment date: 20120924 Year of fee payment: 15 Ref country code: FR Payment date: 20120910 Year of fee payment: 15 Ref country code: ES Payment date: 20120918 Year of fee payment: 15 |
|
| PGFP | Annual fee paid to national office [announced via postgrant information from national office to epo] |
Ref country code: BE Payment date: 20121001 Year of fee payment: 15 Ref country code: DE Payment date: 20120928 Year of fee payment: 15 |
|
| BERE | Be: lapsed |
Owner name: GLAXO GROUP LTD Effective date: 20130930 |
|
| GBPC | Gb: european patent ceased through non-payment of renewal fee |
Effective date: 20130909 |
|
| REG | Reference to a national code |
Ref country code: FR Ref legal event code: ST Effective date: 20140530 |
|
| REG | Reference to a national code |
Ref country code: DE Ref legal event code: R119 Ref document number: 69840450 Country of ref document: DE Effective date: 20140401 |
|
| PG25 | Lapsed in a contracting state [announced via postgrant information from national office to epo] |
Ref country code: GB Free format text: LAPSE BECAUSE OF NON-PAYMENT OF DUE FEES Effective date: 20130909 Ref country code: BE Free format text: LAPSE BECAUSE OF NON-PAYMENT OF DUE FEES Effective date: 20130930 |
|
| PG25 | Lapsed in a contracting state [announced via postgrant information from national office to epo] |
Ref country code: DE Free format text: LAPSE BECAUSE OF NON-PAYMENT OF DUE FEES Effective date: 20140401 Ref country code: FR Free format text: LAPSE BECAUSE OF NON-PAYMENT OF DUE FEES Effective date: 20130930 Ref country code: IT Free format text: LAPSE BECAUSE OF NON-PAYMENT OF DUE FEES Effective date: 20130909 |
|
| REG | Reference to a national code |
Ref country code: ES Ref legal event code: FD2A Effective date: 20141007 |
|
| PG25 | Lapsed in a contracting state [announced via postgrant information from national office to epo] |
Ref country code: ES Free format text: LAPSE BECAUSE OF NON-PAYMENT OF DUE FEES Effective date: 20130910 |