EP0903890A2 - Überwachung des Netzwerkverkehrs - Google Patents
Überwachung des Netzwerkverkehrs Download PDFInfo
- Publication number
- EP0903890A2 EP0903890A2 EP98306093A EP98306093A EP0903890A2 EP 0903890 A2 EP0903890 A2 EP 0903890A2 EP 98306093 A EP98306093 A EP 98306093A EP 98306093 A EP98306093 A EP 98306093A EP 0903890 A2 EP0903890 A2 EP 0903890A2
- Authority
- EP
- European Patent Office
- Prior art keywords
- utilization
- network
- percent
- network segment
- organized
- Prior art date
- Legal status (The legal status is an assumption and is not a legal conclusion. Google has not performed a legal analysis and makes no representation as to the accuracy of the status listed.)
- Withdrawn
Links
- 238000012544 monitoring process Methods 0.000 title claims abstract description 6
- 238000000034 method Methods 0.000 claims abstract description 14
- 238000010586 diagram Methods 0.000 description 2
- 238000012546 transfer Methods 0.000 description 2
- 238000004891 communication Methods 0.000 description 1
- 230000003340 mental effect Effects 0.000 description 1
- 238000012545 processing Methods 0.000 description 1
Images
Classifications
-
- H—ELECTRICITY
- H04—ELECTRIC COMMUNICATION TECHNIQUE
- H04L—TRANSMISSION OF DIGITAL INFORMATION, e.g. TELEGRAPHIC COMMUNICATION
- H04L43/00—Arrangements for monitoring or testing data switching networks
- H04L43/08—Monitoring or testing based on specific metrics, e.g. QoS, energy consumption or environmental parameters
- H04L43/0876—Network utilisation, e.g. volume of load or congestion level
- H04L43/0882—Utilisation of link capacity
-
- H—ELECTRICITY
- H04—ELECTRIC COMMUNICATION TECHNIQUE
- H04L—TRANSMISSION OF DIGITAL INFORMATION, e.g. TELEGRAPHIC COMMUNICATION
- H04L43/00—Arrangements for monitoring or testing data switching networks
- H04L43/04—Processing captured monitoring data, e.g. for logfile generation
- H04L43/045—Processing captured monitoring data, e.g. for logfile generation for graphical visualisation of monitoring data
-
- H—ELECTRICITY
- H04—ELECTRIC COMMUNICATION TECHNIQUE
- H04L—TRANSMISSION OF DIGITAL INFORMATION, e.g. TELEGRAPHIC COMMUNICATION
- H04L43/00—Arrangements for monitoring or testing data switching networks
- H04L43/06—Generation of reports
- H04L43/065—Generation of reports related to network devices
-
- H—ELECTRICITY
- H04—ELECTRIC COMMUNICATION TECHNIQUE
- H04L—TRANSMISSION OF DIGITAL INFORMATION, e.g. TELEGRAPHIC COMMUNICATION
- H04L43/00—Arrangements for monitoring or testing data switching networks
- H04L43/16—Threshold monitoring
Definitions
- the present invention concerns analysis of network traffic over network segments and pertains particularly to the display of network traffic attributes based on frequency distribution.
- LAN local area network
- WAN wide area networks
- LANs and/or WANs are connected together in order for one computer on a LAN or a WAN to communicate with another computer in a different LAN or WAN.
- LANs and WANs may be joined, for example, using a network bridge or a network router.
- Each of the individual LAN and WAN may be considered a network segment of a larger network.
- network traffic may be monitored and the results forwarded to an application or management platform for further processing and/or for being made available to a user.
- Network traffic may be monitored, for example, by collecting a number of bytes passed through a representative network device for one or more monitored network segments.
- the utilization of each segment is the percentage of the capacity used. For example, for a particular time period, the utilization is equal to the number of bytes transferred across a network segment during the time period divided by the theoretical maximum number of bytes that could have been transferred across the network segment during the time period.
- the utilization is generally organized in order of time.
- the utilization data is displayed by percent utilization versus time in a line graph for either single or multiple segments at a time. This is essentially a chronological view of sequential data points. Alternatively, the utilization data may be displayed by percent utilization at a particular point of time. Additionally, the utilization data may be displayed by showing bytes per second or frames per second. See for example, the Foundation ManagerTM network monitoring application and the Network General® Reporter application described in the brochure, Network General Corporation Products and Services, May 1995, available from Network General Corporation as Part Number 24200-005, pages 7 and 8.
- a method is presented which is used for monitoring network traffic. For a plurality of time periods, percent utilization of one or more network segments is determined. This is done in order to generate utilization data.
- the utilization data is organized to produce organized utilization data.
- the first organized utilization data indicates a percent frequency of the plurality of time periods during which the first network segment is at least equal to each value of percent utilization.
- the first organized utilization data is displayed in a graph. The graph has a first axis which indicates percent utilization and a second axis which indicates percent frequency.
- the utilization data is generated by collecting, for each time period, a number of bytes which pass through a representative network device for each network segment.
- the percent utilization of each network segment during each time period is calculated, based on the number of bytes collected. For example, each time period is approximately one second.
- a threshold percent utilization is displayed in the graph.
- the present invention provides a means by which a user can easily determine how often the percent utilization of a network segment meets or exceeds a particular threshold.
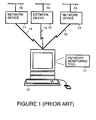
- Figure 1 is a simplified block diagram which shows network devices monitored by a computing system.
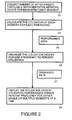
- Figure 2 is a simplified flowchart which describes the process by which network utilization is displayed based on percent frequency in accordance with the preferred embodiment of the present invention.
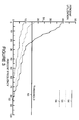
- Figure 3 shows network utilization being displayed based on percent frequency in accordance with the preferred embodiment of the present invention.
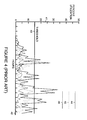
- Figure 4 shows network utilization being displayed as a chronological view of sequential data points in accordance with the prior art.
- FIG. 1 is a simplified diagram which shows a computing system 10 on which is run a network management tool 17.
- Computing system 10 monitors network traffic through a network segment 18, a network segment 19 and a network segment 20. For example, this is done by collecting, for a number of time periods, a number of bytes which pass through a network device connected to each network segment.
- a network device 11 is connected to network segment 18.
- a network device 12 is connected to network segment 19.
- a network device 13 is connected to network segment 20.
- Such monitoring of network traffic through each of network devices 11, 12 and 13 provides fairly accurate information of network utilization of the network segments 18, 19 and 20, respectively.
- Each of network devices 11 through 13 is, for example, a network bridge, a network switch or some other network device which is connected to a network segment.
- Network device 11 is connected to computer system 10 through a network data path 14.
- Network device 12 is connected to computer system 10 through a network data path 15.
- Network device 13 is connected to computer system 10 through a network data path 16.
- FIG. 2 is a simplified flowchart which describes the process by which network utilization is displayed based on percent frequency in accordance with the preferred embodiment of the present invention.
- network traffic over network segment 18, network segment 19 and network segment 20 is monitored, for example, by collecting a number of bytes passed through each of network device 11, network device 12 and network device 13. For example, collection occurs approximately once every second from each of network device 11, network device 12 and network device 13.
- the number of bytes which passes through network device 11 indicates utilization of network segment 18.
- the number of bytes which passes through network device 12 indicates utilization of network segment 19.
- the number of bytes which passes through network device 13 indicates utilization of network segment 20.
- multi-port network devices such as a switch
- this can be done by counting the number of bytes which pass through the backbone of the switch.
- multi-port network device such as a switch
- when calculating the number of bytes which pass through the network device only the bytes which pass through the port connected to the pertinent network segment are counted.
- device counter collection can be performed by the HP J3245A Advance Stack Switch 800T available from Hewlett-Packard Company.
- network management tool 17 calculates for each of network segment 18, network segment 19 and network segment 20, percent utilization for each time period. Percent utilization is the amount of data transferred over the network segment during the time period divided by the maximum amount of data which could be transferred over the network segment during the time period. One hundred percent utilization is the maximum theoretical transfer capacity of the network segment per time period.
- network device 11 detects at a first time period that a first number of bytes pass through network device 11, and for maximum utilization a second number of bytes passes through network device 11 per time period, then network utilization for the first time period is the first number divided by the second number. For example, for a network segment with a capacity of 10 megabits per second, transfer of 4 megabits per second would result in a 40% utilization.
- Step 22 generates utilization data 26.
- utilization data 26 is organized by percent frequency to percent utilization. That is, network management tool 17 determines what percentage of time periods the network segment is at each percent utilization. For example, if a thousand time periods are monitored and in twenty of the time periods the network utilization is at a percent utilization of 25%, these twenty time periods are grouped together to indicate that for a two percent frequency of the collected times the percent utilization is 25%. Step 23 generates organized utilization data 27.
- a step 24 organized utilization data 27 is displayed in a graph which shows percent frequency versus percent utilization. That is, network management tool 17 displays what percentage of time the network segment is at least equal to each value of percent utilization.
- Figure 3 gives an example of organized utilization data 27 being displayed in a graph which indicates a percent frequency of the plurality of time periods during which the first network segment is at least equal to each value of percent utilization.
- a vertical axis 51 shows percent utilization.
- a horizontal axis 52 shows percent frequency for which a percent utilization is displayed.
- a separate trace is shown for each of network device 11, network device 12 and network device 13 and thus their associated monitored network segments.
- a trace 54 represents percent utilization of network segment 18.
- a trace 55 represents percent utilization of network segment 19.
- a trace 56 represents percent utilization of network segment 20.
- Threshold 53 is at a percent utilization which indicates a user-configured limit for desired network usage.
- the throughput of the network segment begins to be significantly impacted by collisions.
- the organized utilization data for each network segment is displayed in a graph which indicates a percent frequency of the plurality of time periods during which the first network segment is at least equal to each value of percent utilization, it is easy for a network manager to determine how often network segment utilization exceeds the threshold.
- Figure 3 shows that the percent utilization for network segment 18 exceeds the threshold utilization approximately 22% of the time. Likewise, Figure 3 shows that the percent utilization for network segment 19 exceeds the threshold utilization approximately 3 % of the time. The percent utilization for network segment 20 never exceeds the threshold.
- This display is clearly an improvement over the prior art display where the utilization is generally organized in a sequential chronology. That is, the utilization data is displayed by percent utilization verses time in a line graph for either single or multiple segments at a time.
- Figure 4 shows an example of such a prior art display.
- a vertical axis 41 shows percent utilization.
- a horizontal axis 42 shows chronological time.
- a separate trace is shown for each of network device 11, network device 12 and network device 13 and thus their associated monitored network segments.
- a trace 44 represents data utilization of network segment 18.
- a trace 45 represents data utilization of network segment 19.
- a trace 46 represents data utilization of network segment 20.
- Threshold 43 is at a percent utilization which indicates a user-configured limit for desired network usage. For example, when network utilization for a network segment exceeds the threshold, the throughput of the network segment begins to be significantly impacted by collisions. From Figure 4 it is possible to see when utilization of a network segment exceeds the threshold. However, from the graph shown in Figure 4 it is very difficult to determine exactly how often network segment utilization exceeds the threshold.
Landscapes
- Engineering & Computer Science (AREA)
- Data Mining & Analysis (AREA)
- Computer Networks & Wireless Communication (AREA)
- Signal Processing (AREA)
- Environmental & Geological Engineering (AREA)
- Data Exchanges In Wide-Area Networks (AREA)
- Small-Scale Networks (AREA)
- Maintenance And Management Of Digital Transmission (AREA)
Applications Claiming Priority (2)
| Application Number | Priority Date | Filing Date | Title |
|---|---|---|---|
| US08/928,062 US6108310A (en) | 1997-09-12 | 1997-09-12 | Display of network traffic attributes based on frequency distribution |
| US928062 | 1997-09-12 |
Publications (2)
| Publication Number | Publication Date |
|---|---|
| EP0903890A2 true EP0903890A2 (de) | 1999-03-24 |
| EP0903890A3 EP0903890A3 (de) | 1999-09-15 |
Family
ID=25455663
Family Applications (1)
| Application Number | Title | Priority Date | Filing Date |
|---|---|---|---|
| EP98306093A Withdrawn EP0903890A3 (de) | 1997-09-12 | 1998-07-30 | Überwachung des Netzwerkverkehrs |
Country Status (3)
| Country | Link |
|---|---|
| US (1) | US6108310A (de) |
| EP (1) | EP0903890A3 (de) |
| JP (1) | JPH11163862A (de) |
Cited By (2)
| Publication number | Priority date | Publication date | Assignee | Title |
|---|---|---|---|---|
| EP1192770A1 (de) * | 1999-06-02 | 2002-04-03 | Accenture LLP | Verfahren, vorrichtung und hergestellter gegenstand zur verwaltung von netzwerk daten in ein hybrides netzwerk |
| WO2017050650A1 (de) * | 2015-09-21 | 2017-03-30 | Deutsche Telekom Ag | Netzwerkentität zum überwachen einer mehrzahl von prozessen eines kommunikationssystems |
Families Citing this family (29)
| Publication number | Priority date | Publication date | Assignee | Title |
|---|---|---|---|---|
| US6499107B1 (en) * | 1998-12-29 | 2002-12-24 | Cisco Technology, Inc. | Method and system for adaptive network security using intelligent packet analysis |
| US6954775B1 (en) | 1999-01-15 | 2005-10-11 | Cisco Technology, Inc. | Parallel intrusion detection sensors with load balancing for high speed networks |
| US6493752B1 (en) * | 1999-05-06 | 2002-12-10 | Watchguard Technologies | Device and method for graphically displaying data movement in a secured network |
| US7886054B1 (en) | 2000-10-11 | 2011-02-08 | Siddhartha Nag | Graphical user interface (GUI) for administering a network implementing media aggregation |
| US7788354B2 (en) * | 2000-07-28 | 2010-08-31 | Siddhartha Nag | End-to-end service quality in a voice over Internet Protocol (VoIP) Network |
| US7774468B1 (en) | 2000-07-28 | 2010-08-10 | Siddhartha Nag | Network traffic admission control |
| US7013338B1 (en) * | 2000-07-28 | 2006-03-14 | Prominence Networks, Inc. | Multiplexing several individual application sessions over a pre-allocated reservation protocol session |
| US7266683B1 (en) | 2001-07-27 | 2007-09-04 | Siddhartha Nag | Selective encryption of application session packets |
| US7047303B2 (en) * | 2001-07-26 | 2006-05-16 | International Business Machines Corporation | Apparatus and method for using a network processor to guard against a “denial-of-service” attack on a server or server cluster |
| JP3876692B2 (ja) | 2001-11-13 | 2007-02-07 | 株式会社日立製作所 | ネットワークシステム障害分析支援方法およびその方式 |
| US6691167B2 (en) * | 2002-01-28 | 2004-02-10 | Acterna Llc | Method and apparatus for network problem segment isolation |
| US6975963B2 (en) * | 2002-09-30 | 2005-12-13 | Mcdata Corporation | Method and system for storing and reporting network performance metrics using histograms |
| US8239942B2 (en) * | 2002-12-30 | 2012-08-07 | Cisco Technology, Inc. | Parallel intrusion detection sensors with load balancing for high speed networks |
| US8320242B2 (en) * | 2004-12-24 | 2012-11-27 | Net Optics, Inc. | Active response communications network tap |
| US7760859B2 (en) * | 2005-03-07 | 2010-07-20 | Net Optics, Inc. | Intelligent communications network tap port aggregator |
| US8428074B2 (en) | 2005-04-29 | 2013-04-23 | Prom Ks Mgmt Limited Liability Company | Back-to back H.323 proxy gatekeeper |
| JP4523480B2 (ja) * | 2005-05-12 | 2010-08-11 | 株式会社日立製作所 | ログ分析システム、分析方法及びログ分析装置 |
| US7663626B2 (en) * | 2006-02-28 | 2010-02-16 | At&T Corp. | Method and apparatus for providing a network traffic composite graph |
| US7898984B2 (en) | 2007-08-07 | 2011-03-01 | Net Optics, Inc. | Enhanced communication network tap port aggregator arrangement and methods thereof |
| US8094576B2 (en) * | 2007-08-07 | 2012-01-10 | Net Optic, Inc. | Integrated switch tap arrangement with visual display arrangement and methods thereof |
| US7903576B2 (en) * | 2007-08-07 | 2011-03-08 | Net Optics, Inc. | Methods and arrangement for utilization rate display |
| US7773529B2 (en) | 2007-12-27 | 2010-08-10 | Net Optic, Inc. | Director device and methods thereof |
| US9813448B2 (en) | 2010-02-26 | 2017-11-07 | Ixia | Secured network arrangement and methods thereof |
| US8320399B2 (en) * | 2010-02-26 | 2012-11-27 | Net Optics, Inc. | Add-on module and methods thereof |
| US9019863B2 (en) | 2010-02-26 | 2015-04-28 | Net Optics, Inc. | Ibypass high density device and methods thereof |
| US9749261B2 (en) | 2010-02-28 | 2017-08-29 | Ixia | Arrangements and methods for minimizing delay in high-speed taps |
| US8755293B2 (en) * | 2010-02-28 | 2014-06-17 | Net Optics, Inc. | Time machine device and methods thereof |
| US8902735B2 (en) | 2010-02-28 | 2014-12-02 | Net Optics, Inc. | Gigabits zero-delay tap and methods thereof |
| US9998213B2 (en) | 2016-07-29 | 2018-06-12 | Keysight Technologies Singapore (Holdings) Pte. Ltd. | Network tap with battery-assisted and programmable failover |
Family Cites Families (4)
| Publication number | Priority date | Publication date | Assignee | Title |
|---|---|---|---|---|
| US5819028A (en) * | 1992-06-10 | 1998-10-06 | Bay Networks, Inc. | Method and apparatus for determining the health of a network |
| WO1996024210A2 (en) * | 1995-02-02 | 1996-08-08 | Cabletron Systems, Inc. | Method and apparatus for learning network behavior trends and predicting future behavior of communications networks |
| US5926462A (en) * | 1995-11-16 | 1999-07-20 | Loran Network Systems, Llc | Method of determining topology of a network of objects which compares the similarity of the traffic sequences/volumes of a pair of devices |
| US5793753A (en) * | 1996-09-17 | 1998-08-11 | Coherent Communications Systems Corp. | Telecommunications network management observation and response system |
-
1997
- 1997-09-12 US US08/928,062 patent/US6108310A/en not_active Expired - Lifetime
-
1998
- 1998-07-30 EP EP98306093A patent/EP0903890A3/de not_active Withdrawn
- 1998-09-09 JP JP10255805A patent/JPH11163862A/ja active Pending
Non-Patent Citations (4)
| Title |
|---|
| AMER P D ET AL: "MANAGEMENT OF SAMPLED REAL-TIME NETWORK MEASUREMENTS" PROCEEDINGS OF THE CONFERENCE ON LOCAL COMPUTER NETWORKS, 1 January 1989 (1989-01-01), pages 62-68, XP000618680 * |
| CALZAROSSA M ET AL: "WORKLOAD CHARACTERIZATION: A SURVEY" PROCEEDINGS OF THE IEEE, vol. 81, no. 8, 1 August 1993 (1993-08-01), pages 1136-1150, XP000399854 ISSN: 0018-9219 * |
| VOLOCHINE T ET AL: "NETWORK MANAGEMENT AND TRAFFIC ANALYSIS FOR CICNET" IEEE NETWORK: THE MAGAZINE OF COMPUTER COMMUNICATIONS, vol. 5, no. 5, 1 September 1991 (1991-09-01), pages 41-50, XP000248472 ISSN: 0890-8044 * |
| WILLINGER W ET AL: "SELF-SIMILARITY THROUGH HIGH-VARIABILITY: STATISTICAL ANALYSIS OF ETHERNET LAN TRAFFIC AT THE SOURCE LEVEL" IEEE / ACM TRANSACTIONS ON NETWORKING, vol. 5, no. 1, 1 February 1997 (1997-02-01), pages 71-86, XP000678917 ISSN: 1063-6692 * |
Cited By (3)
| Publication number | Priority date | Publication date | Assignee | Title |
|---|---|---|---|---|
| EP1192770A1 (de) * | 1999-06-02 | 2002-04-03 | Accenture LLP | Verfahren, vorrichtung und hergestellter gegenstand zur verwaltung von netzwerk daten in ein hybrides netzwerk |
| WO2017050650A1 (de) * | 2015-09-21 | 2017-03-30 | Deutsche Telekom Ag | Netzwerkentität zum überwachen einer mehrzahl von prozessen eines kommunikationssystems |
| US10848400B2 (en) | 2015-09-21 | 2020-11-24 | Deutsche Telekom Ag | Network entity for monitoring a plurality of processes of a communication system |
Also Published As
| Publication number | Publication date |
|---|---|
| JPH11163862A (ja) | 1999-06-18 |
| US6108310A (en) | 2000-08-22 |
| EP0903890A3 (de) | 1999-09-15 |
Similar Documents
| Publication | Publication Date | Title |
|---|---|---|
| US6108310A (en) | Display of network traffic attributes based on frequency distribution | |
| EP0613270B1 (de) | Netzanalysenverfahren | |
| US5615323A (en) | Displaying resource performance and utilization information | |
| EP0976212B1 (de) | Verfahren und vorrichtung zur messung des spitzen durchsatzes in datenpacket-netzwerken | |
| US5706436A (en) | Apparatus and method for evaluation network traffic performance | |
| US7984126B2 (en) | Executable application network impact and load characteristic estimation system | |
| US7373403B2 (en) | Method and apparatus for displaying measurement data from heterogeneous measurement sources | |
| US8391157B2 (en) | Distributed flow analysis | |
| DE69725261T2 (de) | System zur Übermittlung des Netzwerkverkehrs in einem Kommunikationsnetzwerk | |
| AU715918B2 (en) | Method and apparatus for determining frame relay connections | |
| WO1998021845A9 (en) | Method and apparatus for measurement of peak throughput in packetized data networks | |
| EP1206085A2 (de) | Verfahren und Vorrichtung für automatische Dienststufenübereinkommen | |
| US6810367B2 (en) | Method and apparatus for responding to threshold events from heterogeneous measurement sources | |
| JPH11212937A (ja) | 分散型ワークステーションを用いたレポートの生成 | |
| CN105608517B (zh) | 基于流的业务交易性能管理及可视化方法和装置 | |
| US7502844B2 (en) | Abnormality indicator of a desired group of resource elements | |
| CN106789283A (zh) | 一种互联网业务质量感知分析系统 | |
| JP2001352328A (ja) | Wanトラフィック測定の方式、装置、方法、及び記録媒体 | |
| CN108809752A (zh) | 一种网络流量的自适应监控方法、装置、npb设备及介质 | |
| US6826507B2 (en) | Method and apparatus for drilling to measurement data from commonly displayed heterogeneous measurement sources | |
| Papadopoulos et al. | Efficient identification of uncongested Internet links for topology downscaling | |
| GB2365252A (en) | Network management system user interface which presents graphs of conversation information in response to user selection | |
| DE102005061966A1 (de) | Verfahren und Vorrichtung zum Zeigen einer Dienstqualität durch eine Basisstation in mobilen Netzwerken | |
| JP2008079138A (ja) | 通信監視システム、フロー収集装置、解析マネージャ装置及びプログラム | |
| WO2002071255A2 (en) | Method for correlating behavior between two elements of a system to determine the presence of mutual interaction between the elements |
Legal Events
| Date | Code | Title | Description |
|---|---|---|---|
| PUAI | Public reference made under article 153(3) epc to a published international application that has entered the european phase |
Free format text: ORIGINAL CODE: 0009012 |
|
| AK | Designated contracting states |
Kind code of ref document: A2 Designated state(s): AT BE CH CY DE DK ES FI FR GB GR IE IT LI LU MC NL PT SE |
|
| AX | Request for extension of the european patent |
Free format text: AL;LT;LV;MK;RO;SI |
|
| PUAL | Search report despatched |
Free format text: ORIGINAL CODE: 0009013 |
|
| AK | Designated contracting states |
Kind code of ref document: A3 Designated state(s): AT BE CH CY DE DK ES FI FR GB GR IE IT LI LU MC NL PT SE |
|
| AX | Request for extension of the european patent |
Free format text: AL;LT;LV;MK;RO;SI |
|
| RIC1 | Information provided on ipc code assigned before grant |
Free format text: 6H 04L 12/26 A, 6H 04L 12/24 B |
|
| AKX | Designation fees paid | ||
| REG | Reference to a national code |
Ref country code: DE Ref legal event code: 8566 |
|
| STAA | Information on the status of an ep patent application or granted ep patent |
Free format text: STATUS: THE APPLICATION IS DEEMED TO BE WITHDRAWN |
|
| 18D | Application deemed to be withdrawn |
Effective date: 20000316 |