EP0902405B1 - Method for determining traffic information - Google Patents
Method for determining traffic information Download PDFInfo
- Publication number
- EP0902405B1 EP0902405B1 EP98117164A EP98117164A EP0902405B1 EP 0902405 B1 EP0902405 B1 EP 0902405B1 EP 98117164 A EP98117164 A EP 98117164A EP 98117164 A EP98117164 A EP 98117164A EP 0902405 B1 EP0902405 B1 EP 0902405B1
- Authority
- EP
- European Patent Office
- Prior art keywords
- traffic
- data
- calculation
- speed
- section
- Prior art date
- Legal status (The legal status is an assumption and is not a legal conclusion. Google has not performed a legal analysis and makes no representation as to the accuracy of the status listed.)
- Revoked
Links
Images


Classifications
-
- G—PHYSICS
- G08—SIGNALLING
- G08G—TRAFFIC CONTROL SYSTEMS
- G08G1/00—Traffic control systems for road vehicles
- G08G1/01—Detecting movement of traffic to be counted or controlled
Definitions
- the invention relates to a method for determining Road routes, especially traffic information related to motorways, local detection cross sections using stationary detectors formed, traffic-related measured values recorded, preprocessed by means of local computers and to a given one Data protocol standardized, aggregated and sent to a higher level by radio Data processing system are transmitted.
- a traffic control and Information system which uses stationary Guide beacons and transmitting or receiving units arranged in vehicles Traffic flow information determined. From these Traffic flow information becomes, in particular, interference information determined to switch control signals.
- DE-P 44 08 547 describes a method for traffic detection and traffic situation detection on highways, preferably Motorways, known.
- lane-related measuring points are set up, which are equipped with traffic sensors, for example induction loops, for vehicle detection and with a traffic data processing device are provided.
- Traffic data such as vehicle speed, Traffic strength and traffic density determined and from it certain traffic parameters in a traffic data preparation educated.
- Two adjacent ones form Measuring points a measuring section with a certain distance. Traffic parameters become from the traffic data of two such measuring points educated.
- This is a speed density difference, calculated from local traffic data of medium speed and traffic density, a trend factor over a period of time from the ratio of traffic levels both measuring points as well as a traffic volume trend.
- this data becomes the probability derived for a critical traffic situation. at A probability threshold can then be reached Control signal for a variable message sign can be generated.
- Detectors are also known in the prior art that determine the presence and detect the speed of a moving object can. For example, such detectors work according to a passive infrared process, which may also be used with others Procedure can be combined.
- a passive infrared process which may also be used with others Procedure can be combined.
- No method is known to date, traffic information covering the entire area to record and evaluate.
- An essential aspect of the present invention is the optimal one Evaluation and further processing of the received data in one Central unit to the from an economic point of view recorded and sent data so comprehensive and meaningful to process as possible, but also to produce results arrive, the information content as clear and reliable as possible is. In this regard, only individual solutions are known.
- the present invention is based on the object of providing an area-wide traffic data acquisition of the generic type, by means of which simple and sensible data transfer and energy expenditure are reliable and sufficiently meaningful data bases for different traffic information services, such that the detected and data sent are analyzed and processed as comprehensively and meaningfully as possible, and the results are as clear and reliable as possible.
- the invention proposes a method for determining traffic information relating to road routes, in particular motorways, wherein local detection cross sections are formed by means of fixed detectors, traffic-related measured values are recorded, preprocessed by means of local computers and standardized, aggregated and per using a predetermined data protocol wireless transmission are transmitted to a higher-level data processing system, the transmitted data being processed in at least two redundant, different and independent calculation methods for determining route-related traffic information.
- the invention enables the implementation of a step organized processing system, being short term Results can be achieved by expanding into the individual levels can be consolidated and refined. Through the There is a resolution into individual subtasks or stages high degree of flexibility and reliability through the Formation of fallback levels. Through the local pre-analysis of the Traffic gives rise to extremely energy-saving, event-oriented data transmission to the parent Data processing systems or centers.
- Fixed detectors are preferably used at connection points, Positioned nodes and the like. Beyond that the arrangement density of the fixed detectors depending determined by traffic expectation estimates. So you can through the arrangement of many local recording systems Build networks. With the invention it is also possible organize an overall network structure. On traffic critical positions are local detectors and preprocessing computers arranged by radio in preferably digital Technology the data to higher-level data processing systems forward or control centers. There can then be more Traffic models to which data are applied.
- the possibility of local evaluation results from the local evaluation State identification By linking the data to neighboring local acquisition cross sections can be a so-called route-related level of service in a higher-level data processing system or one assigned to the overall network Central can be determined.
- Measurement data are delivered, they are preprocessed, for example by calculating mean values, checking plausibility and trend factor determinations carried out become. From the changes in the data or the data itself status codes are then determined, for example in the form a numerical value for conditions such as free flow of traffic, traffic jam, Stop and go, traffic jam or standstill etc. evaluation cycles can be selected every 1 to 5 minutes, for example. However, the evaluation cycle can be set variably, for example depending on the status codes or the Traffic conditions. The same applies to the data transfer rate, which, for example, depending on the determined Status code is applied, for example, with free flow of traffic Averaging every 30 minutes every 5 minutes. Depending on the fault condition, the transmission density increase. The data transfer rates neighboring acquisition cross-sections compared.
- the measured values can be recorded in relation to lanes, but what is not absolutely necessary, other acquisition cross sections can also be used To be defined. It is also fundamental possible, vehicle type differentiation values, for example Detect trucks, cars and the like.
- source-to-target relationships by analyzing the data of all acquisition cross sections of a network determines that the data for route search, evaluated for the output of traffic management information, for Clarification subjected to statistical analysis and that the data evaluated for the submission of traffic development forecasts become.
- the invention provides methods for different Types and qualities of traffic information data to provide.
- the main task is to provide such data for to prepare the motor vehicle drivers and expedient them Provide information. It can be, for example for travel time displays, route displays, traffic forecast, Act traffic jams and the like.
- vehicles are arranged with information displays, on which the drivers of their planned routes and get the travel time information displayed. You can then, for example, under different alternatives choose the fastest route. Additionally or alternatively you can Indications of traffic jam developments, probabilities in relation on further development on the upcoming route section and the like are displayed.
- the range of applications is extensive.
- the invention provides an extremely flexible method, with which with the connection of different traffic models an almost network-wide, comprehensive traffic information system is buildable, which data for different Provides informational purposes. It can be conventional and already known models and processes used and be combined. Forecasts can be curve-based forecasts at measuring points, model-based forecasts for sections and Meshes and additions of immeasurable effects using be artificial intelligence. For the calculation of mean values usual formulas are used.
- the invention proposes that the transferred data in two different calculation methods Complexity. It is provided that one of the at least two calculation methods a simple interpolation procedure of low complexity is.
- the input data of the calculation process is lower Complexity is vehicle speed v and traffic volume q, output data are a cruising speed and Traffic density k.
- the calculation method low complexity an additional traffic jam message outputs.
- a procedure as described is required only a minimum of input data and can be very fast very reliable statements about the traffic conditions in the area of a measurement cross section. With interpolation it is assumed for simplicity that all vehicles behave the same.
- the other one of the at least two calculation methods is based on the data analysis based on a fundamental diagram Is a highly complex process.
- a fundamental diagram is a known, on a measurement cross section related curve.
- the representation is the curve of traffic volume q above the assignment k.
- the curve corresponds in simplified and highly smoothed form essentially one asymmetrical Gaussian distribution and leaves statements about critical and uncritical states too.
- the invention strikes before that input data of the calculation method of high complexity Vehicle speed v, traffic strength q and Allocation b are based on a travel time Cruising speed and traffic density are k.
- the calculation method be of high complexity additionally a traffic situation status signal, at least differentiates according to free / critical / traffic jam. This second procedure also requires only a minimum of Input data and can very quickly make very reliable statements about the traffic condition in the area of a measurement cross-section to meet.
- Impairment parameters such as construction sites, accidents and the like can be entered.
- the 3 levels differ in the complexity of the used Process for evaluating traffic data and thus in the quality and type of the calculated traffic parameters.
- Preprocessing and plausibility checks are carried out in the individual stages of the incoming data. Get all results on sections between adjacent junctions or junctions (e.g. Federal Motorway (BAB) sections) and the current, available at the headquarters Measured data interval. To travel times for selected Determining routes through the network are also the route-related travel speeds of different time intervals according to the route length and the total travel time required; these have to be from archived waterways withdrawn or forecast on the basis thereof. Route-related travel times are not yet calculated here, can, however, be determined on the basis of all 3 levels if necessary become.
- BAB Federal Motorway
- the aim is to check and, if necessary, correct the aggregation modules upcoming measurement data.
- the conversion takes place to track-related values. Extrapolation of directional variables Lane-related sizes.
- Input is lane-related data from the aggregation module in 1 min intervals.
- V i Fz q i car ⁇ V i car + q i truck ⁇ V i truck q i car + q i truck
- the standard deviation gives the fluctuation range of the speed again.
- the back calculation of the lane-related cruising speed from the cross-sectional cruising speed can also be used.
- FIG. 2 shows how the detector D uses Section A of a main carriageway H between a first ramp R1 and a second ramp R2 is characterized.
- the cruising speed in the section is calculated in a first approximation from the local direction-related average speed of the vehicles.
- V Fz, mom 0.974 V Fz, lok ,
- the standard deviation of the current speed is equal to the standard deviation of the local speed.
- FIG. 3 it is shown how a section A one Main roadway H between a first ramp R1 and one second ramp R2 by means of a first detector D1 and one second detector D2 is characterized.
- Cruising speed in the section is the arithmetic mean of the mean instantaneous speeds of the m measuring cross sections in the section.
- Traffic volume in the section is the arithmetic mean of the local directional traffic volumes of the m measurement cross-sections in the section
- K Fz Q Fz V Fz, mom ⁇ Number of lanes ⁇ 60 [vehicle / km]
- the travel time band is calculated as in case 1.
- FIG 4 it is shown how a main carriageway H in 3 sections A1, A2 and A3 divided between different ramps R. is, in the first section A1 a first detector D1 and in the third section A3 a second detector D2 is provided is.
- the standard deviation of the speed is calculated as in case 1.
- Traffic volume in the section is the arithmetic mean of the local directional traffic volumes of the surrounding measurement cross-sections
- K Fz Q Fz V Fz, mom ⁇ Number of lanes ⁇ 60 [vehicle / km]
- the travel time band is calculated as in case 1.
- FIG. 5 shows case 4, with two detectors D1 and D2 are arranged in sections A1 and A2, respectively.
- k 1 and k 2 are adjustable.
- Case 1 relates to the situation shown in FIG. 3.
- Case 2 relates to the situation shown in FIG. 4. arithmetic mean of the QB of the neighboring MQ
- Traffic jam on a measuring cross-section is detected when the forecast speed on the main carriageway: V Q, prog ⁇ V traffic jam on the condition that the difference between the forecast speeds of the cars and the trucks (as an absolute value) does not exceed a certain value. ie:
- V traffic jam 35 km / h
- V Diff 25 km / h
- Minimum number of vehicles 600 vehicles / h
- the module performs an iterative calculation of the matrix elements based on the pre-weighting and the matrix line and column totals.
- the FDG is shown in FIG.
- the key data of the individual fundamental diagrams are in the appendix listed.
- the reference interval is 1 minute.
- Traffic mapping with ESE Extended Situation Detection: With the traffic model ESE, profiles of traffic volume, Speed and traffic density for individual segments of one Section generated. In addition, statements about made the traffic situation in the section.
- a section in ESE relates to the model approach always on the distance between two measuring cross-sections.
- the Section used in the field test (visualization) is limited by nodes or junctions.
- For visualization the ESE sections or segments must match the visualization sections be assigned.
- FIG. 8 A federal highway BAB is shown in FIG. 8, which is divided into three sections A1, A2 and A3, each with a detector D1, D2 and D3.
- ESE there is an ESE section ESE A1 between the first detector D1 and the second detector D2 in 3 segments S 1 m , S 2 m S 3 m and corresponding to the ESE section ESE-A2 between the second detector D2 and the third Detector D3 divided into three segments S 1 n , S 2 n and S 3 n .
- a Visu ⁇ S m i + ⁇ S n i
- the traffic situation is determined for the ESE section. To adapt to the BAB section is for the individual situations a corresponding logic is proposed. The Situation is set to zero in the next interval and with the newly calculated ESE situations.
- a traffic-technical bottleneck is defined as a situation in which the number of available lanes is reduced by a traffic-related event, for example an accident or a vehicle that has broken down, and consequently there are discontinuities in the flow of traffic.
- ESE A n-1 S3 S4 S5 S6 ESE A n S1 S1 S1 S1 S1 S1 ESE A n + 1 BAB A m-1 S4 BAB A m S3 S1 S5 BAB A m + 1 S1
- a section is blocked when the traffic density in the entire section exceeds a defined size and the speed at the two section boundaries falls below a defined size.
- ESE A n-1 S4 S5 S6 ESE A n S5 S5 S5 S5 ESE A n + 1 BAB A m-1 BAB on S3 S5 S5 S6 BAB A m + 1 S3
- the raw data of the detectors are written to a file per detector and day.
- the parameterization data are for each change and for each detector or aggregation module with the date of the change save.
- An off-line evaluation accesses the raw data from the detectors, on the results of the three tier models and on the Parameterization data back.
Abstract
Description
Die Erfindung betrifft ein Verfahren zur Ermittlung von auf Straßenstrecken, insbesondere Autobahnen bezogenen Verkehrsinformationen, wobei mittels ortsfester Detektoren lokale Erfassungsquerschnitte gebildet, verkehrsbezogene Meßwerte erfaßt, mittels lokaler Rechner vorverarbeitet und auf ein vorgegebenes Datenprotokoll normiert, aggregiert und per Funk an eine übergeordnete Datenverarbeitungsanlage übertragen werden.The invention relates to a method for determining Road routes, especially traffic information related to motorways, local detection cross sections using stationary detectors formed, traffic-related measured values recorded, preprocessed by means of local computers and to a given one Data protocol standardized, aggregated and sent to a higher level by radio Data processing system are transmitted.
Im Stand der Technik ist es bekannt, an einzelnen Meßstellen Verkehrsflußinformationen zu erfassen, um daraus direkte Störinformationen abzuleiten oder Verkehrsentwicklungsprognosen für benachbarte Streckenabschnitte zu entwickeln. Es sind jeweils nur Einzellösungen bekannt.It is known in the prior art at individual measuring points To record traffic flow information in order to obtain direct interference information derive or traffic development forecasts to develop for neighboring sections of the route. They are each only single solutions known.
Beispielsweise ist in der EP 0 256 483 A1 ein Verkehrsleit- und Informationssystem offenbart, welches unter Verwendung ortsfester Leitbaken und in Fahrzeugen angeordneter Sende- bzw. Empfangseinheiten Verkehrsflußinformationen ermittelt. Aus diesen Verkehrsflußinformationen werden insbesondere Störinformationen ermittelt, um Leitsignale zu schalten.For example, in EP 0 256 483 A1 a traffic control and Information system which uses stationary Guide beacons and transmitting or receiving units arranged in vehicles Traffic flow information determined. From these Traffic flow information becomes, in particular, interference information determined to switch control signals.
Aus der DE-P 44 08 547 ist ein Verfahren zur Verkehrserfassung und Verkehrssituationserkennung auf Autostraßen, vorzugsweise Autobahnen, bekannt. Zur Bildung von sogenannten Meßquerschnitten werden spurbezogene Meßstellen eingerichtet, die mit Verkehrssensoren, beispielsweise Induktionsschleifen, zur Kfz.-Detektion und mit einer Verkehrsdaten-Verarbeitungs-Einrichtung versehen sind. Es werden regelmäßig Verkehrsdaten wie Kfz.-Geschwindigkeit, Verkehrsstärke und Verkehrsdichte ermittelt und daraus bestimmte Verkehrskenngrößen in einer Verkehrsdatenaufbereitung gebildet. Dabei bilden jeweils zwei benachbarte Meßstellen einen Meßabschnitt mit einer bestimmten Streckenlänge. Aus den Verkehrsdaten zweier solcher Meßstellen werden Verkehrskenngrößen gebildet. Diese sind eine Geschwindigkeitsdichte-Differenz, berechnet aus lokalen Verkehrsdaten mittlerer Geschwindigkeit und der Verkehrsdichte, ein Trendfaktor, ermittelt über einen bestimmten Zeitraum aus dem Verhältnis der Verkehrsstärken beider Meßstellen sowie ein Verkehrsstärketrend. Aus diesen Daten wird mittels einer Fuzzylogik die Wahrscheinlichkeit für eine kritische Verkehrssituation abgeleitet. Bei Erreichen eines Wahrscheinlichkeitsschwellwertes kann dann ein Steuersignal für ein Wechselverkehrszeichen erzeugt werden.DE-P 44 08 547 describes a method for traffic detection and traffic situation detection on highways, preferably Motorways, known. For the formation of so-called measuring cross sections lane-related measuring points are set up, which are equipped with traffic sensors, for example induction loops, for vehicle detection and with a traffic data processing device are provided. Traffic data such as vehicle speed, Traffic strength and traffic density determined and from it certain traffic parameters in a traffic data preparation educated. Two adjacent ones form Measuring points a measuring section with a certain distance. Traffic parameters become from the traffic data of two such measuring points educated. This is a speed density difference, calculated from local traffic data of medium speed and traffic density, a trend factor over a period of time from the ratio of traffic levels both measuring points as well as a traffic volume trend. Using fuzzy logic, this data becomes the probability derived for a critical traffic situation. at A probability threshold can then be reached Control signal for a variable message sign can be generated.
Im Stand der Technik sind auch Detektoren bekannt, die das Vorhandensein und die Geschwindigkeit eines bewegten Objektes erfassen können. Beispielsweise arbeiten derartige Detektoren nach einem Passiv-Infrarot-Verfahren, welches ggf. auch mit anderen Verfahren kombiniert werden kann. Im Stand der Technik ist bisher kein Verfahren bekannt, flächendeckend Verkehrsinformationen zu erfassen und auszuwerten. Insbesondere sind keine Verfahren bekannt, die die Verkehrsinformationsermittlung streckenabschnittsbezogen variabel, ggf. ereignisorientiert und mit geringem Datenübertragungsaufwand ermöglichen.Detectors are also known in the prior art that determine the presence and detect the speed of a moving object can. For example, such detectors work according to a passive infrared process, which may also be used with others Procedure can be combined. In the state of the art No method is known to date, traffic information covering the entire area to record and evaluate. In particular, there are none Method known to determine the traffic information route section variable, event-oriented if necessary and enable with little data transfer effort.
Ein geringer Datenübertragungsaufwand ist einerseits zur Durchführung eines energiesparenden Verfahrens erforderlich, andererseits um möglichst transparente und leicht pflegbare Datenbestände zu erzeugen.On the one hand, a low data transfer effort is required an energy-saving process, on the other hand the most transparent and easy to maintain data to create.
Wesentlicher Aspekt der vorliegenden Erfindung ist die optimale Auswertung und Weiterverarbeitung der empfangenen Daten in einer Zentraleinheit, um die unter wirtschaftlichen Gesichtspunkten erfassten und gesendeten Daten so umfassend und aussagekräftig wie möglich zu verarbeiten, aber auch zu Ergebnissen zu gelangen, deren Aussagegehalt so eindeutig und sicher wie möglich ist. Diesbezüglich sind nur Einzellösungen bekannt. An essential aspect of the present invention is the optimal one Evaluation and further processing of the received data in one Central unit to the from an economic point of view recorded and sent data so comprehensive and meaningful to process as possible, but also to produce results arrive, the information content as clear and reliable as possible is. In this regard, only individual solutions are known.
Ausgehend von diesem Stand der Technik liegt der vorliegenden Erfindung die Aufgabe zugrunde, eine flächendeckende Verkehrsdatenerfassung der gattungsgemäßen Art, durch welche mit Einfachsensorik und geringem Datenübertragungs- sowie Energieaufwand zuverlässige und hinreichend aussagekräftige Datengrundlagen für unterschiedliche Verkehrsinformationsdienste bereitgestellt werden, derart verbessert bereitzustellen, daß die erfassten und gesendeten Daten so umfassend und aussagekräftig sowie vom Ergebnis her so eindeutig und sicher wie möglich analysiert und verarbeitet werden.Based on this prior art, the present invention is based on the object of providing an area-wide traffic data acquisition of the generic type, by means of which simple and sensible data transfer and energy expenditure are reliable and sufficiently meaningful data bases for different traffic information services, such that the detected and data sent are analyzed and processed as comprehensively and meaningfully as possible, and the results are as clear and reliable as possible.
Zur technischen Lösung dieser Aufgabe wird mit der Erfindung vorgeschlagen ein Verfahren zur Ermittlung von auf Straßenstrecken, insbesondere Autobahnen, bezogenen Verkehrsinformationen, wobei mittels ortsfester Detektoren lokale Erfassungsquerschnitte gebildet, verkehrsbezogene Meßwerte erfaßt, mittels lokaler Rechner vorverarbeitet und auf ein vorgegebenes Datenprotokoll normiert, aggregiert und per drahtloser Übermittlung an eine übergeordnete Datenverarbeitungsanlage übertragen werden, wobei die übertragenen Daten in wenigstens zwei redundanten, zueinander unterschiedlichen und unabhängigen Berechnungsverfahren zur Ermittlung streckenbezogener Verkehrsinformationen bearbeitet werden.To solve this problem technically, the invention proposes a method for determining traffic information relating to road routes, in particular motorways, wherein local detection cross sections are formed by means of fixed detectors, traffic-related measured values are recorded, preprocessed by means of local computers and standardized, aggregated and per using a predetermined data protocol wireless transmission are transmitted to a higher-level data processing system, the transmitted data being processed in at least two redundant, different and independent calculation methods for determining route-related traffic information.
Die Erfindung ermöglicht die Realisierung eines stufenförmig organisierten Verarbeitungssystems, wobei bereits kurzfristig Ergebnisse erzielt werden können, die durch Ausweitung in die einzelnen Stufen konsolidiert und verfeinert werden. Durch die Auflösung in einzelne Teilaufgaben bzw. Stufen ergibt sich ein hohes Maß an Flexibilität und an Ausfallsicherheit durch die Bildung von Rückfallebenen. Durch die lokale Voranalyse des Verkehrs ergeben sich Möglichkeiten zur äußerst energiesparenden, ereignisorientierten Datenübertragung zu den übergeordneten Datenverarbeitungsanlagen bzw. -zentralen. The invention enables the implementation of a step organized processing system, being short term Results can be achieved by expanding into the individual levels can be consolidated and refined. Through the There is a resolution into individual subtasks or stages high degree of flexibility and reliability through the Formation of fallback levels. Through the local pre-analysis of the Traffic gives rise to extremely energy-saving, event-oriented data transmission to the parent Data processing systems or centers.
Vorzugsweise werden ortsfeste Detektoren an Anschlußstellen, Knotenpunkten und dergleichen positioniert. Darüber hinaus wird die Anordnungsdichte der ortsfesten Detektoren in Abhängigkeit von Verkehrserwartungsschätzungen bestimmt. Somit lassen sich durch die Anordnung vieler lokaler Erfassungssysteme flächendeckende Netze aufbauen. Mit der Erfindung ist es auch möglich, einen Gesamtnetzaufbau zu organisieren. An verkehrstechnisch kritischen Positionen werden lokale Detektoren und Vorverarbeitungsrechner angeordnet, die über Funk in vorzugsweise digitaler Technologie die Daten an übergeordnete Datenverarbeitungsanlagen bzw. -zentralen weiterleiten. Dort können dann weitere Verkehrsmodelle auf die Daten angewandt werden.Fixed detectors are preferably used at connection points, Positioned nodes and the like. Beyond that the arrangement density of the fixed detectors depending determined by traffic expectation estimates. So you can through the arrangement of many local recording systems Build networks. With the invention it is also possible organize an overall network structure. On traffic critical positions are local detectors and preprocessing computers arranged by radio in preferably digital Technology the data to higher-level data processing systems forward or control centers. There can then be more Traffic models to which data are applied.
Aus der lokalen Auswertung ergibt sich die Möglichkeit der lokalen Zustandserkennung. Durch die Verknüpfung der Daten benachbarter lokaler Erfassungsquerschnitte kann ein sogenannter streckenbezogener Level of Service in einer übergeordneten Datenverarbeitungsanlage oder einer dem Gesamtnetz zugeordneten Zentrale ermittelt werden.The possibility of local evaluation results from the local evaluation State identification. By linking the data to neighboring local acquisition cross sections can be a so-called route-related level of service in a higher-level data processing system or one assigned to the overall network Central can be determined.
Die Verknüpfung dieser Daten, ggf. in Kombination mit den Daten der lokalen Erfassungsquerschnitte ermöglicht die Errechnung einer erweiterten Situationserkennung. Hier können dynamische Zustandsschätzungen erfolgen, um eine verbesserte Zustandsschätzung in kritischen Streckenabschnitten durch Zuschaltung eines angepaßten Systems zur erweiterten Situationserkennung zu erlangen. Die Ergebnisse sind detaillierte streckenbezogene Daten und feiner untergliederte Situationsklassifizierungen. Darüber hinaus lassen sich Angaben einer etwaigen Sicherheit der jeweiligen Schätzung erzielen. Eine Korrektur hinsichtlich stark verrauschter Daten wegen schlechter Datenübertragung, bei größeren Zeitintervallen oder nur sporadischen Daten ist mit der Erfindung vorgesehen. Linking this data, possibly in combination with the data the local acquisition cross sections enables the calculation an advanced situation detection. Here dynamic State estimates are made to provide an improved state estimate in critical sections by connecting a customized system for advanced situation detection gain. The results are detailed route-related data and more detailed situation classifications. About that In addition, information about any security of the achieve the respective estimate. A correction regarding heavily noisy data due to poor data transmission, at larger time intervals or only sporadic data is with provided the invention.
Mit besonderem Vorteil wird vorgeschlagen, daß zur lokalen Vorverarbeitung der Daten deren Plausibilität anhand von Modellvergleichen überprüft wird, Mittelwertberechnungen durchgeführt, aus der Veränderung der Meßwerte Trendfaktoren ermittelt, und daß aus den ermittelten Daten taktweise Zustandscodes ermittelt werden. Als Meßwerte werden zumindest Fahrzeuggeschwindigkeit, Verkehrsstärke und querschnittsbezogene Belegung erfaßt.It is proposed with particular advantage that local Pre-processing of the data and its plausibility based on model comparisons is checked, mean value calculations are carried out, trend factors determined from the change in the measured values, and that from the determined data clockwise status codes be determined. At least vehicle speed, Traffic volume and cross-sectional occupancy detected.
Nachdem von einem Detektor, beispielsweise einem Passiv-Infrarot-Detektor, Meßdaten geliefert werden, werden diese vorverarbeitet, beispielsweise indem Mittelwertberechnungen, Plausibilitätskontrollen und Trendfaktorermittlungen durchgeführt werden. Aus den Veränderungen der Daten oder den Daten selbst werden dann Zustandscodes ermittelt, beispielsweise in der Form eines Zahlenwertes für Zustände wie freier Verkehrsfluß, Staugefahr, Stop and Go, Stau oder Stillstand u.s.w. Auswertungszyklen können beispielsweise alle 1 bis 5 Minuten gewählt werden. Der Auswertungszyklus kann jedoch variabel festgelegt werden, beispielsweise in Abhängigkeit von den Zustandscodes oder den Verkehrszuständen. Das gleiche gilt für die Datenübertragungsrate, die beispielsweise in Abhängigkeit von dem ermittelten Zustandscode angewandt wird, beispielsweise bei freiem Verkehrsfluß alle 30 Minuten eine Übertragung bei Mittelwertbildung alle 5 Minuten. Je nach Störzustand kann die Übertragungsdichte erhöht werden. Dabei werden die Datenübertragungsraten benachbarter Erfassungsquerschnitte aufeinander abgeglichen.After a detector, for example a passive infrared detector, Measurement data are delivered, they are preprocessed, for example by calculating mean values, checking plausibility and trend factor determinations carried out become. From the changes in the data or the data itself status codes are then determined, for example in the form a numerical value for conditions such as free flow of traffic, traffic jam, Stop and go, traffic jam or standstill etc. evaluation cycles can be selected every 1 to 5 minutes, for example. However, the evaluation cycle can be set variably, for example depending on the status codes or the Traffic conditions. The same applies to the data transfer rate, which, for example, depending on the determined Status code is applied, for example, with free flow of traffic Averaging every 30 minutes every 5 minutes. Depending on the fault condition, the transmission density increase. The data transfer rates neighboring acquisition cross-sections compared.
Die Meßwerte können fahrspurenbezogen erfaßt werden, was aber nicht zwingend erforderlich ist, es können auch andere Erfassungsquerschnitte definiert werden. Auch ist es grundsätzlich möglich, Fahrzeugtypunterscheidungswerte, also beispielsweise Lkw, Pkw und dergleichen zu erfassen. The measured values can be recorded in relation to lanes, but what is not absolutely necessary, other acquisition cross sections can also be used To be defined. It is also fundamental possible, vehicle type differentiation values, for example Detect trucks, cars and the like.
Darüber hinaus wird weiterhin vorgeschlagen, daß Quelle-Ziel-Beziehungen durch die Analyse der Daten aller Erfassungsquerschnitte eines Netzes ermittelt, daß die Daten zur Routensuche, zur Ausgabe von Verkehrsleitungsinformationen ausgewertet, zur Präzisierung statistischen Analysen unterzogen und daß die Daten zur Abgabe von Verkehrsentwicklungsprognosen ausgewertet werden.It also suggests that source-to-target relationships by analyzing the data of all acquisition cross sections of a network determines that the data for route search, evaluated for the output of traffic management information, for Clarification subjected to statistical analysis and that the data evaluated for the submission of traffic development forecasts become.
Mit der Erfindung werden Verfahren bereitgestellt, um unterschiedliche Arten und Qualitäten von Verkehrsinformationsdaten zur Verfügung zu stellen. Hauptaufgabe ist es, solche Daten für die Kraftfahrzeugführer aufzubereiten und diesen zweckmäßige Informationen bereitzustellen. Dabei kann es sich beispielsweise um Reisezeitanzeigen, Routenanzeigen, Verkehrsschlußprognosen, Stauanzeigen und dergleichen handeln. In den einzelnen Fahrzeugen werden beispielsweise Informationsdisplays angeordnet, auf welchen die Kraftfahrzeugführer ihre geplanten Routen und die Reisezeitinformationen angezeigt bekommen. Sie können dann beispielsweise unter verschiedenen Alternativen die jeweils schnellste Route wählen. Zusätzlich oder alternativ können Hinweise auf Stauentwicklungen, Wahrscheinlichkeiten in Bezug auf die weitere Entwicklung auf dem bevorstehenden Strekkenabschnitt und dergleichen angezeigt werden. Die Anwendungsbreite ist umfangreich.The invention provides methods for different Types and qualities of traffic information data to provide. The main task is to provide such data for to prepare the motor vehicle drivers and expedient them Provide information. It can be, for example for travel time displays, route displays, traffic forecast, Act traffic jams and the like. In each of For example, vehicles are arranged with information displays, on which the drivers of their planned routes and get the travel time information displayed. You can then, for example, under different alternatives choose the fastest route. Additionally or alternatively you can Indications of traffic jam developments, probabilities in relation on further development on the upcoming route section and the like are displayed. The range of applications is extensive.
Mit der Erfindung wird ein äußerst flexibles Verfahren angegeben, mit welchem unter Verknüpfung unterschiedlichster Verkehrsmodelle ein nahezu netzumfassendes, flächendeckendes Verkehrsinformationssystem aufbaubar ist, welches Daten für unterschiedlichste Informationszwecke liefert. Es können herkömmliche und bereits bekannte Modelle und Verfahren eingesetzt und kombiniert werden. Prognosen können ganglinienbasierte Prognosen an Meßstellen, modellgestützte Prognosen für Abschnitte und Maschen und Ergänzungen nicht meßbarer Effekte unter Verwendung künstlicher Intelligenz sein. Für die Berechnung von Mittelwerten werden übliche Formeln eingesetzt.The invention provides an extremely flexible method, with which with the connection of different traffic models an almost network-wide, comprehensive traffic information system is buildable, which data for different Provides informational purposes. It can be conventional and already known models and processes used and be combined. Forecasts can be curve-based forecasts at measuring points, model-based forecasts for sections and Meshes and additions of immeasurable effects using be artificial intelligence. For the calculation of mean values usual formulas are used.
Mit Vorteil wird mit der Erfindung vorgeschlagen, daß die übertragenen Daten in zwei Berechnungsverfahren unterschiedlicher Komplexität bearbeitet werden. Dabei ist vorgesehen, daß eines der wenigstens zwei Berechnungsverfahren ein einfaches Interpolationsverfahren geringer Komplexität ist. Die Eingangsdaten des Berechnungsverfahrens geringer Komplexität sind Fahrzeuggeschwindigkeit v und Verkehrsstärke q, Ausgangsdaten sind eine Reisegeschwindigkeit und Verkehrsdichte k. Weiterhin ist vorgesehen, daß das Berechnungsverfahren geringer Komplexität zusätzlich eine Staustörmeldung ausgibt. Ein wie beschriebenes Verfahren benötigt nur ein Minimum an Eingangsdaten und kann sehr schnell sehr verläßliche Aussagen über den Verkehrszustand im Bereich eines Meßquerschnittes treffen. Bei der Interpolation wird vereinfachend davon ausgegangen, daß sich alle Fahrzeuge gleich verhalten.Advantageously, the invention proposes that the transferred data in two different calculation methods Complexity. It is provided that one of the at least two calculation methods a simple interpolation procedure of low complexity is. The input data of the calculation process is lower Complexity is vehicle speed v and traffic volume q, output data are a cruising speed and Traffic density k. It is also provided that the calculation method low complexity an additional traffic jam message outputs. A procedure as described is required only a minimum of input data and can be very fast very reliable statements about the traffic conditions in the area of a measurement cross section. With interpolation it is assumed for simplicity that all vehicles behave the same.
Weiterhin wird mit Vorteil vorgeschlagen, daß das andere der wenigstens zwei Berechnungsverfahren ein auf der Datenanalyse auf der Basis eines Fundamentaldiagramms basierendes Verfahren hoher Komplexität ist. Ein Fundamentaldiagramm ist eine an sich bekannte, auf einen Meßquerschnitt bezogene Kurve. Die Darstellung ist die Kurve der Verkehrsstärke q über der Belegung k. Die Kurve entspricht in vereinfachter und stark geglätteter Form im wesentlichen einer unsymmetrischen Gaußverteilung und läßt Aussagen über kritische und unkritische Zustände zu. Die Erfindung schlägt vor, daß Eingangsdaten des Berechnungsverfahrens hoher Komplexität Fahrzeuggeschwindigkeit v, Verkehrsstärke q und Belegung b sind, Ausgangsdaten eine Reisezeit bezogen auf Reisegeschwindigkeit und Verkehrsdichte k sind. Weiterhin wird vorgeschlagen, daß das Berechnungsverfahren hoher Komplexität zusätzlich ein Verkehrssituationsstatussignal, wenigstens differenziert nach Frei/Kritisch/Stau ausgibt. Auch dieses zweite Verfahren benötigt nur ein Minimum an Eingangsdaten und kann sehr schnell sehr verläßliche Aussagen über den Verkehrszustand im Bereich eines Meßquerschnittes treffen.Furthermore, it is advantageously proposed that the other one of the at least two calculation methods is based on the data analysis based on a fundamental diagram Is a highly complex process. A fundamental diagram is a known, on a measurement cross section related curve. The representation is the curve of traffic volume q above the assignment k. The curve corresponds in simplified and highly smoothed form essentially one asymmetrical Gaussian distribution and leaves statements about critical and uncritical states too. The invention strikes before that input data of the calculation method of high complexity Vehicle speed v, traffic strength q and Allocation b are based on a travel time Cruising speed and traffic density are k. Farther it is proposed that the calculation method be of high complexity additionally a traffic situation status signal, at least differentiates according to free / critical / traffic jam. This second procedure also requires only a minimum of Input data and can very quickly make very reliable statements about the traffic condition in the area of a measurement cross-section to meet.
Die redundante Anwendung von wenigstens zwei Verfahren erhöht erheblich die Sicherheit und ermöglicht eine Überprüfung der Ergebnisse hinsichtlich ihrer Qualität.The redundant application of at least two methods increased significantly increases security and enables verification the results in terms of their quality.
Zur Analyse der Daten in Bezug auf größere Abschnitte des Verkehrsnetzes wird vorgeschlagen, daß die übertragenen Daten in wenigstens einem dritten, hochkomplexen Berechnungsverfahren für eine erweiterte Situationserkennung bearbeitet werden. Dabei finden Eingang die Ergebnisse der vorhergehenden Berechnungsverfahren. Dabei ist es von Vorteil, daß bei dem hochkomplexen Berechnungsverfahren Fuzzylogik eingesetzt wird.To analyze the data in relation to larger sections of the Traffic network is proposed that the data transmitted in at least a third, highly complex calculation method edited for advanced situation detection become. The results of the previous ones are included Calculation methods. It is an advantage that with the highly complex calculation method, fuzzy logic is used.
Zudem wird vorgeschlagen, daß in die Berechnungsverfahren Störstellenparameter wie Baustellen, Unfälle und dergleichen eingegeben werden. It is also proposed that in the calculation process Impairment parameters such as construction sites, accidents and the like can be entered.
Weitere Vorteile und Merkmale der Erfindung ergeben sich aus der folgenden Beschreibung einiger Beispiele.Further advantages and features of the invention result from the following description of some examples.
Dabei zeigen
Für die Verarbeitung der Daten in der Zentrale sind 3 Stufen
vorgesehen:
Die 3 Stufen unterscheiden sich in der Komplexität der eingesetzten Verfahren zur Auswertung der Verkehrsdaten und damit in der Qualität und Art der errechneten Verkehrskenngrößen.The 3 levels differ in the complexity of the used Process for evaluating traffic data and thus in the quality and type of the calculated traffic parameters.
Folgende Ergebnisse werden ermittelt:The following results are determined:
- streckenbezogene Reisegeschwindigkeitsklassenroute-related cruise speed classes
- Reisezeitbänder (durchschnittliche Reisezeit +- Toleranz)Travel time bands (average travel time + - tolerance)
- VerkehrsdichteklassenTraffic density classes
- streckenbezogene Reisegeschwindigkeitsklassen unter Einbeziehung von Fundamentaldiagrammenroute-related cruise speed classes with inclusion of fundamental diagrams
- Verkehrsstromaufteilung an Knoten mit verbesserter Aussage der VerkehrssituationTraffic flow distribution at nodes with improved information the traffic situation
- Stau am MeßquerschnittJam at the measuring cross section
- Unruhe im VerkehrsablaufUnrest in the traffic flow
- Verkehrslage, einfachTraffic situation, simple
- streckenbezogene Reisegeschwindigkeitsklassenroute-related cruise speed classes
- Verkehrsstromaufteilung an KnotenTraffic flow distribution at nodes
- detaillierte Situationserkennung für einzelne Streckenabschnittedetailed situation detection for individual sections of the route
In den einzelnen Stufen erfolgt eine Vorverarbeitung und Plausibilitätskontrolle der eingehenden Daten. Alle Ergebnisse beziehen sich auf Streckenabschnitte zwischen benachbarten Anschlußstellen oder Knotenpunkten (z.B. Bundesautobahn (BAB)-Abschnitte) und auf das jeweils aktuelle, in der Zentrale vorliegende Meßdaten-Intervall. Um Reisezeiten für ausgewählte Routen durch das Netz zu ermitteln, sind gleichzeitig die streckenbezogenen Reisegeschwindigkeiten unterschiedlicher Zeitintervalle entsprechend der Routenlänge und der Gesamtreisezeit erforderlich; diese müssen aus archivierten Ganglinien entnommen bzw. auf deren Basis prognostiziert werden. Routenbezogene Reisezeiten werden hier noch nicht berechnet, können jedoch bei Bedarf auf der Basis aller 3 Stufen ermittelt werden. Preprocessing and plausibility checks are carried out in the individual stages of the incoming data. Get all results on sections between adjacent junctions or junctions (e.g. Federal Motorway (BAB) sections) and the current, available at the headquarters Measured data interval. To travel times for selected Determining routes through the network are also the route-related travel speeds of different time intervals according to the route length and the total travel time required; these have to be from archived waterways withdrawn or forecast on the basis thereof. Route-related travel times are not yet calculated here, can, however, be determined on the basis of all 3 levels if necessary become.
Im folgenden wird das Datenpaket vom Aggregationsmodul beschrieben
:
Es werden die folgenden Parameter definiert :The following parameters are defined:
Parameter der lokalen Aggregationsmodule:
- fahrstreifenbezogene VerkehrsstärkeTraffic-related traffic intensity
- richtungsbezogene Verkehrsstärkedirectional traffic volume
- vv
- fahrstreifenbezogene mittlere GeschwindigkeitLane-related average speed
- VV
- richtungsbezogene mittlere Geschwindigkeitdirectional average speed
- bb
- fahrstreifenbezogener BelegungsgradDegree of occupancy related to the lane
- BB
- richtungsbezogener Belegungsgraddirectional occupancy rate
- kk
- fahrstreifenbezogene VerkehrsdichteTraffic density related to the lane
- KK
- richtungsbezogene Verkehrsdichte (Mittelwert) pro Spurdirectional traffic density (average) per track
- σv σ v
- fahrstreifenbez. Standardabweichung der Geschwindig.fahrstreifenbez. Standard deviation of the speed.
- Sv S v
- richtungsbezogene Standardabweichung der Geschwindig. directional standard deviation of speed.
- dxMQ-MQ dx MQ-MQ
- Abschnittslänge zwischen Meßquerschnitten (Berechnung, sowie Eingaben)Section length between measuring cross sections (Calculation and input)
- dxAS-AS dx AS-AS
- Abschnittslänge zwischen Anschlußstellen (Berechnung, sowie Eingaben)Section length between connection points (calculation, as well as inputs)
- ff
- Verkehrsbeziehungtraffic relationship
- li, mi, releft, mi, right
- Bezeichnung der SpurTrack name
- lokloco
- lokale Größelocal size
- mommom
- momentane, streckenbezogene Größecurrent, route-related size
- FzFz
- Fahrzeuge KfzVehicles motor vehicles
- Pkwcar
- Fahrzeuge mit Länge < L_Pkw_lkwVehicles with length <L_Pkw_lkw
- Lkwtruck
- Fahrzeuge mit Länge > L_Pkw_lkwVehicles with length> L_Pkw_lkw
- HH
- Hauptfahrbahnmain road
- AA
- Ausfahrtexit
- Ee
- Einfahrtentrance
- NN
- Nebenfahrbahnfrontage road
Ziel ist die Überprüfung und ggfs. Korrektur der von den Aggregationsmodulen kommenden Meßdaten. Es erfolgt die Umrechnung auf spurbezogene Werte. Hochrechnung von Richtungsgrößen aus fahrstreifenbezogenen Größen.The aim is to check and, if necessary, correct the aggregation modules upcoming measurement data. The conversion takes place to track-related values. Extrapolation of directional variables Lane-related sizes.
Input sind fahrstreifenbezogene Daten des Aggregationsmoduls in 1 min Intervallen.Input is lane-related data from the aggregation module in 1 min intervals.
Es erfolgt die Bestimmung der Anzahl der Pkw aus der gesicherten
Anzahl der Fahrzeuge
Mittlere lokale Geschwindigkeit:


Mittlere momentane Geschwindigkeit
Verkehrsdichte pro Fahrtrichtung
Belegung pro Fahrtrichtung

Standardabweichung pro Fahrtrichtung

Die Standardabweichung gibt die Schwankungsbreite der Geschwindigkeit wieder. The standard deviation gives the fluctuation range of the speed again.
Dann erfolgt die Hochrechnung von Einspurerfassung auf Querschnitt 3 Fahrstreifen.Then the extrapolation from single-track detection to cross-section takes place 3 lanes.
Fahrstreifenbezogene Verkehrsstärke in [Fz/min]


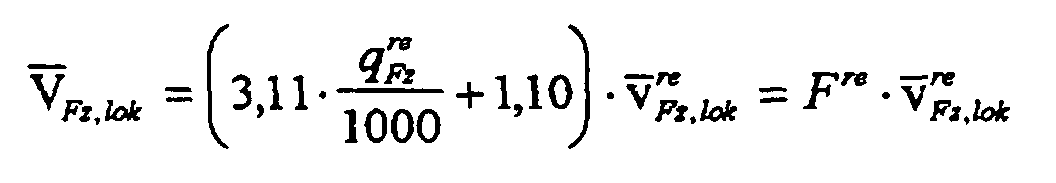
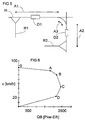
In Fig.1 sind die belegungsabhängigen Faktoren Fli für die linke Fahrspur, Fmi für die mittlere Fahrspur und Fre für die rechte Fahrspur in Abhängigkeit der Belegungen qli, qmi, qre graphisch dargestellt.In Figure 1, the occupancy-dependent factors F li for the left lane, F mi for the middle lane and F re for the right lane are shown graphically as a function of the assignments q li , q mi , q re .
Annahme der Normalverteilung der Geschwindigkeiten
Die Rückrechnung der fahrstreifenbezogenen Reisegeschwindigkeit aus der querschnittsbezogenen Reisegeschwindigkeit kann ebenfalls benutzt werden.The back calculation of the lane-related cruising speed from the cross-sectional cruising speed can also be used.
Ergebnisse sind:
Im folgenden werden die Berechnungsverfahren erläutert.The calculation methods are explained below.
-
Reisegeschwindigkeit im Streckenabschnitt:
- harmonisches Mittel der lokalen Geschwindigkeiten
Reisegeschwindigkeit in Knoten:
- Hauptfahrbahn wie Streckenabschnitt
- Rampen durch Vergleich der Randquerschnitte mit Logik und anschließende Zuordnung von Reduktionsfaktoren
Cruising speed in the section: - harmonic mean of local speeds cruising speed in knots:
- Main lane as section of the route
- Ramping by comparing the edge cross sections with logic and then assigning reduction factors
- Reisezeitband aus Geschwindigkeitsklasse und AbschnittslängeTravel time band from speed class and section length
-
Verkehrsdichte Streckenabschnitt:
- Verkehrsstärke stromauf durch Reisegeschwindigkeit (Abgleich mit lokalen Verkehrsdichten, Plausibilitätsgrenzen) Section of traffic density:
- Traffic volume upstream through cruising speed (comparison with local traffic densities, plausibility limits)
-
Verkehrsdichte in Knoten:
- Hauptfahrbahn: wie Streckenabschnitt, mit Reduktion entsprechend Rampen
- Rampen: Einteilung nach Logik mit Randquerschnitten
- Plausibilitätsgrenzen
- Main carriageway: as section of route, with a reduction according to ramps
- Ramps: Classification according to logic with edge cross sections
- plausibility limits
In Fig.2 ist dargestellt, wie mittels eines Detektors D der Abschnitt A einer Hauptfahrbahn H zwischen einer ersten Rampe R1 und einer zweiten Rampe R2 charakterisiert wird.FIG. 2 shows how the detector D uses Section A of a main carriageway H between a first ramp R1 and a second ramp R2 is characterized.
Die Reisegeschwindigkeit im Abschnitt wird in erster Näherung
aus der lokalen richtungsbezogenen mittleren Geschwindigkeit
der Fahrzeuge errechnet.
Die Standardabweichung der momentanen Geschwindigkeit wird gleich der Standardabweichung der lokalen Geschwindigkeit angenommen. The standard deviation of the current speed is equal to the standard deviation of the local speed.
Verkehrsstärke ist die richtungsbezogene Verkehrsstärke Q
Bestimmung der normierten Reisezeit (pro km) im Abschnitt
Das Reisezeitband gibt die Bandbreite der Reisezeit an, die
sich aus der Standardabweichung der Geschwindigkeit errechnet.
In Fig.3 ist dargestellt, wie ein Abschnitt A einer Hauptfahrbahn H zwischen einer ersten Rampe R1 und einer zweiten Rampe R2 mittels eines ersten Detektors D1 und eines zweiten Detektors D2 charakterisiert wird.In Figure 3 it is shown how a section A one Main roadway H between a first ramp R1 and one second ramp R2 by means of a first detector D1 and one second detector D2 is characterized.
Reisegeschwindigkeit im Abschnitt ist das arithmetische Mittel
aus den mittleren momentanen Geschwindigkeiten der m
Meßquerschnitte im Abschnitt.

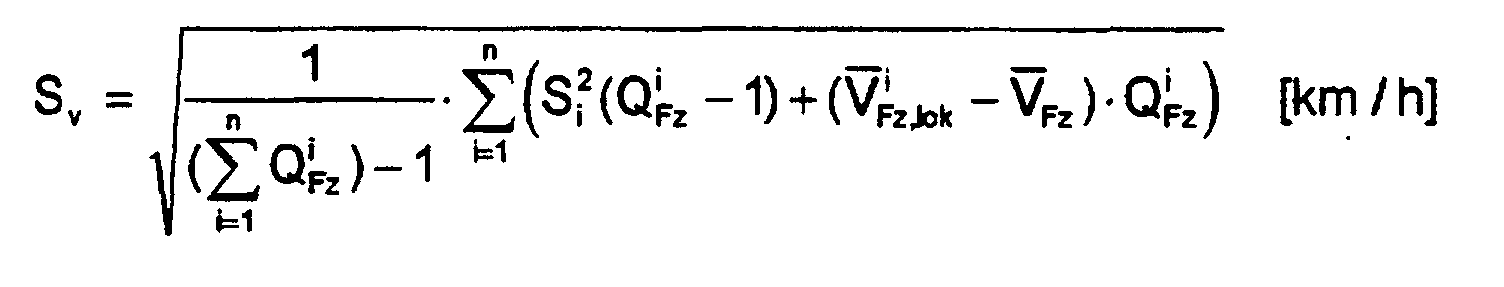
Die Standardabweichung ergibt sich aus den n Standardabweichungen
der zu berücksichtigenden Meßquerschnitte.
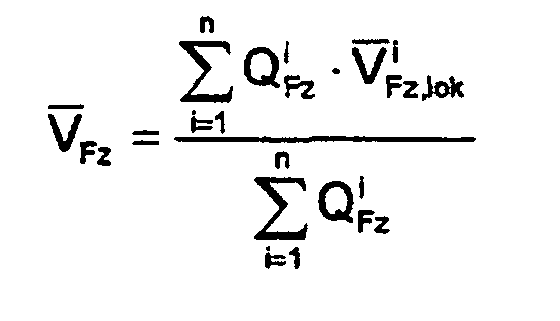
Verkehrsstärke im Abschnitt ist das arithmetische Mittel der
lokalen richtungsbezogenen Verkehrsstärken der m Meßquerschnitte
im Abschnitt

Bestimmung der normierten Reisezeit (pro km) im Abschnitt
Das Reisezeitband errechnet sich wie in Fall 1. The travel time band is calculated as in case 1.
In Fig.4 ist dargestellt, wie eine Hauptfahrbahn H in 3 Abschnitte A1, A2 und A3 zwischen verschiedenen Rampen R eingeteilt ist, wobei im ersten Abschnitt A1 ein erster Detektor D1 und im dritten Abschnitt A3 ein zweiter Detektor D2 vorgesehen ist.In Figure 4 it is shown how a main carriageway H in 3 sections A1, A2 and A3 divided between different ramps R. is, in the first section A1 a first detector D1 and in the third section A3 a second detector D2 is provided is.
Reisegeschwindigkeit im Abschnitt ist das arithmetische Mittel
aus den mittleren Geschwindigkeiten der benachbarten Abschnitte
Die Standardabweichung der Geschwindigkeit errechnet sich wie in Fall 1.The standard deviation of the speed is calculated as in case 1.
Verkehrsstärke im Abschnitt ist das arithmetische Mittel der
lokalen richtungsbezogenen Verkehrsstärken der m umliegenden
Meßquerschnitte

Bestimmung der normierten Reisezeit (pro km) im Abschnitt
Das Reisezeitband errechnet sich wie in Fall 1. The travel time band is calculated as in case 1.
In Fig.5 ist Fall 4 dargestellt, wobei zwei Detektoren D1 und D2 jeweils in den Abschnitten A1 und A2 angeordnet sind.5 shows case 4, with two detectors D1 and D2 are arranged in sections A1 and A2, respectively.
Fall 4 entspricht Fall 3 mit einem konstanten Abminderungsfaktor f für die Geschwindigkeit auf der Rampe f=f(Anz. FS, v_zul, Rampenart)Case 4 corresponds to Case 3 with a constant reduction factor f for the speed on the ramp f = f (number of FS, v_zul, ramp type)
- Ermittlung Bemessungsverkehrsstärke QB aus Q_Pkw, Q_Lkw, V_Pkw, V_LkwDetermination of the rated traffic volume QB from Q_Pkw, Q_Lkw, V_Pkw, V_Lkw
- Stau am Meßquerschnitt: BABSY-Modul mit Grenzgeschwindigkeit und Berücksichtigung von V_Pkw, V_LkwJam at the measuring cross-section: BABSY module with limit speed and taking into account V_Pkw, V_Lkw
- Unruhe im Streckenabschnitt: BABSY-Modul mit SV_linksUnrest in the route section: BABSY module with SV_links
-
Grobe Schätzung der Aufteilungsverhältnisse am Knoten mit
Furness
Korrektur der Werte aus Stufe 1 LogikRough estimate of the division ratios at the node with Furness
Correction of the values from level 1 logic
Richtungsbezogene Verkehrsdaten: QFz,VFz,KFz,Sv Directional traffic data: Q Fz , V Fz , K Fz , S v
Die Glättungsparameter sind einstellbar.
Berechnung der Bemessungsverkehrsstärke für den Querschnitt.
Die Prognoseverkehrsstärken für Pkw und Lkw werden mit Hilfe
eines Äquivalenzfaktors fL in eine Pkw-Einheiten-Verkehrsstärke
QB umgerechnet, die als Bemessungsverkehrsstärke
herangezogen wird. Es gilt:
Die Parameter k1 und k2 sind justierbar. Erstversorgung:
Der Fall 1 bezieht sich auf die in Fig. 3 dargestellte Situation.Case 1 relates to the situation shown in FIG. 3.
Bestimmung von QB für jeden MQ
arithmetisches Mittel der Werte von QB im AbschnittDetermination of QB for each MQ
arithmetic mean of the values of QB in the section
Der Fall 2 bezieht sich auf die in Fig. 4 dargestellte Situation.
arithmetisches Mittel der QB der benachbarten MQCase 2 relates to the situation shown in FIG. 4.
arithmetic mean of the QB of the neighboring MQ
Stau an einem Meßquerschnitt wird erkannt, wenn die Prognosegeschwindigkeit
auf der Hauptfahrbahn:
d.h.:
ie:
Für die Aufhebung der Staumeldung gilt:
Unruhe an einem MQ wird erkannt, wenn für den linken Fahrstreifen
gilt:
Die Grenzwerte Sgrenz , Qgrenz und Qprog,grenz sind justierbar.
Voreingestellt:
Schätzung der Aufteilungsverhältnisse am Knoten mit einem Verfahren nach FURNESSEstimation of the distribution ratios at the node with a FURNESS procedure
Das Modul führt eine iterative Berechnung der Matrixelemente auf Grund der Vorgabe einer Vorgewichtung und der Matrixzeilen- und -spaltensummen durch. FURNESS (1965)The module performs an iterative calculation of the matrix elements based on the pre-weighting and the matrix line and column totals. FURNESS (1965)
Vereinfachung der allgemeinen Entropieformel für Knotenpunkte
(keine Vorgaben von Strecken)
Iterative Berechnung der Ausgleichsfaktoren Xk und Xl nach
einer beliebigen Initialisierung eines dieser Faktoren


Input:


Da nicht alle Zufahrt- und Abfahrtbelastungen über Detektoren erfaßt werden können, ist es erforderlich, daß fehlende Querschnittszählungen für das Schätzverfahren aus historischen Daten bestimmt werden. Hierfür kann an Stelle der nicht erfaßten MQs ein fiktiver MQ treten, dessen Meßwert aus Standardganglinien oder aus vorhandenen Meßwerten und Aufteilungsraten bestimmt wird.Since not all access and departure loads are via detectors can be recorded, it is necessary that missing cross-sectional counts for the estimation method from historical Data are determined. For this, instead of the not recorded MQs enter a fictitious MQ, the measured value of which is from standard curve or from existing measured values and distribution rates is determined.
Nutzung von Standardganglinien für die fiktiven Meßquerschnitte. Die Standardganglinien müssen vorgehalten werden. In Abhängigkeit von der Uhrzeit ist der zugehörige Wert zu entnehmen.Use of standard curve lines for the fictitious measuring cross-sections. The standard gait lines must be kept. Depending on the time, the associated value is too remove.
Vorgabe von Q z.B. aus Meßquerschnitt auf der Hauptfahrbahn
und Bestimmung von Q in der nachfolgenden Ausfahrt durch konstanten
oder wenn vorhandenen zeitabhängigen Faktor fA.
Reisegeschwindigkeit aus Standardfundamentaldiagrammen mit Streckeneinteilung entsprechend der Stolz-Mäcke-Systematik. Ermittlung der Geschwindigkeit im Abschnitt aus dem FDG unter Verwendung der Bemessungsverkehrsstärke QB [Pkw-E] und der Belegungszeit.Cruising speed from standard foundation diagrams with Routing according to the Stolz-Mäcke system. Determination of the speed in the section from the FDG under Use of the rated traffic volume QB [Pkw-E] and the Occupancy time.
In Abhängigkeit vom Streckentyp der Meßstelle oder des Abschnitts werden die standardisierten Parameter des Fundamentaldiagramms sowie die frei parametrierbaren Schwellwerte für die Belegungszeit aus einer Liste (Datei) gelesen.Depending on the route type of the measuring point or section become the standardized parameters of the fundamental diagram as well as the freely parameterizable threshold values for the occupancy time read from a list (file).
Das FDG (Geschwindigkeit-Verkehrsstärke-Diagramm) wird über 5 Stützstellen (q; v) beschrieben
- 0:
- (0; v0)
- A:
- (qA; vA)
- B:
- (qB; vB)
- C:
- (qC; vC)
- D:
- (qB; 0,5vC)
- 0:
- (0; v0)
- A:
- (q A ; v A )
- B:
- (q B ; v B )
- C:
- (q C ; v C )
- D:
- (q B ; 0.5v C )
In Fig.6 ist das FDG dargestellt.The FDG is shown in FIG.
Die Eckdaten der einzelnen Fundamentaldiagramme sind im Anhang aufgeführt. Das Bezugsintervall ist 1 Minute.The key data of the individual fundamental diagrams are in the appendix listed. The reference interval is 1 minute.
In Fig.7 ist das Vorgehen in einem Struktogramm dargestellt. The procedure is shown in a structure diagram in FIG.
Die Standardabweichung der Geschwindigkeit und somit das Reisezeitband ergeben sich entsprechend Kapitel 6.The standard deviation of the speed and thus the travel time band result in accordance with Chapter 6.
- Berechnung der Profile von Verkehrsdichte und Streckengeschwindigkeit mit ESE auf durchgehenden Streckenabschnitten, Zu- und Abflüsse innerhalb der Abschnitte werden fest versorgt (zukünftig auch als Ganglinie vorgebbar)Calculation of traffic density and route speed profiles with ESE on continuous sections of the route, inflows and outflows within the sections will be permanently supplied (in future also can be specified as a curve)
- Ermittlung der Verkehrssituationen, inklusive Störfall in StreckenabschnittenDetermination of traffic situations, including accidents in road sections
Schätzung der Aufteilungsverhältnisse am Knoten wie in Stufe 2.Estimation of the distribution ratios at the node as in stage 2.
Verkehrsabbildung mit ESE (Erweiterte Situationserkennung): Mit dem Verkehrsmodell ESE werden Profile der Verkehrsstärke, Geschwindigkeit und Verkehrsdichte für einzelne Segmente eines Abschnitts erzeugt. Darüberhinaus werden Aussagen über die Verkehrssituation im Abschnitt gemacht.Traffic mapping with ESE (Extended Situation Detection): With the traffic model ESE, profiles of traffic volume, Speed and traffic density for individual segments of one Section generated. In addition, statements about made the traffic situation in the section.
Ein Abschnitt in ESE bezieht sich auf Grund des Modellansatzes immer auf die Strecke zwischen zwei Meßquerschnitten. Der Abschnitt, der im Feldversuch (Visualisierung) verwendet wird, ist begrenzt durch Knotenpunkte oder Anschlußstellen. Zur Visualisierung müssen die ESE-Abschnitte bzw. Segmente den Visualisierungsabschnitten zugeordnet werden.A section in ESE relates to the model approach always on the distance between two measuring cross-sections. The Section used in the field test (visualization) is limited by nodes or junctions. For visualization the ESE sections or segments must match the visualization sections be assigned.
In Fig.8 ist eine Bundesautobahn BAB dargestellt, die in 3
Abschnitte A1, A2 und A3 mit jeweils einem Detektor D1, D2
und D3 eingeteilt ist. Für die ESE ist ein ESE-Abschnitt ESE
A1 zwischen dem ersten Detektor D1 und dem zweiten Detektor
D2 in 3 Segmente S1 m, S2 m S3 m und entsprechend dem ESE-Abschnitt
ESE-A2 zwischen dem zweiten Detektor D2 und dem
dritten Detektor D3 in drei Segmente S1 n, S2 n und S3 n eingeteilt.

Die Standardabweichung der Geschwindigkeit und somit das Reisezeitband ergeben sich entsprechend Kapitel 6.The standard deviation of the speed and thus the travel time band result in accordance with Chapter 6.
Die Verkehrssituation wird für den ESE-Abschnitt ermittelt. Zur Anpassung an den BAB-Abschnitt wird für die einzelnen Situationen jeweils eine entsprechende Logik vorgeschlagen. Die Situation wird im nächsten Intervall auf Null gesetzt und mit den neu berechneten ESE-Situationen neu bestimmt.The traffic situation is determined for the ESE section. To adapt to the BAB section is for the individual situations a corresponding logic is proposed. The Situation is set to zero in the next interval and with the newly calculated ESE situations.
In Fig.9 ist die Anpassung der BAB-Abschnitte Am-1, Am und Am+1 und der ESE-Abschnitte ESE-An-2, ESE An-1, ESE An, ESE An+1 dargestellt.In Figure 9 is the adaptation of the BAB sections Am-1, Am and Am + 1 and the ESE sections ESE-An-2, ESE An-1, ESE An, ESE Shown at +1.
Als verkehrstechnischer Engpaß ist eine Situation definiert,
bei der sich die Anzahl der verfügbaren Fahrstreifen durch
ein verkehrstechnisches Ereignis, z.B. einen Unfall oder ein
liegengebliebenes Fahrzeug, reduziert, und sich infolgedessen
Unstetigkeiten im Verkehrsfluß ergeben.
Hierbei handelt es sich um eine Situation, bei der die Anzahl der Fahrstreifen durch bauliche Einschränkungen reduziert ist (z.B. Spursubtraktion). Da ein baulicher Engpaß an einer definierten Stelle eingerichtet wird, kann hier eine eindeutige Zuordnung zu einem BAB-Abschnitt gemacht werden.This is a situation where the number the lane is reduced due to structural restrictions (e.g. track subtraction). Because of a structural bottleneck on a defined Position is set up, a clear one can be found here Assignment to a BAB section can be made.
Hierbei handelt es sich um die bereichsweise Verdichtung in
einem Abschnitt.
Es handelt sich dabei um Stauungen, die vom stromabwärts liegenden
Abschnitt in den betrachteten Abschnitt einwandern. Im
betrachteten Abschnitt sind daher nur die Wirkungen zu erkennen,
die Störungsursache liegt in einem stromabwärts liegenden
Abschnitt.
Ein Abschnitt ist dann zugestaut, wenn die Verkehrsdichte im
gesamten Abschnitt eine definierte Größe überschreitet und
die Geschwindigkeit an den beiden Abschnittsgrenzen eine definierte
Größe unterschreitet.
Dieser bezeichnet Situationen mit Unruhe im Verkehrsablauf.
Eingabe von Baustellen und/oder Straßenarbeiten mit Einfluß auf die Anzahl der Fahrstreifen und den Verkehrsablauf.Entry of construction sites and / or road works with influence on the number of lanes and the traffic flow.
Einteilung in 4 Klassen (Vgrenz: 20-60-90)Division into 4 classes (limit: 20-60-90)
Einteilung in 4 Klassen (Kgrenz: 30-60-90) für die VisualisierungDivision into 4 classes (limit: 30-60-90) for visualization
BABSY und ESE MeldungenBABSY and ESE reports
Im Meßwertarchiv werden die Rohdaten der Detektoren und die Daten der Parametrierung der Detektoren und des Aggregationsmoduls sowie der Zentrale gespeichert. Die Rohdaten der Detektoren werden pro Detektor und Tag in eine Datei geschrieben. Die Parametrierungsdaten sind für jede Änderung und für jeden Detektor bzw. Aggregierungsmodul mit dem Datum der Änderung zu speichern.The raw data of the detectors and the Data of the parameterization of the detectors and the aggregation module as well as the headquarters. The raw data of the detectors are written to a file per detector and day. The parameterization data are for each change and for each detector or aggregation module with the date of the change save.
Eine off-line Auswertung greift auf die Rohdaten der Detektoren, auf die Ergebnisse der drei Stufenmodelle und auf die Parametrierungsdaten zurück.An off-line evaluation accesses the raw data from the detectors, on the results of the three tier models and on the Parameterization data back.
Die beschriebenen Bespiele dienen der Erläuterung und sind nicht beschränkend.The examples described are for explanation and are not restrictive.
Claims (22)
- Method of acquiring traffic information items related to stretches of road, in particular motorways, wherein local detection cross sections are formed by means of stationary detectors, traffic-related measured values are determined, preprocessed by means of local computers and normalized to a specified data protocol, aggregated and transmitted by wireless communication to a higher-order data processing system, characterized in that the transmitted data are processed in at least two redundant, mutually different and independent calculation methods for ascertaining route-related traffic information items.
- Method according to Claim 1, characterized in that the transmitted data are preprocessed to create a standardized base data record.
- Method according to either of the preceding claims, characterized in that the transmitted data are processed in two calculation methods of different complexity.
- Method according to any one of the preceding claims, characterized in that, to preprocess the data, their plausibility is checked.
- Method according to any one of the preceding claims, characterized in that one of the at least two calculation methods is a simple interpolation method of low complexity.
- Method according to Claim 5, characterized in that input data of the calculation method of low complexity are vehicle speed v and traffic level q, and output data are traffic speed and traffic density k.
- Method according to Claim 6, characterized in that the calculation method of low complexity additionally issues a traffic-jam obstruction message.
- Method according to any one of the preceding claims, characterized in that one of the at least two calculation methods is a method of high complexity founded on data analysis on the basis of a fundamental diagram.
- Method according to Claim 8, characterized in that input data of the calculation method of high complexity are vehicle speed v, traffic level q and occupancy b, and output data are a travel time related to traffic speed and traffic density k.
- Method according to Claim 9, characterized in that the calculation method of high complexity additionally issues a traffic situation status signal that at least differentiates on the basis of free/critical/traffic jam.
- Method according to any one of the preceding claims, characterized in that the transmitted data are processed in at least a third, highly complex calculation method for an expanded situation detection.
- Method according to Claim 11, characterized in that fuzzy logic is used in the highly complex calculation method.
- Method according to any one of the preceding claims, characterized in that obstruction point parameters, such as roadworks, accidents and the like are inputted into the calculation methods.
- Method according to any one of the preceding claims, characterized in that vehicle speed, traffic level and occupancy are determined as measured values.
- Method according to any one of the preceding claims, characterized in that the measured values per traffic lane are determined.
- Method according to any one of the preceding claims, characterized in that vehicle type differentiation values are determined as measured values.
- Method according to any one of the preceding claims, characterized in that, in the higher-level data processing system, traffic information items per stretch are calculated by combining the transmitted data of adjacent determination cross sections.
- Method according to any one of the preceding claims, characterized in that the route search data are evaluated.
- Method according to any one of the preceding claims, characterized in that the data are evaluated for the purpose of issuing traffic guidance information items.
- Method according to any one of the preceding claims, characterized in that the data are evaluated for the purpose of delivering traffic development forecasts.
- Method according to any one of the preceding claims, characterized in that the data are evaluated for the purpose of issuing travel time information items.
- Method according to any one of the preceding claims, characterized in that the data are evaluated for the purpose of issuing traffic-jam information items.
Applications Claiming Priority (2)
| Application Number | Priority Date | Filing Date | Title |
|---|---|---|---|
| DE19739918 | 1997-09-11 | ||
| DE19739918 | 1997-09-11 |
Publications (3)
| Publication Number | Publication Date |
|---|---|
| EP0902405A2 EP0902405A2 (en) | 1999-03-17 |
| EP0902405A3 EP0902405A3 (en) | 2000-08-23 |
| EP0902405B1 true EP0902405B1 (en) | 2004-05-12 |
Family
ID=7842002
Family Applications (1)
| Application Number | Title | Priority Date | Filing Date |
|---|---|---|---|
| EP98117164A Revoked EP0902405B1 (en) | 1997-09-11 | 1998-09-10 | Method for determining traffic information |
Country Status (6)
| Country | Link |
|---|---|
| EP (1) | EP0902405B1 (en) |
| AT (1) | ATE266888T1 (en) |
| DE (1) | DE59811367D1 (en) |
| DK (1) | DK0902405T3 (en) |
| ES (1) | ES2221105T3 (en) |
| PT (1) | PT902405E (en) |
Families Citing this family (8)
| Publication number | Priority date | Publication date | Assignee | Title |
|---|---|---|---|---|
| DE19928082C2 (en) * | 1999-06-11 | 2001-11-29 | Ddg Ges Fuer Verkehrsdaten Mbh | Filtering method for determining travel speeds and times and remaining domain speeds |
| DE19935770A1 (en) * | 1999-07-23 | 2001-02-01 | Ddg Ges Fuer Verkehrsdaten Mbh | Feedback cascade |
| DE19935769C2 (en) * | 1999-07-23 | 2002-02-07 | Ddg Ges Fuer Verkehrsdaten Mbh | Traffic condition forecast through feedback cascade |
| DE10036364C2 (en) * | 2000-07-18 | 2003-08-28 | Ddg Ges Fuer Verkehrsdaten Mbh | Process for creating forecast traffic data for traffic information |
| DE10036789A1 (en) | 2000-07-28 | 2002-02-07 | Daimler Chrysler Ag | Method for determining the traffic condition in a traffic network with effective bottlenecks |
| EP1480184A3 (en) * | 2003-05-19 | 2006-06-07 | TransVer GmbH | Method for detecting road traffic characteristics at access points |
| US8838370B2 (en) | 2009-03-09 | 2014-09-16 | Empire Technology Development Llc | Traffic flow model to provide traffic flow information |
| CN105118289A (en) * | 2015-06-17 | 2015-12-02 | 河南理工大学 | Traffic situation assessment method |
Family Cites Families (2)
| Publication number | Priority date | Publication date | Assignee | Title |
|---|---|---|---|---|
| US5610821A (en) * | 1994-11-18 | 1997-03-11 | Ibm Corporation | Optimal and stable route planning system |
| ES2135134T3 (en) * | 1995-04-28 | 1999-10-16 | Inform Inst Operations Res & M | PROCEDURE FOR THE DETECTION OF DISTURBANCES IN ROLLED TRAFFIC. |
-
1998
- 1998-09-10 DK DK98117164T patent/DK0902405T3/en active
- 1998-09-10 AT AT98117164T patent/ATE266888T1/en not_active IP Right Cessation
- 1998-09-10 EP EP98117164A patent/EP0902405B1/en not_active Revoked
- 1998-09-10 PT PT98117164T patent/PT902405E/en unknown
- 1998-09-10 DE DE59811367T patent/DE59811367D1/en not_active Expired - Fee Related
- 1998-09-10 ES ES98117164T patent/ES2221105T3/en not_active Expired - Lifetime
Also Published As
| Publication number | Publication date |
|---|---|
| DK0902405T3 (en) | 2004-09-13 |
| EP0902405A3 (en) | 2000-08-23 |
| ATE266888T1 (en) | 2004-05-15 |
| DE59811367D1 (en) | 2004-06-17 |
| EP0902405A2 (en) | 1999-03-17 |
| PT902405E (en) | 2004-10-29 |
| ES2221105T3 (en) | 2004-12-16 |
Similar Documents
| Publication | Publication Date | Title |
|---|---|---|
| EP0750774B1 (en) | Method of detecting traffic and traffic situations on roads, preferably motorways | |
| DE19904909C2 (en) | Method and device for providing traffic information | |
| EP0798684B1 (en) | Method and system to obtain the traffic situation through fixed data-acquisition device | |
| EP0879460A1 (en) | Process and device for obtaining traffic situation data | |
| EP0740280A2 (en) | Disturbance detection method for road traffic | |
| EP1154389A1 (en) | Method to determine the traffic situation in a road network | |
| EP0960411B1 (en) | Method for determining traffic data and traffic information exchange | |
| EP0902405B1 (en) | Method for determining traffic information | |
| EP2280383A1 (en) | Method for determining traffic information for a section of a road network and traffic calculator to implement the method | |
| EP2447924B1 (en) | System for detecting the traffic situation on a stretch of road | |
| DE69631629T2 (en) | Registration and prediction of traffic obstructions | |
| EP0978811A2 (en) | Method and device to obtain travel times of vehicles | |
| EP1758065B1 (en) | Method for forecasting a traffic condition in a road network and traffic management centre | |
| DE10051777A1 (en) | Method for producing a dynamic forecast of traffic conditions for a road system around individual vehicles allows each vehicle to make an autonomic, continuous time-cum-location record for a parameter of traffic conditions | |
| EP0886845A1 (en) | Fuzzy logic-assisted traffic-responsive control system for traffic light systems | |
| EP0902404B1 (en) | Method for determining traffic information | |
| EP4186775B1 (en) | Method and device for detecting the properties of a vehicle | |
| EP1057156B1 (en) | Detection of traffic situation with fuzzy classification, multi-dimensional morphological filtration of data and dynamic construction of domains | |
| EP1528524B1 (en) | Method for traffic prognosis based on historical data | |
| EP0908861A2 (en) | Method for transmitting traffic information | |
| DE19737440A1 (en) | Method for determining traffic data and traffic information center | |
| AT502459A1 (en) | METHOD FOR DETERMINING TRANSPORT CONDITION | |
| EP0902403B1 (en) | Method for detecting traffic information | |
| EP1457944B1 (en) | Process for supplying traffic information | |
| DE19905284A1 (en) | Traffic situation detection with fuzzy classification and multidimensional morphological data filtering and dynamic domain formation |
Legal Events
| Date | Code | Title | Description |
|---|---|---|---|
| PUAI | Public reference made under article 153(3) epc to a published international application that has entered the european phase |
Free format text: ORIGINAL CODE: 0009012 |
|
| AK | Designated contracting states |
Kind code of ref document: A2 Designated state(s): AT BE CH CY DE DK ES FI FR GB GR IE IT LI LU MC NL PT SE |
|
| AX | Request for extension of the european patent |
Free format text: AL;LT;LV;MK;RO;SI |
|
| PUAL | Search report despatched |
Free format text: ORIGINAL CODE: 0009013 |
|
| AK | Designated contracting states |
Kind code of ref document: A3 Designated state(s): AT BE CH CY DE DK ES FI FR GB GR IE IT LI LU MC NL PT SE |
|
| AX | Request for extension of the european patent |
Free format text: AL;LT;LV;MK;RO;SI |
|
| 17P | Request for examination filed |
Effective date: 20010219 |
|
| AKX | Designation fees paid |
Free format text: AT BE CH CY DE DK ES FI FR GB GR IE IT LI LU MC NL PT SE |
|
| GRAP | Despatch of communication of intention to grant a patent |
Free format text: ORIGINAL CODE: EPIDOSNIGR1 |
|
| RTI1 | Title (correction) |
Free format text: METHOD FOR DETERMINING TRAFFIC INFORMATION |
|
| GRAS | Grant fee paid |
Free format text: ORIGINAL CODE: EPIDOSNIGR3 |
|
| GRAA | (expected) grant |
Free format text: ORIGINAL CODE: 0009210 |
|
| AK | Designated contracting states |
Kind code of ref document: B1 Designated state(s): AT BE CH CY DE DK ES FI FR GB GR IE IT LI LU MC NL PT SE |
|
| PG25 | Lapsed in a contracting state [announced via postgrant information from national office to epo] |
Ref country code: LI Free format text: LAPSE BECAUSE OF NON-PAYMENT OF DUE FEES Effective date: 20040512 Ref country code: CH Free format text: LAPSE BECAUSE OF NON-PAYMENT OF DUE FEES Effective date: 20040512 |
|
| REG | Reference to a national code |
Ref country code: GB Ref legal event code: FG4D Free format text: NOT ENGLISH |
|
| REG | Reference to a national code |
Ref country code: CH Ref legal event code: EP |
|
| REG | Reference to a national code |
Ref country code: CH Ref legal event code: NV Representative=s name: SIEMENS SCHWEIZ AG |
|
| REG | Reference to a national code |
Ref country code: IE Ref legal event code: FG4D Free format text: GERMAN |
|
| REF | Corresponds to: |
Ref document number: 59811367 Country of ref document: DE Date of ref document: 20040617 Kind code of ref document: P |
|
| GBT | Gb: translation of ep patent filed (gb section 77(6)(a)/1977) |
Effective date: 20040621 |
|
| REG | Reference to a national code |
Ref country code: GR Ref legal event code: EP Ref document number: 20040401929 Country of ref document: GR |
|
| PGFP | Annual fee paid to national office [announced via postgrant information from national office to epo] |
Ref country code: FI Payment date: 20040805 Year of fee payment: 7 |
|
| PGFP | Annual fee paid to national office [announced via postgrant information from national office to epo] |
Ref country code: IE Payment date: 20040810 Year of fee payment: 7 |
|
| REG | Reference to a national code |
Ref country code: SE Ref legal event code: TRGR |
|
| PGFP | Annual fee paid to national office [announced via postgrant information from national office to epo] |
Ref country code: PT Payment date: 20040813 Year of fee payment: 7 |
|
| PGFP | Annual fee paid to national office [announced via postgrant information from national office to epo] |
Ref country code: MC Payment date: 20040818 Year of fee payment: 7 |
|
| PGFP | Annual fee paid to national office [announced via postgrant information from national office to epo] |
Ref country code: GR Payment date: 20040826 Year of fee payment: 7 |
|
| PGFP | Annual fee paid to national office [announced via postgrant information from national office to epo] |
Ref country code: CY Payment date: 20040827 Year of fee payment: 7 |
|
| PGFP | Annual fee paid to national office [announced via postgrant information from national office to epo] |
Ref country code: AT Payment date: 20040831 Year of fee payment: 7 |
|
| PGFP | Annual fee paid to national office [announced via postgrant information from national office to epo] |
Ref country code: NL Payment date: 20040906 Year of fee payment: 7 |
|
| PGFP | Annual fee paid to national office [announced via postgrant information from national office to epo] |
Ref country code: SE Payment date: 20040907 Year of fee payment: 7 Ref country code: GB Payment date: 20040907 Year of fee payment: 7 |
|
| PGFP | Annual fee paid to national office [announced via postgrant information from national office to epo] |
Ref country code: DK Payment date: 20040909 Year of fee payment: 7 |
|
| PGFP | Annual fee paid to national office [announced via postgrant information from national office to epo] |
Ref country code: LU Payment date: 20040910 Year of fee payment: 7 |
|
| PGFP | Annual fee paid to national office [announced via postgrant information from national office to epo] |
Ref country code: BE Payment date: 20040913 Year of fee payment: 7 |
|
| REG | Reference to a national code |
Ref country code: DK Ref legal event code: T3 |
|
| PGFP | Annual fee paid to national office [announced via postgrant information from national office to epo] |
Ref country code: ES Payment date: 20040915 Year of fee payment: 7 |
|
| PGFP | Annual fee paid to national office [announced via postgrant information from national office to epo] |
Ref country code: FR Payment date: 20040921 Year of fee payment: 7 |
|
| REG | Reference to a national code |
Ref country code: PT Ref legal event code: SC4A Free format text: AVAILABILITY OF NATIONAL TRANSLATION Effective date: 20040812 |
|
| PGFP | Annual fee paid to national office [announced via postgrant information from national office to epo] |
Ref country code: DE Payment date: 20041118 Year of fee payment: 7 |
|
| PGFP | Annual fee paid to national office [announced via postgrant information from national office to epo] |
Ref country code: CH Payment date: 20041208 Year of fee payment: 7 |
|
| REG | Reference to a national code |
Ref country code: ES Ref legal event code: FG2A Ref document number: 2221105 Country of ref document: ES Kind code of ref document: T3 |
|
| ET | Fr: translation filed | ||
| PLAQ | Examination of admissibility of opposition: information related to despatch of communication + time limit deleted |
Free format text: ORIGINAL CODE: EPIDOSDOPE2 |
|
| PLBI | Opposition filed |
Free format text: ORIGINAL CODE: 0009260 |
|
| PLBQ | Unpublished change to opponent data |
Free format text: ORIGINAL CODE: EPIDOS OPPO |
|
| PLAQ | Examination of admissibility of opposition: information related to despatch of communication + time limit deleted |
Free format text: ORIGINAL CODE: EPIDOSDOPE2 |
|
| PLAR | Examination of admissibility of opposition: information related to receipt of reply deleted |
Free format text: ORIGINAL CODE: EPIDOSDOPE4 |
|
| PLBQ | Unpublished change to opponent data |
Free format text: ORIGINAL CODE: EPIDOS OPPO |
|
| PLAB | Opposition data, opponent's data or that of the opponent's representative modified |
Free format text: ORIGINAL CODE: 0009299OPPO |
|
| PLAX | Notice of opposition and request to file observation + time limit sent |
Free format text: ORIGINAL CODE: EPIDOSNOBS2 |
|
| 26 | Opposition filed |
Opponent name: DAMBACH-WERKE GMBH Effective date: 20050211 Opponent name: DEUTSCHE TELEKOM AG Effective date: 20050208 |
|
| R26 | Opposition filed (corrected) |
Opponent name: DAMBACH-WERKE GMBH Effective date: 20050211 Opponent name: DEUTSCHE TELEKOM AG Effective date: 20050208 |
|
| NLR1 | Nl: opposition has been filed with the epo |
Opponent name: DAMBACH-WERKE GMBH Opponent name: DEUTSCHE TELEKOM AG |
|
| PG25 | Lapsed in a contracting state [announced via postgrant information from national office to epo] |
Ref country code: IT Free format text: LAPSE BECAUSE OF NON-PAYMENT OF DUE FEES Effective date: 20050910 Ref country code: GB Free format text: LAPSE BECAUSE OF NON-PAYMENT OF DUE FEES Effective date: 20050910 Ref country code: FI Free format text: LAPSE BECAUSE OF NON-PAYMENT OF DUE FEES Effective date: 20050910 Ref country code: AT Free format text: LAPSE BECAUSE OF NON-PAYMENT OF DUE FEES Effective date: 20050910 |
|
| PG25 | Lapsed in a contracting state [announced via postgrant information from national office to epo] |
Ref country code: SE Free format text: LAPSE BECAUSE OF NON-PAYMENT OF DUE FEES Effective date: 20050911 |
|
| PG25 | Lapsed in a contracting state [announced via postgrant information from national office to epo] |
Ref country code: IE Free format text: LAPSE BECAUSE OF NON-PAYMENT OF DUE FEES Effective date: 20050912 |
|
| PG25 | Lapsed in a contracting state [announced via postgrant information from national office to epo] |
Ref country code: MC Free format text: LAPSE BECAUSE OF NON-PAYMENT OF DUE FEES Effective date: 20050930 Ref country code: DK Free format text: LAPSE BECAUSE OF NON-PAYMENT OF DUE FEES Effective date: 20050930 Ref country code: BE Free format text: LAPSE BECAUSE OF NON-PAYMENT OF DUE FEES Effective date: 20050930 |
|
| RDAF | Communication despatched that patent is revoked |
Free format text: ORIGINAL CODE: EPIDOSNREV1 |
|
| PG25 | Lapsed in a contracting state [announced via postgrant information from national office to epo] |
Ref country code: PT Free format text: LAPSE BECAUSE OF NON-PAYMENT OF DUE FEES Effective date: 20060310 |
|
| REG | Reference to a national code |
Ref country code: DK Ref legal event code: EBP |
|
| REG | Reference to a national code |
Ref country code: CH Ref legal event code: PL |
|
| EUG | Se: european patent has lapsed | ||
| GBPC | Gb: european patent ceased through non-payment of renewal fee |
Effective date: 20050910 |
|
| REG | Reference to a national code |
Ref country code: PT Ref legal event code: MM4A Effective date: 20060310 |
|
| NLV4 | Nl: lapsed or anulled due to non-payment of the annual fee |
Effective date: 20060401 |
|
| RDAG | Patent revoked |
Free format text: ORIGINAL CODE: 0009271 |
|
| STAA | Information on the status of an ep patent application or granted ep patent |
Free format text: STATUS: PATENT REVOKED |
|
| REG | Reference to a national code |
Ref country code: IE Ref legal event code: MM4A |
|
| 27W | Patent revoked |
Effective date: 20060309 |
|
| REG | Reference to a national code |
Ref country code: FR Ref legal event code: ST Effective date: 20060531 |
|
| REG | Reference to a national code |
Ref country code: PT Ref legal event code: MP4A Effective date: 20060718 |
|
| BERE | Be: lapsed |
Owner name: *SIEMENS A.G. Effective date: 20050930 |